Embed Size (px)
Citation preview

Data Digest 2005-06
Consumer & Family Sciences

Data Digest 2005-06
Consumer & Family Sciences
Executive Summary
Deans
Dennis A. Savaiano, DeanShelley MacDermid, Associate Dean
Homepage URL Addresswww.cfs.purdue.edu
Academic DepartmentChild Development & Family StudiesConsumer Sciences & Retailing Foods & Nutrition Hospitality & Tourism Management
EmployeesTenure/TT Faculty 57Non-TT, Lecturers, Post Doc 18Administrative Staff 17Professional Staff 54Clerical Staff 44Service Staff 88Graduate Student Staff 132Adjunct Faculty 20Total 430
Annual Operating Budget (Estimated Expenditures)State Funds $ 8,964,460Sponsored Research 8,994,577 Federal Appropriations 749,664Gifts & Misc. Other 2,461,766Total $21,170,467
StudentsGraduate Enrollment 194Child Development & Family Studies 55Consumer Sciences & Retailing 41Foods & Nutrition 49Hospitality & Tourism Management 49Undergraduate Enrollment 1914Child Development & Family Studies 255Consumer Sciences & Retailing 692Foods & Nutrition 261Hospitality & Tourism Management 619CFS Education 40Undecided 47
InstructionAverage Organized Class Size 32.5
Data Digest 2005-06
Consumer & Family Sciences
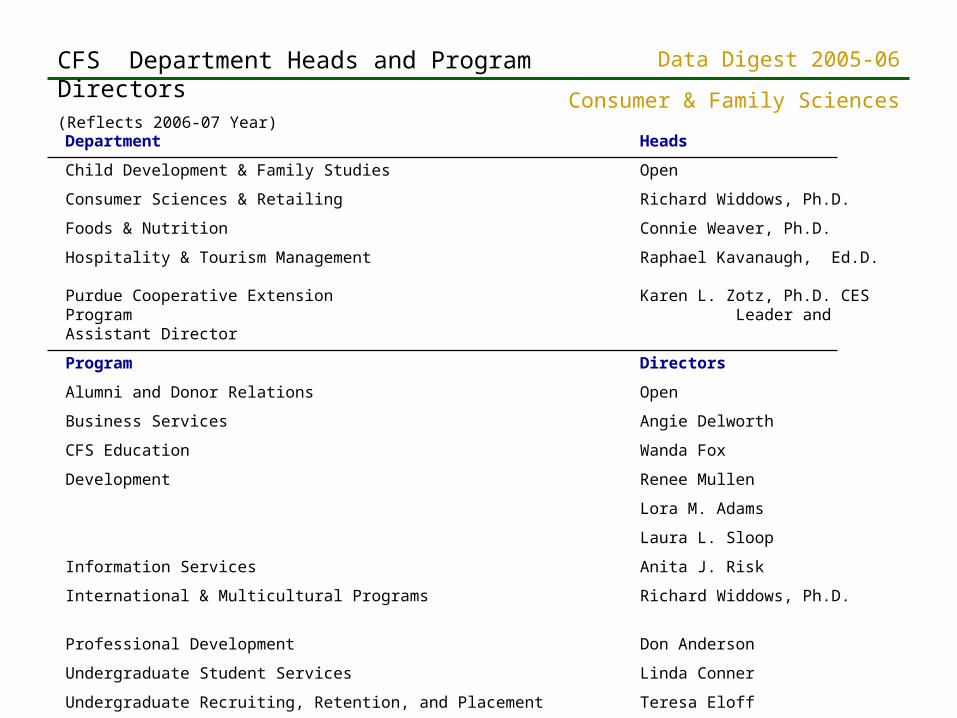
CFS Department Heads and Program Directors(Reflects 2006-07 Year)
Department Heads
Child Development & Family Studies Open
Consumer Sciences & Retailing Richard Widdows, Ph.D.
Foods & Nutrition Connie Weaver, Ph.D.
Hospitality & Tourism Management Raphael Kavanaugh, Ed.D.
Purdue Cooperative Extension Karen L. Zotz, Ph.D. CES Program Leader and Assistant Director
Program Directors
Alumni and Donor Relations Open
Business Services Angie Delworth
CFS Education Wanda Fox
Development Renee Mullen
Lora M. Adams
Laura L. Sloop
Information Services Anita J. Risk
International & Multicultural Programs Richard Widdows, Ph.D.
Professional Development Don Anderson
Undergraduate Student Services Linda Conner
Undergraduate Recruiting, Retention, and Placement Teresa Eloff

Data Digest 2005-06
Consumer & Family Sciences

Data Digest 2005-06
Consumer & Family Sciences
1995-962001-022002-03 2003-04 2004-05 2005-06
Undergraduate 1,4641,930 1,926 1953 2047 1914Graduate 178181 188 197 193 194CFS Total 1,6422,111 2,114 2,150 2,240 2,108University Total 34,68538,20838,564 38,847 38,653 38,712% of University Total 4.735.53 5.48 5.53 5.80 5.44
0
500
1000
1500
2000
2500
1995-96 2001-02 2002-03 2003-04 2004-05 2005-06
Undergraduate
Graduate
Total
Historical Enrollment by Student Level
Data Digest 2005-06
Consumer & Family Sciences
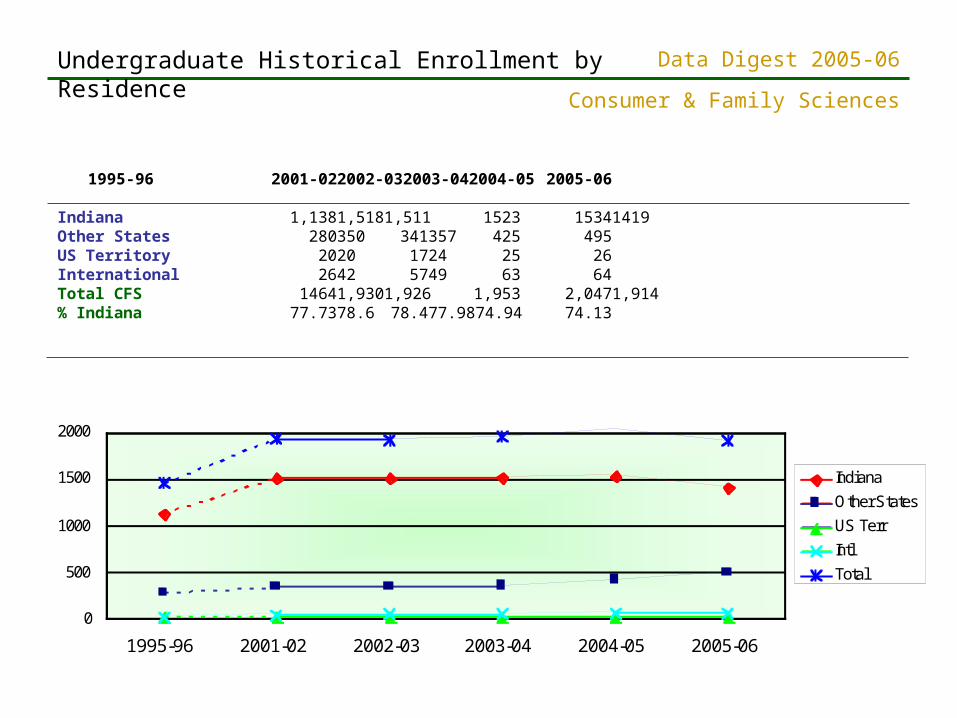
1995-96 2001-02 2002-03 2003-04 2004-05 2005-06
Indiana 1,138 1,518 1,511 1523 1534 1419Other States 280 350 341 357 425 495US Territory 20 20 17 24 25 26International 26 42 57 49 63 64Total CFS 1464 1,930 1,926 1,953 2,047 1,914% Indiana 77.73 78.6 78.4 77.98 74.94 74.13
0
500
1000
1500
2000
1995-96 2001-02 2002-03 2003-04 2004-05 2005-06
Indiana
Other States
US Terr
Intl
Total
Undergraduate Historical Enrollment by Residence

Data Digest 2005-06
Consumer & Family Sciences
1995-96 2001-02 2002-03 2003-04 2004-052005-06
African American 43 72 76 64 7381Asian American 34 39 56 60 7886Hispanic 40 42 49 56 6766American Indian 6 11 10 9 88Ethnicity Total 123 164 191 189 226241CFS Total 1,464 1,930 1,926 1953 20471914% Ethnicity CFS 8.4 8.5 10.0 9.7 11.012.6% Ethnicity University 9.9 9.3 10.2 10.8 11.311.2
0
20
40
60
80
100
1995-96 2001-02 2002-03 2003-04 2004-05 2005-06
African
Asian
Hispanic
Am. Indian
Undergraduate Historical Enrollment by Ethnicity

Data Digest 2005-06
Consumer & Family Sciences
1995-96 2001-02 2002-03 2003-04 2004-05 2005-06
Freshman 332 302 273 322 319 260Sophomore 394 493 449 404 530 426Junior 352 537 557 567 517 610Senior 386 594 647 657 680 618Non-Degree -- 4 -- 3 1 --CFS Total 1,464 1,930 1,926 1953 2047 1914
200
300
400
500
600
700
800
1995-96 2001-02 2002-03 2003-04 2004-05 2005-06
Freshman
Sophomore
Junior
Senior
Undergraduate Historical Enrollment by Classification Year

Data Digest 2005-06
Consumer & Family Sciences
1995-96 2001-02 2002-03 2003-04 2004-05 2005-06
F&N 251 199 194 204 248 261CSR 353 734 725 701 729 692HTM 458 524 518 596 718 619CDFS 336 356 362 303 271 255CFS Education 15 44 50 45 37 40Undecided 51 73 77 104 44 47CFS Total 1,464 1,930 1,926 1953 2047 1914
0
100
200
300
400
500
600
700
800
1995-96 2001-02 2002-03 2003-04 2004-05 2005-06
FN
CSR
HTM
CDFS
CFS ED
Undecided
Undergraduate Historical Enrollment by Department
Data Digest 2005-06
Consumer & Family Sciences
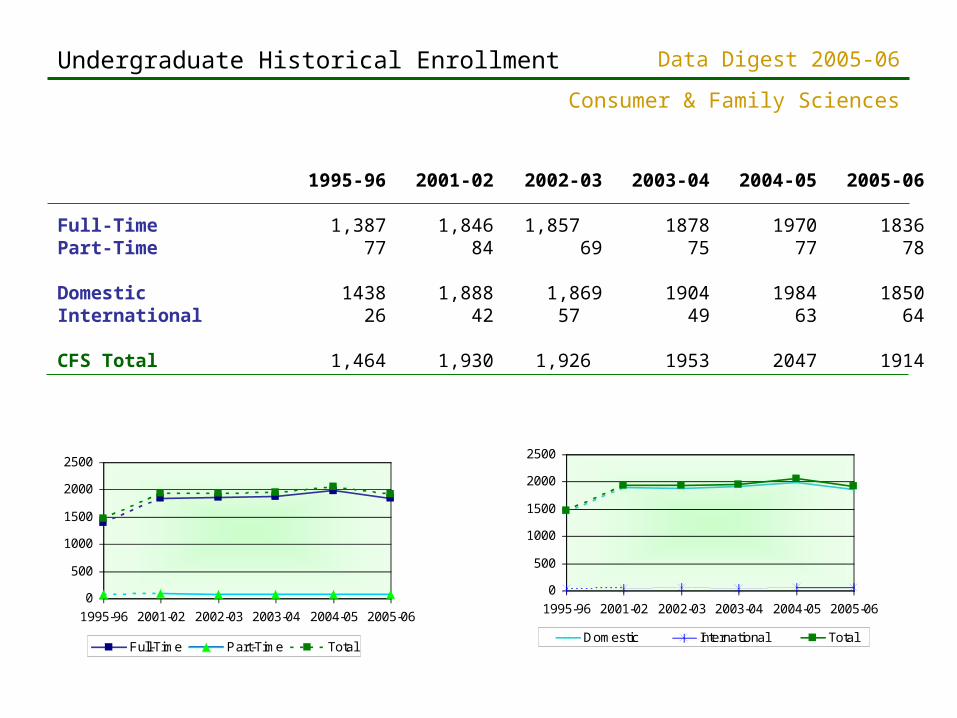
1995-96 2001-02 2002-03 2003-04 2004-05 2005-06
Full-Time 1,387 1,846 1,857 1878 1970 1836Part-Time 77 84 69 75 77 78
Domestic 1438 1,888 1,869 1904 1984 1850International 26 42 57 49 63 64 CFS Total 1,464 1,930 1,926 1953 2047 1914
0
500
1000
1500
2000
2500
1995-96 2001-02 2002-03 2003-04 2004-05 2005-06
Full-Time Part-Time Total
Undergraduate Historical Enrollment
0
500
1000
1500
2000
2500
1995-96 2001-02 2002-03 2003-04 2004-05 2005-06
Domestic International Total

Data Digest 2005-06
Consumer & Family Sciences
CDFS 2005-06Early Childhood Education and Exceptional Needs 55
Early Intervention 7
Individual and Family Studies 26
Youth, Adult and Family Services 167
Total 255
Undergraduate Enrollment by Major (2005-06)
CSR 2005-06Apparel Design & Technology 80
Financial Counseling & Planning 125
Retail Management 202
Selling & Sales Management 280
Small Business 5
Total 692
HTM 2005-06Food Service & Lodging Supervision 6
Hospitality & Tourism Management 611
Restaurant, Hotel, Institution & Tourism Mgmt 2
Total 619
F&N 2005-06Coordinated Dietetics 5
Dietetics 121
Dietetics Nutrition, Fitness and Health 66
Food Science 6
Foods & Nutrition in Business 12
Nutrition Science 23
Nutrition, Fitness & Health 28
Total 261
CFS Education 2005-06Family & Consumer Sciences Education 31
Occupational FCS Education 9
Total 40
Undecided 2005-06Undecided 47
Total 47
Summary 2005-06Number of Majors 22
Enrollment 1914

Data Digest 2005-06
Consumer & Family Sciences
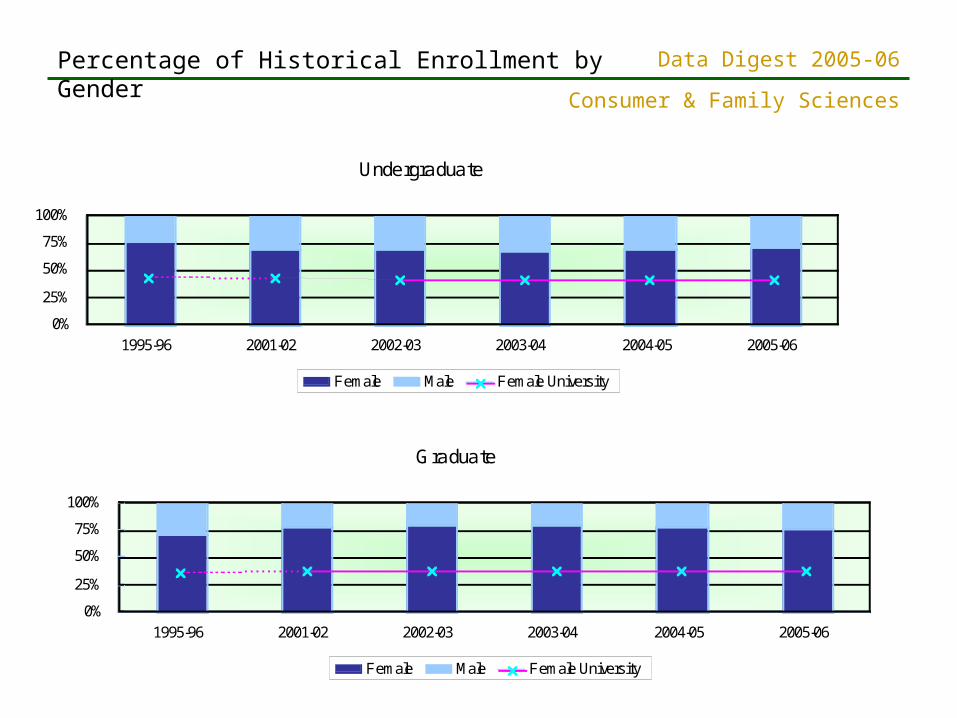
Undergraduate 1995-96 2001-02 2002-03 2003-04 2004-05 2005-06Female 1,114 1,333 1,344 1344 1412 1382Male 350 597 582 609 635 532CFS Total 1,464 1,930 1,926 1953 2047 1914% Female CFS 76.0 69.0 69.7 68.8 68.9 72.2% Female University 43.1 41.8 41.5 *41.0 41.0 41.0
Historical Enrollment by Gender
Graduate
Female 127 142 150 158 152 148
Male 51 39 38 39 41 46
CFS Total 178 181 188 197 193 194
% Female CFS 71.3 78.4 79.7 80.2 78.7 76.2
% Female University 36.1 36.7 37.0 37.4 37.4 38.1
Total
Female 1,241 1,4751,494 1502 1564 1530
Male 401 636620 648 676 578
% Female CFS 75.5 69.970.7 69.8 69.8 72.5
% Female University 42.1 41.741.5 *41.1 41.1 41.1
*Reflects data correction
Data Digest 2005-06
Consumer & Family Sciences
Graduate
0%
25%
50%
75%
100%
1995-96 2001-02 2002-03 2003-04 2004-05 2005-06
Female Male Female University
Percentage of Historical Enrollment by Gender
Undergraduate
0%
25%
50%
75%
100%
1995-96 2001-02 2002-03 2003-04 2004-05 2005-06
Female Male Female University

Data Digest 2005-06
Consumer & Family Sciences
Undergraduate 1995-96 2001-02 2002-03 2003-04 2004-05 2005-06African American 43 72 76 64 73 72Asian American 34 39 56 60 78 84Hispanic 40 42 49 56 67 63American Indian 6 11 10 9 8 8Non-Ethnic 1,341 1,766 1,735 1764 1821 1687
Historical Enrollment by Ethnicity
Graduate
African American 5 8 5 8 9 9
Asian American 7 5 6 4 1 2
Hispanic 4 3 4 3 3 3
American Indian 0 -- -- -- -- --
Non-Ethnic 162 165 173182 180 180
Total
Total CFS 1642 2,111 2,114 2150 2240 2108
Total Ethnicity 139 180 206 204 239 241
% Ethnicity CFS 8.5 8.5 9.7 9.5 10.7 11.4
% Ethnicity University 10.1 9.3 10.0 10.5 10.9 11.2
Data Digest 2005-06
Consumer & Family Sciences
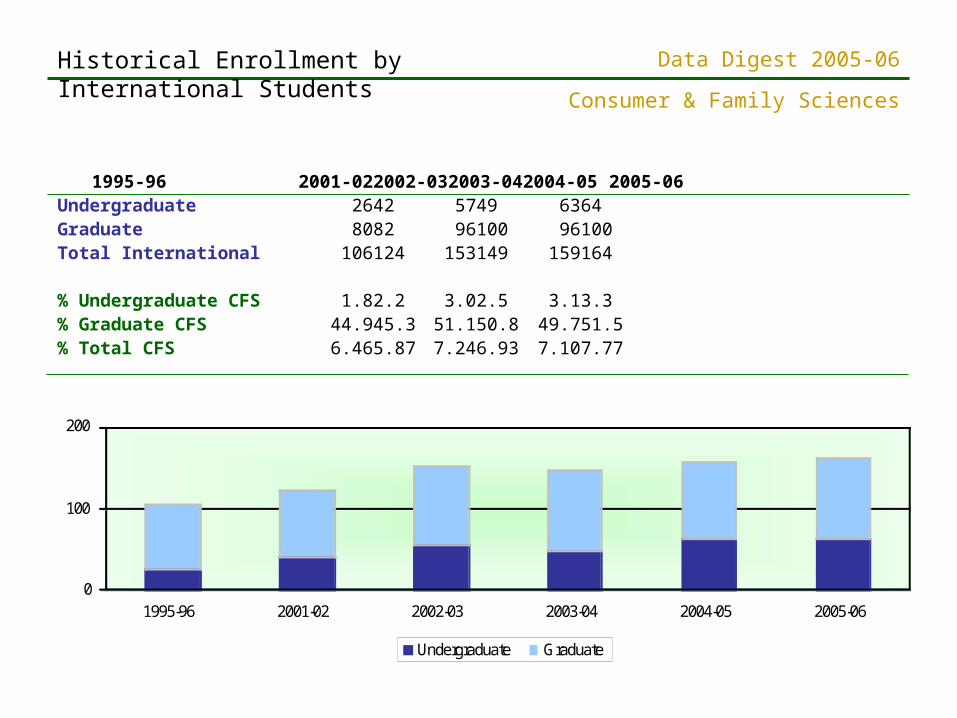
1995-96 2001-02 2002-03 2003-04 2004-05 2005-06Undergraduate 26 42 57 49 63 64Graduate 80 82 96 100 96 100Total International 106 124 153 149 159 164
% Undergraduate CFS 1.8 2.2 3.0 2.5 3.1 3.3% Graduate CFS 44.9 45.3 51.1 50.8 49.7 51.5% Total CFS 6.46 5.87 7.24 6.93 7.10 7.77
Historical Enrollment by International Students
0
100
200
1995-96 2001-02 2002-03 2003-04 2004-05 2005-06
Undergraduate Graduate
Data Digest 2005-06
Consumer & Family Sciences
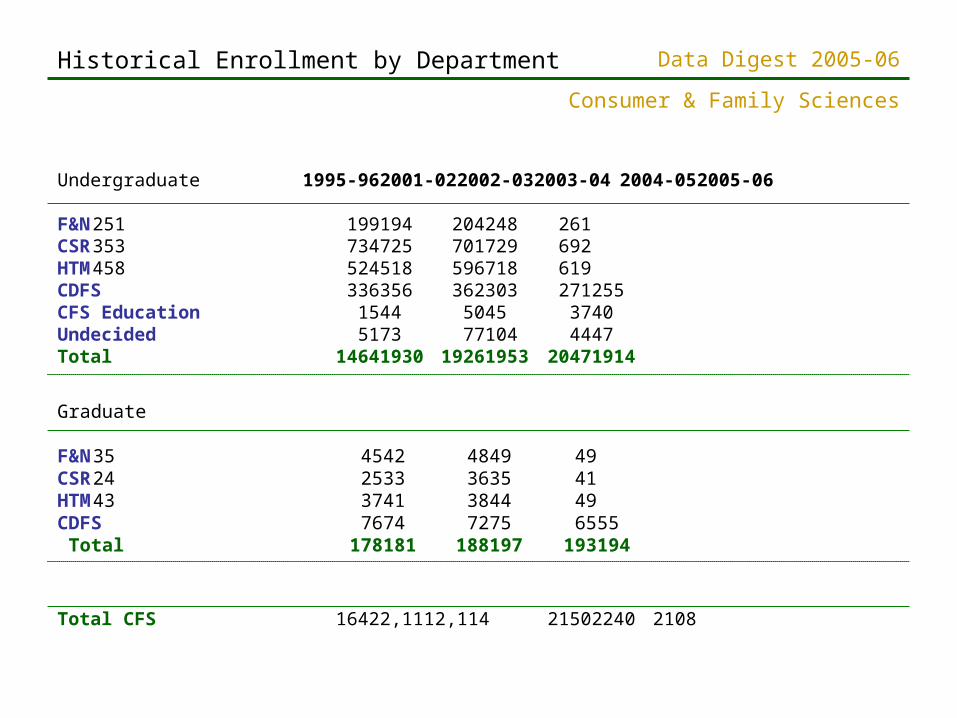
Undergraduate 1995-96 2001-02 2002-03 2003-04 2004-05 2005-06
F&N 251 199 194 204 248 261CSR 353 734 725 701 729 692HTM 458 524 518 596 718 619CDFS 336 356 362 303 271 255CFS Education 15 44 50 45 37 40Undecided 51 73 77 104 44 47Total 1464 1930 1926 1953 2047 1914
Historical Enrollment by Department
Graduate
F&N 35 45 42 48 49 49CSR 24 25 33 36 35 41HTM 43 37 41 38 44 49CDFS 76 74 72 75 65 55 Total 178 181 188 197 193 194
Total CFS 1642 2,111 2,114 2150 22402108

Data Digest 2005-06
Consumer & Family Sciences
Standard SAT Test Scores by Department
1995-96 2001-02 2002-03 2003-04 2004-05 2005-06
CDFS 911 1030 1040 1056 1012 999CFS ED 890 1047 1065 900 987 955CSR 1007 1008 1047 1060 1044 1075F&N 1041 1058 1081 1037 1088 1087HTM 979 1042 1058 1079 1102 1120UND 923 1016 990 1022 983 1054OVERALL CFS AVG 979 1030 1047 1055 1071 1081
900
1000
1100
1200
1995-96 2001-02 2002-03 2003-04 2004-05 2005-06
CDFS
CFS ED
CSR
F&N
HTM
UND
Data Digest 2005-06
Consumer & Family Sciences
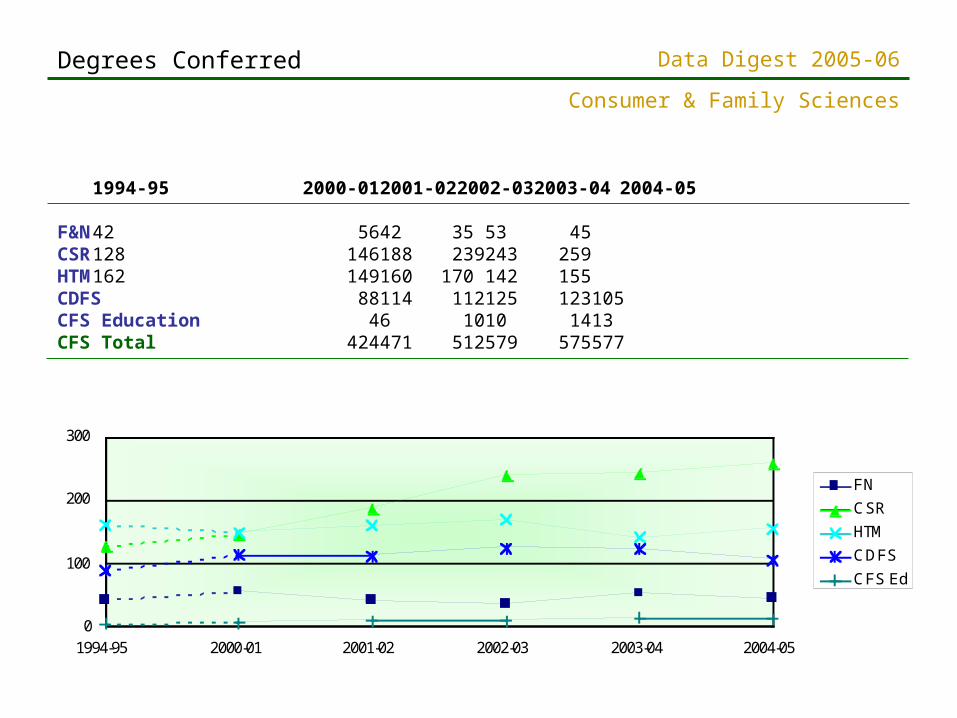
1994-95 2000-01 2001-02 2002-03 2003-04 2004-05
F&N 42 56 42 35 53 45CSR 128 146 188 239 243 259HTM 162 149 160 170 142 155CDFS 88 114 112 125 123 105CFS Education 4 6 10 10 14 13CFS Total 424 471 512 579 575 577
0
100
200
300
1994-95 2000-01 2001-02 2002-03 2003-04 2004-05
FN
CSR
HTM
CDFS
CFS Ed
Degrees Conferred
Data Digest 2005-06
Consumer & Family Sciences
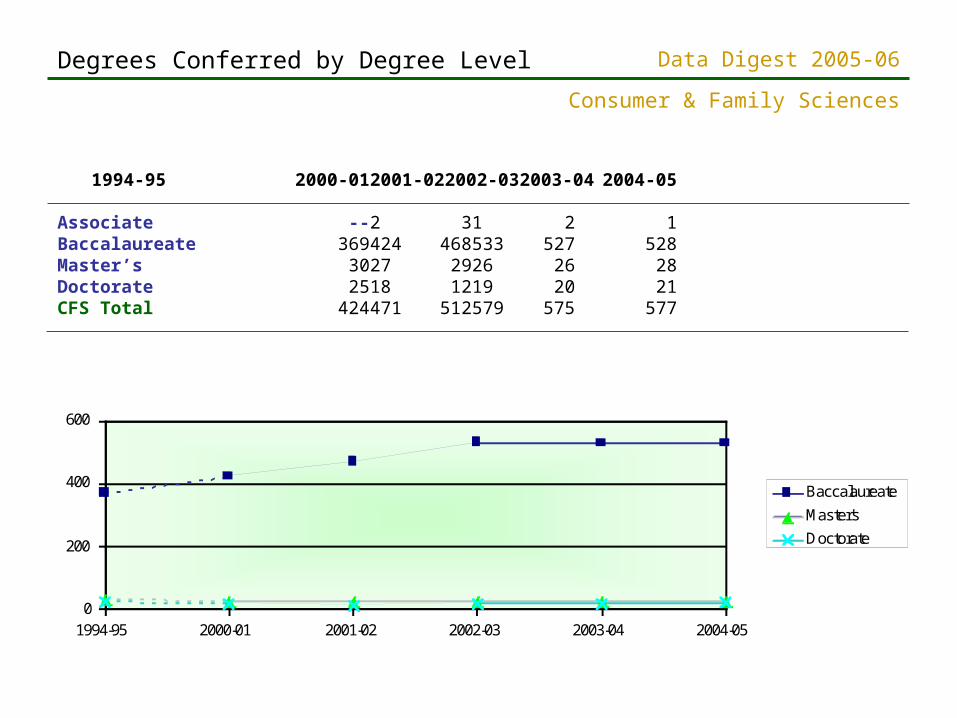
1994-95 2000-01 2001-02 2002-03 2003-04 2004-05
Associate -- 2 3 1 2 1Baccalaureate 369 424 468 533 527 528Master’s 30 27 29 26 26 28Doctorate 25 18 12 19 20 21CFS Total 424 471 512 579 575 577
0
200
400
600
1994-95 2000-01 2001-02 2002-03 2003-04 2004-05
Baccalaureate
Master's
Doctorate
Degrees Conferred by Degree Level

Data Digest 2005-06
Consumer & Family Sciences
Data Digest 2005-06
Consumer & Family Sciences
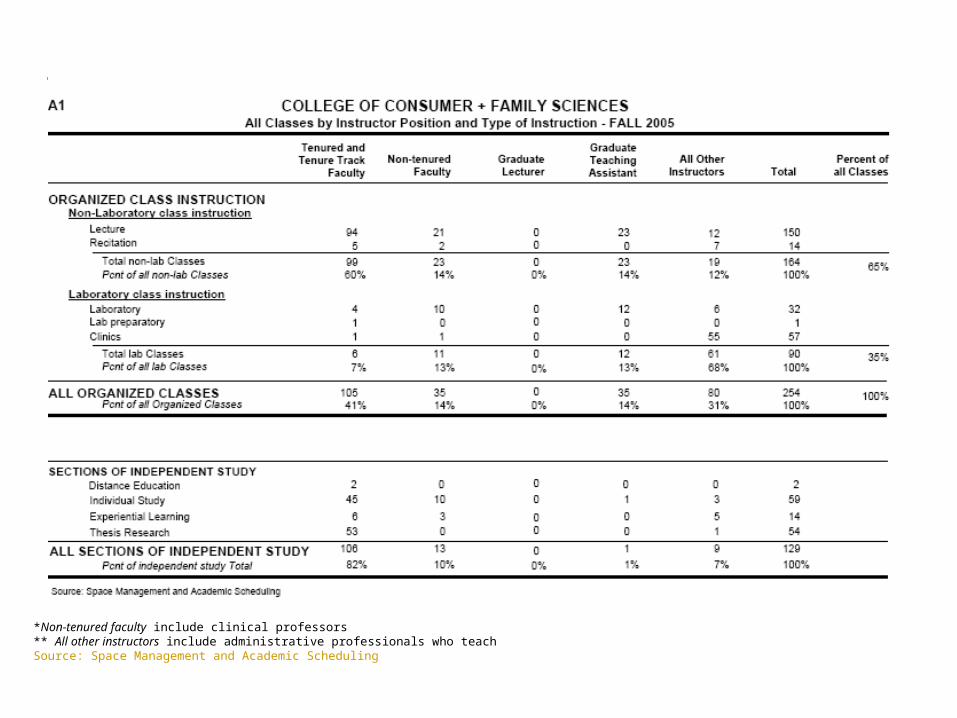
Classes by Instructor Position and Type of Instruction
*Non-tenured faculty include clinical professors** All other instructors include administrative professionals who teachSource: Space Management and Academic Scheduling

Data Digest 2005-06
Consumer & Family Sciences
Classes by Instructor Position, Type of Instruction & Class Level
*Include lab, lab prep, auto tutorial self-paced labs, and clinics
Data Digest 2005-06
Consumer & Family Sciences
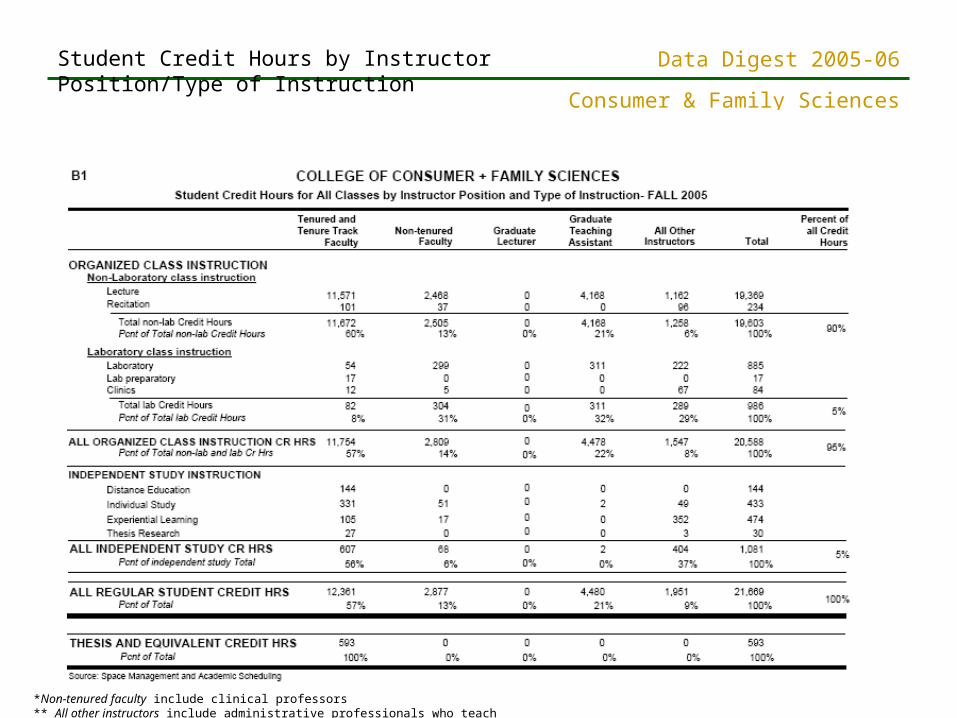
Student Credit Hours by Instructor Position/Type of Instruction
*Non-tenured faculty include clinical professors** All other instructors include administrative professionals who teach

Data Digest 2005-06
Consumer & Family Sciences
Student Credit Hours by Instructor Position, Type of Instruction & Class Level
*Include lab, lab prep, auto tutorial self-paced labs, and clinics**Non-tenured faculty include clinical professors*** All other instructors include administrative professionals who teach
*

Data Digest 2005-06
Consumer & Family Sciences
WSCH* by Instructor Position/Type of Instruction
*WSCH=Weekly Student Class Hours**Non-tenured faculty include clinical professors***All other instructors include administrative professionals who teach

Data Digest 2005-06
Consumer & Family Sciences
WSCH* by Instructor Position, Type of Instruction and Class Level
**Include lab, lab prep, auto tutorial self-paced labs, and clinics*WSCH=Weekly Student Class Hours
*
Data Digest 2005-06
Consumer & Family Sciences
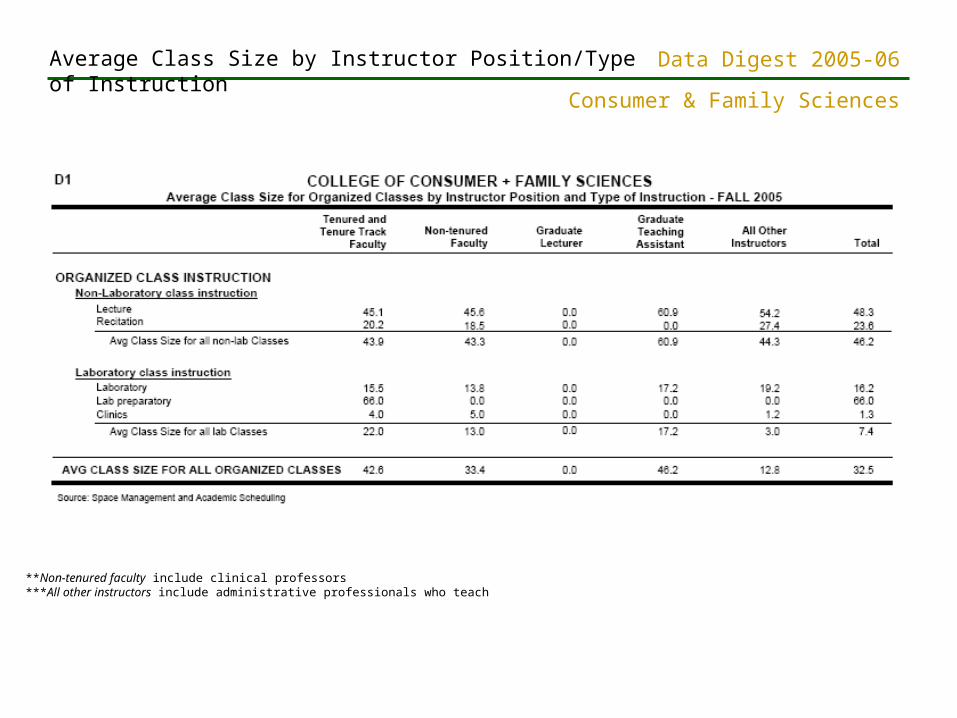
Average Class Size by Instructor Position/Type of Instruction
**Non-tenured faculty include clinical professors***All other instructors include administrative professionals who teach
Data Digest 2005-06
Consumer & Family Sciences
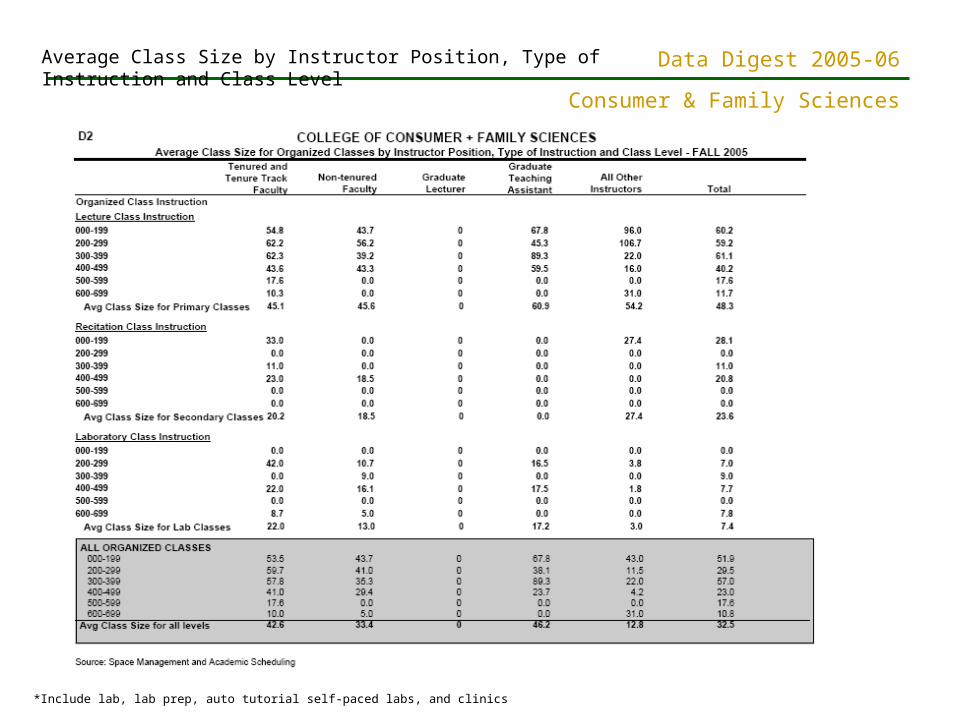
Average Class Size by Instructor Position, Type of Instruction and Class Level
*Include lab, lab prep, auto tutorial self-paced labs, and clinics

Data Digest 2005-06
Consumer & Family Sciences

Data Digest 2005-06
Consumer & Family Sciences
2000-01 2001-022002-032003-04 2004-05 2005-06
Tenured/Tenure track Faculty 60 5658 61 56 57Non-Tenure (Ltd.-term Lect./Visit. Fac.) 11 1613 5 5 3Clinical 0 00 0 5 5Continuing Lecturer 0 00 5 5 4Post Doctoral Research Associate 2 41 1 2 6Administrative Staff 22 2120 16 15 17Professional Staff 53 5153 55 54 54Clerical Staff 44 4643 46 46 44Service Staff 74 7980 75 79 88Graduate Student Staff 119 121127 139 143 132Adjunct Faculty 27 1920 21 21 20Total CFS 412 413415 424 431 430
Faculty & Staff Headcounts
0
40
80
120
2000-01 2001-02 2002-03 2003-04 2004-05 2005-06
Tenured/Tenure Track Faculty
Non-Tenure Track Faculty, Clinical, Lecturers, & Post Doc
Graduate Student Staff
Adjunct Faculty
0
30
60
90
120
2000-01 2001-02 2002-03 2003-04 2004-05 2005-06
Administrative Staff Professional Staff
Clerical Staff Service Staff

Data Digest 2005-06
Consumer & Family Sciences
2000-01 2001-02 2002-03 2003-04 2004-05 2005-06
African American 10 11 12 10 14 12Asian American 8 8 10 11 8 10Hispanic 1 5 3 3 3 4American Indian 1 0 0 0 0 1White and Other 331 326 320 317 325 317International 61 63 70 83 81 86Total CFS 412 413 415 424 431 430Total Ethnicity 20 24 25 24 25 27% Ethnicity 4.9 5.8 6.0 5.7 5.8 6.3
Faculty and Staff Headcount by Ethnicity
0
5
10
15
2000-01 2001-02 2002-03 2003-04 2004-05 2005-06
African American
Asian American
Hispanic
American Indian

Data Digest 2005-06
Consumer & Family Sciences
2000-01 2001-02 2002-03 2003-04 2004-05 2005-06
Male 76 75 80 85 93 89 Female 336 338 335 339 338 341 Total CFS 412 413 415 424 431 430 % Female 81.6 81.8 80.7 80.0 78.4 79.3
Faculty and Staff Headcount by Gender
50
150
250
350
450
2000-01 2001-02 2002-03 2003-04 2004-05 2005-06
Male Female
Data Digest 2005-06
Consumer & Family Sciences
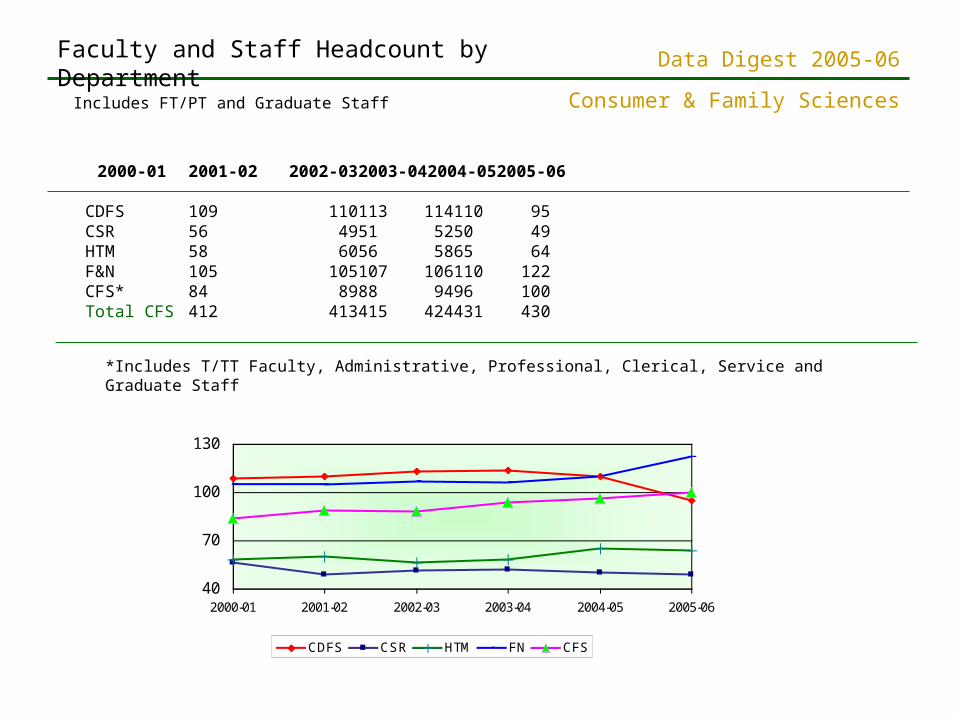
2000-01 2001-02 2002-03 2003-042004-052005-06
CDFS 109 110 113 114110 95 CSR 56 49 51 5250 49 HTM 58 60 56 5865 64 F&N 105 105 107 106110 122 CFS* 84 89 88 9496 100 Total CFS 412 413 415 424431 430
Faculty and Staff Headcount by Department
40
70
100
130
2000-01 2001-02 2002-03 2003-04 2004-05 2005-06
CDFS CSR HTM FN CFS
*Includes T/TT Faculty, Administrative, Professional, Clerical, Service and Graduate Staff
Includes FT/PT and Graduate Staff
Data Digest 2005-06
Consumer & Family Sciences
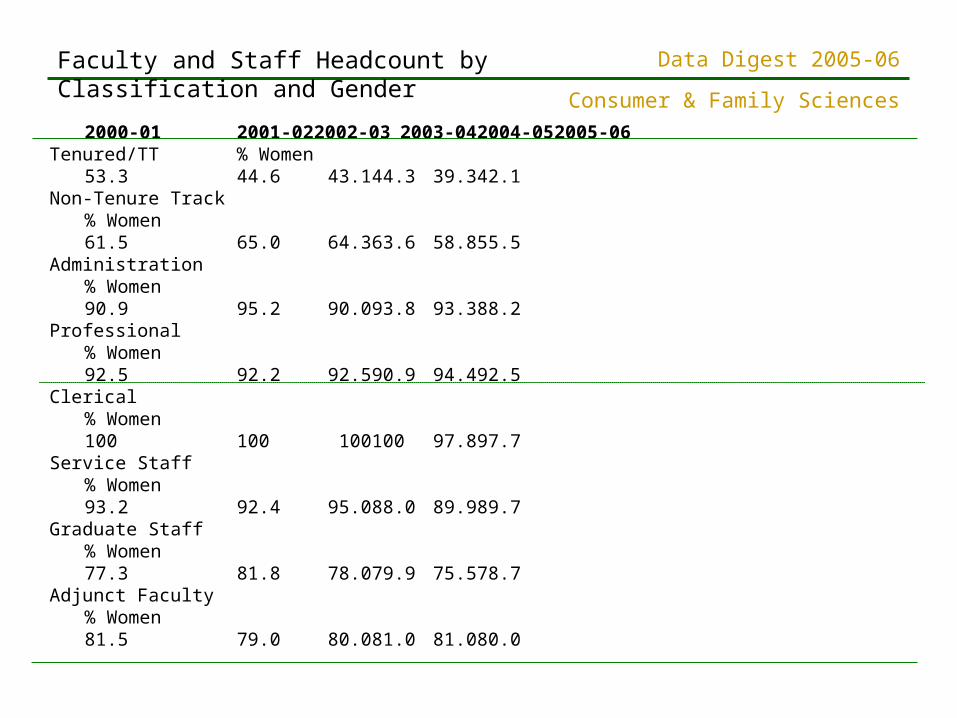
2000-012001-02 2002-03 2003-04 2004-05 2005-06Tenured/TT % Women
53.3 44.6 43.1 44.3 39.3 42.1Non-Tenure Track
% Women61.5 65.0 64.3 63.6 58.8 55.5
Administration% Women90.9 95.2 90.0 93.8 93.3 88.2
Professional% Women92.5 92.2 92.5 90.9 94.4 92.5
Clerical% Women100 100 100 100 97.8 97.7
Service Staff% Women93.2 92.4 95.0 88.0 89.9 89.7
Graduate Staff% Women77.3 81.8 78.0 79.9 75.5 78.7
Adjunct Faculty% Women81.5 79.0 80.0 81.0 81.0 80.0
Faculty and Staff Headcount by Classification and Gender
Data Digest 2005-06
Consumer & Family Sciences
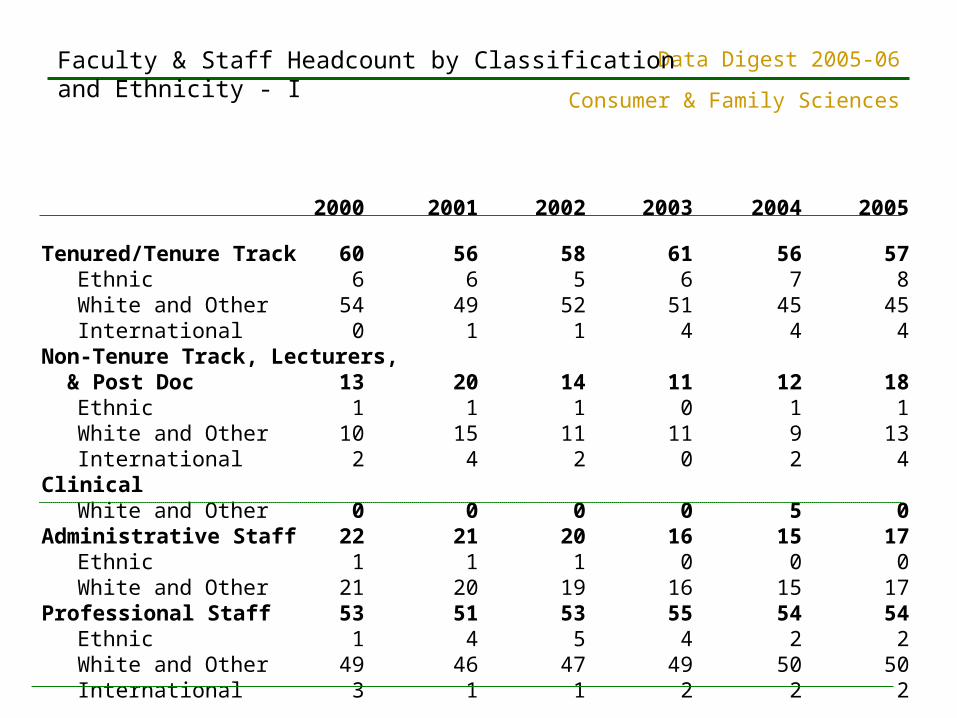
2000 2001 2002 2003 2004 2005
Tenured/Tenure Track 60 56 58 61 56 57Ethnic 6 6 5 6 7 8White and Other 54 49 52 51 45 45International 0 1 1 4 4 4
Non-Tenure Track, Lecturers, & Post Doc 13 20 14 11 12 18 Ethnic 1 1 1 0 1 1
White and Other 10 15 11 11 9 13International 2 4 2 0 2 4
ClinicalWhite and Other 0 0 0 0 5 0
Administrative Staff 22 21 20 16 15 17Ethnic 1 1 1 0 0 0White and Other 21 20 19 16 15 17
Professional Staff 53 51 53 55 54 54Ethnic 1 4 5 4 2 2White and Other 49 46 47 49 50 50International 3 1 1 2 2 2
Faculty & Staff Headcount by Classification and Ethnicity - I
Data Digest 2005-06
Consumer & Family Sciences
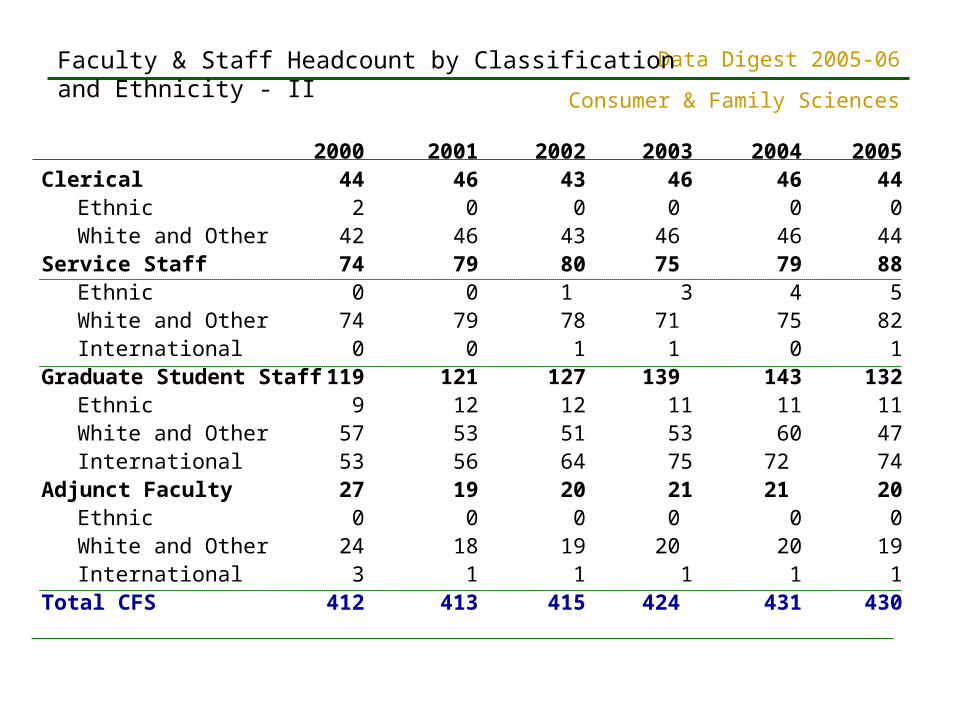
2000 2001 2002 2003 2004 2005Clerical 44 46 43 46 46 44
Ethnic 2 0 0 0 0 0White and Other 42 46 43 46 46 44
Service Staff 74 79 80 75 79 88 Ethnic 0 0 1 3 4 5
White and Other 74 79 78 71 75 82International 0 0 1 1 0 1
Graduate Student Staff 119 121 127 139 143 132Ethnic 9 12 12 11 11 11White and Other 57 53 51 53 60 47International 53 56 64 75 72 74
Adjunct Faculty 27 19 20 21 21 20Ethnic 0 0 0 0 0 0White and Other 24 18 19 20 20 19International 3 1 1 1 1 1
Total CFS 412 413 415 424 431 430
Faculty & Staff Headcount by Classification and Ethnicity - II

Data Digest 2005-06
Consumer & Family Sciences
2000 2001 2002 2003 2004 2005CDFS 19 15 15 15 13 13CSR 11 10 11 13 12 11HTM 14 14 15 16 16 16F&N 13 14 14 14 13 15CFS Administration 3 3 3 3 2 2Total CFS 60 56 58 61 56 57
0
5
10
15
20
25
2000 2001 2002 2003 2004 2005
CDFS
CSR
HTM
FN
Tenured and Tenure Track Faculty Headcount by Department
Data Digest 2005-06
Consumer & Family Sciences
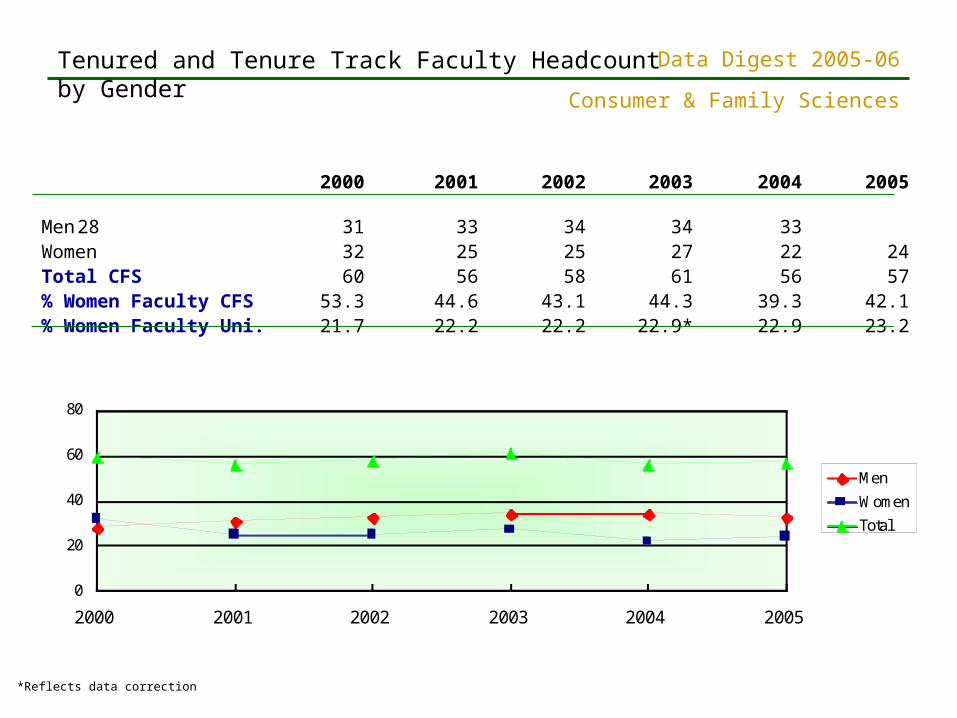
2000 2001 2002 2003 2004 2005
Men 28 31 33 34 34 33Women 32 25 25 27 22 24Total CFS 60 56 58 61 56 57% Women Faculty CFS 53.3 44.6 43.1 44.3 39.3 42.1% Women Faculty Uni. 21.7 22.2 22.2 22.9* 22.9 23.2
0
20
40
60
80
2000 2001 2002 2003 2004 2005
Men
Women
Total
Tenured and Tenure Track Faculty Headcount by Gender
*Reflects data correction
Data Digest 2005-06
Consumer & Family Sciences
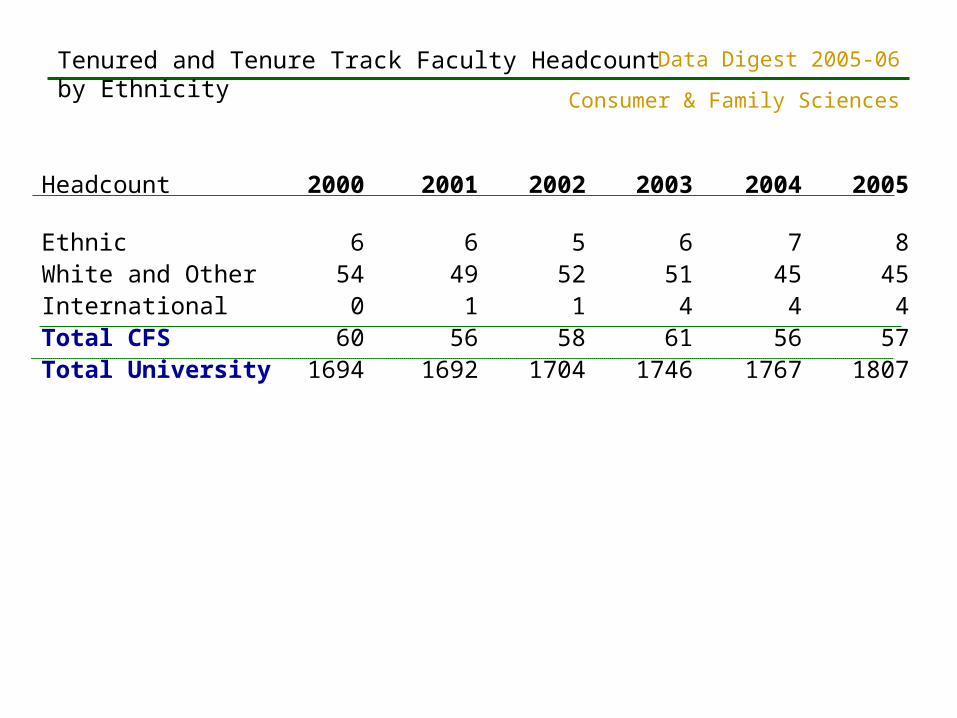
Headcount 2000 2001 2002 2003 2004 2005
Ethnic 6 6 5 6 7 8White and Other 54 49 52 51 45 45International 0 1 1 4 4 4Total CFS 60 56 58 61 56 57Total University 1694 1692 1704 1746 1767 1807
Tenured and Tenure Track Faculty Headcount by Ethnicity
Data Digest 2005-06
Consumer & Family Sciences
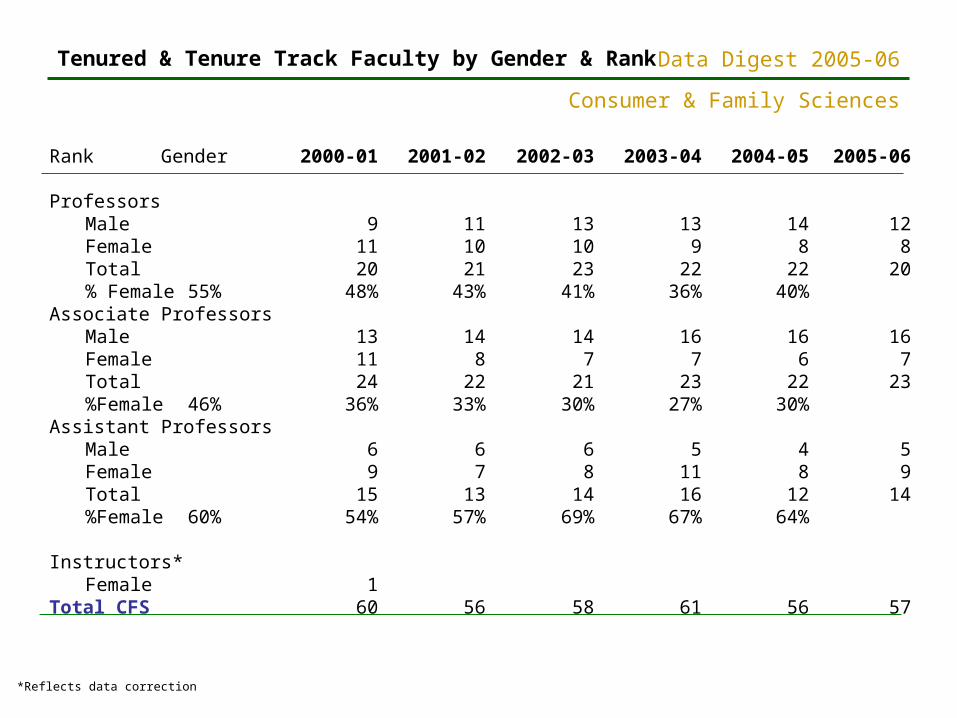
Rank Gender 2000-01 2001-02 2002-03 2003-04 2004-05 2005-06
ProfessorsMale 9 11 13 13 14 12Female 11 10 10 9 8 8Total 20 21 23 22 22 20% Female 55% 48% 43% 41% 36% 40%
Associate ProfessorsMale 13 14 14 16 16 16Female 11 8 7 7 6 7Total 24 22 21 23 22 23%Female 46% 36% 33% 30% 27% 30%
Assistant ProfessorsMale 6 6 6 5 4 5Female 9 7 8 11 8 9Total 15 13 14 16 12 14%Female 60% 54% 57% 69% 67% 64%
Instructors*Female 1
Total CFS 60 56 58 61 56 57
Tenured & Tenure Track Faculty by Gender & Rank
*Reflects data correction
Data Digest 2005-06
Consumer & Family Sciences
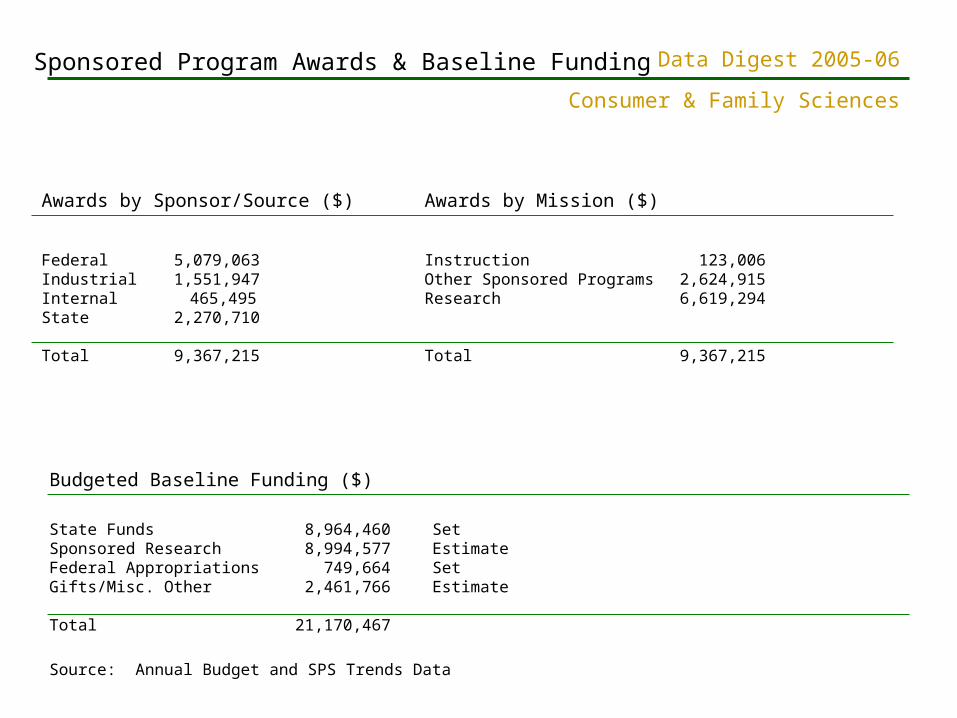
Sponsored Program Awards & Baseline Funding
Awards by Sponsor/Source ($) Awards by Mission ($)
Federal 5,079,063 Instruction 123,006Industrial 1,551,947 Other Sponsored Programs 2,624,915Internal 465,495 Research 6,619,294State 2,270,710
Total 9,367,215 Total 9,367,215
Budgeted Baseline Funding ($)
State Funds 8,964,460 SetSponsored Research 8,994,577 EstimateFederal Appropriations 749,664 SetGifts/Misc. Other 2,461,766 Estimate
Total 21,170,467
Source: Annual Budget and SPS Trends Data

Data Digest 2005-06
Consumer & Family Sciences