Embed Size (px)
DESCRIPTION
Data, Data, and More Data. Kyle Roskoski. Data. This is a summary of what environmental data we have access to for the year 1998-2000 (Some data through 2003) Two people have been measuring and recording environmental data. Warren Heilman and Jaak Sober. - PowerPoint PPT Presentation
Citation preview
Data, Data, and More Data
Kyle Roskoski
Data
• This is a summary of what environmental data we have access to for the year 1998-2000 (Some data through 2003)
• Two people have been measuring and recording environmental data. Warren Heilman and Jaak Sober.
• Warren’s data is recorded in Microsoft Excel and Jaak’s data in Microsoft Access
• Dr. Sober is the only source for CO2 and O3 measurements
Warren Heilman
• The following data can be found at http://www.fs.fed.us/nc/face/
• The following site can be looked at to see graphs created showing averages, maximums, and minimums of some of the data for the years 1998-2003. http://www.ncrs.fs.fed.us/4401/focus/face/meteorology/
Assumptions
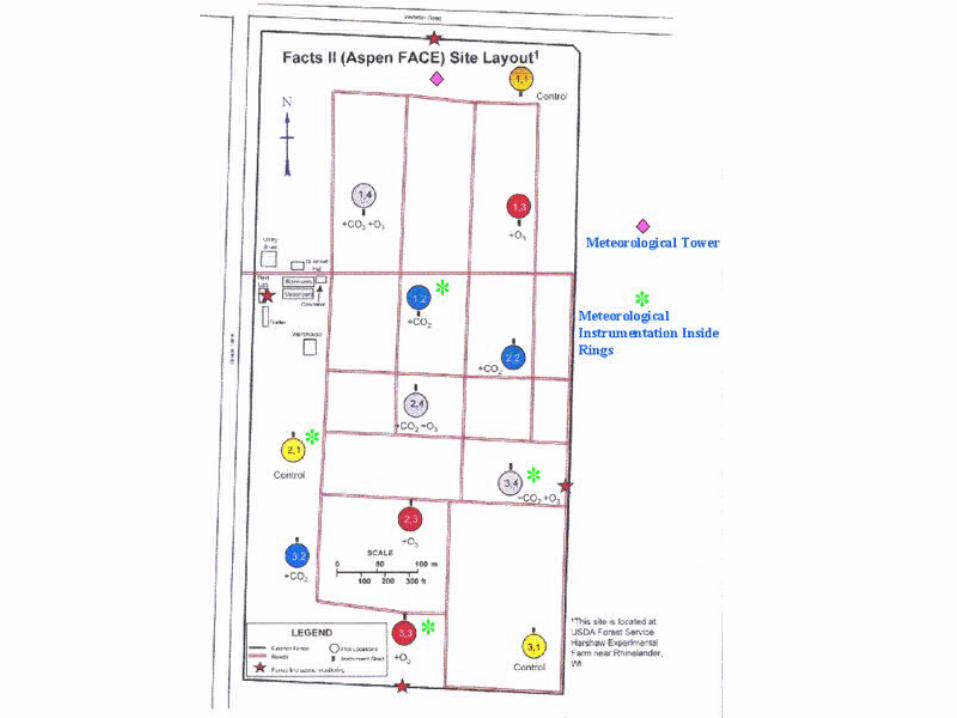
• Birch PAR means the birch quadrant of the ring. Similarly with aspen and maple
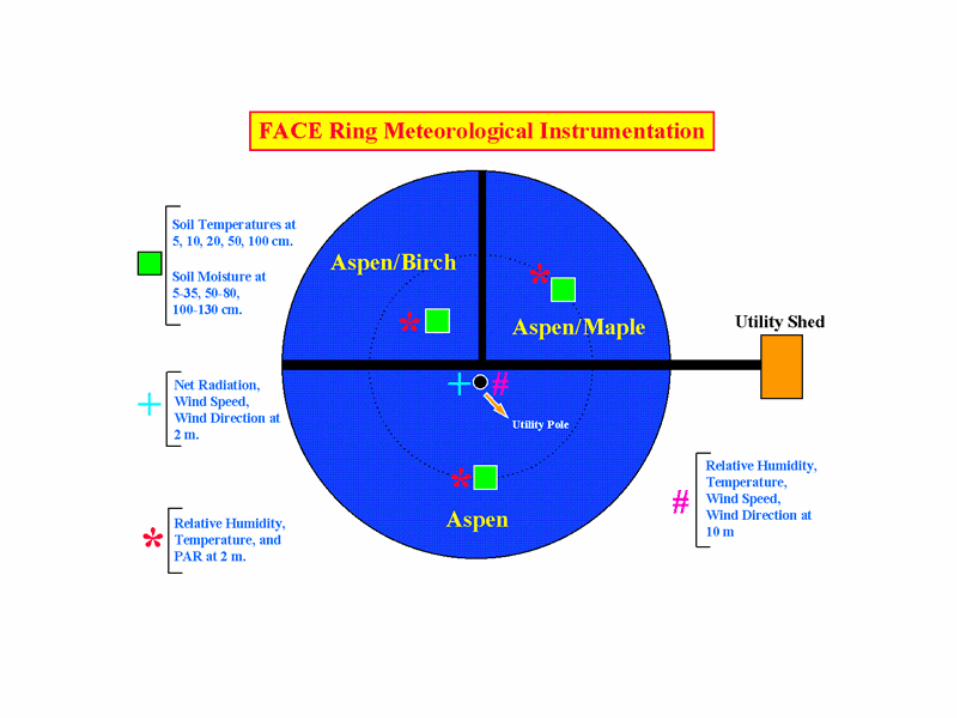
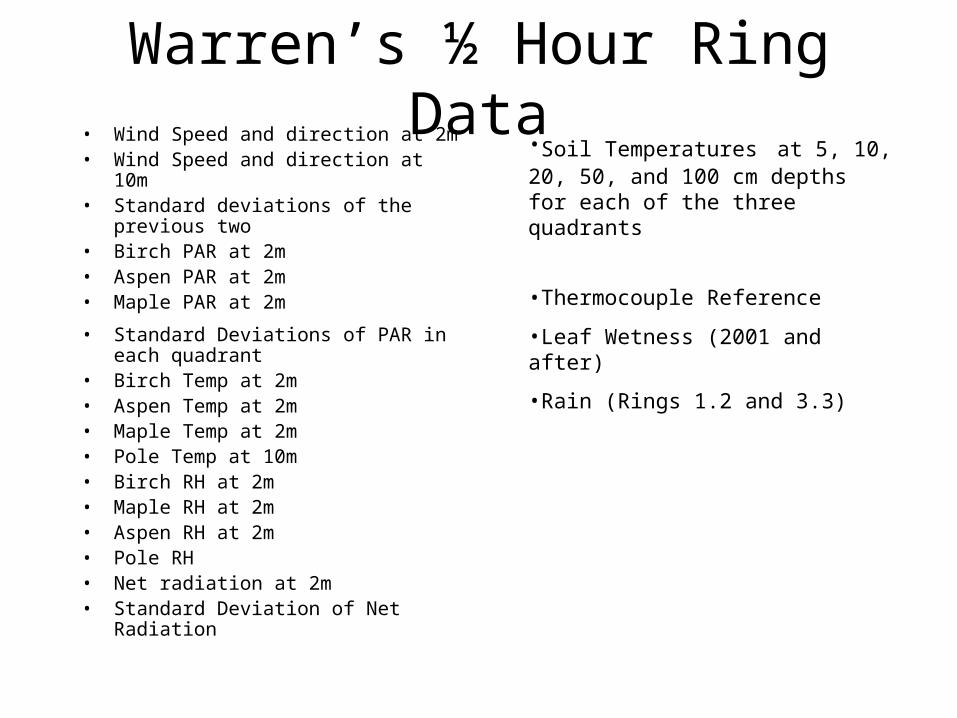
Warren’s ½ Hour Ring Data• Wind Speed and direction at 2m• Wind Speed and direction at 10m• Standard deviations of the previous two• Birch PAR at 2m• Aspen PAR at 2m• Maple PAR at 2m
• Standard Deviations of PAR in each quadrant
• Birch Temp at 2m• Aspen Temp at 2m• Maple Temp at 2m• Pole Temp at 10m• Birch RH at 2m• Maple RH at 2m• Aspen RH at 2m• Pole RH• Net radiation at 2m• Standard Deviation of Net Radiation
•Soil Temperatures at 5, 10, 20, 50, and 100 cm depths for each of the three quadrants
•Thermocouple Reference
•Leaf Wetness (2001 and after)
•Rain (Rings 1.2 and 3.3)
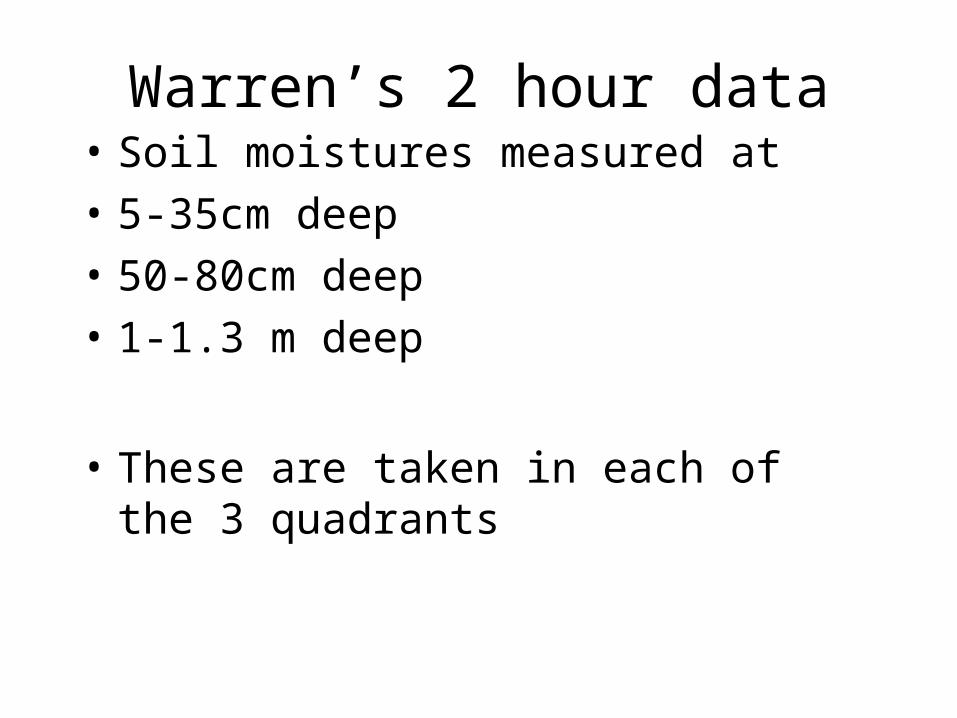
Warren’s 2 hour data• Soil moistures measured at
• 5-35cm deep
• 50-80cm deep
• 1-1.3 m deep
• These are taken in each of the 3 quadrants
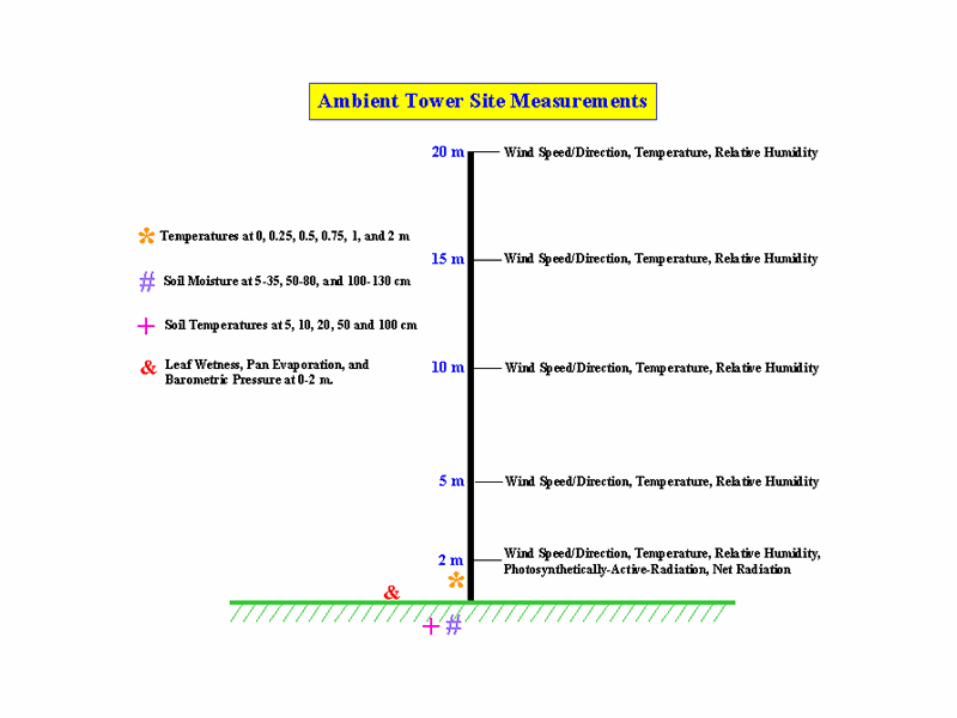
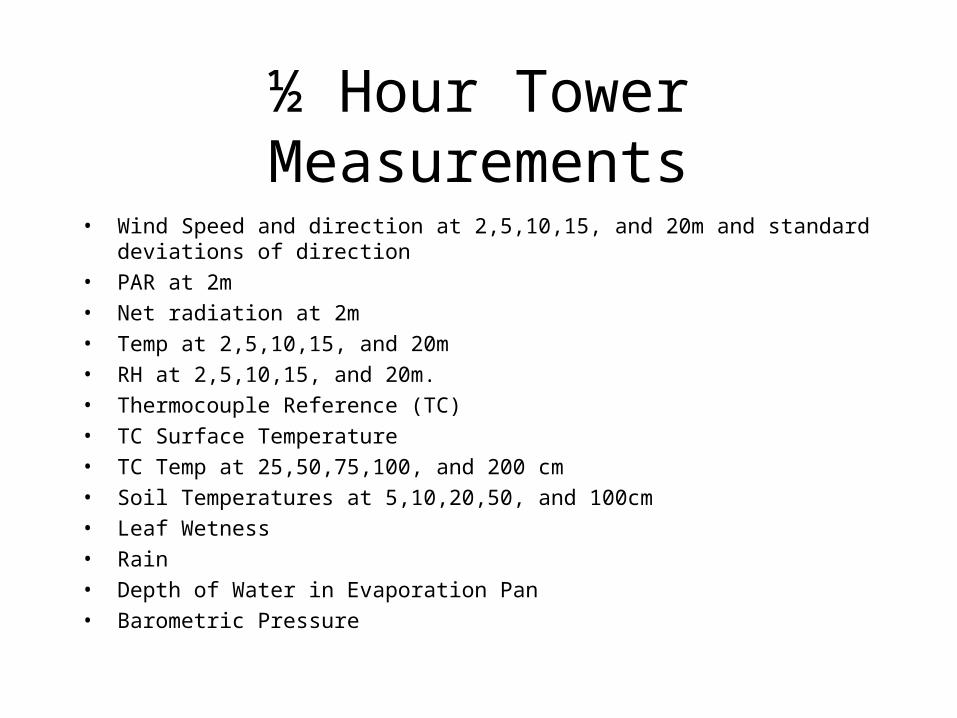
½ Hour Tower Measurements
• Wind Speed and direction at 2,5,10,15, and 20m and standard deviations of direction
• PAR at 2m
• Net radiation at 2m
• Temp at 2,5,10,15, and 20m
• RH at 2,5,10,15, and 20m.
• Thermocouple Reference (TC)
• TC Surface Temperature
• TC Temp at 25,50,75,100, and 200 cm
• Soil Temperatures at 5,10,20,50, and 100cm
• Leaf Wetness
• Rain
• Depth of Water in Evaporation Pan
• Barometric Pressure
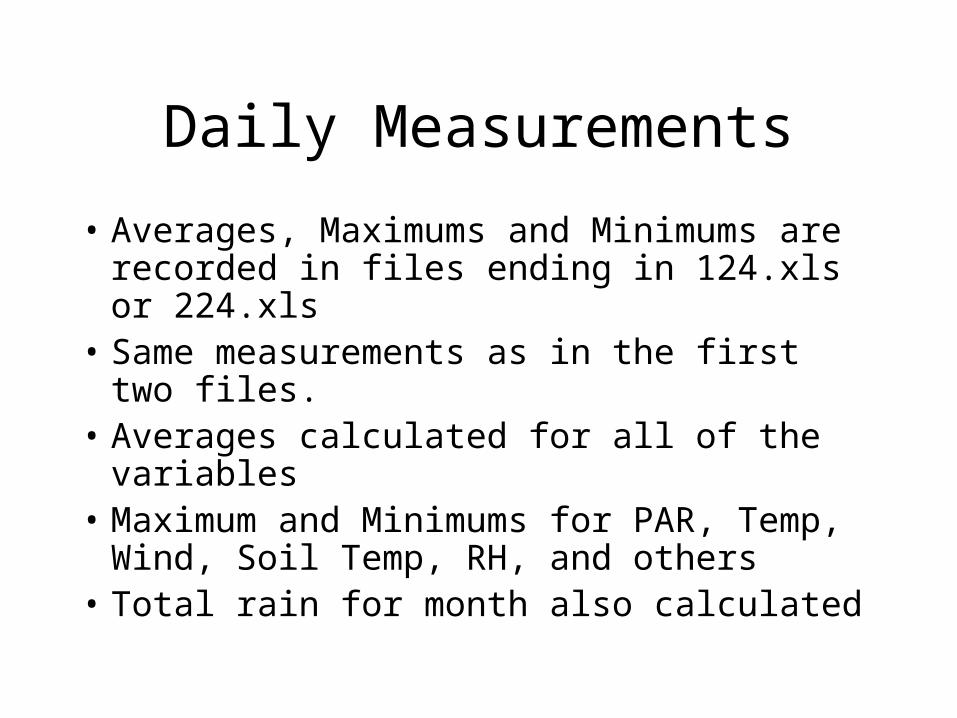
Daily Measurements
• Averages, Maximums and Minimums are recorded in files ending in 124.xls or 224.xls
• Same measurements as in the first two files.• Averages calculated for all of the variables• Maximum and Minimums for PAR, Temp,
Wind, Soil Temp, RH, and others• Total rain for month also calculated
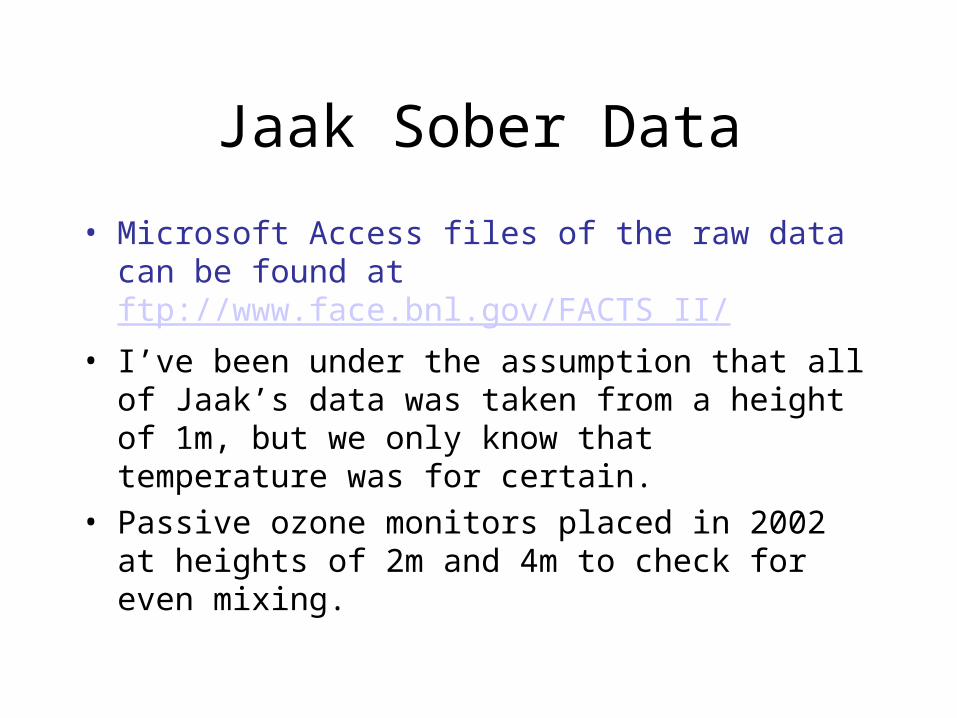
Jaak Sober Data
• Microsoft Access files of the raw data can be found at ftp://www.face.bnl.gov/FACTS II/
• I’ve been under the assumption that all of Jaak’s data was taken from a height of 1m, but we only know that temperature was for certain.
• Passive ozone monitors placed in 2002 at heights of 2m and 4m to check for even mixing.
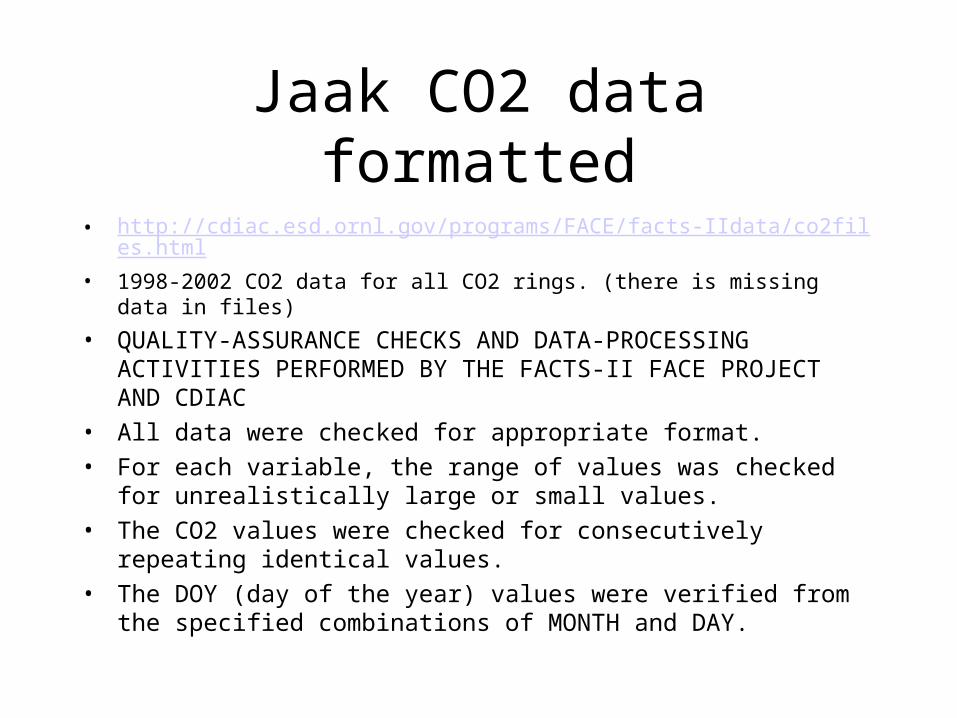
Jaak CO2 data formatted
• http://cdiac.esd.ornl.gov/programs/FACE/facts-IIdata/co2files.html
• 1998-2002 CO2 data for all CO2 rings. (there is missing data in files)
• QUALITY-ASSURANCE CHECKS AND DATA-PROCESSING ACTIVITIES PERFORMED BY THE FACTS-II FACE PROJECT AND CDIAC
• All data were checked for appropriate format.
• For each variable, the range of values was checked for unrealistically large or small values.
• The CO2 values were checked for consecutively repeating identical values.
• The DOY (day of the year) values were verified from the specified combinations of MONTH and DAY.
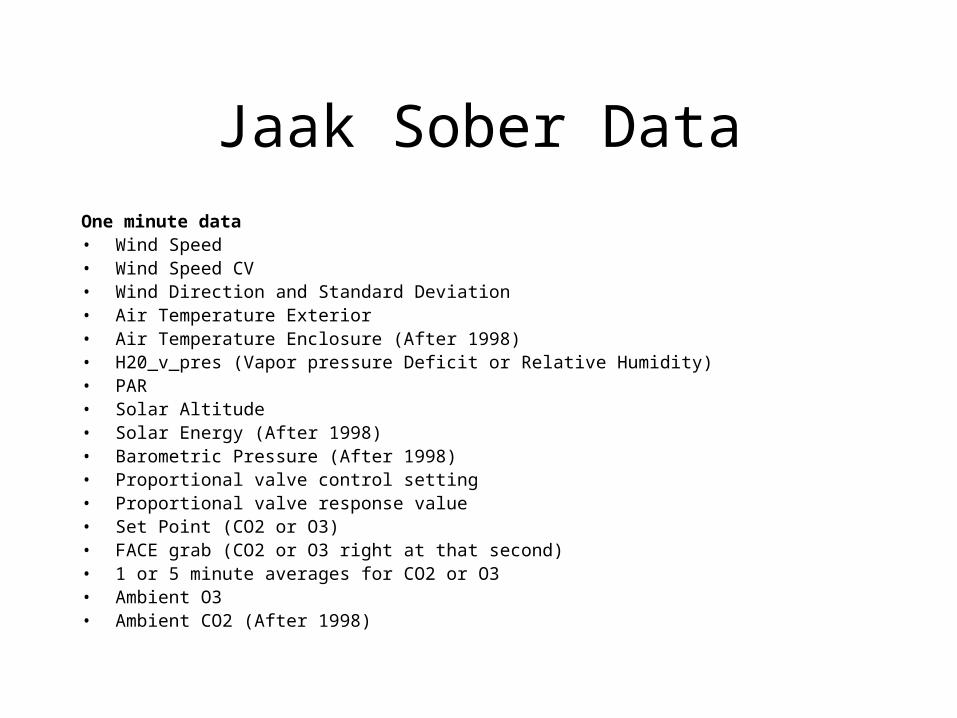
Jaak Sober Data
One minute data• Wind Speed • Wind Speed CV• Wind Direction and Standard Deviation• Air Temperature Exterior• Air Temperature Enclosure (After 1998)• H20_v_pres (Vapor pressure Deficit or Relative Humidity)• PAR• Solar Altitude• Solar Energy (After 1998)• Barometric Pressure (After 1998)• Proportional valve control setting• Proportional valve response value• Set Point (CO2 or O3)• FACE grab (CO2 or O3 right at that second)• 1 or 5 minute averages for CO2 or O3• Ambient O3• Ambient CO2 (After 1998)
• Jaak’s data was taken at Eastern Standard Time and Warrens was at Central Standard Time.
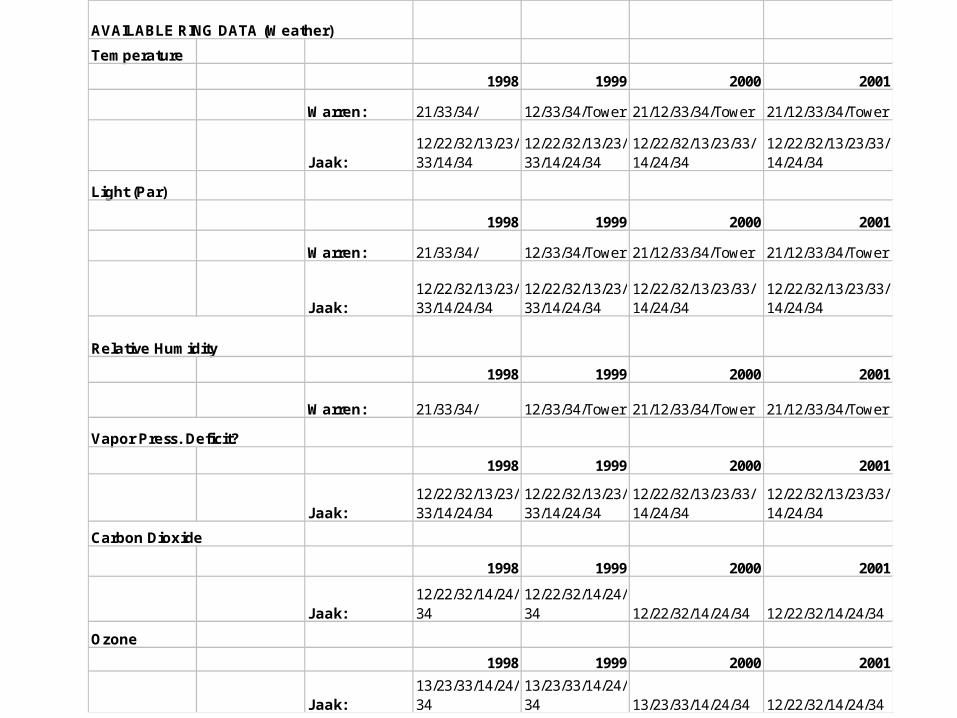
AVAILABLE RING DATA (Weather)
Temperature
1998 1999 2000 2001
Warren: 21/33/34/ 12/33/34/Tower 21/12/33/34/Tower 21/12/33/34/Tower
Jaak:12/22/32/13/23/33/14/34
12/22/32/13/23/33/14/24/34
12/22/32/13/23/33/14/24/34
12/22/32/13/23/33/14/24/34
Light (Par)
1998 1999 2000 2001
Warren: 21/33/34/ 12/33/34/Tower 21/12/33/34/Tower 21/12/33/34/Tower
Jaak:12/22/32/13/23/33/14/24/34
12/22/32/13/23/33/14/24/34
12/22/32/13/23/33/14/24/34
12/22/32/13/23/33/14/24/34
Relative Humidity
1998 1999 2000 2001
Warren: 21/33/34/ 12/33/34/Tower 21/12/33/34/Tower 21/12/33/34/Tower
Vapor Press. Deficit?
1998 1999 2000 2001
Jaak:12/22/32/13/23/33/14/24/34
12/22/32/13/23/33/14/24/34
12/22/32/13/23/33/14/24/34
12/22/32/13/23/33/14/24/34
Carbon Dioxide
1998 1999 2000 2001
Jaak:12/22/32/14/24/34
12/22/32/14/24/34 12/22/32/14/24/34 12/22/32/14/24/34
Ozone
1998 1999 2000 2001
Jaak:13/23/33/14/24/34
13/23/33/14/24/34 13/23/33/14/24/34 12/22/32/14/24/34
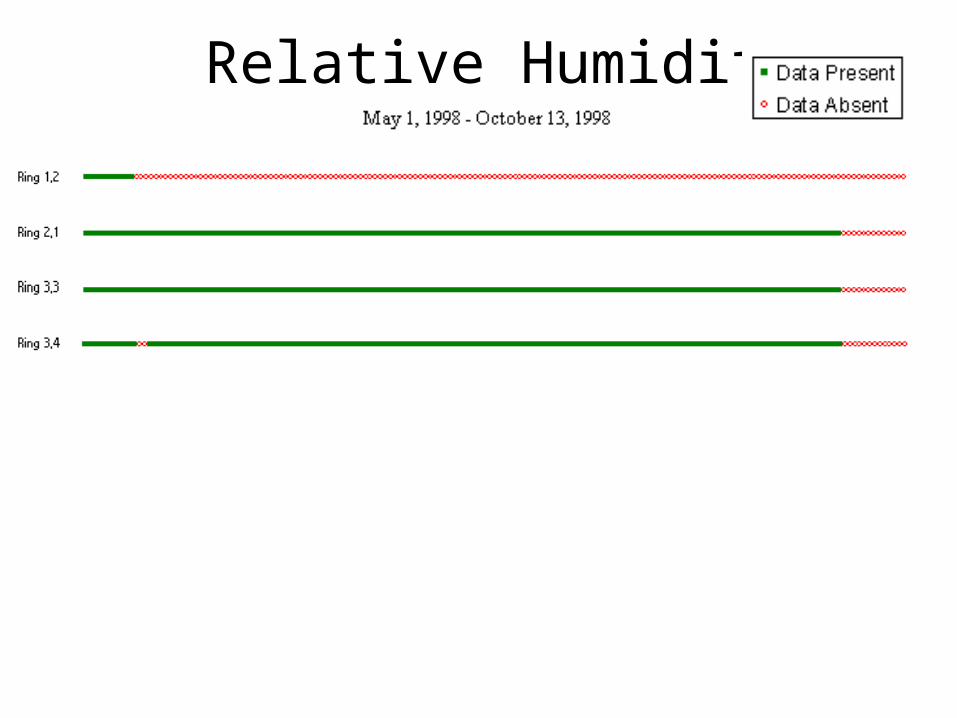
Relative Humidity
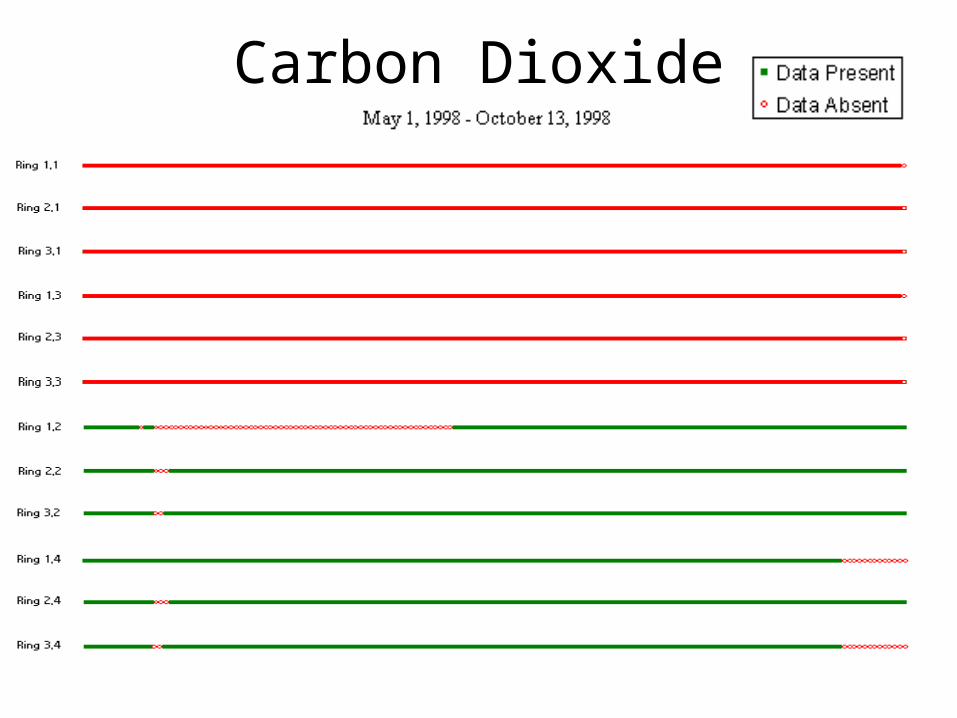
Carbon Dioxide
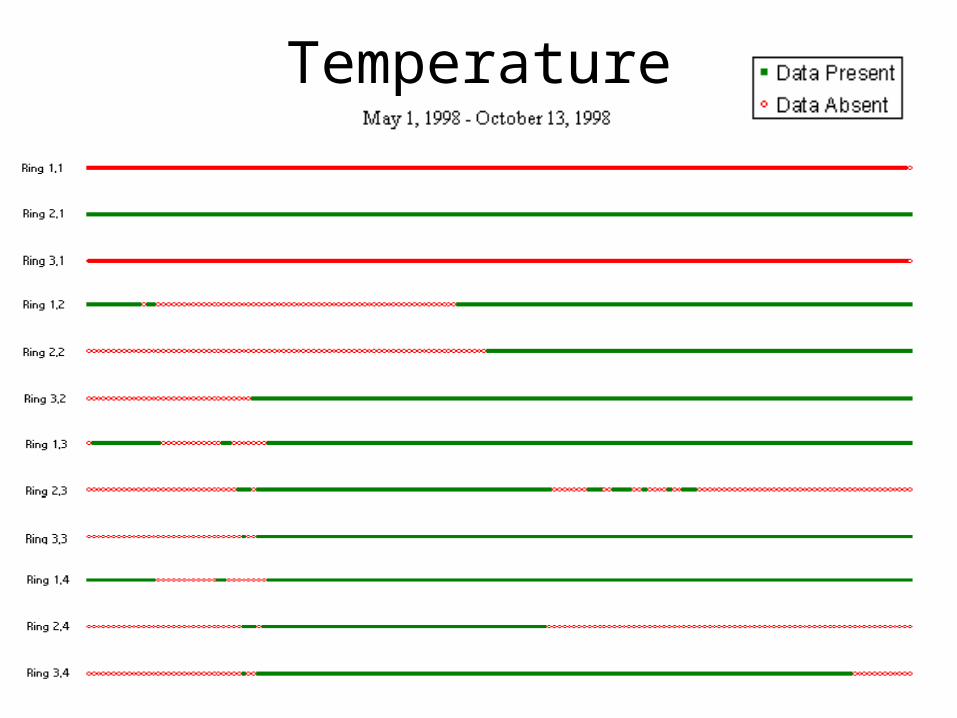
Temperature
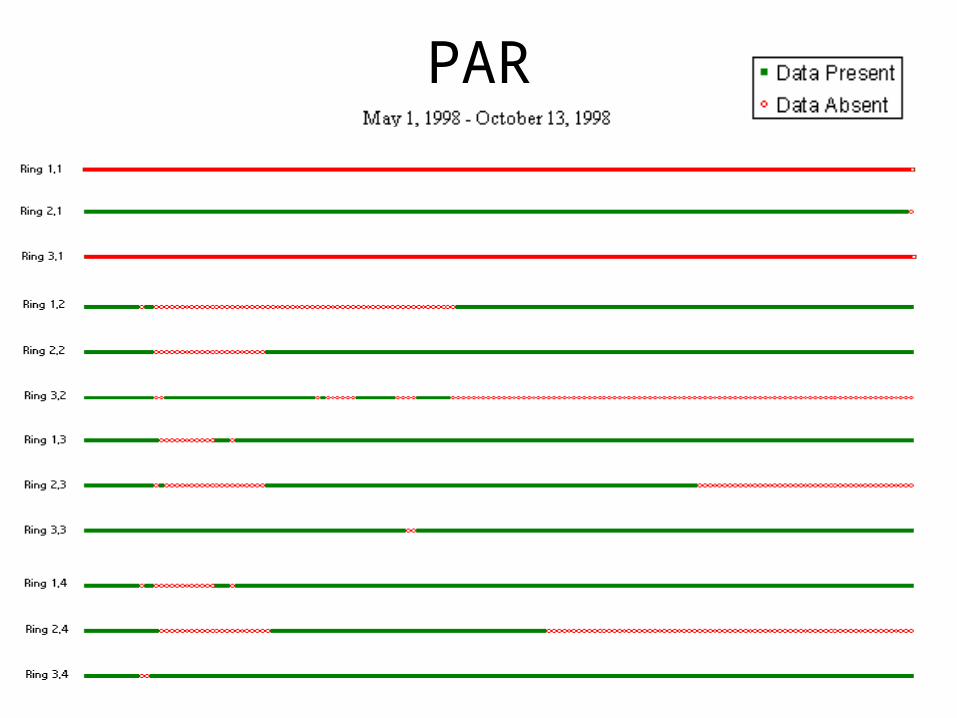
PAR
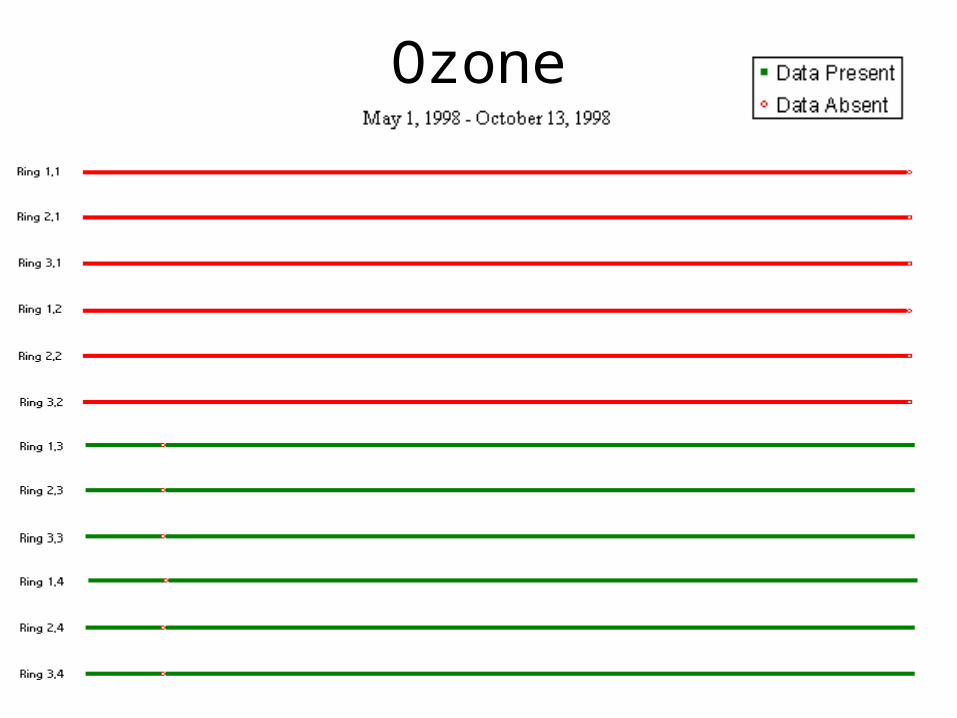
Ozone
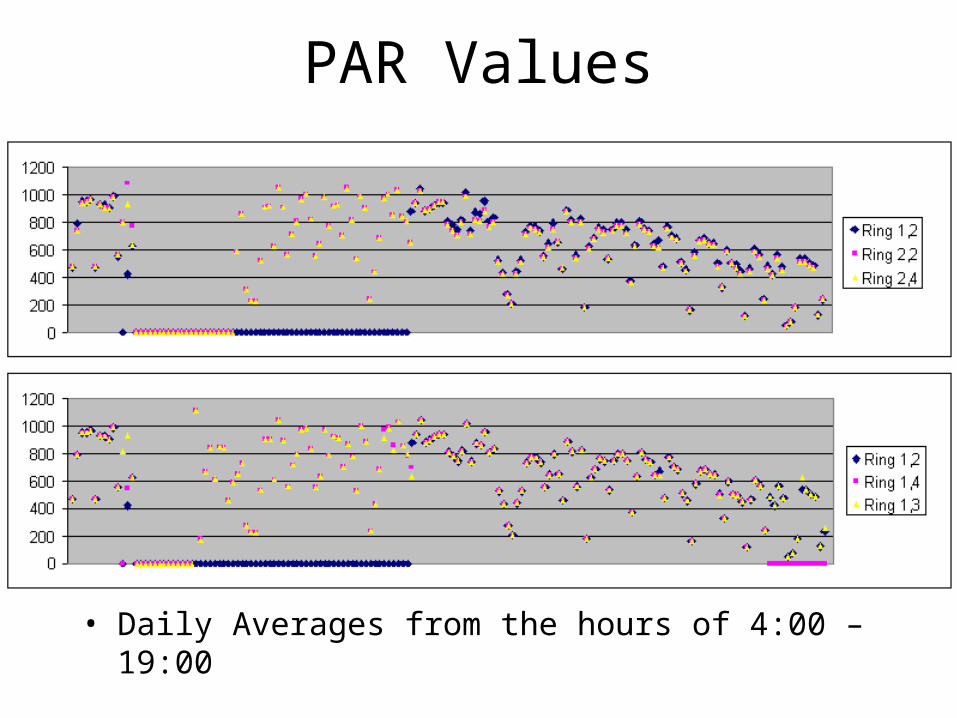
PAR Values
• Daily Averages from the hours of 4:00 – 19:00
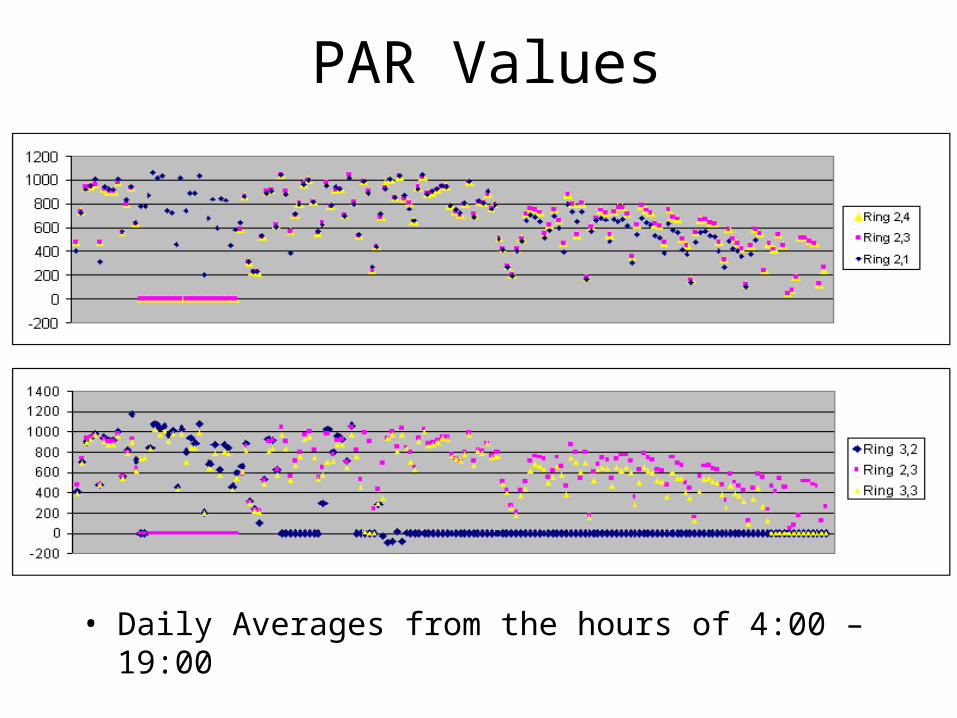
PAR Values
• Daily Averages from the hours of 4:00 – 19:00
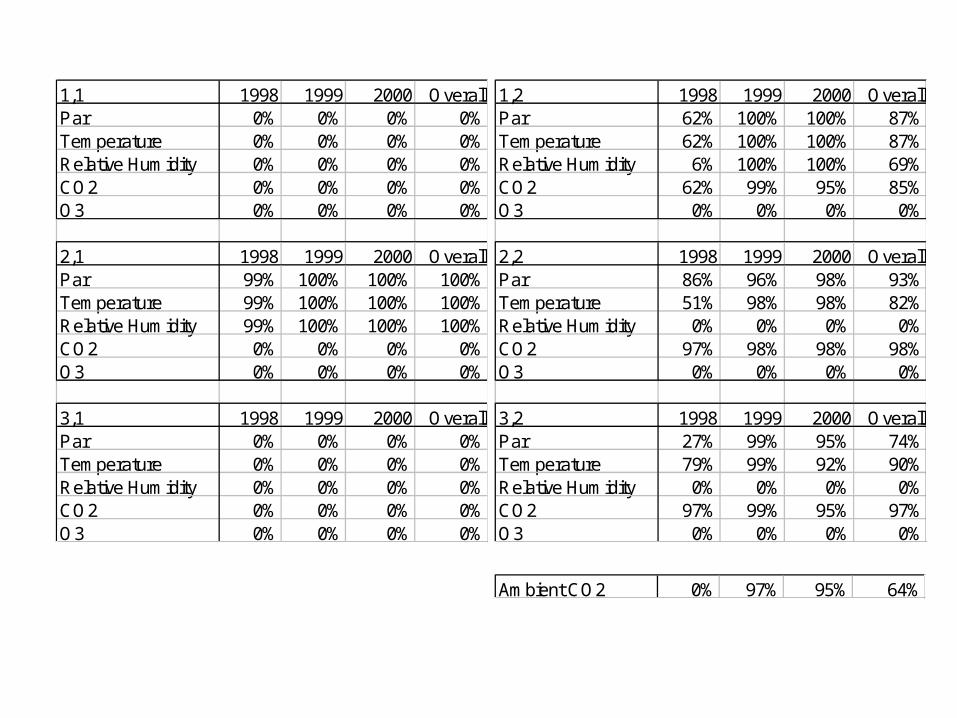
1,1 1998 1999 2000 OverallPar 0% 0% 0% 0%Temperature 0% 0% 0% 0%Relative Humidity 0% 0% 0% 0%CO2 0% 0% 0% 0%O3 0% 0% 0% 0%
2,1 1998 1999 2000 OverallPar 99% 100% 100% 100%Temperature 99% 100% 100% 100%Relative Humidity 99% 100% 100% 100%CO2 0% 0% 0% 0%O3 0% 0% 0% 0%
3,1 1998 1999 2000 OverallPar 0% 0% 0% 0%Temperature 0% 0% 0% 0%Relative Humidity 0% 0% 0% 0%CO2 0% 0% 0% 0%O3 0% 0% 0% 0%
1,2 1998 1999 2000 OverallPar 62% 100% 100% 87%Temperature 62% 100% 100% 87%Relative Humidity 6% 100% 100% 69%CO2 62% 99% 95% 85%O3 0% 0% 0% 0%
2,2 1998 1999 2000 OverallPar 86% 96% 98% 93%Temperature 51% 98% 98% 82%Relative Humidity 0% 0% 0% 0%CO2 97% 98% 98% 98%O3 0% 0% 0% 0%
3,2 1998 1999 2000 OverallPar 27% 99% 95% 74%Temperature 79% 99% 92% 90%Relative Humidity 0% 0% 0% 0%CO2 97% 99% 95% 97%O3 0% 0% 0% 0%
Ambient CO2 0% 97% 95% 64%
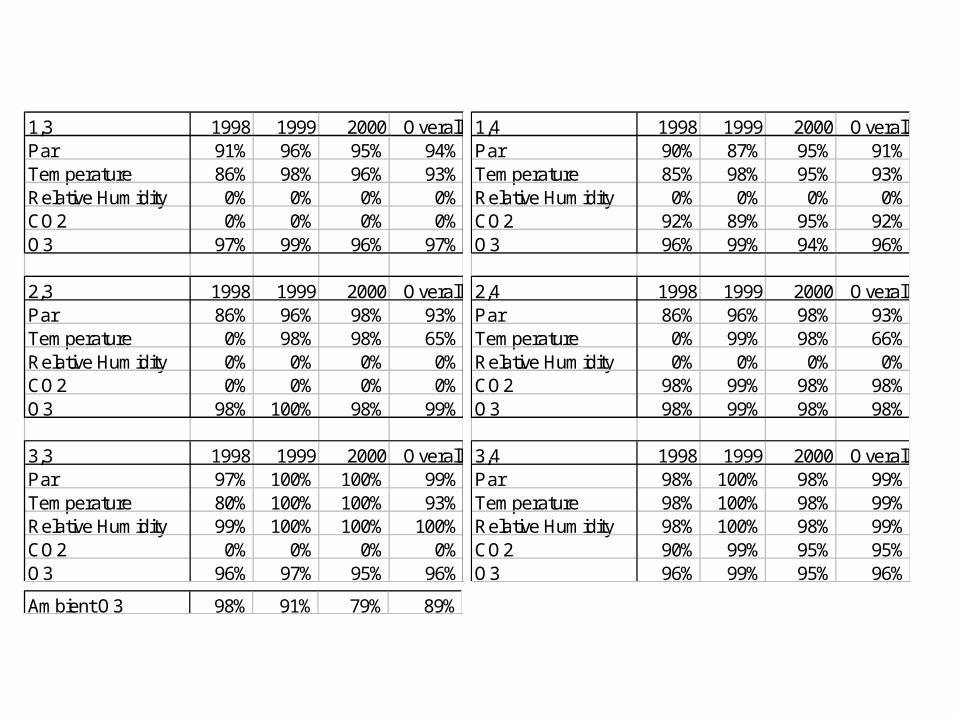
1,3 1998 1999 2000 OverallPar 91% 96% 95% 94%Temperature 86% 98% 96% 93%Relative Humidity 0% 0% 0% 0%CO2 0% 0% 0% 0%O3 97% 99% 96% 97%
2,3 1998 1999 2000 OverallPar 86% 96% 98% 93%Temperature 0% 98% 98% 65%Relative Humidity 0% 0% 0% 0%CO2 0% 0% 0% 0%O3 98% 100% 98% 99%
3,3 1998 1999 2000 OverallPar 97% 100% 100% 99%Temperature 80% 100% 100% 93%Relative Humidity 99% 100% 100% 100%CO2 0% 0% 0% 0%O3 96% 97% 95% 96%
1,4 1998 1999 2000 OverallPar 90% 87% 95% 91%Temperature 85% 98% 95% 93%Relative Humidity 0% 0% 0% 0%CO2 92% 89% 95% 92%O3 96% 99% 94% 96%
2,4 1998 1999 2000 OverallPar 86% 96% 98% 93%Temperature 0% 99% 98% 66%Relative Humidity 0% 0% 0% 0%CO2 98% 99% 98% 98%O3 98% 99% 98% 98%
3,4 1998 1999 2000 OverallPar 98% 100% 98% 99%Temperature 98% 100% 98% 99%Relative Humidity 98% 100% 98% 99%CO2 90% 99% 95% 95%O3 96% 99% 95% 96%
Ambient O3 98% 91% 79% 89%

Macros and Queries
• I have macros and queries for creating the 1 minute data from Jaak and also macros for converting the ½ hour data from Warren into 1 hour data.
Some Things to Note
• Averaged daily. If there is one value in the 16 hours then the report says we have a value for the day.
• Ambient data is just taken at several places in case of
problems with the equipment. According to researchers at the FACE site, they can be combined to get one ambient supply.
• Decisions on what data to throw out. There are a lot of
zeros in the data, as well as negative values for temperature