Embed Size (px)
Citation preview

16/10/2017
1
Data collection to optimise technical and
economic [email protected]
+31-6-51118024
Programme Training Expert Broiler Management Part 2
Welcome 9:00
Data collection to optimise technical and economic results 9:30
Coffee break 10:30
Ventilation principles for broilers in hot climates 11:00
Lunch 12:00
Water quality in broiler houses 13:00
Antibiotics in Indonesia / Holland or Poultry Diseases 14:00
Coffee break 14:30
Innovations in the broiler sector based on AFM 15:00
Closing ceremony. Certificates after training part 2 16:00
End 16:30
16/10/2017
2
Data collection in the DIFS‐LIVE program
Technical and economic data
Differences between farms
Experiment: cheap feed, cheap chicks or both?
Open vs closed houses: pay‐back time

16/10/2017
3
Data collection in the DIFS‐LIVE program
Technical and economic data
Differences between farms
Experiment: cheap feed, cheap chicks or both?
Open vs closed houses: pay‐back time
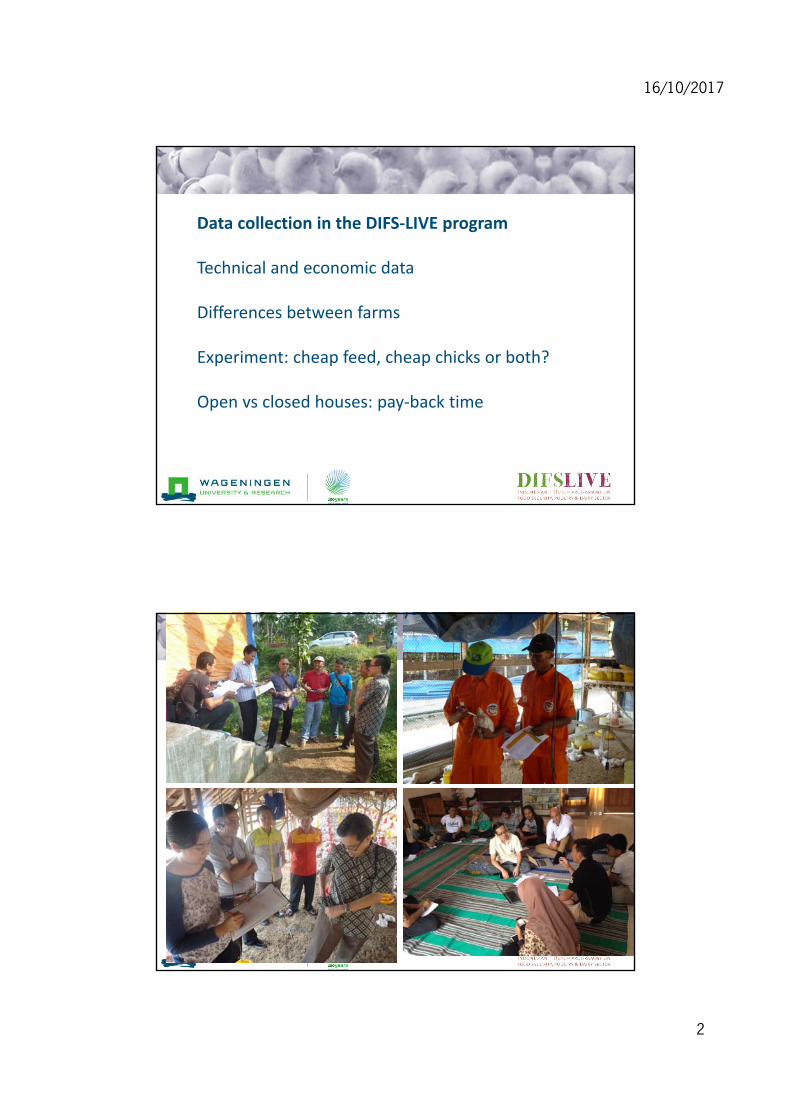
Manual data collection
general data
house dimensions
number of bird places,
cleaning time
performance data
‐ body weight development
‐ feed consumption,
‐ mortality,
‐ slaughter age.

16/10/2017
4
Economic data
price of the day old chicks,
feed,
broiler selling price at the gate
other costs
‐ electricity,
‐ water,
‐ heating / gas,
‐ health care,
‐ litter,
‐ catching and transport,
‐ cleaning,
‐ carcass disposal.
Based on this, we calculate feed margin per 100 broilers:
slaughter income – feed and day‐old chick price per round and per year.
An overview of the other costs can be made per 100 broilers, which gives an estimate for the annual income of the broiler farm.
Using this data, the pay‐back time can be estimated of any quality investment.

16/10/2017
5
Age House temp BW (R308) BW (farm) Feed (R308) Bags required per day Feed given Mortality Cum. Mortality Chicks removed Chicks present
d ºC g g g (#50 kg bags) (#50 kg bags) #/d # # #
↓ fill in ↓ ↓ fill in ↓ ↓ fill in ↓ ↓ fill in ↓ ↓ fill in ↓
0 29‐6‐2015 42
1 30‐6‐2015 52 15 1 8 8 5547
2 1‐7‐2015 66 15 2 8 16 5539
3 2‐7‐2015 81 20 2 10 26 5529
4 3‐7‐2015 100 20 3 5 31 5524
5 4‐7‐2015 122 20 3 4 35 5520
6 5‐7‐2015 148 30 4 5 40 5515
7 6‐7‐2015 177 30 4 4 44 5511
8 7‐7‐2015 208 205 30 5 4 48 5507
9 8‐7‐2015 242 35 5 3 51 5504
10 9‐7‐2015 279 40 6 3 54 5501
11 10‐7‐2015 320 45 6 4 58 5497
12 11‐7‐2015 364 50 7 4 62 5493
13 12‐7‐2015 410 55 7 5 67 5488
14 13‐7‐2015 459 60 8 5 72 5483
15 14‐7‐2015 511 530 66 8 4 76 5479
16 15‐7‐2015 567 72 9 4 80 5475
17 16‐7‐2015 626 78 10 5 85 5470
18 17‐7‐2015 688 84 11 4 89 5466
19 18‐7‐2015 753 90 11 5 94 5461
20 19‐7‐2015 822 96 12 6 100 5455
21 20‐7‐2015 891 102 12 5 105 5450
22 21‐7‐2015 964 965 109 13 6 111 5444
23 22‐7‐2015 1039 116 13 5 116 5439
24 23‐7‐2015 1115 123 14 8 124 5431
25 24‐7‐2015 1193 130 14 15 139 5416
26 25‐7‐2015 1272 137 14 10 149 5406
27 26‐7‐2015 1353 1353 144 14 15 164 1770 3621
28 27‐7‐2015 1436 1436 151 10 6 170 750 2865
29 28‐7‐2015 1521 1521 158 8 5 175 2415 445
30 29‐7‐2015 1608 15 165 5 5 180 435 5
31 30‐7‐2015 1697 172 2 5 185 0
16/10/2017
6
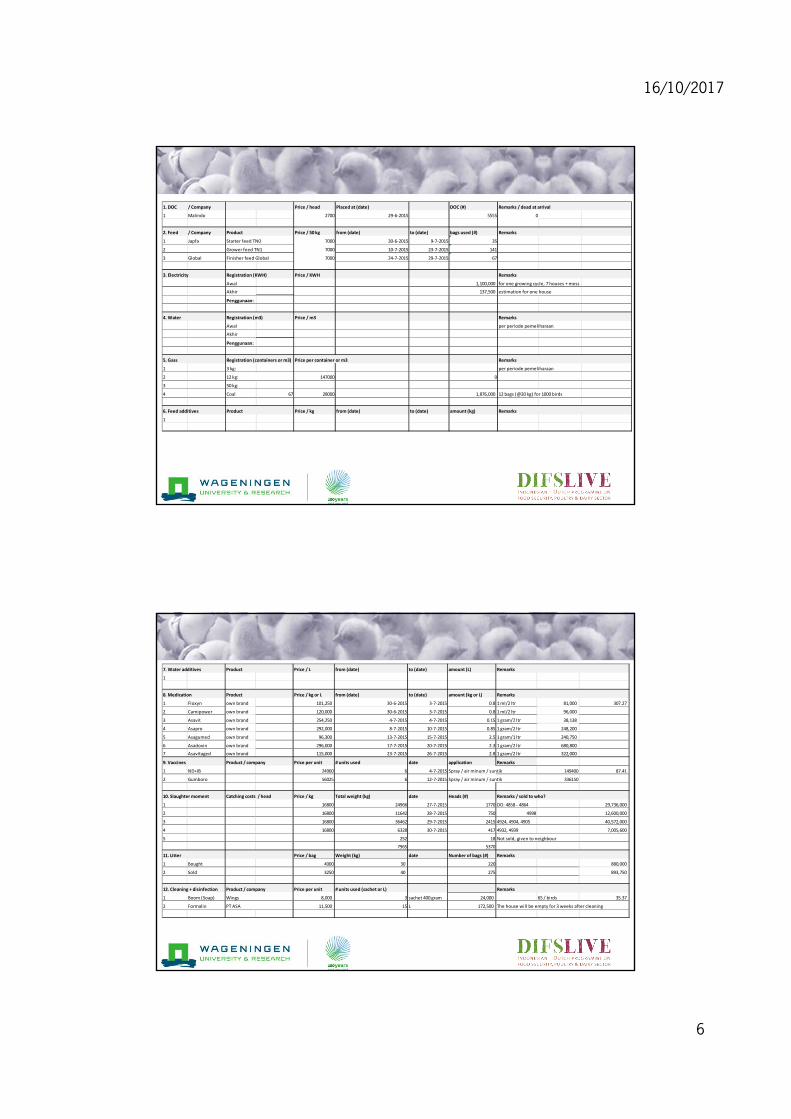
1. DOC / Company Price / head Placed at (date) DOC (#) Remarks / dead at arrival
1 Malindo 2700 29‐6‐2015 5555 0
2. Feed / Company Product Price / 50 kg from (date) to (date) bags used (#) Remarks
1 Japfa Starter feed TN0 7000 30‐6‐2015 9‐7‐2015 35
2 Grower feed TN1 7000 10‐7‐2015 23‐7‐2015 141
3 Global Finisher feed Global 7000 24‐7‐2015 29‐7‐2015 67
3. Electricity Registration (KWH) Price / KWH Remarks
Awal 1,100,000 for one growing cycle, 7 houses + mess
Akhir 137,500 estimation for one house
Penggunaan:
4. Water Registration (m3) Price / m3 Remarks
Awal per periode pemeliharaan
Akhir
Penggunaan:
5. Gass Registration (containers or m3) Price per container or m3 Remarks
1 3 kg: per periode pemeliharaan
2 12 kg: 147000 0
3 50 kg:
4 Coal 67 28000 1,876,000 12 bags (@20 kg) for 1000 birds
6. Feed additives Product Price / kg from (date) to (date) amount (kg) Remarks
1
7. Water additives Product Price / L from (date) to (date) amount (L) Remarks
1
8. Medication Product Price / kg or L from (date) to (date) amount (kg or L) Remarks
1 Floxyn own brand 101,250 30‐6‐2015 3‐7‐2015 0.8 1 ml/2 ltr 81,000 307.27
2 Carnipower own brand 120,000 30‐6‐2015 3‐7‐2015 0.8 1 ml/2 ltr 96,000
3 Asavit own brand 254,250 4‐7‐2015 4‐7‐2015 0.15 1 gram/2 ltr 38,138
4 Asapro own brand 292,000 8‐7‐2015 10‐7‐2015 0.85 1 gram/2 ltr 248,200
5 Asagumed own brand 96,300 13‐7‐2015 15‐7‐2015 2.5 1 gram/1 ltr 240,750
6 Asadoxin own brand 296,000 17‐7‐2015 20‐7‐2015 2.3 1 gram/2 ltr 680,800
7 Asavitaged own brand 115,000 23‐7‐2015 26‐7‐2015 2.8 1 gram/2 ltr 322,000
9. Vaccines Product / company Price per unit # units used date application Remarks
1 ND+IB 24900 6 4‐7‐2015 Spray / air minum / suntik 149400 87.41
2 Gumboro 56025 6 12‐7‐2015 Spray / air minum / suntik 336150
10. Slaughter moment Catching costs / head Price / kg Total weight (kg) date Heads (#) Remarks / sold to who?
1 16800 24966 27‐7‐2015 1770 DO: 4858 ‐ 4864 29,736,000
2 16800 11642 28‐7‐2015 750 4998 12,600,000
3 16800 36462 29‐7‐2015 2415 4924, 4904, 4905 40,572,000
4 16800 6328 30‐7‐2015 417 4932, 4939 7,005,600
5 252 18 Not sold, given to neighbour
7965 5370
11. Litter Price / bag Weight (kg) date Number of bags (#) Remarks
1 Bought 4000 30 220 880,000
2 Sold 3250 40 275 893,750
12. Cleaning + disinfection Product / company Price per unit # units used (sachet or L) Remarks
1 Boom (Soap) Wings 8,000 3 sachet 400 gram 24,000 65 / birds 35.37
2 Formalin PT ASA 11,500 15 L 172,500 The house will be empty for 3 weeks after cleaning

16/10/2017
7
Input Broilers Price / unit AmountH1-R1 (€) (€)
Production period days 30 Per 100 DOC per round house E-R1
Cleaning period days 30 Profits
BW to slaughter g 1483 Kg slaughter ready chicken 143.4 Rp 16,800 Rp 2,408,857 Mortality % 3.33 Minus: costs DOC and feedFeed (kg) kg 12150 - DOC 100 Rp 2,700 Rp 270,000 BW (kg) kg 7965 - feed 218.7 Rp 7,000 Rp 1,531,053
FCR kg feed/kg growth 1.53 Feed gain 607,804Rp
Stocking density #/m2 9 326,023Rp
DOC price IDR/doc 2,700Rp Feed price IDR/100 kg 700,000Rp Minus: other costs per 100 birdsBroiler price IDR/kg 16,800Rp * Electricity Rp 2,475
Water Rp - Other costs per 100 birds Heating / gas / charcoal Rp 33,771 Electricity 2,475Rp Feed additives Rp - Water -Rp Water additives Rp - Heating / gas / charcoal 33,771Rp Health care - medicines Rp 30,727 Feed additives -Rp Health care - vaccinations Rp 8,741
Water additives -Rp Litter (dry rice hulls) Rp 15,842 Health care - medicins 30,727Rp Litter (manure sold) Rp -16,089 Health care vaccines 8,741Rp Catching and transport Rp -
Litter (dry rice hulls) 15,842Rp Cleaning Rp 3,537
Litter (manure sold) -16,089 Rp Levies Rp -
Catching and transport -Rp Carcass disposal Rp -
Cleaning 3,537Rp Gross margin 528,800Rp Levies -Rp 3,216,864Rp Carcass disposal -Rp Gross margin per m 2 per year 283,646Rp
E‐R1 (€)
DOC 5555
per round 29,374,813 1,836
per year 178,696,776 11,169
REPORT house 1-R1 Units
Feed gain per m 2 per year
Gross margin per 100 placed DOC per year
Data collection in the DIFS‐LIVE program
Technical and economic data
Differences between farms
Experiment: cheap feed, cheap chicks or both?
Open vs closed houses: pay‐back time

16/10/2017
8
Production data Average Farm A Farm B
Round - 1 1Date of arrival doc d0 - 1-9-2015 29-6-2015
DOC # 4779 3000 5555Surface m2 457 400 630Stocking density #/m2 10.5 7.5 8.8
Production period d 30 24 30
Cleaning period d 26 14 30
Slaughter weight g 1339 1106 1483
Mortality % 6.0 5.3 3.3Feed kg 8855 5200 12150BW kg 5905 3139 7965FCR kg/kg 1.52 1.66 1.53
EconomicsDOC price IDR/doc 3,864 3,900 2,700Feed price IDR/kg 6,967 6,797 7,000Broiler price IDR/kg 18,119 16,504 16,800
Profits per 100 DOC
Slaughter ready chicken kg 126 105 143
Income IDR 2,276,489 1,728,950 2,408,857
Costs per 100 DOC Average Farm A Farm B
DOC IDR 386,364 390,000 270,000
Feed IDR 1,278,180 1,179,633 1,531,053
Electricity IDR 10,377 29,167 2,475
Water IDR - -
Heating / gas / charcoal IDR 55,548 46,500 33,771
Feed additives IDR 25,982 -
Water additives IDR 3,269 -
Health care - medicines IDR 34,264 12,321 30,727
Health care - vaccinations IDR 11,043 8,603 8,741
Litter (dry rice hulls) IDR 25,449 30,250 15,842
Litter (manure sold) IDR -16,170 -16,089
Catching and transport IDR 6,000 -
Cleaning IDR 14,702 25,800 3,537
Levies IDR - -
Carcass disposal IDR - -

16/10/2017
9
Margin per 100 DOC Average Farm A Farm B
Feed gain IDR 558,238 159,317 607,804
Gross margin IDR 416,460 15,974 528,800
Gross margin per year IDR 2,727,477 153,430 3,216,864
Gross margin per m2 per year IDR 307,282 11,507 283,646
Margin per house
per round IDR 18,749,791 479,206 29,374,813
per year IDR 121,653,035 4,602,895 178,696,776
per round EUR 1,172 30 1,836
per year EUR 7,603 288 11,169
Data collection in the DIFS‐LIVE program
Technical and economic data
Differences between farms
Experiment: cheap feed, cheap chicks or both?
Open vs closed houses: pay‐back time

16/10/2017
10
Figure 1. Prices for slaughter ready chicken, day old chicks (doc) and feed in 2014‐2015, averaged for the districts of Bogor, Sukabumi, Bandung, Bekasi and Tangerang.
Ways to reduce costs?

16/10/2017
11
General data
Control Cheap feed Cheap chicks Cheap feed + cheap chicks
FarmHouse Kandang 1+6 Kandang 4+5 Kandang 2 Kandang 3type of house open house open house open house open housebuild in what year 1990 1990 1990 1990type of floor sand sand sand sandventilation natural natural natural natural# floors 1 1 1 1roof pointed pointed pointed pointedwater Manual drinker Manual drinker Manual drinker Manual drinkerwater from own well own well own well own wellfeed Manual pans Manual pans Manual pans Manual pans
Production periodRound 3 3 3 3Date of arrival doc (d0) 3‐2‐2017 3‐2‐2017 3‐2‐2017 3‐2‐2017# DOC 7,400 7,600 3,800 4,000Surface (m2) 740 760 380 400#DOC/m2 10.0 10.0 10.0 10.0Production period (d) 33.5 35.0 32.0 35.0Cleaning period (d) 21.0 21.0 21.0 21.0BW to slaughter (g) 1,399 903 1,288 935Mortality (#) 405 821 527 687Mortality (%) 10.9 21.6 13.9 17.2Feed (kg) 8,550 8,900 7,900 8,700BW (kg) 4,687 3,063 4,320 3,026FCR (kg/kg) 1.82 2.91 1.83 2.88
EconomicsControl Cheap feed Cheap chicks Cheap feed
+ cheap chicksDOC price (IDR) 5,275 5,275 4,000 4,000 Feed price (IDR/kg) 6,656 5,743 6,662 5,743
Broiler price (IDR/kg) 16,000 16,000 16,000 16,000
Profits per 100 DOCSlaughter ready chicken (kg) 142.2 103.3 132.0 91.3
Slaughter ready chicken (IDR) 2,275,894 1,653,358 2,111,628 1,461,298Litter (manure sold, IDR) 21,622 21,053 21,053 20,000

16/10/2017
12
Costs per 100 DOCControl Cheap feed Cheap chicks Cheap feed
+ cheap chicksDOC (IDR) 527,500 527,500 400,000 400,000Feed (IDR) 1,906,820 1,944,319 1,821,201 1,864,604
Electricity (IDR) ‐ ‐ ‐ ‐Water (IDR) ‐ ‐ ‐ ‐Heating / gas / charcoal (IDR) 32,432 31,579 31,579 30,000Feed additives (IDR) ‐ ‐ ‐ ‐
Water additives (IDR) ‐ ‐ ‐ ‐Health care ‐medicines (IDR) 12,281 12,281 12,281 12,281Health care ‐ vaccinations (IDR) 17,405 16,947 16,947 16,100
Litter (dry rice hulls) (IDR) 30,000 30,000 30,000 30,000Catching and transport (IDR) ‐ ‐ ‐ ‐Cleaning (IDR) 6,940 6,757 6,757 5,405Levies (IDR) ‐ ‐ ‐ ‐
Carcass disposal (IDR) ‐ ‐ ‐ ‐
Margins per 100 DOCControl Cheap feed Cheap chicks Cheap feed
+ cheap chicksFeed gain per round (IDR) ‐158,426 ‐818,461 ‐109,572 ‐803,306Gross margin per round (IDR) ‐235,863 ‐894,973 ‐186,084 ‐877,092
Gross margin per year (IDR) ‐1,582,922 ‐5,833,308 ‐1,281,523 ‐5,716,761Gross margin per m2 per year (IDR) ‐428 ‐1,535 ‐337 ‐1,429
Margins per houseper round (IDR) ‐8,726,941 ‐34,008,988 ‐7,071,200 ‐35,083,686per year (IDR) ‐58,568,102 ‐221,665,723 ‐48,697,885 ‐228,670,454per round (EUR) ‐545 ‐2,126 ‐442 ‐2,193
per year (EUR) ‐3,661 ‐13,854 ‐3,044 ‐14,292

16/10/2017
13
Cheap feed is very costly!Cheap chicks for open houses?
What about buying very expensive feed of premium quality?
Data collection in the DIFS‐LIVE program
Technical and economic data
Differences between farms
Experiment: cheap feed, cheap chicks or both?
Open vs closed houses: pay‐back time

16/10/2017
14
Economics of closed versus open broiler housesPeter van Horne, Wageningen Economic Research, the NetherlandsRick van Emous, Wageningen Livestock Research, the NetherlandsBubun Setiawan Hirawan, Medion, Indonesia
Traditional open broiler house with a high roof, natural ventilation, open side walls and manual feeding.
Closed broiler house with two floors with a low ceiling, tunnel ventilation, (semi) closed side walls (with plastic curtains) and automatic feeding.
We assume that on both farms 40,320 broilers are kept (average in Indonesia).
Open housing: 7 houses of 8 meter wide and 80 meter long. The total ground surface area of the open house is 4,480 m2. The average density is 9 broilers per m2 poultry house. The average empty period between flocks is 28 days.
Closed housing: 2 levels in a house of 12 meter wide and 105 meter long. The total ground surface area of the house is 1,260 m2. The total surface available for the broilers is 2,520 m2 (2 levels)The average density is 16 broilers per m2 living area. The average empty period between flocks is 28 days.

16/10/2017
15
Table 1. Production performance data in open and closed broiler housing: average, farm A en farm B.
Table 2. Investment (IDR per m2 ground surface area) for building, electricity, equipment and generator on a broiler farm with open and closed housing and total investment (IDR).

16/10/2017
16
Table 3. Production costs (in IDR per broiler housed and per kg live weight) for open and closed broiler housing in West Java, Indonesia.
The payback period is calculated taking the total investment for the closed house divided by the annual cash flow. To estimate annual cash flow, a farm gate price of 16,000 IDR per kg live weight was used. For the basic situation the payback period is 4.5 years (Table 4).
Table 4. Payback period for a closed house at different production results and prices.

16/10/2017
17
Before a farmer can invest in closed housing for broilers, some conditions have to be met.
1) a location has to be available with a good connection to the electricity network. Access to reliable electricity is essential for climate control in the closed house with mechanical ventilation. In case of power cuts, a back-up system is necessary, such as a generator.
2) better qualified workers are needed to manage the poultry house. These workers need the knowledge and skills to control the climate and to use the other automated equipment. In most cases, a higher payment is needed for a part of the workers to attract these qualified workers.
3) investments in closed housing are high -> loan. Generally, 70 to 80% of the total investment can be financed by a loan, 20 to 30% should be funded by the farmer. Banks in Indonesia have strict conditions for loans in the poultry sector. Showing good production results and keeping record of technical data and financial results of several previous years (usually 3) is often needed to convince the bank of the potential of the investment. Some banks have special programmes for investments in closed housing.
The production costs per kg final live weight on a farm with closed broiler housing in West Java, Indonesia, were 11% lower than on a farm with open broiler housing, because of better production performance.
With the same growing period, a farm with closed housing has higher final live weight, lower feed conversion, and lower mortality. The payback period of an investment in closed housing was estimated at 4.5 years on average.
On a farm with good production performance, the payback period can be even shorter than 4.0 years. The payback period is highly dependent on the farm gate revenue price, feed price and day-old chicks price.
16/10/2017
18
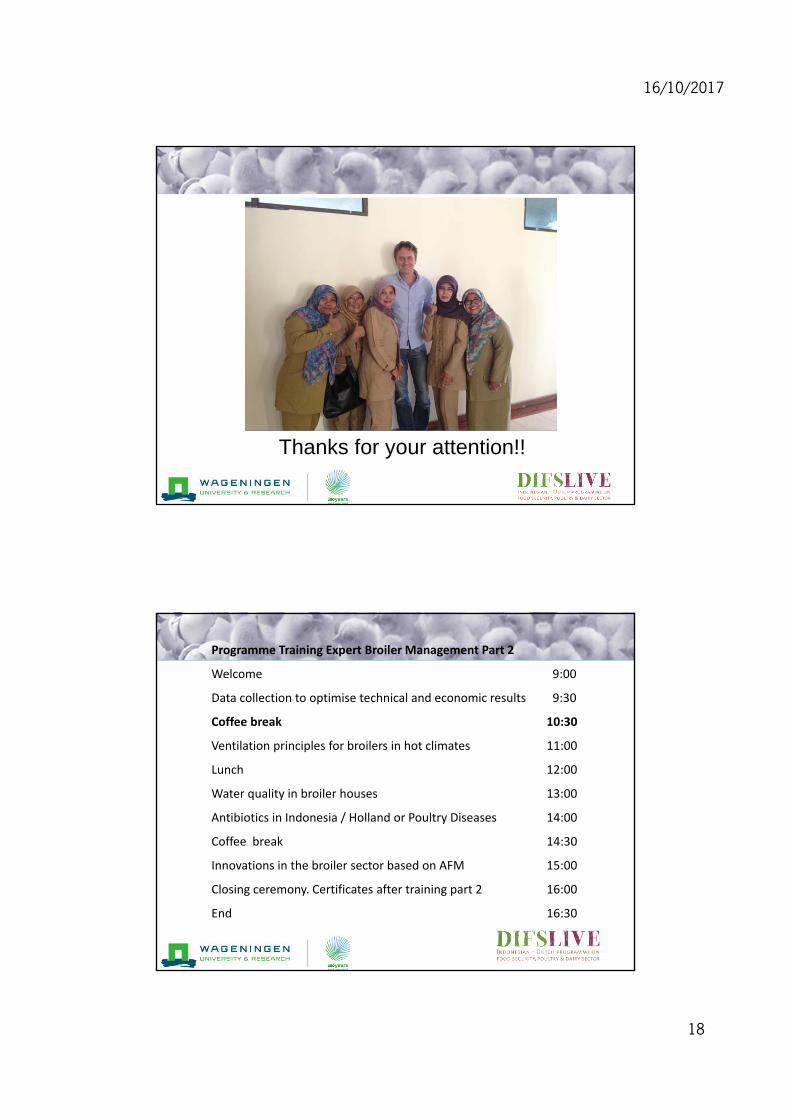
Thanks for your attention!!
Programme Training Expert Broiler Management Part 2
Welcome 9:00
Data collection to optimise technical and economic results 9:30
Coffee break 10:30
Ventilation principles for broilers in hot climates 11:00
Lunch 12:00
Water quality in broiler houses 13:00
Antibiotics in Indonesia / Holland or Poultry Diseases 14:00
Coffee break 14:30
Innovations in the broiler sector based on AFM 15:00
Closing ceremony. Certificates after training part 2 16:00
End 16:30