Embed Size (px)
Citation preview

Data Collection and Labeling of Real-Time IoT-EnabledBio-Signals in Everyday Settings for Mental Health Improvement
Ali TazarvElectrical Eng. & Computer Science
University of CaliforniaIrvine, California, USA
Sina LabbafComputer Science
University of CaliforniaIrvine, California, USA
Amir M. RahmaniSchool of Nursing, Computer Science
University of CaliforniaIrvine, California, [email protected]
Nikil DuttComputer Science
University of CaliforniaIrvine, California, USA
Marco LevoratoComputer Sciecne
University of CaliforniaIrvine, California, USA
ABSTRACTReal-time physiological data collection and analysis play a centralrole in modern well-being applications. Personalized classifiers anddetectors have been shown to outperform general classifiers inmany contexts. However, building effective personalized classifiersin everyday settings - as opposed to controlled settings - necessi-tates the online collection of a labeled dataset by interacting withthe user. This need leads to several challenges, ranging from build-ing an effective system for the collection of the signals and labels,to developing strategies to interact with the user and building adataset that represents the many user contexts that occur in dailylife. Based on a stress detection use case, this paper (1) builds asystem for the real-time collection and analysis of photoplethysmo-gram, acceleration, gyroscope, and gravity data from a wearablesensor, as well as self-reported stress labels based on Ecological Mo-mentary Assessment (EMA), and (2) collects and analyzes a datasetto extract statistics of users’ response to queries and the quality ofthe collected signals as a function of the context, here defined asthe user’s activity and the time of the day.
CCS CONCEPTS•Computer systems organization→ Sensor networks; •Human-centered computing → User studies.
KEYWORDSPPG in everyday settings, Health systems user behaviour, Healthdata labeling.
ACM Reference Format:Ali Tazarv, Sina Labbaf, Amir M. Rahmani, Nikil Dutt, and Marco Levorato.2021. Data Collection and Labeling of Real-Time IoT-Enabled Bio-Signals
Permission to make digital or hard copies of all or part of this work for personal orclassroom use is granted without fee provided that copies are not made or distributedfor profit or commercial advantage and that copies bear this notice and the full citationon the first page. Copyrights for components of this work owned by others than ACMmust be honored. Abstracting with credit is permitted. To copy otherwise, or republish,to post on servers or to redistribute to lists, requires prior specific permission and/or afee. Request permissions from [email protected] ’21, September 9–11, 2021, Roma, Italy© 2021 Association for Computing Machinery.ACM ISBN 978-1-4503-8478-0/21/09. . . $15.00https://doi.org/10.1145/3462203.3475918
in Everyday Settings for Mental Health Improvement. In Conference onInformation Technology for Social Good (GoodIT ’21), September 9–11, 2021,Roma, Italy. ACM, New York, NY, USA, 6 pages. https://doi.org/10.1145/3462203.3475918
1 INTRODUCTIONThis study stems from the UNITE project housed at the Univer-sity of California, Irvine. The goal of the project is to improve thewell-being of pregnant women in underrepresented communitiesby integrating in-home visitations with wearable-based fine grainmonitoring and interventions. The focus is on detecting and miti-gating stress, a key indicator of pregnancy outcomes.
Within this context, in this paper we analyze the feasibility of anonline learning strategy, whose final objective is building a stressdetector by collecting a labeled dataset associating physiologicalsignals to stress labels. Different from prior studies, we focus onevery day settings, where there are no restrictions on movementsand the environment, and subjects are doing normal daily routines.
In addition to the development of an effective system for thereal-time collection of data, this scenario presents several inher-ent challenges related to the data toward the training of effectiveclassifiers. Intuitively, one of the key challenges is the quality ofthe physiological signals, which may depend on several factors,including motion, and thus activity [2, 5]. However, a critical aspectis the response of the user to the queries (EMA). The user contextmay influence willingness to respond and the response time, thusaffecting how representative the dataset is of the user’s activitiesand the correlation between samples and labels.
This paper makes the following contributions:• We build and deploy a three-tiered system for the collection andreal-time analysis of labeled stress data. The system is composedof wearable sensors, an edge layer and a cloud server. We discusssystem-level challenges that impact data acquisition capabilities.•While the tiered system is capable of acquiring a large number ofphysiological signal samples, the user may be willing to label only asmall fraction of them. We then develop a strategy to request labelsbased on the signal itself even in the absence of a prebuilt classifier.The strategy aims to collect a number of samples proportional tothe density of samples in the feature space, but also capture outliersand rare events.
arX
iv:2
108.
0116
9v1
[cs
.CY
] 2
Aug
202
1
GoodIT ’21, September 9–11, 2021, Roma, Italy Tazarv, et al.
• We collect a dataset from a group of volunteers in everydaysettings. Specifically, we collect biosignals photoplethysmogram(PPG) along with the movement data – Acceleration, Gyroscope andGravity – from sensors on a smart watch in a real-time scheme, andcollect self reported stress levels from participants. The raw signals(PPG, ACC, Gyro and Gra) are collected in a window of 2 minutes,once every 15 minutes. The list of labels we collect includes mentalstress level, emotional status and physical activity.• We study the quality of the signals and the willingness of theuser to respond to queries as a function of the current context, heredefined in terms of user’s activity and the time of the day. We alsoshow distribution plots of response time and response rate of users,during our experiment. On average the response rate is usuallylower in early morning (7-9 AM) and higher in early afternoon (2-3PM), and response time shows a different distribution for differentactivities. We analyze the quality of PPG signals for each predefinedactivity separately, and show that during the activities with lessmovements, the measured signal has better quality. We analyze thetemporal correlation of samples as a function of context (activities)and show that consecutive samples are more similar to each other,compared to distant samples.
The rest of the paper is organized as follows: This paper startsby describing the system model and architecture used for data col-lection and sending queries for labels, highlighting the challengesintroduced by the system constraints in Section 2. Section 3 de-scribes our strategy for sending queries and collecting labels forthe data optimally in the absence of a prebuilt classifier. Section 4describes our approach and the methods we used for analysis of thecollected data. Section 5 presents the results of the analysis, in termsof coverage of sample space with labeled data, contextual analysis,signal quality, and user behaviour analysis in different contexts andon different self reported stress levels. Finally, Section 6 concludesthe paper with a summary and directions for future work.
2 SYSTEM MODELFirst, we describe the system we developed to enable data collectionand real-time interaction with the user. As shown in Fig. 1, thesystem is composed of three tiers: sensor layer, edge layer and cloudlayer. The sensor layer which is a smart watch, collects the rawsignals while the cloud layer performs feature extraction and othercomputationally expensive and power consuming tasks, includingselecting a portion of the samples to be labeled by the user.
We provide users with an interface to report labels in the formof a smart-phone application. The smartphone app asks the par-ticipants to label the samples through an Ecological MomentaryAssessment (EMA), in which push notifications queries the partic-ipant about their stress level, recent physical activity or physicalstate (e.g. sitting, standing, etc.). The phone also functions as agateway, building a connection path for the smart watch to transferthe sensor data to the cloud layer (through the internet connectionon the phone). In the following, we describe each layer in detailand discuss the challenges we encountered for data collection usingwearables in everyday settings.
Wearable Sensor
Body Area
Gateway
Smart Phone
User Side Remote
Cloud Server
Information and notification panel
For monitoring
Researcher’s Interface
MetaHealth:-PPG- 3D Accelerometer-Gyroscope-Gravity
~ 2kB/s
Foreground App
- Pushup Notifications- EMAs (Labels)- Daily and Weekly Surveys
- Daily activity pattern- Data analytics- Label Collection- Machine Learning
Notifications
Data Collection and Transfer Services
Instructions, EMAs, Surveys
Raw signals & data, Survey Responses
BLE: Raw signals and
contextual data
WiFi / LTE
WiFi/LTE
BLE
WiFi: Raw signals, some contextual data
Figure 1: Overview of the system architecture.
2.1 Sensor LayerWe selected a wearable platform capable of acquiring and trans-mitting raw physiological (PPG) and motion (Accelerometer, Gy-roscope and Gravity) signals. Specifically, we use Samsung GearSport smartwatches and developed a service in Tizen that is capa-ble of collecting raw PPG, accelerometer, gyroscope and gravitysignals and sending them to the cloud in real-time. The samplingfrequency of the sensors is 20𝐻𝑧. The watch can send the datadirectly to the cloud layer if it is connected to a local Wi-Fi (path1) or through through the internet connection on the smartphone(path I) as explained later.
The data collection application on the sensor layer includes twoservices and a user interface (UI). The first service collects thesensor data at a constant rate (once every 15 minutes) and duration(2-minute intervals) and sends it to the cloud in real-time. If theservice fails to send the data immediately, the data sample is storedon the watch and transferred to the server at a later time. The UI isa simple app on the watch for restarting these two services.
2.2 Cloud LayerA cloud web-server receives the data samples from the watch andimmediately initiates processing. Based on the observed featuresof each incoming sample, an internal logic determines whether ornot to trigger the EMA to collect a label from the user. If triggered,it sends a signal to the smartphone and a push notification appearson the screen, if the user opens it, the UI (a phone app) showsa questionnaire composed of simple questions corresponding tolabels. The responses are then transferred to the cloud. The samples,features and labels are stored in a MongoDB database.
2.3 Edge LayerThe sensor is connected to a smartphone via Bluetooth Low Energy(BLE). If the watch is not connected to a local Wi-Fi, in order tosend the collected data to the cloud, the watch proxies the phone’sinternet connection (path 2) through BLE. This setting is energyefficient, and thus suitable for everyday setting applications. Thisback up connection route is designed to take effect when the watch
Data Collection and Labeling of Real-Time IoT-Enabled Bio-Signals in Everyday Settings for Mental Health Improvement GoodIT ’21, September 9–11, 2021, Roma, Italy
is not directly connected to a local Wi-Fi router. Additionally, wedesigned a UI for the smartphone (android and iOS apps) in orderto communicate with the users and collect the labels.
2.4 ChallengesFrom a system perspective, the first design challenge is to set themonitoring duration and frequency such that: 1. The total delayfrom data acquisition to the EMA notification is tolerable, 2. Powerconsumption matches the characteristics of the devices and userrequirements, 3. The sample quality allows meaningful feature ex-traction, and 4. The signals provide a meaningful representation oftemporal variations. Note that the capacity of the wireless channelconnecting the watch to the smartphone is extremely limited.
2.4.1 End-to-End Delay. First, we measured the bandwidth of theBLE proxy Internet connection manually to characterize hardwarelimitations. The maximum data-rate is approximately 80𝑘𝐵/𝑠 . Asthe sensor generates 2𝐾𝐵/𝑠 of data, the upload time for each minuteof data is only 1.5s. The processing time at the server is negligiblecompared to the upload time.
After collecting and sending the EMA, there is a small delayuntil the notification appears on the phone. This delay depends oninternet connection, type of the phone and the mode the phone isoperating on (power saving, etc.). However, this delay is typicallysmall compared to the users’ response time.
2.4.2 Power Limitations on theWatch. Tomeasure power consump-tion, we first used the watch without any monitoring services andmeasured the battery lifetime, and compared it with that observedwith the monitoring system continuously active. The measuredbattery lifetimes are ∼ 40 hours and ∼ 10 hours, respectively. Inorder to extend battery lifetime to 24 hours (to allow for nightimerecharging), we then need to keep the monitoring system active forat most 22% of the time. This limits our ability to collect continuoussignals over extended periods of time, and raises the issue of howto shape a parsimonious sample collection strategy.
2.4.3 Sampling Times and Signals Duration. We determine samplecollection based on the considerations above. Importantly, the datacollection window plays an important role in the quality of PPGsignals. However, if the window duration is increased, then weare forced to do the measurement fewer times throughout the day.As shown in [1], a 2-minute time window of PPG/ECG signal canprovide us with sufficiently accurate extraction of the majorityof Heart Rate Variability (HRV)1 features. Hence, By setting theminimum duration of data samples to 2 minutes, sampling every 15minutes will satisfy all system constraints described above whileextending the battery life to up to 42 hours in practice.
3 DATA COLLECTIONThe ultimate goal of data collection is to train personalized clas-sifiers that can detect mental health status based on biosignals(PPG) and signals describing motion (Accelerometer, Gyroscopeand Gravity). One of the key challenges in collecting such datasetsin everyday settings is the interaction with the users, as sendingqueries for labeling too often can be overwhelming and may lower1Heart Rate Variability or HRV is a set of informative features including statistics ofheart beats that can be extracted from PPG signals.
Resting Sitting Standing Walking Eating7 AM 9 AM 12:30 PM 1:30 PM 3 PM
80 minutes ∞ (no response) 30 min
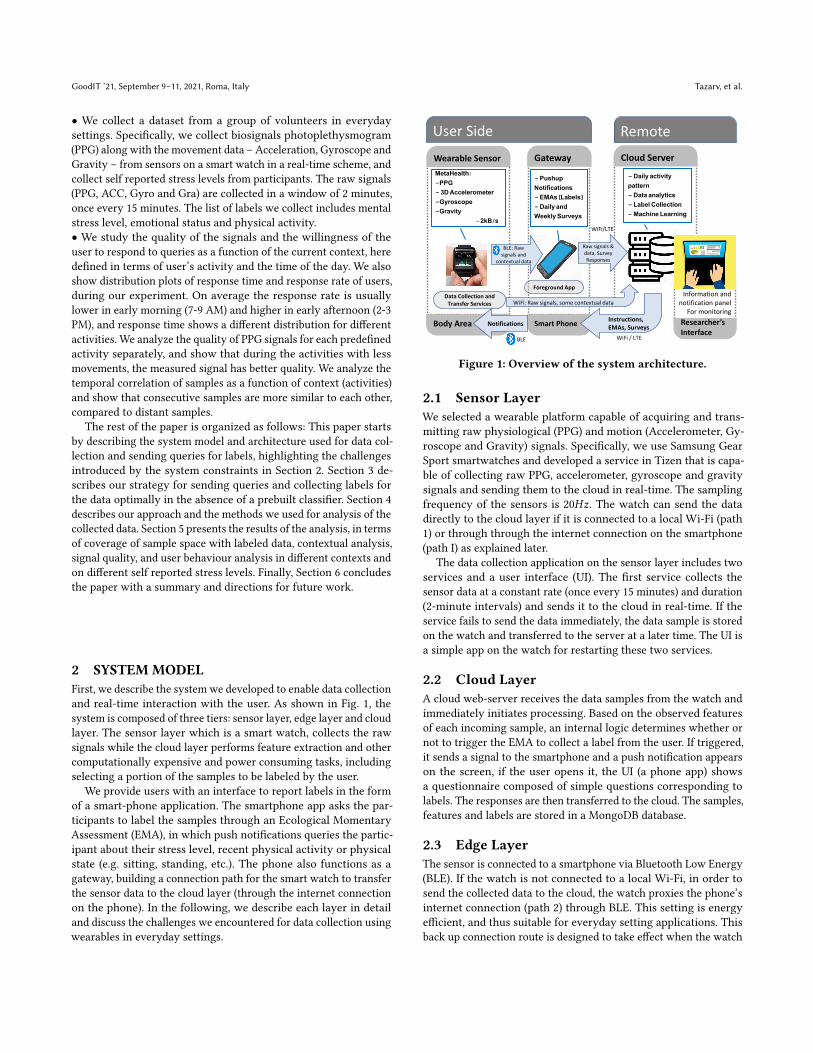
Figure 2: Example of Data collection in everyday setting.
response rate and eventually degrade the dataset. Intuitively, thesystem should parsimoniously trigger the EMA to collect a label tobuild a meaningful dataset as quickly as possible without imposingexcessive burden on the user. To this aim, we devised a selectionmethod that triggers the labeling query based on statistics of thepreviously collected and current samples.
Figure 2 represents such a data collection scenario. Samples arecollected once every fifteen minutes (red pointers), green arrowscorrespond to the EMA notifications, and the vertical blue arrowscorrespond to responses from the user.
The list of labels we collect through the EMA includes stresslevels (not at all, a little bit, some, a lot, and extremely), emotions(sad, mad, neutral or happy), and recent activities or physical status(e.g., sitting, walking, jogging, etc.). Later in this section we describehow we select a portion of samples to be labeled.
3.1 Data Cleaning and Feature ExtractionBefore we apply the selection method, we pre-process the raw sig-nals and extract the corresponding features (using HeartPy Package[6]). When the raw PPG sample is received at the cloud layer, itis first passed through a Butterworth band-pass filter to clean upthe high and low frequency noises. The band-pass filter is of order3, with cut off frequencies set at (0.7𝐻𝑧, 3.5𝐻𝑧), corresponding to42𝑏𝑝𝑚 and 210𝑏𝑝𝑚) respectively. Then the signal is passed througha moving average filter (length = 0.75 seconds). We, then, apply apeak detector to the filtered signal. Using the peak points of thefiltered signal, we extract thirteen features from each sample (win-dow). These features are: BPM, IBI, SDNN, SDSD, RMSSD, pNN20,pNN50, MAD, SD1, SD2, S, SD1/SD2, and BR2. We use these featuresfor further processing and decision makings.
3.2 Strategy for Labeling Selected DataData collection consists of an Initial Phase and a Query Phase:
Initial Phase:We start the procedure by observing the first Nsamples for each subject to get an estimate of the distribution ofsamples in the sample space for that subject. In this phase we do notcollect any labels.We used N = 100 in our experiment. It is importantto note that different subjects might have different patterns in theirPPG which can result in personalized distributions in the samplespace. This motivates the need to estimate the distribution of thedata for each subject separately.
Query Phase: For samples after the initial phase, we trigger theEMA for a subset of samples. The probability of triggering the EMA2BPM: Beats per Minute, Heart Rate. IBI: Inter-Beat Interval, average time intervalbetween two successive heart beats (called NN intervals). SDNN: Standard Deviationof NN intervals. SDSD: Standard Deviation of Successive Differences between adjacentNNs. RMSD: Root Mean Square of Successive Differences between the adjacent NNs.pNN20: The proportion of successive NNs greater than 20ms (or 50ms for pNN50).MAD:Median Absolute Deviation of NN intervals. SD1 and SD2: Standard Deviationsof the corresponding Poincaré plot. S: Area of ellipse described by SD1 and SD2. BR:Breathing Rate.

GoodIT ’21, September 9–11, 2021, Roma, Italy Tazarv, et al.
for each sample is proportional to the density of the region of thesample. This way, if a sample falls in a region in which there hasbeen a large number of unlabeled samples it is more likely that wetrigger the EMA. For each region, after we collect sufficient numberof labels, we stop collecting labels. However, all the probabilityvalues (for all the regions) are clipped on the bottom at P = 0.1. Soif a samples falls in a region where there is little or no previoussamples, the probability of query is still non-zero. This results inexploring unseen regions, as well as more dense regions.
The ultimate goal of this experiment is to train a personalizedclassifier to predict mental health conditions. In order to do that,we need to collect enough labeled data, such that they optimallycover the sample space. To measure how the labeled samples coverthe sample space we need a measure.
If we define all the incoming samples as 𝑋 = {𝑥0, 𝑥1, ..., 𝑥𝑀 },labeled samples as𝑈𝑖 = {𝑢0, 𝑢1, ..., 𝑢𝑖 } (𝑈𝑖 ⊂ 𝑋 ) and the correspond-ing labels as 𝑌𝑖 = {𝑦0, 𝑦1, ..., 𝑦𝑖 } (𝑌𝑖 is the set of labels collected upto label number i), we then define the coverage metric as:
𝐹𝐷 (𝑖) = card( {𝑥 ∈ 𝑋 | ∥𝑥 − 𝑢∗∥ > 𝐷} )card(X)
in which 𝑢∗ is the closest labeled sample to the sample 𝑥 , card isthe cardinality of the set, and 𝐷 is a distance constant. Note that𝑢𝑘 or 𝑥𝑘 are each a vector of 13 elements (features), extracted froma PPG sample (window size 2 minutes). As we collect more labels,we count the number of samples which are farther than a certainthreshold 𝐷 to the closest labeled sample collected up to that point.The ratio between this number and the total number of samplesgives us a metric 𝐹𝐷 (𝑖) ∈ [0, 1]. The smaller this metric, the betterlabeled samples represent the entire data.
4 PROCESSING AND EVALUATION METHODS4.1 Signal QualityThe quality of PPG signal is among the most important factorsto consider when collecting data in everyday settings. Due to thearchitecture of PPG sensors, PPG signals are highly prone to motionand noise artifacts (MNA) [3], which can make them unreliable, es-pecially in everyday-settings. Therefore, a signal quality assessmenton the collected signal is essential.
Several quality assessment indices for PPG signals are proposedin the literature. In this study we use five different indices [4]:Variation in Skewness of Heart Cycles measures the variations inasymmetry in distribution of peaks in the heart cycles; Variationin Kurtosis of Heart Cycles evaluates the variations in flatnessor peakedness level of the heart cycles; Variation in approximateEntropy of Heart Cycles evaluates the variations in complexityof the heart cycles; Shannon Entropy obtains the level of noisein a segment of PPG signal; and Spectral Entropy calculates thesignal complexity in frequency domain. For all of these five indicesthe lower values indicate a more reliable signal. These indices areextensively described in [4] with formal definition for each.
4.2 Activity DetectionWe collect data fromAccelerometer, Gyroscope, andGravity sensorsas well as the PPG signal. Each of these signals (except PPG) aremeasured in 3 dimensions (𝑥,𝑦, 𝑧) and can be used to detect user’s
Table 1: Size of partitions based on predicted activity
ACTIVITY: Sit Stand Walk Jog Others Total
Samples: 31,040 5,919 3,849 12 33,254 74,074Percent: %41.9 %8.0 %5.2 %0.016 %44.9 %100
activity during each measurement. The MNA in PPG signals showdifferent patterns depending on users’ activities. So if we partitionsamples based on the type of activity, data in each partition mightbe easier to analyze.
To do that, we need an activity detector. We used a publiclyavailable dataset [7] and trained a Random Forest classifier on thisdataset to build an activity detector. The external dataset consistsof accelerometer and gyro data from 51 subjects, and labeled with18 different activities. We selected the activities that are expectedto be more common in everyday settings (sitting, standing, walking,and Jogging), kept these labels and changed the rest of them toothers. We then trained our activity detector on this dataset. Afterfine tuning the model parameters, the activity detector showed 84%accuracy on leave-two-subjects-out evaluation method (trained on49 subjects and tested on two subjects). We then used this trainedclassifier to predict the dominant activity during the measurementof each sample in our dataset. Then we partition our collecteddata into subsections based on those activities. The distribution ofpredicted activities on the entire dataset is shown in Table 1.
5 DATA ANALYSIS AND RESULTSWe proposed a labeling query engine that determines (in real-time)what samples are interesting to be labeled by the user. We collectraw biosignals (PPG) and raw movement data in durations of 2minutes, up to 4 times per hour from fourteen volunteers (tenmales and four females) over periods of time between 1 week to 3months for different subjects. The corresponding labels come fromself reported EMAs which are triggered for some samples. Table 2presents the total number of samples we have collected throughoutthe experiment, along with the number of labels, and the number oflabels that could be assigned to a sample (labels that had a samplewithing 16 minutes around them).
We now analyze the dataset, using the methods and metrics de-fined in Section 4. Analysis include coverage of sample space, tem-poral correlations of samples, quality of PPG signals, and responsetime/rate of subjects in different contexts in everyday settings.
5.1 Sample space CoverageIn section 3 we defined a coverage metric 𝐹𝐷 (𝑖) that quantifieshow well the labeled samples cover the sample space. Labeledsamples that cover the sample space proportionally and optimallyare an important requirement for training a classifier that predictshuman health and well-being. A plot of this metric over the numberof labeled samples for one subject and for the threshold distance𝐷 = 1.5 is presented in Figure 3. In this plot the sample spacecoverage metric goes from around 1 to less than 0.1 as we collectthe first 100 labels (generally it depends on the response rate butfor this user it took about 3 weeks).

Data Collection and Labeling of Real-Time IoT-Enabled Bio-Signals in Everyday Settings for Mental Health Improvement GoodIT ’21, September 9–11, 2021, Roma, Italy
Table 2: Number of samples and labels for each subject
Subject S01 S02 S03 S04 S05 S06 S07 S08 S09 S10 S11 S12 S13 S14 Total
Samples 4,580 2,164 1,764 2,580 2,267 17,552 10,087 2,752 1,236 7,910 2,555 12,296 3,738 1,332 74,074Total labels 228 101 67 56 68 376 105 96 53 119 73 956 47 61 2,406Used labels 217 92 42 53 59 370 101 93 50 104 60 942 45 55 2,283
Figure 3: Fraction of unlabeled data that are farther than dis-tance D = 1.5 from the closest labeled point.
5.2 Temporal correlation of samplesIn the procedure of collecting labels, sometimes users cannot re-spond to the push notifications quickly enough for the sample to bemeaningful. One important question then is how quickly humans’status (e.g., stress level, emotional status, and the correspondingphysiological effects) changes. We submit queries for labels onlya few times each day and obtain responses for a fraction of them.As a result, the correlation between the sample and the label maydegrade. Thus, we perform a temporal analysis of the collected sam-ples for several contexts. Specifically, we observe how the averagedistance of samples evolves in the sample space over time.
Two plots of the average distance of samples that are T minutesapart are presented in Figures 4 and 5 for various contexts andstress levels, on the data from one subject. The important takeawayfrom these two plots is that consecutive samples (15 minutes apart)are similar to one another, but for samples that are farther than 15minutes apart, there is no significant or consistent similarity (theaverage distance almost saturates at 30 minutes and after). Thispattern is consistent among various contexts, various stress levels,and also various subjects.
In summary, we observe that different activities and stress levelsinfluence the coherence of the collected samples, which may affectthe ability of the system to detect stress levels in various activitiesand user situations.
5.3 Data Quality AnalysisQuality of PPG signals is one of the biggest challenges whilst col-lecting data in everyday-settings, therefore a quality analysis ofthe collected data is essential. We use the five SQIs introduced insection 4.1 for the quality assessment of samples, and perform aseparate analysis for each activity.
The distributions of the five SQI for various activities are shownin Figure 6. As expected, with increased motion all the five indices
15 30 45 60 75 90Time difference (minutes)
2.5
3.0
3.5
4.0
4.5
5.0
Avera
ge D
ista
nce
in s
am
ple
sp
ace
Standing, 6 samples
Walking, 79 samples
Sitting, 241 samples
Lying down, 105 samples
Figure 4: Average distance of samples (after normalizing thefeatures) VS. their time distance for subject S12.
15 30 45 60 75 90Time difference (minutes)
3.0
3.2
3.4
3.6
3.8
4.0
4.2
Avera
ge d
ista
nce
in s
am
ple
sp
ace
not at all, 147 samples
a little bit, 470 samples
some, 269 samples
a lot, 56 samples
Figure 5: Average distance of samples VS. their time differ-ence, for subject S12, for different reported stress levels.
show that data quality decreases among the data marked sitting,standing, walking, respectively. Since the number of samples pre-dicted as "Jogging" was too small, we didn’t include that in thisanalysis. We used the data from all the fourteen subjects.
5.4 Response Rate and Response timeResponse time is defined as the time it takes a user to respond anEMA after they receive the notification. In Figure 7 we present thecumulative density of response time while being in certain contexts(e.g. sitting, etc.). We can see from these CDF plots that users areless likely to respond to the EMA faster when they are Lying down,compared to other physical states (or activities).
Similar to the different activities, response time shows differentpatterns when users are in different reported stress levels. Figure 8presents the CDF and themedian (where the CDF is 0.5) for differentself reported stress levels. The pattern suggests that users are morelikely to respond faster when they are in stressful situations.
Response rate, defined as the ratio of the number of responsesto the number of queries over a period of time, is also analyzed

GoodIT ’21, September 9–11, 2021, Roma, Italy Tazarv, et al.
skewness kurtosis app_entrp shan_entrp spec_entrp
Signal Quality Indices
0
1
2
3
4
5
SQ
I Valu
es
Sitting, #32108
Standing, #6039
Walking, #3967
Others, #33939
Figure 6: Signal Quality Indices for various predicted activi-ties. A lower index means the sample is more reliable.
0 50 100 150 200 250 300Response Time (minutes)
0.0
0.2
0.4
0.6
0.8
1.0
Cum
ula
tive D
istr
ibuti
on (
CD
F)
Standing, #47 samples, median = 82 min
Walking, #52 samples, median = 100 min
Sitting, #644 samples, median = 102 min
Lying down, #185 samples, median = 152 min
Figure 7: Probability of getting a response within a timeframe while doing various self reported activities.
0 50 100 150 200 250 300Response Time (minutes)
0.0
0.2
0.4
0.6
0.8
1.0
Cum
ula
tive D
istr
ibuti
on (
CD
F)
not at all, #201 samples, median = 108 min
a little bit, #416 samples, median = 110 min
some, #263 samples, median = 118 min
a lot, #58 samples, median = 70 min
Figure 8: Probability of getting a response within a time-frame while in various self reported mental states.
here. Response rate varies at different hours of day, and also followsdifferent patterns among different subjects, but still some commonpatterns can be observed among all subjects. Figure 9 shows theaverage response rate over all the subjects for different hours ofday; response rate tends to be lower in early morning and higherin early afternoon.
6 CONCLUSIONS AND FUTUREWORKCollecting photoplethysmogram (PPG) signals with correspondingself reported labels in everyday settings is a big challenge. Ourstudy used the Samsung Gear Sport smart-watch as a sensor device
7 8 9 10 11 12 13 14 15 16 17 18 19 20 21 22 23Time of Day (Hour)
0.0
0.2
0.4
0.6
0.8
Avera
ge R
esp
onse
Rate
Figure 9: Average response rate vs. time of day
in a system for this phase of data collection and utilized a methodto improve the label collection procedure. The data were collectedfrom fourteen active volunteers in everyday settings. We tested ourpersonalized label query engine and performed a set of contextualanalysis on the data. The quality analysis on the biosignals confirmsthat these signals are more reliable in certain predictable contexts(i.e. in lower physical movements). A temporal analysis of the datashows that consecutive samples for one subject are similar, but thereis no consistent similarity between samples that are more than 15minutes apart. In addition, an analysis on users behaviour showssome clear patterns in response times and response rates at differenthours of day, and under different mental and physical status.
These observations motivate our future work that will utilizemore sophisticated methods (possibly variants of active learning) inthe labeling process. Better labels will allow us to design a classifierthat can possibly detect mental health conditions of the users basedon biosignals and contextual information – promising to providevaluable tools for mental health professionals to better diagnoseand treat emotional and stress problems in a context-aware andpersonalized manner.
ACKNOWLEDGMENTSThis work was partially supported by NSF Smart and ConnectedCommunities (S&CC) grant CNS-1831918.
REFERENCES[1] Hyun Baek, Chul-Ho Cho, Jaegeol Cho, and Jong-Min Woo. 2015. Reliability of
Ultra-Short-Term Analysis as a Surrogate of Standard 5-Min Analysis of Heart RateVariability. Telemedicine journal and e-health : the official journal of the AmericanTelemedicine Association 21 (2015). https://doi.org/10.1089/tmj.2014.0104
[2] Hee Jeong Han et al. 2020. Objective stress monitoring based on wearable sensorsin everyday settings. Journal of Medical Engineering & Technology 44, 4 (2020),177–189.
[3] YukaMaeda, Masaki Sekine, and Toshiyo Tamura. 2011. Relationship betweenmea-surement site and motion artifacts in wearable reflected photoplethysmography.Journal of medical systems 35, 5 (2011), 969–976.
[4] Aysan Mahmoudzadeh, Iman Azimi, Amir M Rahmani, and Pasi Liljeberg. 2021.Lightweight Photoplethysmography Quality Assessment for Real-time IoT-basedHealth Monitoring using Unsupervised Anomaly Detection. Procedia ComputerScience 184 (2021), 140–147.
[5] Emad Kasaeyan Naeini et al. 2019. A Real-time PPG Quality Assessment Approachfor Healthcare Internet-of-Things. Procedia Computer Science 151 (2019).
[6] Paul van Gent, Haneen Farah, N Nes, and Bart van Arem. 2018. Heart rate analysisfor human factors: Development and validation of an open source toolkit fornoisy naturalistic heart rate data. In Proceedings of the 6th HUMANIST Conference.173–178.
[7] GaryMWeiss. 2019. WISDM Smartphone and Smartwatch Activity and BiometricsDataset. UCI Machine Learning Repository: WISDM Smartphone and SmartwatchActivity and Biometrics Dataset Data Set (2019).