Embed Size (px)
Citation preview
Copyright © 2010 New York State Energy Research & Development Authority All rights reserved. This document may be transmitted in its entirety without modification. The document remains property of the New York State Energy Research & Development Authority. The user agrees not to hold NYSERDA liable for any damage that occurs either directly or indirectly as a result of the contained framework.
Green Data Center Alliance (GDCA)
Data Center Energy Efficiency Framework (DCEEF) Prepared by the Green Data Center Alliance Version 3.3 Initial release November 15, 2010

DATA CENTER ENERGY EFFICIENCY FRAMEWORK
Page 2 of 45
FOREWORD: The Data Center Energy Efficiency Framework (DCEEF) is a set of best
practices for reducing data center energy consumption. The framework reflects extensive input
on proven energy-reduction technologies and strategies from data center professionals, vendors
and industry experts. The framework was developed as part of an initiative by the New York
State Energy Research and Development Authority to provide data center professionals with
guidelines for evaluating facilities and generating practical remediation roadmaps for both
immediate and long-term energy savings.
The DCEEF explains not only how to build an efficient facility but also how to run a data
center efficiently. The framework takes a holistic approach by including best practices from
five distinct domains: facility design and engineering, information technology, process,
governance, and finance. Each domain establishes requirements that are organized into three
progressively more challenging performance levels. Compliance with higher levels requires
greater capital investment and effort, but provides commensurate efficiency gains.
The authors of the DCEEF encourage dissemination and adoption of the framework, because
those who adhere to its practices will not only reduce data-center operating costs but also
demonstrate a commitment to operating in an environmentally responsible manner.
The most recent copy of the framework can be freely downloaded from
http://www.greendca.org/framework/.

DATA CENTER ENERGY EFFICIENCY FRAMEWORK
Page 3 of 45
ACKNOWLEDGEMENTS: The DCEEF Project Team would like to express gratitude to the
framework‟s contributors for their dedication to the project. Special thanks goes to the
Advisory Board, which reviewed and critiqued the framework.
Project Team
Daniel Skutelsky, Derek Schwartz, and Mark Schwedel, Green Data Center Alliance
Chris Stump and Sue Andrews, NYSERDA
Advisory Board
Jamie Alessio, Quest Terry Rennaker, CBRE
Lydia Aouani, NRCan Steve Straight, State Farm
Randall Cole, Jones Lang LaSalle Gregg Rudinski, Morgan Stanley
Ryan Krier, Verizon Wireless Chris Street, Amazon.com
Gordon Lane, Suncor Energy Michael Swetz, State Street Corporation
Jonathan Mason, Bank of America Tom Traugott, CoreSite
Mark Bramfitt, Energy Consultant William Udall, JP Morgan Chase
Lou Rider, Aramark Brian Olsen & Team, Emerson
Contributors, Professional Services and Vendors
Herman Chan and Team, Raritan Chet Majewski, Structure
Jeff Gibbons, ICFI Mike Rowan, Viridity
Magnus K. Herrlin, Ph.D., ANCIS Incorporated David Smith, Sub-zero Engineering
Carrie Higbie, Siemon Jim Kretzmer, General Electric
William Kingrey, Tacoma Power Ralph Thomas and team, DBSi
Thomas Kutz, AEI Engineering Gary Thorton, CNet
Jeff Lux, Elliptical Solutions Thomas Corona, Jones Lang LaSalle
Lloyd Mainers, Sub-zero Engineering Richard Reyher, E-Bay
Bonnie Ward, Stream Global Services Peter Ross, Sentinel Benefits Group

DATA CENTER ENERGY EFFICIENCY FRAMEWORK
Page 4 of 45
Table of Contents
1. About the Data Center Energy Efficiency Framework (DCEEF)............................... 6
2. Framework Compliance ........................................................................................... 7 3. Applicability of Requirements ................................................................................... 9 4. Implementation Methodology and Additional Resources ....................................... 10
5. Reliability and Limitation of Liability ........................................................................ 11 6. Framework Requirements ...................................................................................... 11
Level I Requirements ................................................................................................................ 12
FA-1. Blanking Panel (Value 4.0) .................................................................................. 12 FA-2. Cable Management (Value 3.9) .......................................................................... 13
FA-3. Tile Perforation Placement (Value 4.2) ............................................................. 13 FA-4. Floor Cutout Seals (Value 4.0) ........................................................................... 14 FA-5. Equipment Placement and Orientation (Value 4.3) ......................................... 14
FA-6. Thermal set point (Value 4.5) .............................................................................. 15 IT-1 Consolidation (Value 4.9) .................................................................................... 16
PR-1. Data Center Zoning (Value 4.0) .......................................................................... 17 GO-1. Energy Efficiency Role Defined (Value 3.6) ..................................................... 18
FI-1 Energy Efficient IT Procurement (Value 3.4) .................................................... 19 Level II Requirements............................................................................................................... 21
FA-7. Containment Solution (Value 4.2) ...................................................................... 21 IT-2 Measurement & Verification (Value 3.9) ........................................................... 22
IT-3 Virtualization (Value 4.1) ...................................................................................... 23
IT-4 Enable Server Sleep Modes (Value 4.2) ........................................................... 24
PR-2. Configuration Management and Orphaned Servers (Value 3.8) ................... 25 PR-3. Capacity Management and Right Sizing (Value 3.4) ...................................... 26
PR-4. Service Level and Availability Management (Value 3.9) ................................ 28 GO-2. Continuous Improvement Program (Value 4.1) ............................................... 29 GO-3. Energy Policy (Value 3.9) .................................................................................... 30
GO-4. Establish and Track Performance Against Targets (Value 3.9) .................... 31 FI-2 Asset Refresh Rationalize (Value 3.5)............................................................... 32 Level III Requirements ............................................................................................................. 33
FA-8. CRAC/CRAH Placement (Value 3.3) ................................................................. 33
FA-9. Air-or Water-side economizers (Value 4.4) ....................................................... 34
FA-10. Energy Efficient UPS (Value 3.4) ....................................................................... 35 FA-11. Variable Frequency Drives (Value 3.7) ............................................................. 37
FA-12. High Efficiency Insulation and Roofing (Value 3.3) ......................................... 37
PR-5. Training & Awareness (Value 3.9) ..................................................................... 37
GO-5. Performance Pay (Value 3.5) .............................................................................. 39
GO-6. Rationalize Operational Risk (Value 3.8) .......................................................... 39
FI-3 Customer Charge Back (Value 3.4) ................................................................... 40
7. Additional Helpful Practices ................................................................................... 41
Appendix A: Glossary .................................................................................................... 43 TableA – Summary View of Framework Requirements by Domain ............................... 44 TableB – Summary View of Framework by Performance Level .................................... 45

DATA CENTER ENERGY EFFICIENCY FRAMEWORK
Page 5 of 45
Figure 1 - Framework Requirements ........................................................................................ 7
Figure 2 - Factors Determining Requirement Value ............................................................... 8
Figure 3 - DCEEF Implementation Methodology .................................................................. 10
Figure 4 - Blanking Panel & Airflow ......................................................................................... 12
Figure 5 - Cold Aisle Containment .......................................................................................... 21
Figure 6 - Server Energy Usage .............................................................................................. 27
Figure 7 - Domain Maturity ....................................................................................................... 30
Figure 8 – CRAC/CRAH orientation ........................................................................................ 33
Figure 9 - UPS Utilization to Efficiency ................................................................................... 36

DATA CENTER ENERGY EFFICIENCY FRAMEWORK
Page 6 of 45
1. About the Data Center Energy Efficiency Framework (DCEEF)
The DCEEF contains five distinct requirement domains:
Facility Design and Engineering – Requirements in this domain relate to the physical
facility, including electrical and mechanical systems such as power-distribution and
cooling infrastructure. Special consideration is given to the complex issue of airflow
management, which is often one of the top sources of data-center inefficiency.
Information Technology –This domain deals with the computing hardware itself, rather
than the supporting infrastructure. While an IT operator may view a given server as a
machine that provides a set of computational services, the data-center manager must also
view it as a consumer of electricity and a producer of heat. CPU load balancing and
virtualization are techniques that can increase server efficiency without sacrificing
functionality.
Process – Process relates to issues like quantifying the nature of application demand and
establishing maximum acceptable levels of application downtime. The intent is to match
applications to the proper hardware to maximize energy efficiency. Process ensures that
the hardware allocated for an application is justified.
Governance – The optimal operation of a complex data center requires people with
diverse skills and backgrounds to strive towards a common goal. This domain relates to
techniques for improving employees‟ motivation and domain knowledge.
Finance – The financial impact of reducing energy consumption is usually negative in
the short term but positive in the long-term. This domain considers operating expenses,
capital expenses, book value and depreciation of assets.
Traditionally, significant focus has been placed on the physical infrastructure of the data center
and its impact on consumption. While facility design and engineering is a component of
DCEEF, it is not intended to be the dominant perspective. A holistic approach - drawing from
multiple disciplines – is essential to minimize long-term power consumption. Although a
remediation project may result in immediate improvements, an organization that fails to develop
maturity in areas like governance and process will eventually revert to inefficient operation.
Practices within DCEEF establish data center operations that continually impact efficiency. New
technologies may impact unit efficiency, but total long-term consumption should be the focus.

DATA CENTER ENERGY EFFICIENCY FRAMEWORK
Page 7 of 45
2. Framework Compliance
The organization of the framework‟s thirty requirements is shown in the figure below.
Figure 1 - Framework Requirements

DATA CENTER ENERGY EFFICIENCY FRAMEWORK
Page 8 of 45
Benefit (Energy Savings)
Cost &
Effo
rt
Strong Benefit \
Low Cost & Effort
Strong Benefit \
Moderate Cost & Effort
Moderate Benefit \
Moderate Cost & Effort
Moderate Benefit \
Low Cost & Effort Low
est
Hig
hest
Weakest Strongest
Requirement A
Value ~4.5
Requirement C
Value ~3.75Requirement D
Value ~3.5
Requirement B
Value ~3.75
Figure 2 - Factors Determining Requirement Value
Each requirement is assigned a title and a value. (The value of each requirement is indicated next
to the requirement description.) The requirement‟s value is a numerical weighting– expressed as
a number between zero and five – of the potential energy savings (narrowly defined in terms of
energy cost reduction) measured against both the difficulty of implementation and the capital-
investment cost.(Figure 2 illustrates the relationship of these contributing factors.)
Higher values are assigned to those requirements that generate significant benefits, require the
least amount of investment, and are easy to implement. For example, for most environments,
raising the thermal set point by 1 °F results in a corresponding drop of 1-3% in the power
required for cooling systems. Because implementing this measure requires no capital investment
and is easy to implement, this requirement receives a high score. In contrast, installing an air-
side economizer can lead to fantastic reductions. However, it requires significant investment of
time and capital. Consequently, it does not score as high as the simple practice of raising
temperature.
This system of rating aligns most closely with ROI. The actual ROI of a measure depends on
hundreds of factors, including the characteristics of the environment, the existing level of
efficiency and the size of the data center. Furthermore, because the calculation of value is
narrowly based on hard savings, more committed organizations may wish to include soft benefits
such as contribution to corporate sustainability efforts as part of any actual ROI. The
implementation of abatement projects increasingly based on soft benefits is increasingly
important at higher performance levels (e.g., Level III). Regardless, the value shown for each
practice should provide a strong directional indicator of benefit versus effort and capital
investment.

DATA CENTER ENERGY EFFICIENCY FRAMEWORK
Page 9 of 45
A requirement is considered fully satisfied if it meets the described condition. Following each
requirement title and value, there is description section, which provides detailed information
about the requirement. After each requirement description, there is a section that describes the
actions necessary to meet the requirement. Following each actions section, there is a final
section titled artifacts, which describes what proof (e.g., tools, documents, charts, reports, forms)
is necessary to demonstrate that the requirement is actually met. In general, artifacts are
byproducts of the implementation of the requirement. In other words, artifacts are usually
manifestations of the required action, and are not tasks in and of themselves.
The level of compliance with the framework is measured by determining whether the necessary
artifacts are present for each requirement. If the artifacts for a given requirement are present,
then the score equal to the value shown for the requirement is awarded. Fractional or partial
marks are not possible. An organization‟s total score is simply the sum of values for each
requirement satisfied within the performance level.
In order to claim compliance with a given DCEEF level, organizations must score no less than
60% overall on the prescribed requirements for that level. Additionally, organizations must
score no less than 55% on the requirements within each discipline. This is intended to
discourage organizations from performing extremely well in one area and extremely poorly in
another.
3. Applicability of Requirements
A given requirement may be applicable only in certain environments; for example, some
requirements pertain only to data centers with a raised-floor. In such situations, the exceptions
will be noted in the requirement description. During an evaluation, the maximum possible final
score for a level should be calculated without including requirements inapplicable to the
evaluated environment.
Only operations owned and controlled by the evaluated organization should be assessed. For
example, systems managed by co-location or web-hosting providers cannot be evaluated against
IT Requirement No. 3 (virtualization), because third-party providers cannot be forced to
virtualize customer environments.

DATA CENTER ENERGY EFFICIENCY FRAMEWORK
Page 10 of 45
4. Implementation Methodology and Additional Resources
When implementing modifications in order to comply with DCEEF standards, use of a business-
process methodology like TQM, Six Sigma, or Lean Six Sigma is recommended. If an
organization has no such methodology in place, then the DCEEF provides a simple phased
methodology. This methodology is shown in Figure 3 and consists of the following phases:
Phase I –Define
Phase II - Analyze
Phase III–Implement
Phase IV – Control
Figure 3 - DCEEF Implementation Methodology
Phase I involves clearly defining the program in terms of goals, team members and scope. Scope
includes selecting the target sites and performance level to be attained. In Phase II, the DCEEF is
used to perform a gap analysis that compares the site infrastructure and practices against the
framework requirements. A self-assessment scorecard is provided as part of the Implementation
Toolkit to simplify assessments. Phase III calls the development and implementation of a
DATA CENTER ENERGY EFFICIENCY FRAMEWORK
Page 11 of 45
remediation plan that addresses any gaps identified in the assessment. All remediation projects
are budgeted, scheduled and implemented according to an organization‟s project management
practices. In Phase IV, the benefits are captured and communicated, after which the process
begins anew.
Regardless of methodology, there are tools (including an implementation guide and self-
assessment scorecard) available to assist with assessment and remediation. These tools can be
found at http://www.greendca.org/dceef.
5. Reliability and Limitation of Liability
The practices recommended in this framework are widely adopted and considered to be safe;
however, if caution is advisable when implementing a specific requirement, a warning is
indicated with a bold warning label. The label is followed information describing the risk and
strategies for risk mitigation.
The ultimate responsibility for equipment safety and reliability remains with the data-center
owner and manager. These stakeholders must consider not only equipment age and sensitivity
but also risk-tolerance of the organization.
If good judgment dictates that a particular best practice is unsuitable, then this practice
should be avoided.
When determining compliance, any requirements skipped due to a reliability concern will be
excluded from the score tabulation.
While minimization of energy usage is a worthy goal, the ultimate mission of the data center is
reliable and predictable operation. The Green Data Center Alliance assumes no responsibility
for damage that directly or indirectly results from recommended practices.
6. Framework Requirements
The DCEEF consists of 30 recommended practices organized into 3 levels. A summary view of
these requirements is presented in Appendix A. A detailed description of each requirement for
each level is described below.

DATA CENTER ENERGY EFFICIENCY FRAMEWORK
Page 12 of 45
Figure 4 - Blanking Panel & Airflow
Level I Requirements
Level I requirements require little capital and effort but can achieve substantial results. Level I
practices are often considered “low hanging fruit”. Implementing Level I practices can bring
quick success that establishes the benefit of efficient operation and frees funds for more
ambitious initiatives. All organizations, regardless of size or type, should be able to comply with
the practices described:
FA-1. Blanking Panel (Value 4.0)
Requirement discussion:
Without blanking panels, hot air
from behind the rack will mix
with cold air in front of the rack as
shown on the left side of Figure 3.
Placing blanking panels in the
gaps between devices prevents
cold and hot air from mixing.
This maintains a maximum “Delta
T” (the difference in temperature
between the hot and cold air). A
larger Delta T results in more
efficient cooling. By preventing
cold and hot air from mixing, the
temperature rise across the
IT/Network equipment provides the potential for high return temperatures. The Return
Temperature Index (RTI) provides a measure of the actual utilization of the available
temperature differential. This metric provides a yardstick for tracking the performance
of the air management system.
To put the importance of such a metric in perspective, consider that nine of the twelve
measures in the Facility Design & Engineering domain are directly related to air
management. In addition, six of these nine measures have a Value of 4 or greater.
Activities: Procure and install blanking panels in all unoccupied spaces within the
equipment racks.
Artifacts: The installed blanking panels must bevisible on inspection of the equipment
racks.

DATA CENTER ENERGY EFFICIENCY FRAMEWORK
Page 13 of 45
FA-2. Cable Management (Value 3.9)
Requirement discussion: Cable management should be used to prevent cables under a
raised floor from preventing cool air from reaching servers. Air exiting perforated floor
tiles must reach the devices in the rack. Even partial blockages can inhibit airflow
problematically. When cabling reduces the air velocity, cool air may lack the
momentum necessary to reach the top of the rack, resulting in hotspots or inefficient
cooling.
A cable management system should be used to avoid airflow disruption. Removing old
abandoned cable that has accumulated over time is especially helpful in older facilities.
There are numerous types of cable management system, including overhead trays,
under-floor trays and punch-down blocks. Other factors - such as the amount and
weight of cabling - have little to do with energy efficiency but must be taken into
account. This requirement does not mandate a type of solution, but rather requires
verification that a solution is in place and blockage of airflow is minimal.
Activities: Where no existing cable-management solution has been previously
implemented, the required activity is installation of a cable management solution to
control cables and minimize airflow obstruction. Where a cable-management solution
is already in place, the required activity is simply checking that all cables are properly
using an existing system and minimal airflow blockage is occurring. For older sites,
removal of unused cable that causes blockage is required.
Artifacts: The systematic and controlled manipulation of physical cables between server
racks and equipment or distribution panels must be easily visible upon inspection.
Note: This measure is most relevant for raised-floor environments. With concrete slab
floors, there are no under-floor plenums. As such, in a concrete-slab environment,
cables cannot block under-floor airflow.
FA-3. Tile Perforation Placement (Value 4.2)
Requirement discussion: In a raised-floor environment, proper positioning of
perforated floor tiles is essential. Because air-cooling systems work most efficiently
when the return air is hot, directing cooled air into the aisle that contains heat exhaust is
inefficient. Therefore, perforations should be positioned such that cold air is vented into
the cold isle only. The same principles holds for data centers ventilated from above.
It is inefficient to place a perforated tile at the end of a cold aisle unless a containment
system is being used, because cold air will travel around the corner and mix with the hot
aisle. Therefore, unless a containment system is in place to prevent mixing, do not
position the cold aisle perforations within 1-2 feet of the ends of the row of racks.

DATA CENTER ENERGY EFFICIENCY FRAMEWORK
Page 14 of 45
Efficiency is further optimized by positioning tile perforations as close as possible to the
forward face of IT equipment, rather than in the middle of the cold aisle. Reducing the
distance between the forward rack face and the perforations to less than one foot is
ideal.
Activities: Verify that all tile perforations are located only in the cold aisles between
racks. If tile perforations are discovered outside the cold aisle, they should be removed
and replaced with a non-perforated tile.
Artifacts: Placement of perforated floor tiles within the cold aisle only and placement of
non-perforated tiles in all other locations of the data center must be easily observed on
visual inspection.
Note: This measure is relevant for raised floor environments only. In case of concrete
slab floors, there are no under-floor plenums and tile perforations are therefore not
used.
FA-4. Floor Cutout Seals (Value 4.0)
Requirement discussion: Cutouts in the floor, normally placed directly under a rack to
facilitate under-floor wiring, must use blocking technology to ensure that the under-
floor plenum is segregated from the above-floor area. The blocking technology need
not provide a full seal, but even a partial blocking will provide a significant
improvement in air pressure.
Activities: Procure and install blocking panels such that the holes located in the floor
under each rack are substantially covered. Options include brush grommets and
blocking pillows, but the exact implementation is left to the data center professional. A
complete seal is neither possible nor necessary, as cables must be allowed to connect
from under the floor to equipment in the racks.
Artifacts: Presence of blocking pillows or grommets covering the cable cutout under
each rack.
Note: This measure is relevant for raised-floor environments only. Cutout seals are not
used in data centers with concrete slab floors.
FA-5. Equipment Placement and Orientation (Value 4.3)
Requirement discussion: The vertical placement of equipment in a rack has a
significant impact on cooling efficiency. When cool air leaves the under-floor plenum it
has a certain velocity based on the under-floor pressure. This velocity is reduced as the
cool air is propelled upward. Also, the cool air mixes with warmer air, so higher rack
elevations have higher air temperature. Because the coldest air is closest to the ground,

DATA CENTER ENERGY EFFICIENCY FRAMEWORK
Page 15 of 45
equipment with greater power and cooling needs should be placed lower to the ground.
Although this principle holds regardless of floor type, there is one caveat for raised-
floor environments. Since air “ejected” from tile perforations travels upwards, the fans
on equipment placed only a few inches above the floor must strain to create the suction
necessary to direct cool air across the load. Therefore, depending on plenum pressure, it
may be advisable to start placing equipment a few “U” from the immediate floor, with
blanking panels in the rack immediately below this equipment.
In addition to vertical placement, orientation is important in creating a hot-aisle/cold-
aisle design. This design practice is described in detail in TIA/ANSI standard 942. In
order to satisfy this requirement, the front of all equipment must be aligned facing the
“cold aisle” and the equipment heat exhaust is directed into the “hot aisle”. These hot
and cold aisles then alternate between rows. The reason for this is simple: cooling-
equipment efficiency is proportional to the temperature of return air. Therefore,
consistent equipment orientation is critical to achieving the hottest air temperature in the
hot aisle and assuring that one row‟s intake is not drawn from exhaust air from an
adjacent row.
An exception to this front/back orientation must be made for networking equipment that
has a side-to-side air intake/exhaust configuration. This equipment should be
configured in alternating front and back configurations, creating shared hot sides and
shared cold sides. Another acceptable practice is to install aftermarket turning vanes on
the hot and cold sides of this equipment to direct intake and exhaust air appropriately.
Activities and Artifacts: Arrange computing equipment such that all intake vents are
facing the cold aisle and all equipment exhaust vents are facing the hot aisle. Also, the
hot aisles and cold aisles of any two adjacent racks should be facing each other in an
alternating pattern. Finally, the higher the wattage of a piece of equipment, the lower it
should be positioned in the rack. This final requirement is difficult to verify by visual
inspection alone.
FA-6. Thermal set point (Value 4.5)
Requirement discussion: Both the Telcordia NEBS requirements as well as the
ASHRAE (American Society of Heating, Refrigerating and Air-Conditioning
Engineers) Technical Committee 9.9‟s “Statement of Reliability” specify an acceptable
intake air temperature range for computing equipment. In both guidelines, the
recommended dry bulb temperature range is 18-27 degrees Celsius (65-80 degrees
Fahrenheit). In order to reduce excessive operation of the chiller plant as well as
maximize use of air-side economizers, the data center should operate in the middle-to-
upper level of this range. Given the reliability of modern equipment, there is no reason
to operate a data center at an uncomfortably low temperature.
In general, power required for cooling is reduced by 1-3% for every one-degree
reduction in set point. However, most servers are designed to increase fan speed when
DATA CENTER ENERGY EFFICIENCY FRAMEWORK
Page 16 of 45
inlet air temperatures exceed 75-77F°.Once that threshold has been reached any
potential savings in the cooling system will be negated with increased power from the
IT devices. Therefore, to avoid crossing this threshold, it may be advisable not to
increase set point beyond 78F°, although some organizations, with care, have
maintained set points of 80 F°.
Activities: Gradually increase the inlet temperature to the upper end of the ASHRAE
recommended range. The determination of final target temperature is left to the data
center professional. There are many reasons why the final temperature set point may be
below the maximum allowed, including comfort of the human operator, concern for
legacy equipment, and concern about unacceptably high temperature variations in
specific locations (though this is probably a symptom of other problems such as air
damning or mixing). However, at a minimum, the temperature must be higher than
room temperature or 72 F°.
Artifacts: The required artifact is simply the visual verification that the inlet set point is
at a level above room temperature. It is not necessary to produce any documentation.
Warning: Although operating equipment within the recommended ASHRAE range has
been deemed safe by equipment manufacturers, rapid fluctuations in temperature are
inadvisable, especially in an environment where devices may have been operating at a
cold temperature for many years. Therefore, it is advisable that any change in
temperature be made gradually. For example, a change from 68 degrees to 73 degrees
should be executed over a period of approximately one week by changing the set point
no more than one degree each day. This guideline ensures that thermal expansion
happens slowly.
IT-1 Consolidation (Value 4.9)
Requirement discussion: The most effective measure for reducing power consumption
in the data center is consolidation. In a very large organization, this can refer to
consolidation of multiple data centers into one. More typically, this refers to
consolidation of multiple servers into a single server. Regardless, the intent is to reduce
the total number of servers deployed in production. Because roughly one kilowatt of
power is required by data center infrastructure (cooling, etc.) for every kilowatt
consumed by actual IT equipment, there is a multiplier effect of benefit for each server
that can be removed from production.
To demonstrate compliance with this requirement, an organization must create a
consolidation document that discusses the potential benefits and restrictions of
consolidation. The document must be revisited and revised appropriately as data-center
conditions change (an annual reevaluation is advised). Consider combining your
consolidation strategy with your asset refresh program (requirement FI-2). Newer
equipment will likely have substantially greater capacity than legacy equipment. As

DATA CENTER ENERGY EFFICIENCY FRAMEWORK
Page 17 of 45
older equipment is replaced, consider consolidating additional applications rather than
only migrating existing software systems onto new hardware.
In some cases, consolidation may be limited by legislative requirements that force
organizations to store information or deliver services from certain geographical regions.
Other factors limiting consolidation are the need for extremely low latency and the need
to keep physical infrastructure in close proximity with users. However, these
limitations normally affect only a small portion of total server populations and should
not significantly affect most consolidation initiatives. The most common limitations
that should be considered in any consolidation effort are:
Disaster recovery & business continuity
Regulatory requirements
Latency-sensitive applications
High-bandwidth requirements
Connection to local devices
Activities: All organizations should determine the potential benefits and limitations of
consolidation of multiple servers (including Wintel, RISC, and mainframe). In the case
of multi-site organizations, required activities include collection and analysis of facility
capacity data such as available cooling, space and power.
Artifacts: Artifacts resulting from this analysis must include a document enumerating
the capacity and installed-software content of data center servers, and the potential
benefits, risks, limiting considerations and costs of consolidation. The document must
conclude with recommendations for either consolidating or not consolidating each
server. For organizations with multiple sites, a similar document should be produced
discussing consolidation of sites. The date of the most recent review should be no more
than 1 year ago.
The organization may decide that actual consolidation is too risky or not an appropriate
option for the business. If this conclusion was reached through a reasonable
interpretation of the data, then this is an acceptable result and the organization will still
receive the requirement value. The important criteria are that the organization has
performed the analysis and has quantified the benefit of consolidation.
PR-1. Data Center Zoning (Value 4.0)
Requirement discussion: Different servers can have substantially different power
demands. Also, different applications vary significantly in their criticality. Despite this,
it has been common practice to build the data center with uniform power and cooling
design throughout the facility. Provisioning an entire data center to a level required by
only a small subset of equipment is wasteful and expensive.

DATA CENTER ENERGY EFFICIENCY FRAMEWORK
Page 18 of 45
A common occurrence is provisioning all racks with the same power capacity and two
independent power circuits so all equipment can be dual corded. However, use of
single-path (rather than dual-path) power can reduce electrical consumption by up to
8%. Therefore, only applications requiring increase reliability should warrant dual-path
power infrastructure.
Another common scenario is to place CRAC and CRAH equipment on a UPS-protected
circuit to ensure cooling-system resilience during loss of utility or generator power.
Placing all cooling systems on a UPS can increase energy consumption by as much as
5%. A better approach would be to zone the data center and place cooling systems for
critical application zones on UPS-protected circuits.
Creating and operating data center zones involves subdividing the data center into
regions and physically grouping equipment with similar power, cooling and application-
uptime requirements into an appropriate region. The number of zones will usually
depend on facility size. Large facilities may contain as many as eight distinct zones. For
small data centers, the zones may be as small as a single row.
For a mid-sized data center, three suggested zones are:
Zone 1 - high power and high redundancy
Zone 2 - high power and medium redundancy
Zone 3 - low power and no redundancy
Zones can also be created for IT/Network equipment ventilated other than front-to-rear
not suited for hot and cold aisles.
Activities and Artifacts: A definition document must define the data center zones and
articulate the difference in power and cooling provisioning for the zone. The document
should specify the criteria used to determine whether a server belongs in a particular
zone.
A deployment report should identify each zone and the equipment inside. Equipment
descriptions should reveal the hardware and software characteristics that were relevant
to the equipment-placement decision. For example, if a zone was created to support
high power density equipment, then power density data for the equipment should be
present in the report. In another example, if a zone was designed for a higher level of
cooling fault tolerance, then the report should contain data revealing the criticality of
each application running on each server.
GO-1. Energy Efficiency Role Defined (Value 3.6)
Requirement discussion: In order to ensure accountability, at least one individual
should be given responsibility for energy efficiency in the data center. Note that this
requirement is for a role and not necessarily a position. The goal is to create an

DATA CENTER ENERGY EFFICIENCY FRAMEWORK
Page 19 of 45
accountable party and a focal point within the organization toward which ideas can be
directed.
In a large organization, this role may be the responsibility of a single individual hired
exclusively for this activity; however, it is perfectly acceptable to designate the role to
an existing employee who has responsibility for other activities. For example, it is
acceptable to assign this role to an individual responsible for energy consumption in
other organizational areas, including office space, customer-service facilities,
manufacturing facilities and distribution centers. However, if the individual lacks
experience in Information Technology, then this individual may require additional
support and input from a senior member of the IT organization (e.g., Director of IT). At
minimum, it is recommended that individuals fulfilling the energy-efficiency role be
skilled in HVAC, AC power and other facilities-related areas.
Frequently, an energy-efficiency role with a focus limited to IT will report to someone
responsible for the overall organization. Increasingly, organizations are designating
Chief Sustainability Officers (CSO). If such a position exists in your organization, then
this is a good choice for direct supervisor of the role.
Activities and Artifacts: The organization must be able to unequivocally indicate which
individual is responsible for energy management within the IT organization.
Additionally, the organization must be able to produce a document that clearly describes
the duties and responsibilities of this individual relating to energy reduction. It is
acceptable for this individual to occupy multiple roles.
FI-1 Energy Efficient IT Procurement (Value 3.4)
Requirement discussion: Long-term operating costs (including energy) should be
considered when making technology purchases. Many organizations consider only the
one-time capital expenditure. However, studies have shown that energy savings
associated with a high-efficiency model of IT hardware often repay the cost difference
within the first 12 to 18 months.
Energy efficiency criteria advocated by entities like US EPA ENERGY STAR® and
Climate Savers Computing Initiative should be considered. Consideration should be
given to servers that achieve Energy Star certification, because they:
- Have a high efficiency power supply
- Provide power saving features at the OS-firmware level
- Are benchmarked to ensure they are able to perform high workloads for a unit of
energy
To avoid the need for repeated analysis with each technology purchase, common
purchases could be restricted to a pre-selected set of energy efficient servers approved
by the IT department for energy efficiency.

DATA CENTER ENERGY EFFICIENCY FRAMEWORK
Page 20 of 45
Activities and Artifacts: For major IT equipment purchases, the organization must be
able to produce documentation indicating analysis of annual energy costs over the
useful life of the equipment (in addition to the equipment‟s capital costs). In the case of
a predefined catalog of allowable equipment, the procurement organization must be able
to produce documentation showing that long-term energy costs were considered in
determining the pre-approved equipment catalog.
DATA CENTER ENERGY EFFICIENCY FRAMEWORK
Page 21 of 45
Level II Requirements
Once all the easy requirements in Level I are satisfied, organizations may desire additional
improvements. Level II requirements require more time and investment, but will provide
commensurate results.
FA-7. Containment Solution (Value 4.2)
Requirement discussion: Containment solutions, which ensure hot air remains in the
hot aisle and cold air remains in the cold aisle, are a substantial improvement over the
common practice of over-cooling the entire data center. Containment solutions range
from self-contained racks to plastic vinyl sheeting between rows. Containment
solutions drastically improve Power Utilization Efficiency (PUE) by isolating an area
and ensuring that cold air is delivered directly - without mixing - to IT equipment.
When cold air is allowed to mix in a large area with heat exhaust, the result is wasted
energy in the form of lukewarm air returned to the cooling units.
There is no universal agreement in the industry whether it is better to contain the hot
aisle or the cold aisle. In many cases, organizations have selected an expedient solution
based on the existing geometry of their data center. However, note that hot aisle
containment (especially when combined with raised thermal set points) can make it
extremely uncomfortable for personnel to work behind the servers. In some cases,
bypasses are installed so operators can temporarily redirect hot exhaust when accessing
equipment.
It is often not feasible to deploy a containment solution universally. In this case,
containment should first be deployed to areas of high power consumption, with
expansions to other areas as circumstances allow.
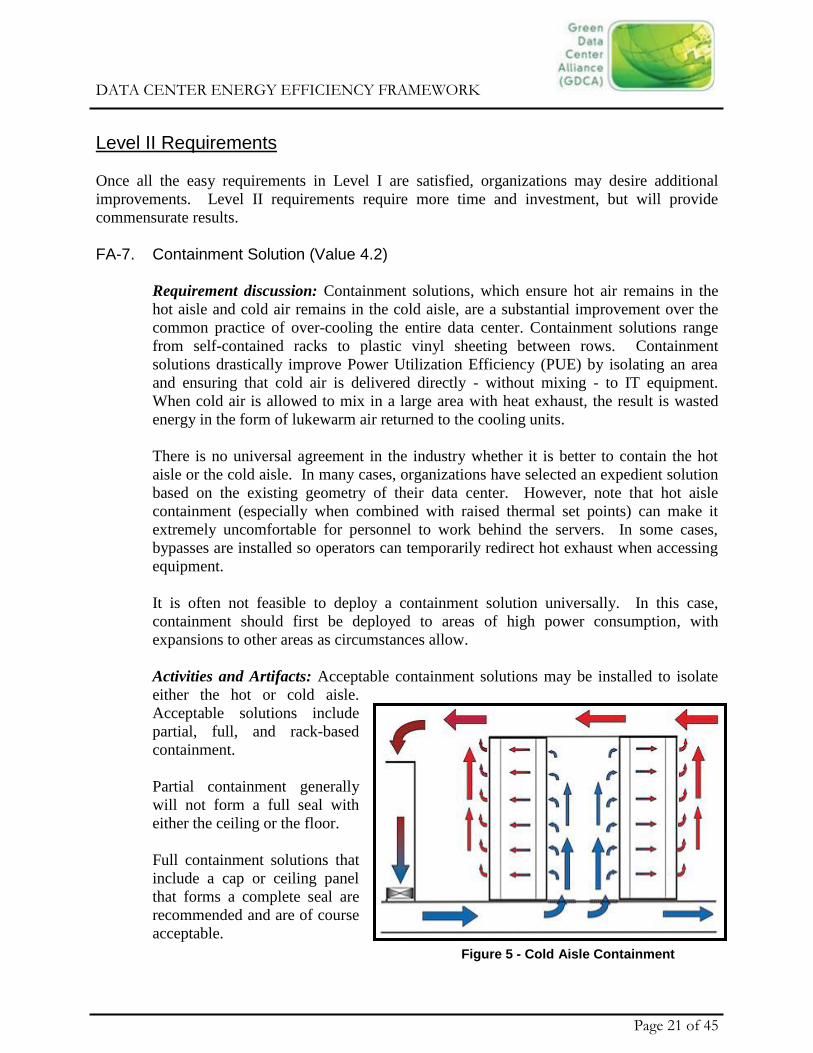
Activities and Artifacts: Acceptable containment solutions may be installed to isolate
either the hot or cold aisle.
Acceptable solutions include
partial, full, and rack-based
containment.
Partial containment generally
will not form a full seal with
either the ceiling or the floor.
Full containment solutions that
include a cap or ceiling panel
that forms a complete seal are
recommended and are of course
acceptable.
Figure 5 - Cold Aisle Containment

DATA CENTER ENERGY EFFICIENCY FRAMEWORK
Page 22 of 45
Rack-based solutions characterized by installation of chimney units at the top of each
rack are also acceptable.
This requirement is satisfied by visual inspection of a containment solution deployed in
a select area of the data center.
IT-2 Measurement & Verification (Value 3.9)
Requirement discussion: It can be difficult to achieve and maintain significant
efficiency improvements described in this framework without computationally complex
automated data-center measurement tools. While spreadsheets and homemade databases
can be used to map energy usage to utilization and identify stranded power capacity,
these tools do not scale. Furthermore, the storage and reporting of power-reduction data
is essential when pursuing utility incentives.
There has been significant growth in the maturity and sophistication of the solutions
available. Data center management solutions gather data on power usage, temperature
and humidity from sensors leveraging protocols like BACNet, Modbus and SNMP.
Most modern sensors (such as the PDU) are IP enabled, allowing transmission of
environmental status through existing networks. Also, price points have improved as
adoption has grown.
Regarding power-usage monitoring, although branch-circuit monitoring is possible,
intelligent power strips that measure power usage at the plug level are ideal for
identifying servers with the greatest power/utilization ratio.
Of course, merely installing measurement equipment without implanting corresponding
processes will not in itself reduce energy consumption. The data must be acted upon.
For this reason, this requirement is co-located in the same performance level as
configuration, availability, capacity and service-level management. Each of these
processes greatly benefits from the data generated from a monitoring and verification
system.
Activities and Artifacts: This requirement is satisfied by information systems that
monitor power consumption at the server level. The tool must minimally provide a
central information system that collects and stores power-consumption information
from distributed data-collection devices. At regular intervals, sensors must transmit
power consumption information to the management center. Ideally, systems will contain
smart PDUs that report the power consumption of individual sockets; however, more
general solutions are acceptable. There are no protocol-specific requirements.
The information system may optionally collect information on power consumption of
data center infrastructure devices, like CRACs, CRAHs and UPSs.
DATA CENTER ENERGY EFFICIENCY FRAMEWORK
Page 23 of 45
Furthermore, data-reporting devices may optionally include specialized sensors
designed to report on temperature, humidity and utilization.
IT-3 Virtualization (Value 4.1)
Requirement discussion: Virtualization has enormous potential to reduce energy
consumption. Given typically low server utilization resulting from increasing server
capacity, it is often quite practical to run multiple virtual servers on a single physical
server. Consolidating multiple servers to one machine boosts efficiency in part because
the average idling server machine consumes roughly 70% of the power required by the
same server working at capacity. Furthermore, not only does virtualizing five servers
onto a single platform eliminate the need to power four devices, there is a significant
multiplier effect because facilities overhead (cooling, etc.), which accounts for up to
50% of data center energy consumption, can be reduced by a proportional amount.
Virtualization has additional benefits, including the ability to move processing load
among hosts and the ability to adjust capacity dynamically. Virtual environments do
create some management challenges, so the need for complementary practices like
configuration, capacity and availability management increase. Mature management
processes are required to support virtual environments.
Not all servers need to be virtualized. There will be some mission critical systems (e.g.,
trading/manufacturing systems and web/e-mail servers) that must run 24x7 and are used
continuously throughout the day. However, there are often many servers dedicated to
applications used infrequently or only during specific times (like core business hours).
There may be tremendous benefit to virtualizing and consolidating these servers.
If your service management practices support the practice, try to identify candidates that
have peak requirements at different times of the day. For instance, a batch processing
system may only operate after hours while the HR system is only used 9-5.
It is neither necessary nor recommended to virtualize your environment in a single
massive effort. Consolidating even a small number of servers satisfies this requirement,
and demonstrates a commitment to virtual technology. Initial adoption of virtualization
often sparks continual improvement in this area.
Activities and Artifacts: This requirement can be satisfied through confirmation that
virtual machines represent some portion of the deployed server population. Numerous
virtualization technologies exist, and anyone may be used to satisfy this requirement.
Since each organization may be in different state of adoption, there is no minimum
percentage of infrastructure hardware that must be virtualized. There is also no
minimum number of virtual machines that must run on a single host server machine.
An optional recommended process is defining server candidates for future
virtualization. It is advisable to leverage capacity and availability information if

DATA CENTER ENERGY EFFICIENCY FRAMEWORK
Page 24 of 45
available. Systems with low utilization are prime candidates - this is especially true if
multiple systems can be identified with complementary usage patterns (e.g., different
time-of-day usage requirements).
IT-4 Enable Server Sleep Modes (Value 4.2)
Requirement discussion: According to the Green Grid, servers can save as much as
20% by operating in a reduced-power mode. IT departments can save energy by
deploying server hardware with power-saving features and ensuring that operating
systems installed on these servers be configured to enable server sleep modes during
server idle time.
Most new servers have a variety of power-saving utilities that can be leveraged by IT.
For example, servers with multi-core processors can shut down one or more unused
cores. As shown in Figure 6, processors can account for 19% of a server‟s power
consumption, so being able to shutdown unnecessary processing capacity can add up to
significant savings. Additional components (such as hard drives, which account for
another 16% of server energy consumption) can also be powered down.
The goal of this requirement is to ensure sleep-mode is enabled on all servers that
support it. New servers should have sleep-mode enabled by default. Post-deployment,
the server population should be periodically reviewed for compliance. The selection of
specific sleep periods is left to the organization. In order to prevent the system from
going into sleep mode during critical periods, most utility software will allow the user to
specify times of day when switching to sleep mode is acceptable. Some organizations
may define multiple standard sleep windows (e.g., non-business hours, non-extended-
business hours, and weekends only) and configure servers with the appropriate sleep
window. Acceptable exceptions are servers hosting critical applications.
If the organization has system management tools available, these tools can be
configured to scan servers periodically on the network and ensure their sleep mode has
not been disabled.
Activities and Artifacts: Three artifacts satisfy this requirement. The first artifact is a
detailed report listing all servers, their ability to support sleep-mode, and their target
configuration. All servers capable of sleep state should have sleep mode enabled for at
least a portion of the day. If servers are classified according to the criticality of their
applications, it is acceptable to have multiple sleep states defined.
The second artifact is a report, generated periodically, showing the actual configuration
of devices. The reporting period may be weekly, monthly, or even annually. The
choice of period will likely be dependent on the method used to gather the report
information.

DATA CENTER ENERGY EFFICIENCY FRAMEWORK
Page 25 of 45
The third required artifact is a practice statement requiring all new servers to have sleep-
mode enabled unless specific business requirements prevent it. Platform-specific
instructions for enabling sleep-mode on new server deployments should also be
available. In organizations that rely on disk imaging for deployment, it is acceptable if
one or more base server disc images are provided with sleep mode enabled by default.
PR-2. Configuration Management and Orphaned Servers (Value 3.8)
Requirement discussion: Traditional asset management involves information about
physical hardware (e.g., servers). Configuration management, as defined by the IT
Infrastructure Library (ITIL), extends asset management to involve non-physical assets
such as applications, service levels, documents and procedures.
Although the ITIL description of configuration management is quite broad, there are
only a few relevant elements that relate directly to energy efficiency. Therefore, careful
attention should be focused on the artifacts and activities as described in the section
below.
It is common in large data centers for applications to continue running long after their
usefulness has ebbed. The phenomenon is known as “zombie servers” or “orphaned
applications” and is estimated to represent between 9-15% of data center resources. In a
large data center with hundreds of servers and thousands of applications, careful
tracking is necessary to avoid continued hosting of unnecessary services. By
maintaining detailed records on all servers and applications, the IT department should
be able to easily identify which servers are no longer performing useful work and can be
decommissioned. It is necessary to maintain a database that identifies, at a minimum,
per-server listings of physical location and hosted applications. The primary focus of
this practice is preventing orphaned servers by capturing information on business
owners, applications, and business requirements, and being able to relate this to the
servers.
To satisfy this requirement, a repository, generically referred to as the Configuration
Management Database (CMDB), must contain configuration items for all deployed
applications, the applications‟ business owners, and the servers themselves. Application
configuration items should reference relevant server configuration items, where
applicable. At root, the CMDB must provide the information required to verify easily
whether a server is necessary based on the status of its applications.
A secondary focus is providing information to enable capacity and availability
management. In addition to storing server configuration information, the CMDB should
contain information about the physical racks themselves. While information such as
server components can be used to optimize system capacity, rack information such as
height and available power facilitate elimination of stranded capacity.

DATA CENTER ENERGY EFFICIENCY FRAMEWORK
Page 26 of 45
Activities and Artifacts: A detailed inventory must be available of all applications and
servers. This inventory information can be stored in a single monolithic repository or a
federated repository consisting of one or more smaller databases.
Each server record should contain details about the server‟s central processing unit
(CPU), memory, hard drive configuration and power supply. Server records should also
contain purchase information, including date of purchase and initial asset value.
Finally, the physical location of each server should be recorded. In the case of rack-
based servers, server location should be specified by identifying the rack and rack-
height.
Each application record should contain details about the application‟s purpose, business
owner and negotiated service level agreement.
Hosting information should indicate which servers are involved in delivering which
applications.
A process should be defined that ensures the CMDB is updated with each server
acquisition or decommissioning. Another process should be defined to identify and
eliminate “orphan servers”. This process should include generating a list of all
applications and contacting the business owner to verify continuing requirement. This
process should be run periodically and documentation should be presented detailing the
most recent run. This process should be run no less than annually.
PR-3. Capacity Management and Right Sizing (Value 3.4)
Requirement discussion: Not only does over-provisioning wastefully raise capital costs,
it also causes significantly higher energy consumption (because electrical consumption
is roughly proportional to machine capability). Capacity management is the process of
understanding applications‟ needs and ensuring that supply matches demand. Because
the average server‟s CPU utilization is estimated to be around 5% (although some
platforms like mainframes show greater utilization than RISC or distributed systems),
proper capacity management is worth the difficulty.
The first opportunity to match supply with demand is during original system design.
Figure 6 below shows a typical server in terms of the energy consumed by its various
components. Configurable components such as CPU, memory and hard drive account
for a significant portion of total energy consumption. In fact, a server configured at
maximum capacity can consume twice the power of the same server in a moderate
configuration. Therefore, over-provisioning a server with more resources than required
by the application has a very direct impact on long-term energy use. Professionals
involved in deploying applications should be made aware of the need to balance
infrastructure capacity against application requirements.

DATA CENTER ENERGY EFFICIENCY FRAMEWORK
Page 27 of 45
Ideally, guidelines should be established which relate load - measured in terms of
estimated users or simultaneous transaction - to hardware platform.
Server Power Usage by Component
36%
19% 7%
16%
9%
6% 7% Electrical Loss
CPU
Fans Drives
PCI Cards
Memory
Chip Set
Figure 6 - Server Energy Usage
Even if original estimates were overly conservative, measuring and adjusting capacity
post-deployment can rectify the situation. This is especially easy with virtual servers
than can be reconfigured dynamically, as well as adding additional images to a host.
If the infrastructure permits, a report that lists the power consumption and utilization of
each server can be extremely useful in identifying and correcting cases of over-
provisioning.
The final type of capacity analysis is performed at the row and rack level. Facilities are
designed to provide cooling, power and space. However, deployment of certain devices
can fully consume one resource (e.g., cooling) while leaving ample amounts of other
local resources inaccessible (e.g., power and space). This is referred to as stranded
capacity. By some estimates, most data centers could accommodate as much as 30%
more equipment after they reach “full capacity” if devices were optimally arranged to
take full advantage of available resource capacity. Identifying and accessing stranded
capacity requires analysis of power, space and cooling at a row and rack level. Analysis
of available power capacity at a rack level should be based on the actual energy
consumption of devices based on their current configuration (not their nameplate value).
Reconsidering of server placement based on current actual consumption may help
identify additional capacity.
Activities and Artifacts: There are three very specific artifacts that must be present. The first is one or more
capacity models that are used by system engineers and other IT professionals to
determine the appropriate system configurations relative to the business requirements.
These documents determine the initial configuration of systems used to support the
service.

DATA CENTER ENERGY EFFICIENCY FRAMEWORK
Page 28 of 45
Once in production, the second artifact - a portfolio of utilization reports - must assess
how accurately system capacity meets business needs. These reports should be updated
regularly. Ideally, the reports would show capacity vs. utilization on a per-server basis,
although at minimum, just per-server utilization over time can be shown.
Capacity information should be analyzed periodically at the rack and, ideally, the zone
level. Low-utilization servers should be identified, and component-level data provided
by configuration management should be available for further consideration. Generating
rack-level reports that provide information on power, cooling capacity, and space
availability is ideal for identifying stranded capacity and suggesting alternate equipment
placement.
The third artifact that must be present is a capacity management plan that leverages the
report portfolio (plus additional information like business forecasts) to identify
opportunities and recommend activities to optimize capacity use.
The required activities focus on the capture, analysis, processing and reporting of the
capacity data.
PR-4. Service Level and Availability Management (Value 3.9)
Requirement discussion: Organizations should practice the formal capture of business
user requirements in the form of service level agreements (SLA). SLAs define which
services are provided and the service level customers can expect. Even if an
organization‟s newly introduced service exceeds both capacity and availability, having
these requirements formally documented assists the organization in taking action in the
future. Other practices like customer charge back can greatly complement this process -
when things are free, users want Ferraris even when they only need Fords. Even if your
organization does not practice charge back, explain to the customer that there is a cost to
over-provisioning, unnecessary redundancy, and 99.999% uptime and push to establish
reasonable SLAs that reflect business need.
To demonstrate compliance and facilitate operation, it is recommended that a formal
Service Level Agreement (SLA) be created for each application deployed. The SLA
should clearly describe the application, minimum uptime metrics and capacity of the
supporting hardware. Each SLA should be signed to indicate the application owner
understands and accepts the documented service.
SLAs should also capture the temporal characteristics of application demand. Some
applications like email may legitimately be required 24x7. Other applications may be
accessed from various locations around the globe and require similar treatment.
However, it may not be the case that all applications must run at all times in all places.
There is no reason that an application that is accessed by local office staff exclusively
during business hours should run 24x7. Many organizations are hesitant to shut off any
devices due to concern that the system will not resume properly. One suggestion is to

DATA CENTER ENERGY EFFICIENCY FRAMEWORK
Page 29 of 45
group applications by criticality. While some critical applications can be excluded from
system sleep modes, non-critical systems can be shut down for significant savings.
One option increasingly being adopted is adding active power strips that can power
down servers during periods of non-use and bring them back up for use.
Regardless of whether an organization employs server sleep technologies, clearly
documenting application availability is crucial to other activities such as justifying
redundant infrastructure designs.
One commonly employed practice is the indiscriminate dual cording of all devices.
While this practice can increase energy consumption by 8%, the difference in mean time
between failures (MTBF) is about 6.8 minutes per year. Prior to implementing this
measure, business availability requirements should be considered.
Activities and Artifacts: The organization should be able to produce a detailed report of
all applications and their negotiated service level agreement. The service window is one
important part of the SLAs that should be specified. The information can similarly be
extrapolated to the server (where server availability is defined based on the applications
it enables).
The availability can be expressed in a number of ways. If the organization defines
standard availability windows, then this categorization should be indicated.
The availability report should list configuration details that impact availability such as
dual- versus single-corded configurations or reliance upon RAID architectures.
GO-2. Continuous Improvement Program (Value 4.1)
Requirement discussion: Continuous Improvement (CI) is perhaps one of the most
important practices in maintaining hard-earned improvements long-term. Organizations
should commit themselves to regularly examining their operations, identifying potential
improvements, and remediating where necessary (often as separate projects). There are
many methodologies ranging from the simple Deming Cycle to more elaborate Six
Sigma practices. That an organization has adopted CI as a core practice is more
important than which system is selected. This ongoing program will help ensure gains
are vigilantly maintained and improved upon. Such a program should establish metrics
and periodically collect and report them to management.
Most organizations will be strong in some domains and weak in others. A CI program
can help identify and target improvements to weaker domains. Figure 7 depicts a
sample maturity web that illustrates performance in each domain. In this case, it is clear
that governance is a weakness.

DATA CENTER ENERGY EFFICIENCY FRAMEWORK
Page 30 of 45
Figure 7 - Domain Maturity
Activities and Artifacts: The first artifact for any continuous improvement program
should be documentation of the adopted methodology. This can be represented with a
process diagram, work breakdown structure, etc. In the case where an existing
methodology has been adopted, it is acceptable simply to document the application of
the methodology to the organization.
Next, output from at least one iteration of the CI methodology should be present. This
may include final output such as a gap analysis or remediation plan. Multiple
intermediate outputs such as time and motion studies, Monte Carlo simulations and
Pareto analysis may be present.
Finally, high-level planning documents for the next iteration of the continuous
improvement plan should be present. This document should briefly mention the
outcome of the previous cycle, and describe the high-level objectives for the next cycle.
GO-3. Energy Policy (Value 3.9)
Requirement discussion: The IT organization must clearly and widely communicate the
existence and content of a policy that articulates the IT organization‟s commitment to
reducing energy consumption. If the organization has a higher-level policy, then the
data center policy should reference or align with those organizational goals.
It is acceptable for the policy to make a general statement on environmental
responsibility and not electrical consumption explicitly. The ideal policy empowers
employees to seek ways of reducing overall consumption, while recognizing that
electrical energy consumption represents the bulk of the datacenter‟s environmental
footprint.
Activities and Artifacts: A policy document that states the IT organization‟s
commitment to reducing energy consumption should be readily available. It should
highlight how IT can contribute to the overall company objectives.

DATA CENTER ENERGY EFFICIENCY FRAMEWORK
Page 31 of 45
This statement should be widely distributed and publicly displayed in prominent
locations. Recommended locations include lunchroom and department bulletin boards.
Posting to a public intranet is also advisable.
GO-4. Establish and Track Performance Against Targets (Value 3.9)
Requirement discussion: Organizations must establish energy-conservation goals and
measure their performance against them. Careful measurement normally reveals
whether an organization is meeting its goals and identify where corrective action can be
taken. This practice requires tools and measurement infrastructure as a prerequisite,
although tools are not enough – policy and commitment are required to leverage the
tools to their fullest potential.
One effective approach to performance measurement is creating a balanced scorecard
that is populated with select metrics. This scorecard is then regularly updated and
reviewed by senior management to ensure performance is trending the right way. If
negative deviations are noticed, the organization can analyze root cause and take
corrective action.
Such a scoreboard should at a minimum track and report all data and metrics required to
meet the organizations sustainability objectives and feed into the reporting framework.
Additional items of interest to the data center operator and IT department may include:
total facility power, PUE, number of applications, total IT asset and allocation, IT asset
utilization rates (average, peak, off-peak, weekend, idle), number of VMs, data I/O
rates, network traffic (peak, average, min), network and storage utilization rates, SLAs,
IT productivity and others as deemed appropriate.
A significant benefit to gathering metrics on the data center portfolio is ensuring that a
Continuous Improvement program can be conducted cost effectively. Visiting all sites
in a multi-site environment can be cost-prohibitive. By collecting metrics regarding site
performance and conducting comparative analysis, many issues can be identified.
Activities and Artifacts: The organization should be able to produce a series of reports
that show one or more targets and the organization‟s performance. The choice of
metrics, targets and period are left to the organization.
No more than 4-6 metrics are advisable. A high-level metric such as total energy
consumption or consumption per unit of work is advisable. The target should also be
displayed.
A monthly period is recommended.
DATA CENTER ENERGY EFFICIENCY FRAMEWORK
Page 32 of 45
FI-2 Asset Refresh Rationalize (Value 3.5)
Requirement discussion: Newer computing systems are usually more energy efficient
than older systems. In addition, newer systems may have newer technologies (like the
ability to go into hibernation or other low-power mode when not in use) that enable
more effective power management.
To retire inefficient systems in a timely manner, the organization should practice a
rational approach to equipment swap out and server replacement. A recommended
approach is to record the book value of server assets and depreciate this value based on
useful equipment life. The EU Code of Conduct recommends using a 3-year lifecycle
to accelerate new equipment purchases. Whatever the selected lifecycle, the
organization should track server depreciation year-over-year, and be prepared to replace
servers when their book value has depreciated to $0.
Activities and Artifacts: The activities involved in this requirement are the daily entry
of IT equipment purchasing data into existing financial systems. For each device
recorded, data entered should include an equipment identifier, an initial purchase price
and the remaining book value based on depreciation. A field showing the remaining
value of the asset should auto-calculate. On a regular basis, a report should be
generated showing the assets that have depreciated to zero and are potential targets for
replacement.
DATA CENTER ENERGY EFFICIENCY FRAMEWORK
Page 33 of 45
Level III Requirements
The average value for requirements in Level I, II, and III, are 4.1, 3.9, and 3.6 respectively.
Values are composite indicators based on cost, difficulty and benefit, and Level I requirements
correspond to the greatest ROI. A fair question is why would an organization implement Level
III requirements? The answer is that practices in Level III can result in significant energy
savings and they have a positive ROI. On average, they simply have a longer pay-back period
than requirements in Level I or II. Therefore, because requirements in Level I represent the “low
hanging fruit” and shortest payback period, they should be performed first. However, for an
organization that has had a green IT program in place for many years, requirements in Level III
can suggest additional practices that have not yet been implemented. In addition, values were
calculated using hard-saving values only. Highly committed organizations that are interested in
Level III compliance will likely already place significant value on the Corporate Social
Responsibility (CSR) aspects of energy efficiency. Therefore, they may value practices in Level
III much higher.
For an organization to achieve Level III compliance, it must first satisfy requirements for Level I
& II plus the requirements that follow.
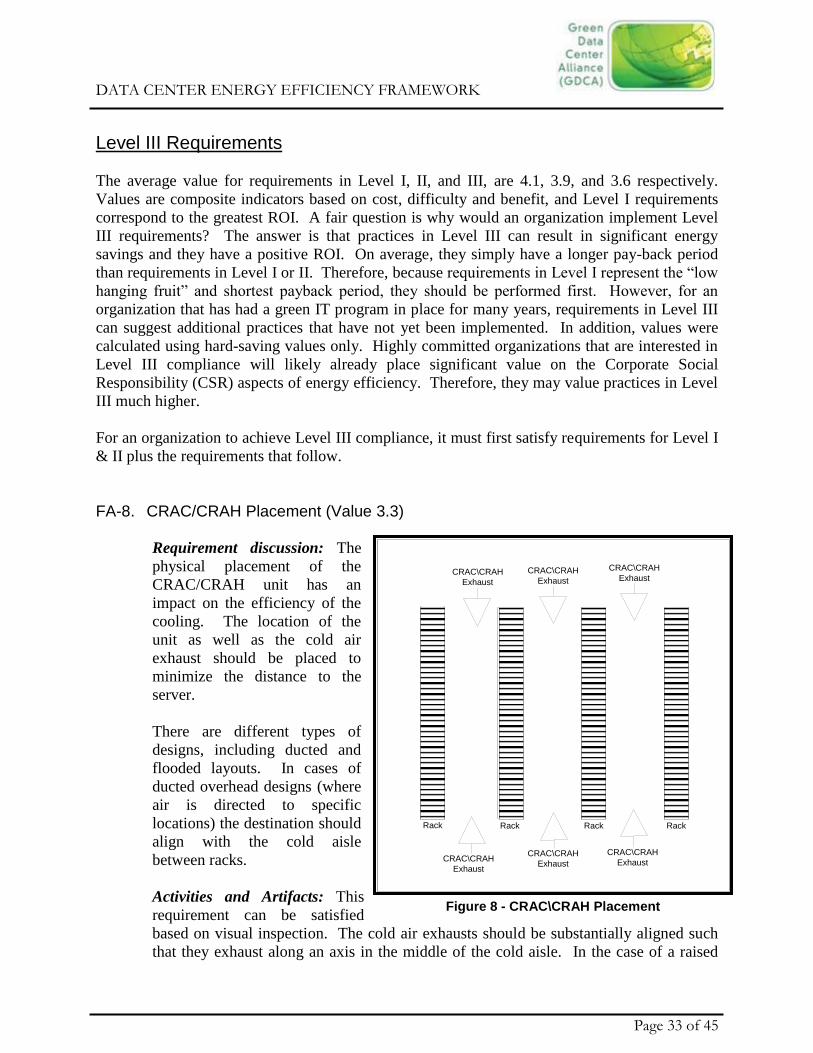
FA-8. CRAC/CRAH Placement (Value 3.3)
Requirement discussion: The
physical placement of the
CRAC/CRAH unit has an
impact on the efficiency of the
cooling. The location of the
unit as well as the cold air
exhaust should be placed to
minimize the distance to the
server.
There are different types of
designs, including ducted and
flooded layouts. In cases of
ducted overhead designs (where
air is directed to specific
locations) the destination should
align with the cold aisle
between racks.
Activities and Artifacts: This
requirement can be satisfied
based on visual inspection. The cold air exhausts should be substantially aligned such
that they exhaust along an axis in the middle of the cold aisle. In the case of a raised
Figure 8 - CRAC\CRAH Placement
CRAC\CRAH
Exhaust
CRAC\CRAH
Exhaust
CRAC\CRAH
Exhaust
CRAC\CRAH
ExhaustCRAC\CRAH
ExhaustCRAC\CRAH
Exhaust
RackRackRackRack

DATA CENTER ENERGY EFFICIENCY FRAMEWORK
Page 34 of 45
floor, the exhaust will vent under the floor, but align with the location of the cold aisle
above the floor. Figure 8 illustrates this configuration. In the event that the number
CRAC/CRAH outlets are less than the number of cold aisles, then the exhausts should
remain aligned with a cold aisle; however, rather than a 1:1 relationship, the
CRAC/CRAH exhausts may be aligned with every over aisle, every third aisle, etc., as
appropriate.
An engineering diagram showing the placement of the CRAC/CRAH exhaust is helpful,
but is not necessary.
FA-9. Air-or Water-side economizers (Value 4.4)
Requirement discussion: In many locations, the outside air temperature is less than the
cold air produced by a mechanical cooling system (e.g., outside air temperature < 55°F)
for a significant portion of the year. In water-based cooling systems, a similar concept
applies where there is a source of cold water nearby.
For example, in New York State the external air temperature is sufficiently cool for
approximately 76% of the year. Rather than recirculating the warm air exhausted from
the data center and expending energy to cool this supply, it may be preferable to vent
the warm air exhaust outside (or into adjacent building spaces for heat) and use the cold
outside air instead. This is referred to a “free cooling”. It is recommended that air-or
water-side economizers be installed to reduce reliance on mechanical cooling and use
free cooling instead.
With free cooling, there are risks relating to introducing humidity and particulates into
the data center. Humidity is considered a risk because it increases the occurrence of
Electrostatic Discharge (ESD). To combat this, it is recommended that the outside air
economizer be protected by adequate air filters and controlled with enthalpy or dew
point controls (rather than dry bulb temperature controls). This reduces the amount of
water that would need to be removed from the data center air through condensation in
the HVAC equipment. This latent effect consumes energy without sensible cooling.
If, on the other hand, humidification is necessary, consider using coordinated humidity
controls. It is obviously extremely wasteful when one CRAC unit is dehumidifying
while its neighbor is humidifying. Also, recent research has shown that wriststraps are
much more effective than humidification in preventing ESD, so there is little benefit to
wasting energy (and introducing additional water hazards) to maintain relative humidity
above 20% in data centers. This is in accordance to new ASHRAE recommendations.
To minimize the impact of unconditioned outside air, some designs use air that has
already been conditioned from surrounding office space outside the data center.
While the amount of power used for air conditioning decreases, economizers do
introduce a new power load in terms of additional fans or water pumps to circulate the
DATA CENTER ENERGY EFFICIENCY FRAMEWORK
Page 35 of 45
coolant. We recommend a detailed engineering study be performed to validate any
potential energy savings of either an air- or water-side economizer and determine if this
is cost effective for the facility. Air-side economizers require significant real estate that
may not be available in every data center.
Note: While air- and water-side economizers can greatly reduce cooling costs, retrofit
installation of these devices can be extremely expensive in many legacy facilities. For
example, these solutions are usually quite large and may not be feasible in a space-
constrained high-rise data center. Therefore, this requirement is only applicable to new
facilities undergoing design and build. Given the significant potential benefit,
committed organizations are encouraged to explore this opportunity based on their
specific circumstances, but it is not broadly applicable. Organizations considering this
abatement are especially urged to explore locally available funding incentives.
Warning: Air-side economizers may expose the IT equipment to uncontrolled outside
air. Early warning detectors should be installed within the inlet airstream and around
the perimeter of the data center facility. Also, diligence should be exercised when
installing and operating water-side economizers to minimize risks.
Activities and Artifacts: This requirement can be satisfied based upon visual
presentation of the economizer. A demonstration must be provided of the system in
normal operation. Therefore, any independent assessment should be scheduled such
that conditions are favorable for demonstration.
An engineering diagram documenting details of the system is desirable but not
necessary.
FA-10. Energy Efficient UPS (Value 3.4)
Requirement discussion: In most data centers an Uninterruptible Power Supply (UPS)
ensures that safe, predictable and reliable power is always available to mission-critical
systems. In the event that utility power is disrupted, computing devices can continue to
operate as the UPS seamlessly switches the load to a battery plant for some period of
time. This will provide the necessary time for an alternate power source (often a diesel-
or natural-gas-powered generator) to come on-line to carry all facility loads until utility
power is restored.
In a traditional UPS, electricity passes through rectifier and inverter circuitry in a
process known as “double conversion”. This ensures that even incoming power that
does not follow a proper sinusoidal waveform can be properly conditioned prior to
feeding and computing devices. Unfortunately, the double conversion circuitry results
in some power loss and heat.
Since power utilities within North America usually provide power that is properly
conditioned, this measure is usually unnecessary. Therefore, efficient UPS solutions

DATA CENTER ENERGY EFFICIENCY FRAMEWORK
Page 36 of 45
only subject power to double conversion if it is necessary. Electricity normally flows
straight through the UPS with minimal loss, but the UPS switches to double conversion
instantly and automatically when the UPS deems it necessary. This allows the UPS to
operate at a much higher efficiency for the majority of the time. These are called hybrid
or ECO-mode Uninterruptible Power Supplies.
Another consideration is that the efficiency of a UPS is maximized at maximum
utilization. The closer the UPS load is to its specified maximum capacity, the greater it
efficiency. For example, operating a legacy UPS at 30% utilization will result in only
92.6% efficiency. However, while running an energy efficient UPS at lower capacity
also result in waste, it is less pronounced than with a legacy UPS. This is illustrated in
the figure below.
Figure 9 - UPS Utilization to Efficiency
When selecting a UPS one can explore current EPA ENERGY STAR and IEC/EU Code
of Conduct specifications to find those topologies and systems with the appropriate
level of performance and efficiency to meet the data center‟s SLA requirements. IEC
62040-3 provides a benchmark rating system to evaluate energy efficiency by
performance criteria (fault-protection capabilities). IEC 62040-3 defines several modes
of operation, commonly referred to as ECO-mode, hybrid UPS, delta conversion or
offline UPS, which enable higher levels of efficiency while changing the fault
protection characteristics of the UPS.
Warning: While hybrid UPS systems are generally quite safe and capable of switching
to double conversion within a few milliseconds, there may be an extremely small risk -
especially in regions where utility power is unreliable. In such cases, the organization
may choose to accept the added power loss. One should perform a thorough
engineering and risk analysis when considering such modes of operation.
Efficiency to Utilization - Eco vs. Traditional
86.0%
88.0%
90.0%
92.0%
94.0%
96.0%
98.0%
100.0%
20% 30% 40% 50% 60% 70% 80% 90%
Traditional
ECO

DATA CENTER ENERGY EFFICIENCY FRAMEWORK
Page 37 of 45
Activities and Artifacts: Operation of the UPS in hybrid or eco-mode is required to
establish compliance with this requirement. In addition, the manufacturer and model
number of the system should be provided. A product manual from the manufacturer
confirming the features of the UPS is desirable, though not necessary. In the event that
multiple UPS are deployed for the site, different UPS models and manufacturers are
acceptable. However, all UPS systems must support hybrid or eco-mode operation.
FA-11. Variable Frequency Drives (Value 3.7)
Requirement discussion: In tradition CRACs and CRAHs, the motors that power fans
and pumps operate at a single consistent speed when activated. Newer devices operate
through a spectrum of speeds depending on need. These are called variable speed or
variable frequency drives (VSD or VFD, respectively). VFDs are increasingly
becoming popular in IT devices (servers) themselves.
To satisfy this requirement, fans and motors found in the primary cooling infrastructure
must be replaced with VFDs. Replacing the fans (and pumps used in liquid cooling and
heat exchanges)is mandatory inside Computer Room Air Handlers (CRAHs) and
Computer Room Air Conditioners (CRACs), consistent with the caveat below.
Note: Not all CRAC and CRAH units are suitable for VFD, VSD or Electronically
Commutated Motor (ECM) upgrades. One must consult with the manufacturer first.
Activities and Artifacts: Since visual inspection of the VFDs is usually not possible, the
purchase and installation invoices for all VFDs should be presented. The number of
devices installed should correspond to the number of fans and motors used in the
cooling infrastructure.
FA-12. High Efficiency Insulation and Roofing (Value 3.3)
Requirement discussion: The installation of high-efficiency insulation can help reduce
cooling requirements. This includes thermal insulation of the walls as well as thermal
protection installed on the roof (i.e., high-reflectance, low-emittance “cool roofs”).
Activities and Artifacts: Since visual inspection of the insulation and roofing are usually
not possible, the purchase and installation invoices for all materials should be presented.
The amount of insulation installed should correspond to the size of the facility.
Additionally, a manufacturer‟s product description should indicate the R-value of the
material.
PR-5. Training & Awareness (Value 3.9)

DATA CENTER ENERGY EFFICIENCY FRAMEWORK
Page 38 of 45
Requirement discussion: A training program should articulate the issue of energy
efficiency in the data center, why this issue is important, and examples of some of the
activities that IT personnel can undertake to reduce power consumption.
While the organization may already have a broadly applicable training program at the
organization level, this training program should be specific to the data center and be
provided to staff involved in the design and development of applications. It is important
that IT personnel realize that their actions have a direct impact on power consumption in
the data center (even if they do not have access to - or have never been inside - the data
center).
This program should be provided to select personnel on an annual basis. There are
many excellent externally available training programs such as the DOE‟s DCEP and
CNet‟s CDCCP. However, this requirement can also be satisfied through internally
provided training (e.g., “Train the trainer”). It may be advisable for the organization to
have a few “expert” resources, but the emphasis is on wider communication and
awareness – especially for non-data-center professionals who may exacerbate inefficient
energy practices and without even realizing it. For example, while project managers
may think that obtaining an over-provisioned server with attractive pricing is a “good
thing”, this actually doubles or triples the power that will be consumed by the device
over its useful life.
Activities and Artifacts: To demonstrate internal training and awareness, a sample
training curriculum and associated training materials must be presented. It is acceptable
to have multiple training curricula targeted at multiple groups.
At a minimum, the training material must state the documented objectives of the
organization, identify members of the energy reduction team, identify specific
opportunities to reduce energy consumption, and explain how the actions of various IT
roles affect the efficiency of energy consumption. Suggested roles for discussion
include project management, support, application architects, business analysts and
system engineers.
When training is delivered online, the training module must be demonstrated by
accessing it online.
A report must be presented that identifies all individuals who are required to take the
training. Since most IT staff members have some impact on data center energy
efficiency, the report must demonstrate that a significant percentage of IT personnel are
required to take the training.
Another report must be presented listing all training attendees. The report must indicate
the person‟s name, title, name of curriculum and date completed. Personnel should take
this course on an annual basis for the first two years of employment, and then every two
years afterward.

DATA CENTER ENERGY EFFICIENCY FRAMEWORK
Page 39 of 45
GO-5. Performance Pay (Value 3.5)
Requirement discussion: In organizations where pay-for-performance programs are in
place, it is expected that electrical consumption or operating expenditure is a factor used
to determine the annual performance pay for senior-level data center managers (e.g.,
director or vice-president of infrastructure). This measure will significantly encourage
these individuals to lead the organization and approve projects that yield an overall
reduction in electrical consumption. When multiple factors are involved in determining
performance pay, the value of this factor will be no less than 1/X where X is the number
of criteria being used.
To avoid sub-optimizations (e.g., encouraging one behavior at the expense of another),
it is suggested that multiple metrics, chosen to represent both energy savings and
delivery performance, be combined. For example, the percent of negotiated availability
versus actually delivered availability is one potential performance measure.
Large energy savings should not come at the expense of critical application availability.
Rewarding individuals for producing an unsafe thermal environment, high humidity
levels, unreliable electrical supply, etc., is clearly undesirable.
Activities and Artifacts: An incentive plan must be produced that details how
performance pay is calculated. Performance pay must be determined using at least one
metric that is related to either energy consumption or efficiency.
Ideally, the performance plan should be offered as broadly as possible to all senior IT
executives who control energy efficiency of the data center. This includes data center
managers, server and infrastructure engineers and project managers. When multiple
individuals impact a single metric, it is suggested that the weight be reduced; however,
at minimum, energy-efficiency metrics should be included for determining the
performance pay of the person responsible for energy efficiency and the person
responsible for data center operations.
The organization must also be able to demonstrate that the metric used to calculate
performance pay can be determined based on the existing reporting infrastructure. To
demonstrate this, reports containing all metrics used in performance pay calculation
should be generated.
GO-6. Rationalize Operational Risk (Value 3.8)
Requirement discussion: Organizations that do not systematically rationalize energy
costs versus operational risk often feel that all systems should be designed for maximum
possible redundancy, without consideration of the long-term costs caused byover-
provisioning. While there is a legitimate reason critical devices like core network

DATA CENTER ENERGY EFFICIENCY FRAMEWORK
Page 40 of 45
switches have triple-redundant power supplies, it is probably not justified for an
application server running non-mission-critical applications to be deployed on clustered
systems. Organizations at the highest level of maturity should have a systematic
method or framework for balancing the long-term operating expenses of electricity
against the added risk of non-fault-tolerant designs.
Activities and Artifacts: A risk-assessment template that considers the increased
operational risk of a proposed measure versus the energy savings benefit must be in use.
All system engineers involved in deploying new applications should use this risk-
assessment template. A collection of completed risk assessments for past projects
should be available.
FI-3 Customer Charge Back (Value 3.4)
Requirement discussion: Resources that are free are often misused or taken for granted.
When negotiating service levels for an application, application owners that are not
charged for power costs often want all their applications to run 24x7. However, as soon
as electricity cost is migrated to the user, the user immediately begins serious
consideration of whether 24x7 availability is necessary and whether smaller application
availability windows are acceptable.
To encourage users to consider the cost of energy, it is highly encouraged for data
center professionals to pass some fraction of energy costs to the application owner. If
the administrative burden for this is too high, a fixed offering of application availability
and varying annual operating costs is also acceptable. The goal is not to penalize the
user or create administrative work for IT; rather, the goal is to encourage the application
owner to make responsible decisions by recognizing that increased application
availability and capacity have an impact on energy consumption.
Activities and Artifacts: Initially, when the IT department and a business owner are
planning for the deployment of a new application infrastructure, cost estimates based on
the selected infrastructure configuration option should be observable. A configuration
list of each deployment option and its corresponding price must therefore exist.
Once an application is deployed, a regular bill including the electrical cost of the
application must be prepared and delivered to each business owner. A sample of these
bills should be presented.
The goal of this requirement is to alter a business user‟s behavior and not to punish an
end user. Therefore, it is critical that the initial cost-based sizing template be used for
new application deployment. The configuration tool presents a direct connection
between the configuration decisions made by the business owner and long-term energy
consumption.
DATA CENTER ENERGY EFFICIENCY FRAMEWORK
Page 41 of 45
7. Additional Helpful Practices
The measures listed below are helpful in pursuing energy efficiency; however, they are not
required by this framework.
Measure and Track PUE - Power Usage Effectiveness (PUE) provides a measure of
the amount of energy used by the data center compared to the energy used by the
actual IT equipment. PUE is calculated by dividing the annual electricity consumed
by the entire facility by the annual electricity consumption measured at the output of
the UPS or the input to the IT equipment power distribution units. This metric was
established by the Green Grid and adopted by the EPA as a useful measure of cooling
efficiency.
Although PUE is an important metric (reporting it to the US EPA ENERGY STAR for
Data Centers program is recommended), total energy consumption, IT productivity
and availability are often of greater importance. Many energy efficiency activities,
such as consolidation, virtualization and IT refresh can significantly reduce total
energy consumption and increase productivity by an order of magnitude while PUE
remains constant.
A metric closely related to PUE is Data Center Infrastructure Efficiency (DCIE).
DCIE is simply the inverse of PUE.
Measure and Track server-utilization-to-power ratio–A server continues to
consume electricity when idle. If servers are underutilized, consider adding virtual
machines or applications to increase processing load per server.
Thermal Imaging – A recommended practice is periodic scanning of the data center
with a thermal camera to identify thermal anomalies and hotspots. Because of the
expense of the equipment and expertise necessary to perform Computational Fluid
Dynamics (CFD), it is often most cost-effective to outsource this work to a
professional.
Energy Efficient Lighting– Installation of energy efficient lighting and controls can
reduce energy consumption. The reason this requirement is not part of the core
framework is because the ROI (Return On Investment) is generally poor. In an
average data center the reduction in total energy consumption is just 0.5%. ROI can
be improved if substantial utility incentives or alternate funding arrangements (e.g.,
ESCO models) are available.
Leverage Financial Incentives –Although incentive availability varies significantly
by project and geography, many programs (providing cash payments and tax breaks)
are offered by local utilities or regional, state or federal government agencies. In
2010, $6 billion was offered for energy efficiency funding.

DATA CENTER ENERGY EFFICIENCY FRAMEWORK
Page 42 of 45
While these funds by themselves are generally not sufficient to justify efficiency
modifications, the funds may improve the ROI of your project or enable projects that
would otherwise not happen. A website listing all programs available by state is
included in the implementation kit.
Lower Server Fan Speed –While lowering fans speeds may not be appropriate in all
circumstances (e.g., weak plenum pressure, poor air circulation, etc.), it is possible to
work with the computer server OEMs to optimize fan-speed control algorithms. While
the observed savings were only about 1% per server, this low-cost approach can result
in a cumulative benefit of hundreds of thousands of kilowatt-hours in a large data
center.
Cloud Computing & Collocation Providers – Deploying applications to a third party
does not automatically imply an energy savings - energy savings depends on the
performance of the third-party provider. However, providing efficient application
availability is usually a core competency of major service providers. As such,
deploying an application to a provider with a high efficiency is one technique to
reduce energy consumption; however, it is up to the customer to ensure selection of an
efficient provider.
Hosting applications in the cloud also benefits from high availability standards offered
by most service providers. Rather than building out all or a significant part of a data
center to five nines of availability for the benefit of a small subset of services, the
client data center can be built to a lower level of redundancy while applications
requiring extra reliability are deployed to a cloud provider.

DATA CENTER ENERGY EFFICIENCY FRAMEWORK
Page 43 of 45
Appendix A: Glossary
Aisle - The open space between rows of racks in a data center. Best practices dictate that racks
should be arranged with consistent orientation of front and back of equipment creating „cold‟ and
„hot‟ aisles. Only the front intake air of you servers and devices should be cooled.
Capital Expenditure (CapEx) - A capital expenditure is incurred when a business spends
money to buy or improve assets that have a useful life extending beyond the taxable year.
Examples of CapEx are the purchase of physical assets such as equipment, property or industrial
buildings. CapEx can be contrasted with OpEx.
Cold Aisle Containment (CAC) - A solution that segregates and encloses cold air within the
cold aisle and directs it to the front intake of computing equipment. This prevents unwanted air
mixing, thereby increasing cooling efficiency.
Computer Room Air Conditioner (CRAC, pronounced “crack”) – A device specifically
manufactured for cooling, heating and humidifying computer rooms.
Computer Room Air Handler (CRAH, pronounced “cray”) –A CRAH provides the same
function as a CRAC, but a CRAH does not have a compressor to perform the actual cooling. To
remove heat, a CRAH must rely on a coil that is cooled by an upstream device (such as a chiller).
Hot Aisle Containment System –A solution that directs heated air from the exhaust side of
racks to air-conditioning return ducts in a highly efficient manner.
Liquid Cooling - A general term used to refer to cooling technology that uses a liquid
circulation system (as opposed to air) to evacuate heat from the rack.
Operating Expense (OpEx) - The ongoing operating expenses related to running a data center.
Labor and electrical costs are examples of OpEx. As opposed to CapEx, OpEx does not have
book value beyond the current tax-year.
Plenum - A space used to direct airflow. A typical plenum in a raised-floor environment is the
space under the floor. Although raised floors are a common feature in modern data centers,
some data centers use a concrete slab floor. As such, raised floors are not an explicit
requirement of this framework.
Rack –A rack (also called a cabinet) is a device for holding IT equipment. Rack height is
typically measured in units (U) with a "full rack" being 42U in height.
Variable Frequency Drive (VFD)– A VFD (also called a Variable Speed Drive or VSD)is a
type of alternating current motor that can adjust its rotational speed based on heat load.
A complete glossary is available on the Green Data Center Alliance website at
http:///www.greendca.org/glossary/glossary.aspx.

DATA CENTER ENERGY EFFICIENCY FRAMEWORK
Page 44 of 45
TableA – Summary View of Framework Requirements by Domain
ID Requirement Value Level I Level II Level III
Facility Design & Engineering (FA)
FA-1 Blanking Panels 4.0 √ √ √
FA-2 Cable Management 3.9 √ √ √
FA-3 Tile Perforation Placement 4.2 √ √ √
FA-4 Floor Cutout Seals 4.0 √ √ √
FA-5 Equipment Placement & Orientation 4.3 √ √ √
FA-6 Thermal set point 4.5 √ √ √
FA-7 Containment Solution (Cold or Hot Aisle) 4.2 √ √
FA-8 CRAC Intake Placement 3.3 √
FA-9 Air or Water Side Economizers 4.4 √
FA-10 Energy Efficient UPS 3.4 √
FA-11 Variable Frequency Drives 3.7 √
FA-12 High Efficiency Thermal Insulation and Roofing 3.3 √
Information Technology (IT)
IT-1 Consolidation 4.9 √ √ √
IT-2 Measurement & Verification Technology 3.9 √ √
IT-3 Virtualization 4.1 √ √
IT-4 Enable Server Sleep Modes 4.2 √ √
Process (PR)
PR-1 Data Center Zoning 4.0 √ √ √
PR-2 Configuration Management & Orphaned Servers 3.8 √ √
PR-3 Capacity Management &Right Sizing 3.4 √ √
PR-4 Service Level & Availability Management 3.9 √ √
PR-5 Training & Awareness 3.9 √
Governance (GO)
GO-1 Energy Efficiency Role Defined 3.6 √ √ √
GO-2 Continuous Improvement Program 4.1 √ √
GO-3 Energy\CSR Policy 3.9 √ √
GO-4 Establish & Track Performance Against Targets 3.9 √
GO-5 Performance Pay 3.5 √
GO-6 Rationalize Operational Risk 3.8 √
Finance (FI)
FI-1 Energy Efficient IT Procurement 3.4 √ √ √
FI-2 Asset Refresh Rationalization 3.4 √ √
FI-3 Customer Charge Back 3.4 √

DATA CENTER ENERGY EFFICIENCY FRAMEWORK
Page 45 of 45
TableB – Summary View of Framework by Performance Level
ID Requirement Value
Level I
FA-1 Blanking Panels 4.0
FA-2 Cable Management 3.9
FA-3 Tile Perforation Placement 4.2
FA-4 Floor Cutout Seals 4.0
FA-5 Equipment Placement and Orientation 4.3
FA-6 Thermal set point 4.5
IT-1 Consolidation 4.9
PR-1 Data Center Zoning 4.0
GO-1 Energy Efficiency Role Defined 3.6
FI-1 Energy Efficient IT Procurement 3.4
Level II (All Level I requirements plus the following)
FA-7 Containment Solution (Cold or Hot Aisle) 4.2
IT-2 Measurement & Verification Technology 3.9
IT-3 Virtualization 4.1
IT-4 Enable Server Sleep Modes 4.2
PR-2 Configuration Management and Orphaned Servers 3.8
PR-3 Capacity Management and Right Sizing 3.4
PR-4 Service Level and Availability Management 3.9
GO-2 Continuous Improvement Program 4.1
GO-3 Energy Policy 3.9
GO-4 Establish and Track Performance Against Targets 3.9
FI-2 Asset Refresh Rationalization 3.4
Level III (All Level I & II requirements plus the following)
FA-8 CRAC Intake Placement 3.3
FA-9 Air or Water Side Economizers 4.4
FA-10 Energy Efficient UPS 3.4
FA-11 Variable Frequency Drives 3.7
FA-12 High Efficiency Thermal Insulation and Roofing 3.3
PR-6 Training and Awareness 3.9
GO-5 Performance Pay 3.5
GO-6 Rationalize Operational Risk 3.4
FI-3 Customer Charge Back 3.4