Embed Size (px)
Citation preview

P.Sujatha, and R.Baskaran / International Journal of Engineering Research and Applications
(IJERA) ISSN: 2248-9622 www.ijera.com Vol. 3, Issue 2, March -April 2013, pp.653-661
653 | P a g e
Data Base Management Of Keelaiyur Block Nagappatinam District
Tamil Nadu Using Remote Sen Sing And Gis
P.Sujatha, and R.Baskaran Research scholar, Dept of Earth sciences, Tamil university, Thanjavur
Abstract: The underlying concept of a database is
that data needs to be managed in order to be
available for processing and have appropriate
quality. This data management includes both
software and organization. The software to create
and manag e a database management system.
When all access to and use of the database is
controlled through a database management
system, all applications utilizing a particular data
item access the same data item which is stored in
only one place. A single updating of the data item
updates it for all uses. Integration through a
database management system requires a central
authority for the database. With the help of GIS
data base management including data on
demography occupation, land utilization, rural
electrification, and agriculture implements, post
and telegraph offices telephone, education to
analyzing processes, data base tocater to the
needs of planning sharing information to various
user organization with necessary data analysis ect.
The Present study is creating data base for the
keelaiyur block of Nagaipattinam , Tamilnadu.
Through Geospatioal Techniques .
I. INTRODUCTION
The “information” and “data” are frequently
used inter changeably; however, information is
generally defined as data meaningful or useful to the
recipient. Data items are therefore the raw material
for producing information. The underlying concept of
a database is that data needs to be managed in order
to be available for processing and have appropriate
quality. This data management includes both
software and organization. The software to create
and manage a database management system. When all access to and use of the database is controlled
through a database management system, all
applications utilizing a particular data item access the
same data item which is stored in only one place. A
single updating of the data item updates it for all
uses. Integration through a database management
system requires a central authority for the database.
The data can be stored in one central computer or
dispersed among several computers; the overriding
requirement is that there be an organizational
function to exercise control. A system is spatially
referenced information, including computer programs
that acquire, store, manipulate, analyzed, and display
spatial data.
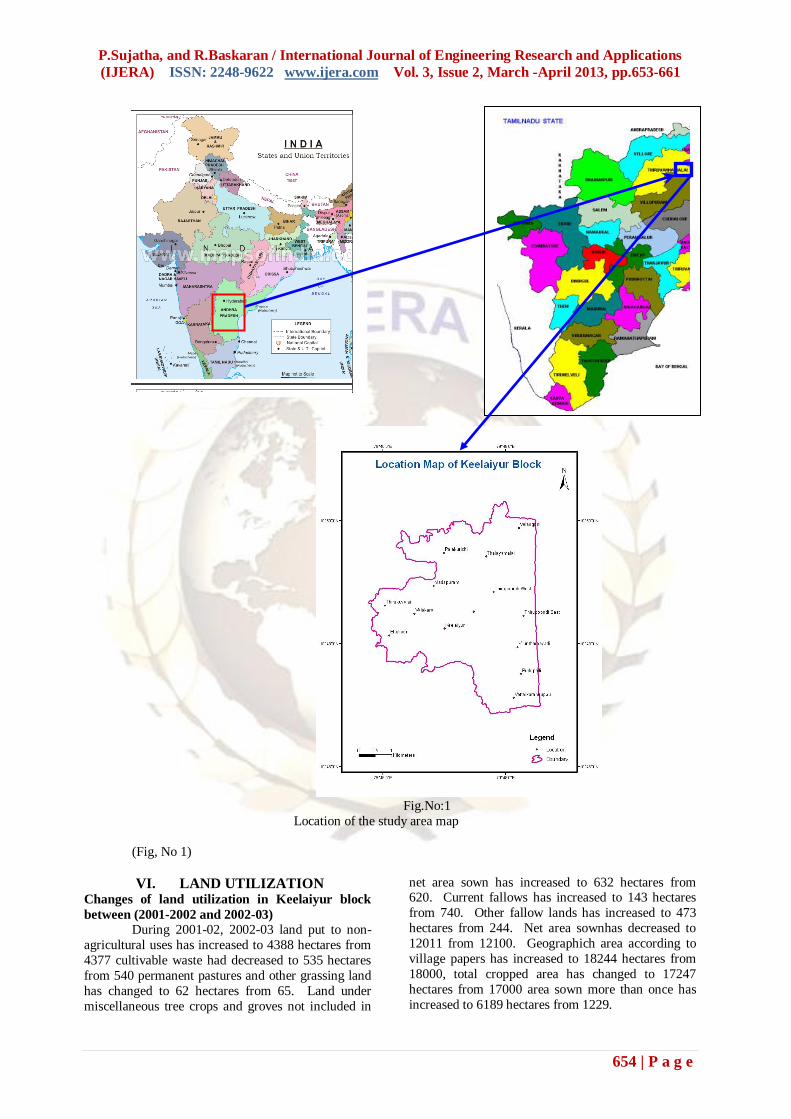
II. STUDY AREA The district of Nagapattinam has been
carved out as a separate district by bifurcation of
Thanjavur district. Six taluks namely Sirkali,
Tharangampadi, Mayiladuthurai, Valangaiman,
Nagappattinam and Vedaranyam were detached
from their parent district. The district is bounded by
the Bay of Bengal in the east, Palk Strait in the south,
Thiruvarur and Thanjavur district in the west, and the
Cuddalure district in the North. The district is spread
over 2715.83 sq.km. Keelaiyur Block is one of the
2 blocks in Nagapattinam district situated in the
northern most deltaic region of the district. This block consists of 43 revenue villages in kilvelur
taluk. This block is bound on northern side, by
Thirukkuvalai block and Vedaranyam block in
southern side. Nagappattinam block lies to its east
and Thiruvarur block is on its western side. This
block has an ara 16052 sq.km. it consists one town
panchayat and 5 village panchayats.
III. LOCATION OF THE AREA This district is having an area of 2715.83
sqkms in its fold. It extends in latitude from 10’10’N
to 11 20’N and longitude from 79.15’ E to 79’50 E.
The general geological formation of the district is
plain and coastal. The Cauvery and its off shoots are
the principle Rivers. Nagapattinam is a coastal
district having a long coastline of 141km. the study
area namely keelaiyur block in Nagappattinam
district is found in the inlands with coastal line. ( Fig
1.1)
IV. AIMS AND OBJECTIVES
The present study aims to create a data of
land use characteristics and its management for the
Keelaiyur block in Nagappattinam district.
V. METHODOLOGY Secondary data were collected from the
district headquarters, panchayat and statistical office
in the Nagappttinam district. With the help of GIS the
data were analyzed and interpreted.
P.Sujatha, and R.Baskaran / International Journal of Engineering Research and Applications
(IJERA) ISSN: 2248-9622 www.ijera.com Vol. 3, Issue 2, March -April 2013, pp.653-661
654 | P a g e
Fig.No:1
Location of the study area map
(Fig, No 1)
VI. LAND UTILIZATION Changes of land utilization in Keelaiyur block
between (2001-2002 and 2002-03)
During 2001-02, 2002-03 land put to non-
agricultural uses has increased to 4388 hectares from
4377 cultivable waste had decreased to 535 hectares
from 540 permanent pastures and other grassing land
has changed to 62 hectares from 65. Land under
miscellaneous tree crops and groves not included in
net area sown has increased to 632 hectares from 620. Current fallows has increased to 143 hectares
from 740. Other fallow lands has increased to 473
hectares from 244. Net area sownhas decreased to
12011 from 12100. Geographich area according to
village papers has increased to 18244 hectares from
18000, total cropped area has changed to 17247
hectares from 17000 area sown more than once has
increased to 6189 hectares from 1229.

P.Sujatha, and R.Baskaran / International Journal of Engineering Research and Applications
(IJERA) ISSN: 2248-9622 www.ijera.com Vol. 3, Issue 2, March -April 2013, pp.653-661
655 | P a g e
Changes of land utilization in Keelaiyur block
between 2002-03 – 2003-04:
During 2002-03 to 2003-04 land put to non-
agricultural used has decreased to 4377 hectares from
4388. Cultivable waste has decreased to 540 hectares
from 985. Permanent pastures and other grassing land has changed to 65 hectares from 62, land under
miscellaneous tree crops and groves not included in
net area sown has decreased to 620 hectares from
708. Current fallow has decreased to 140 hectares
from1539. Other fallow land has increased to 244
hectares from 157. Net area sown has decreased to
12100 from10405 geographical area according to
village papers has changed to 18000 from 18244.
Total cropped area has increased to 17000 hectares
from 10405 area sown more than once has increased
to 1229 hectares from 1130.
Changes of land utilization in Keelaiyur block
between (2003-04 to 2004-05):
During 2004-2005 to 2005-06 land put to
non-agricultural uses has increased to 3047 hectares
from 3050. Cultivable waste has 1628 hectares from
1628. There is no difference same area in the found. Permanent pastures and other grassing land has
changed to 62 hectares. There is no difference some
are is found. Land under miscellaneous tree crops
and fallow has increased to 178 hectares from 553.
Other fallow lands has decreased to 1195 hectares
from 1234. Net area sown has increased to 11388
hectares from 10977. Geographical area according to
village papers has 18244 hectares from there is no
difference same area was found than once has
increased to 3066 hectares from 130. (Table,1Fig ,2)
(Table No, 1)

P.Sujatha, and R.Baskaran / International Journal of Engineering Research and Applications
(IJERA) ISSN: 2248-9622 www.ijera.com Vol. 3, Issue 2, March -April 2013, pp.653-661
656 | P a g e
(Fig No,2)
Fig.No:2 a
VII. RURAL ELECTRIFICATION Changes in the rural electrification (Number) of keelaiyur Block
During 2001-2002 to 2002-2003 Number of villages electrified has same Numbers of area Number of
towns electrified has same area Numbers of ham lest has same Number 106 of area population covered Number of
street lights 3514 there is no difference found in the area. In 2002-2003 to 2003-2004 Number of villages
electrified has same area Number of towns electrified, Number of ham lest population covered Number of street
light electrified no difference is found in the area Rural electrified was found. In 2003 – 2004 to 2004 – 2005, 29
Numbers of Number Villages Electrified has been seen – 1 Number of Number of Towns electrified has same
value, 106 found in the area. Population covered has increased to 69133 from 788721 was found. Number of
street light, Tube light 3002 has increased to 3002 from 3116 was found. Sodium vapor lamps have increased to 401 from 449 found in the area. Ordinary bulbs have increased to 1228 from 1262 in the area. In 2004 – 2005 to
0
2000
4000
6000
8000
10000
12000
14000
16000
18000
20000
FOREST
B.U L.A
C.W P.G L.U
C.F
O.L
N.A.S
G.V.P
T.C.A A.S
2001-02
2002-03
2003-04
2004-05
2005-06

P.Sujatha, and R.Baskaran / International Journal of Engineering Research and Applications
(IJERA) ISSN: 2248-9622 www.ijera.com Vol. 3, Issue 2, March -April 2013, pp.653-661
657 | P a g e
2005 – 2006 Number of villages electrified has same area. The Number of Towns electrified has no difference.
Number of hamlets electrified 106 has same area. Population covered 78872 has same area. Number of street
lights 4938 has no changes is found in the area was found. ( Fig ,3)
Fig No,3
Agricultural Implements and machinery

P.Sujatha, and R.Baskaran / International Journal of Engineering Research and Applications
(IJERA) ISSN: 2248-9622 www.ijera.com Vol. 3, Issue 2, March -April 2013, pp.653-661
658 | P a g e
Fig.No:4
Changes in the Agricultural implements and
machinery (in hectares) of Keelaiyur Block
between (2001 – 2002 to 2005 – 2006):
During 2001 – 2002 to 2002 –2003.
Agricultural implement and machinerys plough has
increased to 2666 Numbers From 268 wooden has
increased to 1655 Numbers of was there. Iron has decreased to 1011 Numbers was identified. Water
pump for irrigation purpose has there is no difference
same Numbers was in use wooden and iron gas
there is no changes same Numbers was in utilization.
Tractors 153 Numbers of has increased to 154
Numbers from 153 Government 5 private 148 was
there.Sugar cane crushers and oil chains, Rice mill
was identified.
During 2002-03, 2003-04 agricultural
implements plough has increased to 2666 number
from 589. In 2002-03 wooden 1655 number of was
in use. Iron 1011 number of was identified has increased to was there. In 2003-04 wooden has
decreased to 301 number iron has decreased to 288 n
umber has been seen. Water pumps for irrigation
purpose has increased to 250 number from 105 was
there. Government 140 private 110 was in use.003-
04 waster pumps for irrigation purpose worked by
electrical power. 110 was in use. Tractors has
increased to 153 numbers from 105. Sugar cane
crushers oil chains and rice mills was in use.
2003-04 & 2004-05: During 2003-04 & 2004-05 agricultural
implements in Keelaiyur block plough has increased
to 589 number from 586 wooden has increased. 301
number was there Iron has decreased to 288 number
from 286 was in use.
Water pumps for irrigation on purpose has
there is no changed. Same number was identified. In
2003-04 wooden and iron plough has increased from
301number 288 was utilized. Sugar cane crushers
and oil chains was found. Rice mills has decreased
to 5 number from 25 was there. In 2004-05 rice mills
increased to 25 numbers has been seen.
2004-05 & 2005-06: During 2004-05 & 2005-06 plough has there
is no changes same number was there. In 2004-05
wooden and iron has same numbers 285 to 301 was
in use water pumps for irrigation purpose has there is
no difference same number 105 from 105. Worked
by oil Engines and worked by electric power same
numbers 45 to 60 was found. Tractors has there
is no changes same number 49 from 49 was in use.
Government and private 49 was found. In 2005-06
private 49 was identified. Rice mills has there is no
difference. Same number 25 from 25 was in use.(Table2 ,Fig ,4)
COMMUNICATION
POST & TELEGRAPH OFFICES &
TELEPHONES:
Changes in the post & Telegraph offices &
Telephone of Keelaiyur Block
During 2001 – 2002 to 2002 – 2003 post
offices doing postal business were there. There is no
difference of found in the area post offices in
Numbers post & Telegraph office was found. There is no change found in the area letter boxes in 117
Numbers was found Telephone Exchange / Sub
Exchange Telephone in use are Number of public
call offices was Utilized. There is no difference of
found in the area.
0
200
400
600
800
1000
1200
1400
1600
1800
Wooden Plough
Iron Plough
Water Pumps
Tractors Sugarcane Crusshers
Ghanise
2001-02
2002-03
2003-04
2004-05
2005-06

P.Sujatha, and R.Baskaran / International Journal of Engineering Research and Applications
(IJERA) ISSN: 2248-9622 www.ijera.com Vol. 3, Issue 2, March -April 2013, pp.653-661
659 | P a g e
In 2002-2003 to 2003-2004 post offices
doing postal business alone are there post and
Telegraph offices and Telephone Exchange / Sub
Exchanges was found letter boxes has decreased to
58 from 62 was found. Telephone in use has
decreased to 2682 from 3756. Public call office has increased to 114 from 39.
During 2003 – 2004 to 2004 – 2005 post
offices doing postal business alone has decreased to
11 from 12 post and Telegraph office has decreased
to 11 from 13 was there. Letter boxes has decreased
to 62 from 117 Telephone Exchanges / Sub-
Exchange was identified. There is no difference
found in the area Telephone Exchanges / Sub
Exchanges 4 Number was noticed Telephone in use
has decreased to 3756 from 3944 public call offices
has increased to 39 from 13.
During 2004 – 2005 to 2005- 2006 post offices doing
postal business alone are post & Telegraph offices and letter boxes and Telephone Exchange / Sub
Exchange was found. There is no difference found in
the area, Numbers of same area, Numbers of
Telephone has decreased to 3756 from 3944
Numbers of public call offices has increased to 39
from 13.(Fig ,5)
Fig.No:5
EDUCATIONAL INSTITUTION
CHANGE IN THE EDUCATION:
Educational institutions student in 2001 – 2002 to 2002 – 2003 in the student in 2001 – 2002 to 2002 –
2003 in the pre primary schools has decreased to 750 from 760. The primary schools have decreased to 1585 from
610. The middle schools have decreased to 2460 from 2480. The higher schools have decreased to 6212 from
6219. The higher secondary schools have number changes data in the area. According to 2002 – 2003 to 2003 –
2004 in the pre primary school boys and Girls has increased to 760 from 245. The primary school boys and Girls
have decreased to 1610 from 4598. The middle school boys and Girls have increased to 2600 from 855 and Girls
has decreased 500 from 904. The High school boys and Girls has increased to 6219 from 856 and Girls has
increased to 185 from 2189 and Girls has decreased to 140 from 2270 was identified. During 2003 – 2004 to 2004
– 2005 in the pre primary school boys and Girls has decreased to 245 from 347 and Girls has decreased to 196 from 347. The primary schools boys and Girls have decreased to 4598 from 3407 and Girls has increased to 4380
from 3224. The middle schools boys and Girls have decreased to 855 from 3507. The Girls has decreased to 904
from 2952. The High school boys decreased to 567 from 896 and Girls had decreased to 559 from 896 and girls
have decreased to 559 from 882. The Higher secondary school boys and Girls has decreased to 2189 from 2821
Girls has decreased to 2270 from 3002 was found.

P.Sujatha, and R.Baskaran / International Journal of Engineering Research and Applications
(IJERA) ISSN: 2248-9622 www.ijera.com Vol. 3, Issue 2, March -April 2013, pp.653-661
660 | P a g e
Table .3
Fig No.5
0
2000
4000
6000
8000
10000
12000
2001 2002 2003 2004 2005
pre- primary
primary
middle school
high school
higher secondary school
Type of institution Students
2001 2002 2003 2004 2005
Pre-primary school 2137 1400 630 630 630
Primary school 4458 2915 6631 6631 6631
Middle school 63 2689 6559 6559 6459
High school 4882 11009 1778 1778 1778
Higher secondary school 350 205 5523 5523 5823
Type of institution Trained Teacher
2001 2002 2003 2004 2005
Pre-primary school 7 7 21 21 21
Primary school 80 80 154 154 154
Middle school 105 105 96 96 306
High school 55 55 25 25 25
Higher secondary school 368 26 123 123 123

P.Sujatha, and R.Baskaran / International Journal of Engineering Research and Applications
(IJERA) ISSN: 2248-9622 www.ijera.com Vol. 3, Issue 2, March -April 2013, pp.653-661
661 | P a g e
Fig No.6
VIII. SUMMARY AND CONCLUSION The present project of the factor location is
a widely accepted factor in the change in the
keelaiyar block. The total population are cultivators;
Agriculture implements and machinery, irrigation,
land utilization, Rural electrification,
communication, transportation, public health, water
supply, Essential services finance of panchayat
union, programme recording Rural development, Rural development, number of ware housing storage
Educational institution of this block.The study of
this block indicated that occupation in the rural
areas very few cultivators found in the urban areas.
In this block the cultivated lands are
irrigated by flow irrigation and ground water
irrigation most of the areas are irrigated by flow
irrigation cereals, pulses, oil feeds, fibers and other
crops and an irrigated area,As for as land utilization
is concerned the area of forest changed during the
entire census.Thetotal cropped areas are gradually decreased in this area. All the villages in the block
are electrified for the 78872 villages for the
convenience of the people public lighting were
installed in this block.. Telephone is the main
communication system in this block. Number of
Telephone and public call office are increased in
these areas.
The study of the medical and
health structure shows that there is only one Indian
medicine. Primary health center available in this
block. The most of the amount was utilized for
development of this block as it is seen from the data.
REFERENCES
[1] Anandand rajesh kumar (2003)principles of
remote sensing ,sri venkateswara
publishers,kumbakonam.
[2] Burroughs P.P.&Mc Donnel , R.A. 1998,
principles of GIS, oxford university press,
PP.299
[3] Burroughs,P.A., principlesof geographic information Analysis for land resources
Assessment,1986.Clarendon press.
[4] Chrisman, N.R. (1997) Exploring geographic
information system. John wiley and sons.
[5] Karthikeyan ,(2001) Fundamental of
geography praveena publications,
Coimbatore.
[6] Kale, singh and Roy (2002) biomass and
productivity estimation using aerospace data
and geographic information system.
[7] Sahai (1985)Agriculture Remote Sensing in the India Context, Ahmedabad.
[8] John Best and James Kahn , (2004) Research
in education , Prentice –Hall of India private
Ltd,New Delhi.
0
50
100
150
200
250
300
350
400
2001 2002 2003 2004 2005
pre- primary
primary
middle school
high school
higher secondary school