Embed Size (px)
Citation preview

DATA AND STATISTICS FOR ANALYZINGTRADE IN SERVICES
And its applications to World Bank country work
Jose Guilherme ReisPractice Manager
International Trade Practice
2
How are services traded?
• Mode 1: Cross-border – services supplied from the territory of one Member into the territory of another, e.g. software services through e-mail to another country
• Mode 2: Consumption abroad – services supplied in the territory of one Member to the consumers of another, e.g. education services in another country
• Mode 3: Commercial presence – services supplied through type of business or professional establishment of one Member in the territory of another, e.g. FDI (2/3 services; Hoekman1996)
• Mode 4: Presence of natural persons – services supplied by nationals of one Member in the territory of another, e.g. doctors moving to foreign country to temporarily provide their service
Percentage of world services trade
25 – 30
10 – 15
55 – 60
less than 5
Source: Magdeleine and Maurer 2008

3
Challenges with measuring services trade flows
• Intangible nature of services• Limited capacity of national statistics agencies• Dispersed data sources
– Mode 1: BoP– Mode 2: BoP– Mode 3: FATS / BoP– Mode 4: BoP (remittances)
– Tourism: Tourism Satellite Account– Health Services: National Health Account

4
A variety of data sources are used for World Bank analyses on services trade• Services trade with the world
– World Bank World Development Indicators– UNCTAD Data on Trade in Services– IMF Balance of Payments Statistics Yearbook
• Bilateral services trade– World Bank Trade in Services Database
• Value added services trade– OECD/WTO Trade in Value Added Database– World Bank Export of Value Added Database– Country input-output tables
• Commercial presence– Foreign Affiliates Trade Statistics– Foreign Direct Investment proxies

5
Measuring services trade with the world• Based on countries’ Balance of Payments components
– Exports and imports of modes 1 and 2– Annual (sometimes quarterly) time series– Available for most countries worldwide
UNCTAD Data on Trade in Services– 1980-current– Total services and 11 services categories
World Bank World Development Indicators– Services in GDP and employment (1960-current)– Services trade (2005-current): total services and 5 services
categories– Collected from IMF Balance of Payments Statistics Yearbook

6
Example: Burkina Faso DTIS update
Can services be an untapped opportunity for export diversification and growth in Burkina Faso?• Burkina Faso’s recent export performance in services has been one of the
most dynamic in the sub-region• But exports grew from a low base, and Burkina Faso’s services export sector
continues to be one of the least developed in the region
Services export-to-GDP ratio
12
USD) 2005
BFA2.88
BENCIVGNB
MLI
NER
SEN
TGO
010
20S
ervi
ces
expo
rts(%
o4 6 8 10 12
Log GDP per capita (current US
Services export growth and values
020
040
060
080
0
Exp
ort v
alue
(milli
on U
SD
)
020
4060
8010
0
Exp
ort g
row
th (%
)
2005 2006 2007 2008 2009 2010
Year
Export Growth Export Value
Burkina Faso, 2005-10
Source: UNCTAD. Source: World Bank WDI.
7
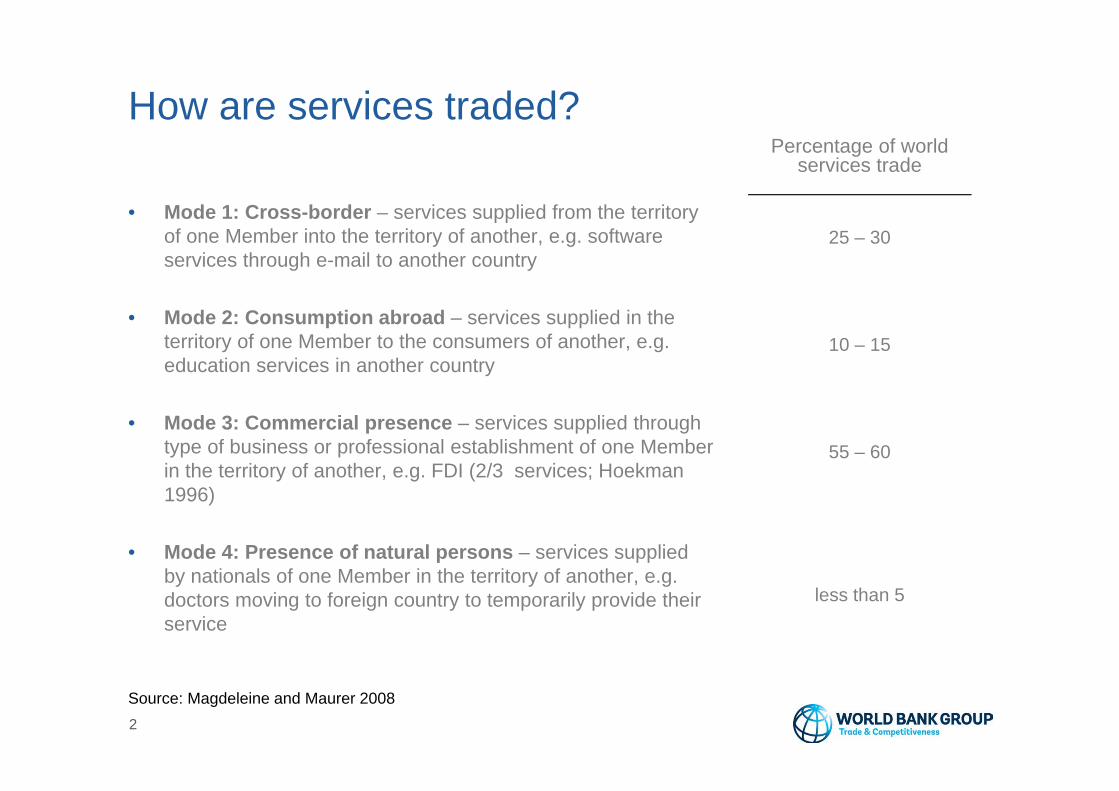
Example: Burkina Faso DTIS update, cont.
• Exports of transport and travel services as a share of GDP are below expected levels and below other countries in the region
• Impediments to services trade was important to understanding this result
Transport, travel and OCS export-to-GDP ratio2010
BFA.47
BENCIV
GNBMLINERSEN
TGO
010
Tran
spor
t ser
vice
s ex
port
4 6 8 10 12
Log GDP per capita (current USD) 2010
BFA.78
BEN
CIVGNB
MLINER
SEN
TGO
010
Trav
el s
ervi
ces
expo
rts
4 6 8 10 12
Log GDP per capita (current USD) 2010
BFA1.62 BEN
CIV
GNB
MLI
NER
SENTGO
010
Oth
er s
ervi
ces
expo
rts
4 6 8 10 12
Log GDP per capita (current U
Source: World Bank WDI.

8
Measuring bilateral services trade
World Bank Trade in Services Database• Provides a ‘global’ picture of bilateral trade in services
for developed and developing countries– Developed by T&C with Francois et al. (2013)– Consolidates multiple sources of bilateral trade data on services
(UN, Eurostat, OECD) and global trade data (IMF)– Applies mirror techniques to capture North-South trade (South-
South remains largely unreported)– Cross-border trade and consumption abroad (modes 1 and 2)– Reported across sectors (BOP codes), economies (195) and
years (1981-2010)
9
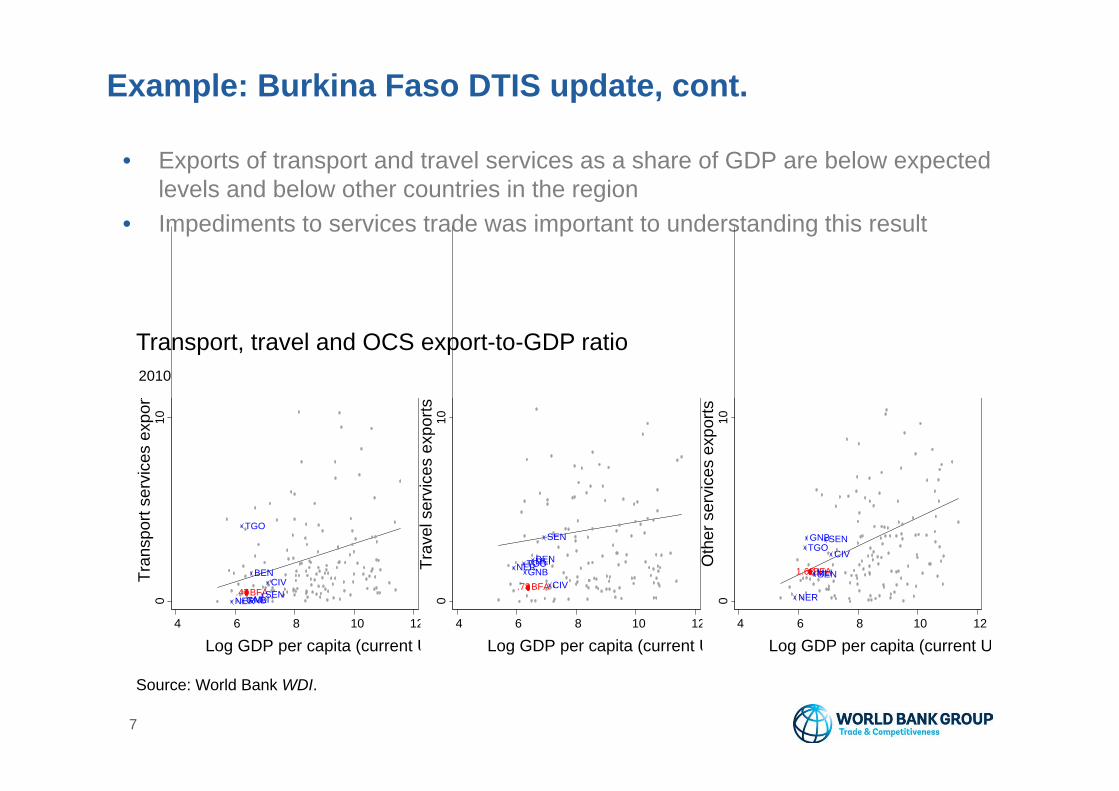
Example: Turkey-MashreqWhat potential linkages and complementarities in services trade exist between Turkey and Mashreq countries?• Using a variety of indicators, the evidence on whether scope exists for increased
integration of these countries through services trade is limited• Although some countries in the region are found to under trade, most countries’
current export levels to Turkey are above or close to expected given structural trade determinants
EGY IRN
ISR
02
46
8lo
g of
pre
dict
ed s
ervi
ces
expo
ts, F
E (0
5-09
)
2 3 4 5 6 7log of predicted services exports, GDP (05-09)
TUR
Benchmarking bilateral trade using a gravity modelTurkey’s export relationships, 2005-09
Source: World Bank TSD.
10
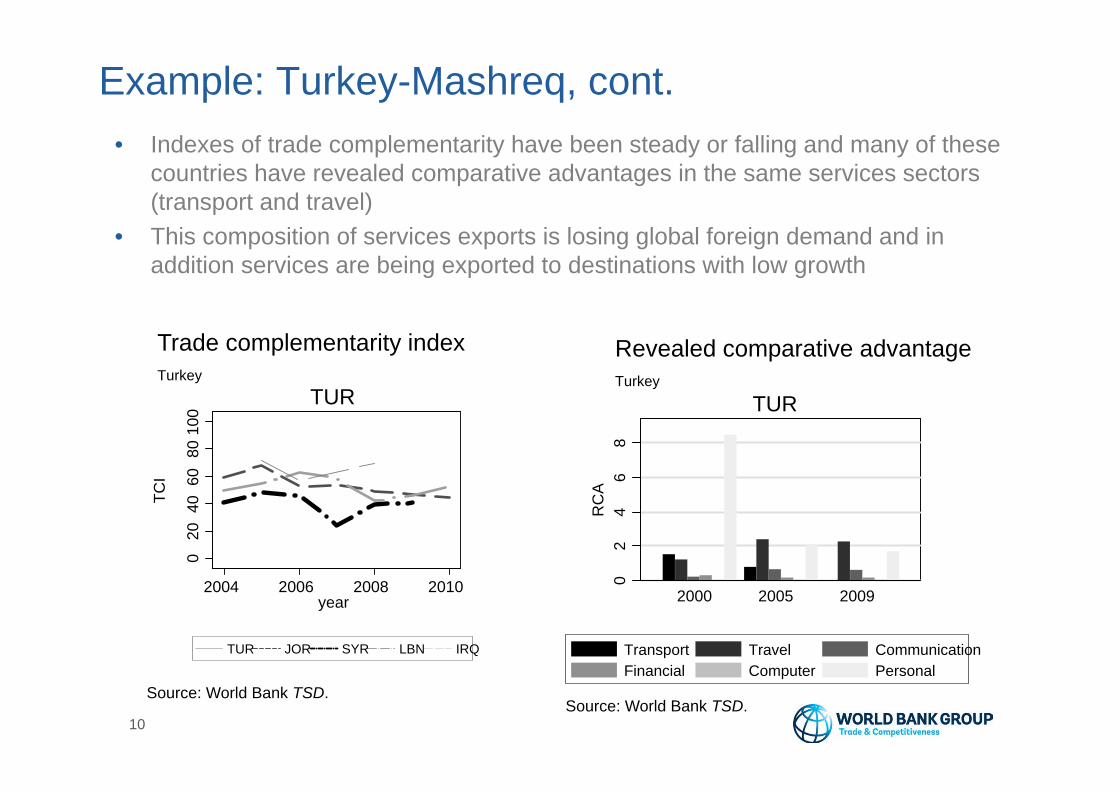
Example: Turkey-Mashreq, cont.• Indexes of trade complementarity have been steady or falling and many of these
countries have revealed comparative advantages in the same services sectors (transport and travel)
• This composition of services exports is losing global foreign demand and in addition services are being exported to destinations with low growth
020
4060
8010
0
TCI
2004 2006 2008 2010year
TUR
TUR JOR SYR LBN IRQ
Source: World Bank TSD.
Trade complementarity indexTurkey
Transport Travel CommunicationFinancial Computer Personal
02
46
8R
CA
2000 2005 2009
TUR
Revealed comparative advantageTurkey
Source: World Bank TSD.

11
Measuring value added services tradeWorld Bank Export of Value Added Database• Measure value added exports of services and the linkages
with other export sectors– Developed by T&C with Francois et al. (2013)– Based on input-output tables from GTAP– Measures gross, direct and indirect value added exports based on
backwards versus forward linkages– Reported across 27 sectors (9 commercial services, 3 primary and
14 manufacturing), economies (118) and years (1992-2011)OECD/WTO Trade in Value Added Database
– 66 countries, 5 services categories, 1995-2009– (New release soon with updated years, more countries and
disaggregated services sectors)– Includes additional indicators such as foreign and re-imported value
added in exports based on the OECD’s own input-output tables
12
Example: Ethiopia services-manufacturing linkages
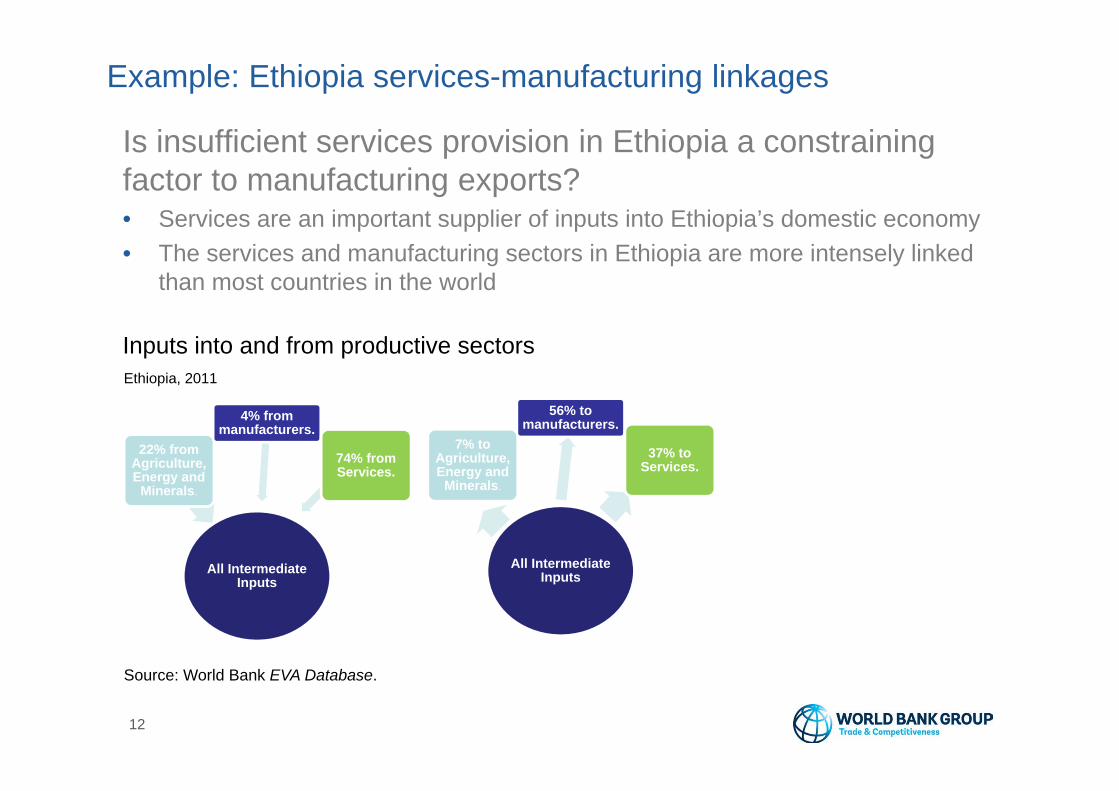
Is insufficient services provision in Ethiopia a constraining factor to manufacturing exports?• Services are an important supplier of inputs into Ethiopia’s domestic economy• The services and manufacturing sectors in Ethiopia are more intensely linked
than most countries in the world
All Intermediate Inputs
22% from Agriculture, Energy and
Minerals.
4% from manufacturers.
74% from Services.
All Intermediate Inputs
7% to Agriculture, Energy and
Minerals.
56% to manufacturers.
37% to Services.
Inputs into and from productive sectorsEthiopia, 2011
Source: World Bank EVA Database.
13
Example: Ethiopia services-manufacturing linkages, cont.
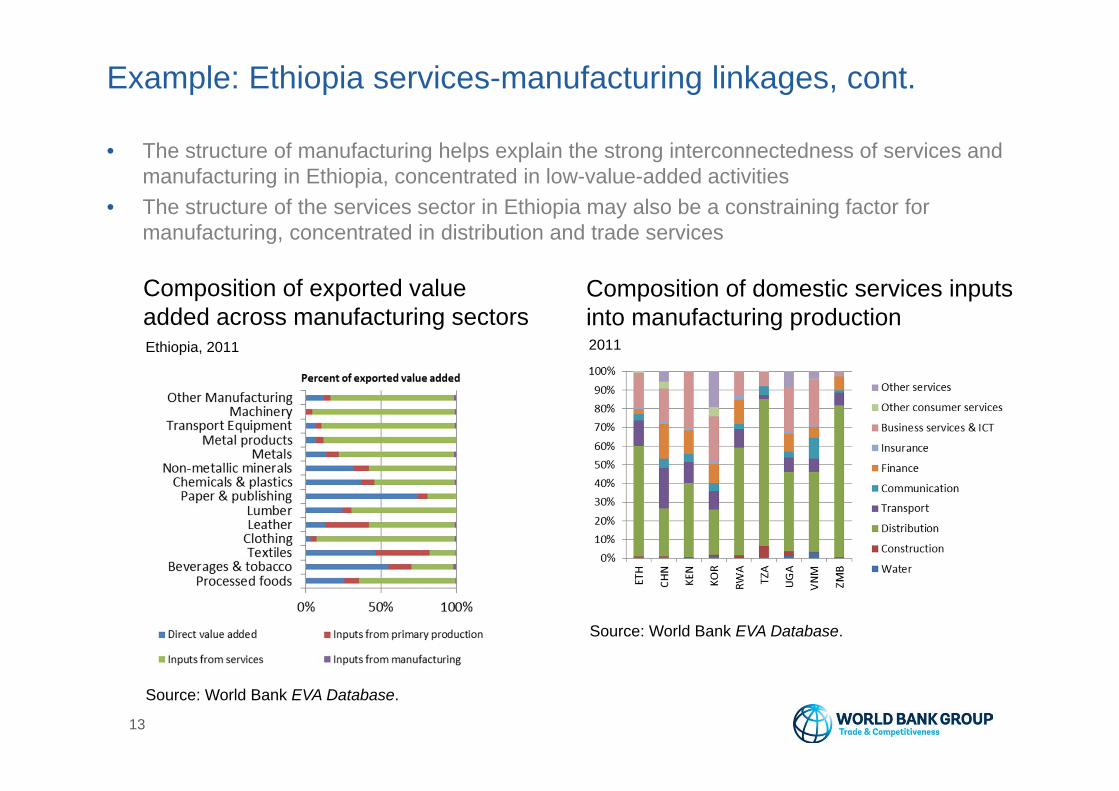
• The structure of manufacturing helps explain the strong interconnectedness of services and manufacturing in Ethiopia, concentrated in low-value-added activities
• The structure of the services sector in Ethiopia may also be a constraining factor for manufacturing, concentrated in distribution and trade services
Composition of domestic services inputs into manufacturing production2011
Composition of exported value added across manufacturing sectors Ethiopia, 2011
Source: World Bank EVA Database.
Source: World Bank EVA Database.
14
Poor data available to other modes of services supply
Commercial Presence • FATS - Foreign Affiliates
Trade Statistics – measures “trade in services”
by foreign firms– Available mostly for OECD
countries• FDI
– Captures cross-border capital flows in the services sector
– proxy for sales of foreign services providers
Presence of Natural Persons• No specific data source • Remittances sometimes
used as proxy -but poor substitute. Includes:– personal transfers: all
current transfers from resident to nonresident households
– compensation of employees: can further inform importance of Mode 4 in the country, but does not reflect value of services sale
In practice, analysis for Modes 3 and 4 constrained by these data limitations.

15
Challenges of measuring restrictions to services trade
• Measuring legal and regulatory restrictions• Regulation / protection behind the border
• Captured by GATS disciplines on Market Access, National Treatment, Domestic regulation
• Examples: licensing procedures, price regulation
• Regulation in trade in services can respond to market failures and other legitimate policy concerns
• Information asymmetries in financial and professional services • Anti-competitive practices by incumbents in telecom services• Zoning policies in urban / historical areas
• Harder to quantify than tariffs• Information available from
– Regulatory databases (WTO iTip, WB STRIs, OECD STRIs)– Schedules of commitments / reservations lists– Field-work (RASTI, surveys)

16
WB STRI
16
• 102 countries: – 78 developing countries
• Policy dimensions covered:
– Barriers to foreign entry and ownership
– Licensing requirements– Restrictions on
operations– Regulatory environment
• Focus is on measures that discriminate against foreign services and service providers;
– but we also cover certain non - discriminatory measures which significantly affect trade
17
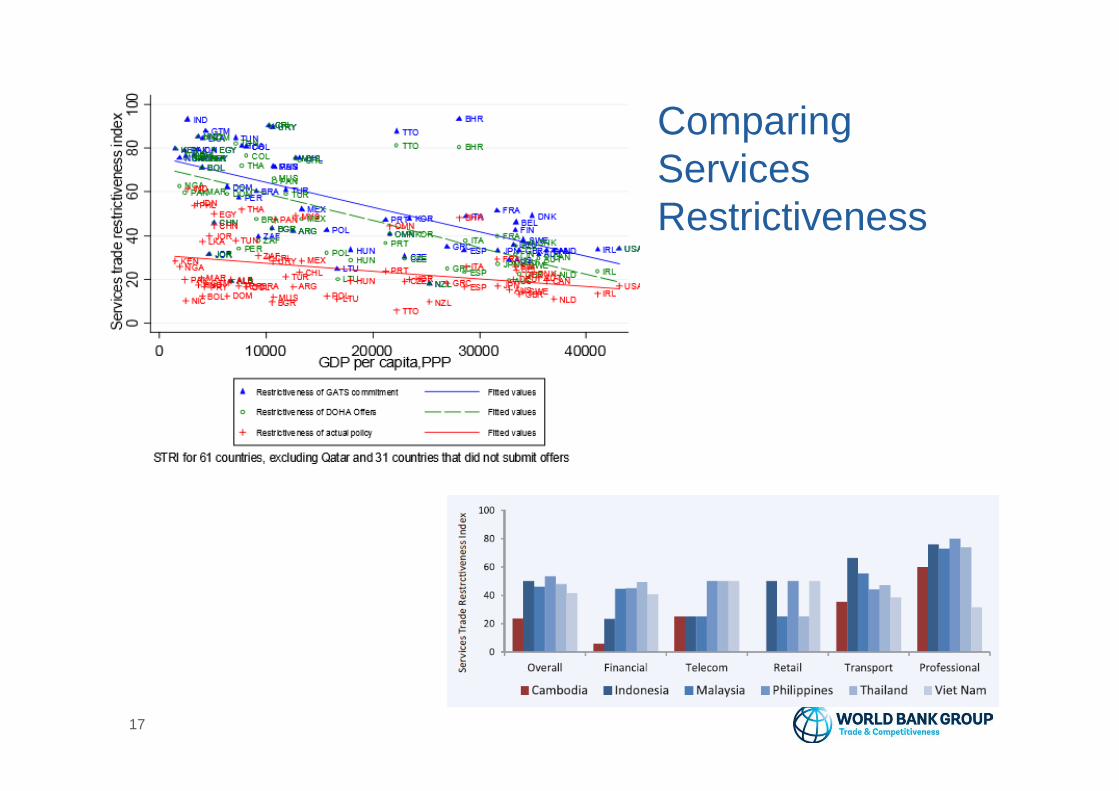
Comparing Services Restrictiveness

18
Regulatory Assessment of Services Trade (RASTI)
• Fieldwork-based, country-specific analysis
• focus on both regulation and governance
• capture formal measures and de facto practices

19
regulatory mapping: typology of measuresquantitative qualitative
establishm
ent
• Monopoly / exclusive service suppliers• Numerical restrictions• Zoning / Geographical restrictions• Limitations to foreign equity• Economic Needs Tests• Authorization / permit (non-qualified)
• Licensing onoQualifications / EducationoExperience oTechnical capacity
• Nationality / residency of services• Residency• Track record requirements• Requirement to subscribe to association• Approval of mergers and acquisitions• Form of establishment• Prohibition• Minimum capital requirements
operation
• Numerical restrictions onotransactionooperations / outputoemployeesorepatriation of fundsoduration of license / divestmentohours of operations
• Screen / performance quotas• Performance requirements
• Nationality / residency of managers, boards of directors• Land Ownership• Discriminatory Taxation• Access to Subsidies• Knowledge Transfer• Advertising limitations• Rules on anti-competitive behavior• Limitations on distribution channels• Limitations on pricing• Limitations on transfer of funds• Type of shares owned by foreigners• Performance requirements• Import permits• Access to government contracts
Source: authors

Thank you