Embed Size (px)
DESCRIPTION
Data and Problem Analysis. Keeping it Useful and Simple. Use of Data Analysis. Data analysis is a body of methods that help to describe facts, detect patterns, develop explanations, and test hypotheses. - PowerPoint PPT Presentation
Citation preview

Data and Problem Analysis
Keeping it Useful and Simple

Use of Data Analysis
• Data analysis is a body of methods that help to describe facts, detect patterns, develop explanations, and test hypotheses.
• But data analysis is not about numbers — it uses them. Data analysis is about the world, asking, always asking, “How does it work?”

Keeping Data Analysis Simple
• In data analysis the real “trick” is to simplify the problem and the best data analyst is the one who gets the job done, and done well, with the most simple methods.
• The “straight line”, is the best tool for figuring out how things work, reserved for data we can plot on a graph
• The “additive model” is used for data we organize in tables and then conduct analysis on different parameters

5 Rules of Data Analysis1. Look At the Data / Think About the Data /
Think About the Problem / Ask what it is you Want to Know.
2. Estimate the Central Tendency of the Data.3. Look at the Exceptions to the Central
Tendency (Do they prove your hypothesis false?)
4. Validity / Does the Data Make Sense (“True”)5. Keep It Simple – No Need for Complexity

Simple Data Analysis Tools
• Trend Analysis
• Exception Analysis
• Gap Analysis
• Correlation Analysis

Problem Analysis
A poorly defined problem - or a problem whose nuances you don't completely understand - is much more difficult to solve than a problem you have clearly defined and analyzed.
The way a problem is worded and understood has a huge impact on the number, quality, and type of proposed solutions.

Stated most simply, a problem is the difference between what is, and what might or should be.
It does, however, take time, both to formulate and to fully analyze the problem. Most people underestimate the work they need to do here and the time they'll need to spend. But this is the legwork, the foundation on which you'll lay effective solutions.
This isn't the time to take shortcuts.

1. Start with what you know. 2. Decide what information is missing. 3. Gather information on the problem. Most commonly,
what you hear or read will fall into one of the following categories: • Facts (I Know and Can Prove It)• Inference (Based on Experience and Beliefs)• Speculation (It Might Be)• Opinion (I think that...)
4. Define the problem.

• Define the problem in terms of needs, and not solutions. If you define the problem in terms of possible solutions, you're closing the door to other, possibly more effective solutions.
• Define the problem as one everyone shares; avoid assigning blame for the problem.
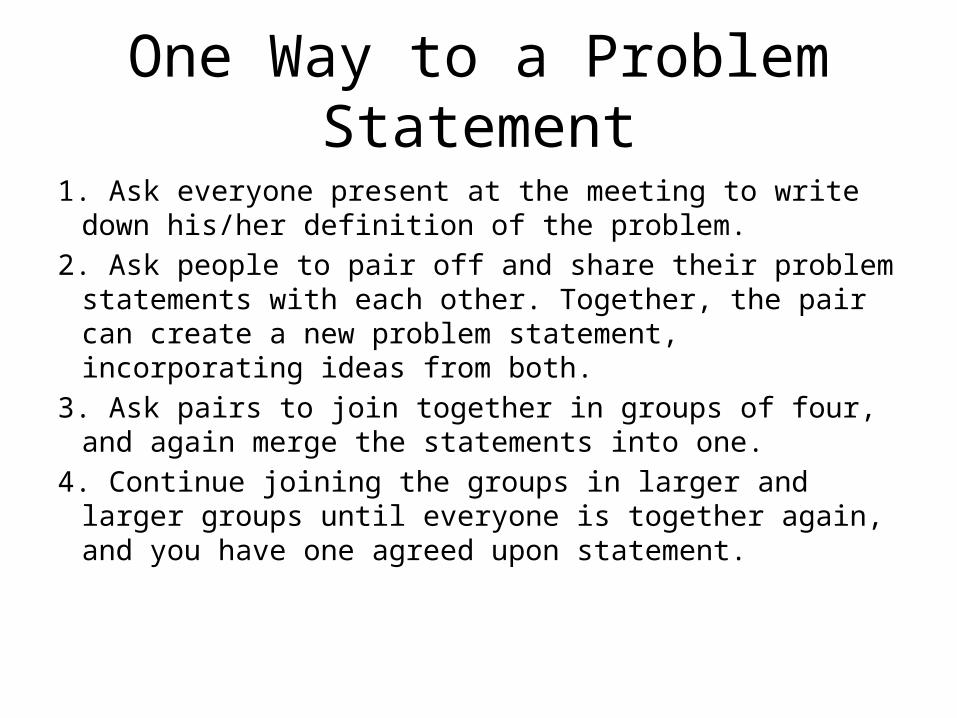
One Way to a Problem Statement
1. Ask everyone present at the meeting to write down his/her definition of the problem.
2. Ask people to pair off and share their problem statements with each other. Together, the pair can create a new problem statement, incorporating ideas from both.
3. Ask pairs to join together in groups of four, and again merge the statements into one.
4. Continue joining the groups in larger and larger groups until everyone is together again, and you have one agreed upon statement.

Formulating Problem StatementsDon’t Do
No big balloons or big vague concepts, e.g. no infrastructure
Be precise, e.g. there is no paved road from Chittoor to Mahabubnagar
No absent solutions (danger: you block alternatives), e.g. we have a lack of money and thus children don’t go to school
Instead, the problem is: school fees are not affordable
No non- existing problems, e.g. noexistence of NGOs
The problem is that there is no knowledge on how to run an NGO
No formulation of interpretations, e.g. The government is lazy
The government does not issue licenses

Make a conscious choice that you really do want to attack the problem. Many different factors should be a part of your decision. Some of the more significant ones include: • Importance. In judging the importance of the
issue, keep in mind the following: The frequency with which the problem occurs The number of people affected The severity of the effect The perceived importance of the problem to you The perceived importance of the problem to others

• Feasibility. Will you be able to solve it, or at least significantly improve the situation? The bottom line: Decide if the good you can do will be worth the effort it takes. (Pareto)
• Are you the best people to solve the problem? Is someone else better suited to the task?
• Negative impacts. If you do succeed in bringing about the solution you are working on, what are the possible consequences?

Problem 1: Problem 2:
How frequently does the
problem occur?
How many people are affected?
For what amount of time are
they affected?
How severe is the effect?
How important do group
members perceive the problem
to be?
How important is the problem
perceived to be by others?
How likely is it that we can
solve/significantly improve the
problem?
Are there any negative
impacts?

Analyzing the Problem
What is the problem? Revisit the statement of the problem.
Why does the problem exist? (3 Approaches) 1. The "but why" technique. 2. Force Field Analysis 3. Cause and Effect (Problem Tree, Fishbone)
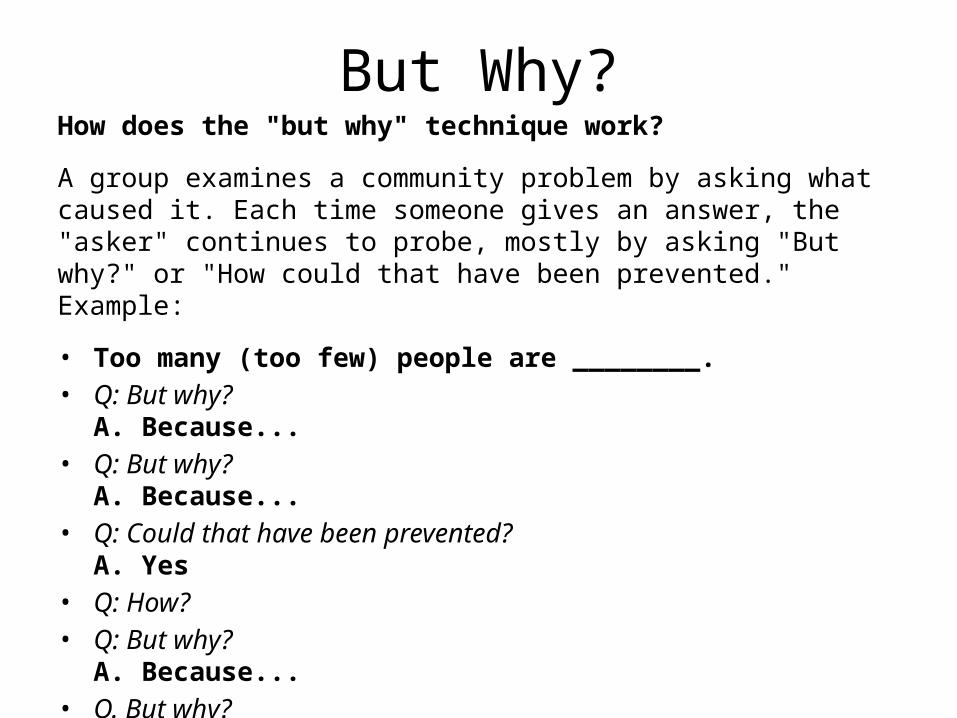
But Why?How does the "but why" technique work?
A group examines a community problem by asking what caused it. Each time someone gives an answer, the "asker" continues to probe, mostly by asking "But why?" or "How could that have been prevented." Example:
• Too many (too few) people are ________. • Q: But why?
A. Because... • Q: But why?
A. Because... • Q: Could that have been prevented?
A. Yes • Q: How? • Q: But why?
A. Because... • Q. But why?
(and so forth)

But Why?1. First, invite people who are both affected by
the problem and are in a position to contribute to the solution to brainstorm possible causes. The more representative the working group is, the more likely it is for the root causes to be uncovered.
2. The working group should then examine a problem by asking what caused it. Each time someone gives an answer, the group asks, "But why?"

But Why?Here's an example: • A child has an infected foot. • Q: But why?
A. She stepped on broken glass while walking. • Q: Could that have been prevented?
A. Yes. • Q: How?
A. She could have been wearing shoes. • Q: But why doesn't the child have shoes?
A. Because the family can't afford shoes. • Q. But why?
A. The father or mother has no job. • Q. But why?
(and so forth)

But Why?
Another example, your problem might be:
"Children often fall asleep in class," • But why? "Because they have no energy." • But why? "Because they don't eat breakfast." • But why? (And so on.)

Force Field AnalysisWith force field analysis, you will be looking more broadly at the issue and the forces surrounding the issue. • Start with the problem definition/statement• Draw a line down the center of the paper or use two pieces. • On the top of one sheet/side, write "Restraining Forces." • On the other sheet/side, write, "Driving Forces." • Under "Restraining Forces," list all of the reasons (brainstorm)
you can think of that keep the situation the same; why the status quo is the way it is.
• In the same manner, under "Driving Forces," list all of the forces that are pushing the situation to change.
• When all of the ideas have been written down, group members can edit them as they see fit and compile a list of the important factors that are causing the situation.

Problem Tree Analysis


Fishbone AnalysisThe fishbone diagram identifies many possible causes for an effect or problem. It can be used to structure a brainstorming session. It immediately sorts ideas into useful categories.When to Use a Fishbone Diagram• When identifying possible causes for a problem.• Especially when a team’s thinking tends to fall into ruts.Fishbone Diagram Procedure• Materials needed: flipchart or whiteboard, marking pens.• Agree on a problem statement (effect). Write it at the
center right of the flipchart or whiteboard. Draw a box around it and draw a horizontal arrow running to it.

Fishbone Analysis• Brainstorm the major categories of causes of the problem. If this is difficult use
generic headings: – Methods– Machines (equipment)– People (manpower)– Materials– Measurement– Environment
• Write the categories of causes as branches from the main arrow.• Brainstorm all the possible causes of the problem. Ask: “Why does this happen?”
As each idea is given, the facilitator writes it as a branch from the appropriate category. Causes can be written in several places if they relate to several categories.
• Again ask “why does this happen?” about each cause. Write sub–causes branching off the causes. Continue to ask “Why?” and generate deeper levels of causes. Layers of branches indicate causal relationships.
• When the group runs out of ideas, focus attention to places on the chart where ideas are few.


Data and Problem Analysis
Keeping it Useful and Simple