Embed Size (px)
Citation preview
Visualization
J. D. Madura
Schedule ofLectures
Lecture Objectives
Introduction
Data VisualizationIntroduction
Scientific Plots
Introduction to R
Water Dimer Example
MolecularVisualizationVMD
Input
Graphics
Extensions
Saving and CapturingGraphics
Movie Making
MOE
Input
Graphics
Selection
Compute
LearningOutcomes
Data and Molecular VisualizationVisualization
J. D. Madura
Department of Chemistry and BiochemistryCenter for Computational Chemistry
Duquesne University
June 11, 2015
Visualization
J. D. Madura
Schedule ofLectures
Lecture Objectives
Introduction
Data VisualizationIntroduction
Scientific Plots
Introduction to R
Water Dimer Example
MolecularVisualizationVMD
Input
Graphics
Extensions
Saving and CapturingGraphics
Movie Making
MOE
Input
Graphics
Selection
Compute
LearningOutcomes
Schedule of Lectures
Lecture 1• Visualization (VMD,
PyMol, MOE)• Introduction to R• Plotting using R• Examples
Lecture 2• IMF• Force-fields• Molecular Dynamics
(MD)• Simulation of a protein
(in vacuo and in solution)
Lecture 3• Enhanced Sampling
(aMD, ABF,metadynamics)
• Simulation of a simplesystem usingmetadynamics
• Examples
Lecture 4• Free Energy Perturbation
Method (FEP)• Simulation of
protein-ligand system• Examples

Visualization
J. D. Madura
Schedule ofLectures
Lecture Objectives
Introduction
Data VisualizationIntroduction
Scientific Plots
Introduction to R
Water Dimer Example
MolecularVisualizationVMD
Input
Graphics
Extensions
Saving and CapturingGraphics
Movie Making
MOE
Input
Graphics
Selection
Compute
LearningOutcomes
Lecture Objectives
• Learn how to create scientific plots using R
• Learn how to visualize (bio)molecular using VMD,MOE, PyMol, etc.

Visualization
J. D. Madura
Schedule ofLectures
Lecture Objectives
Introduction
Data VisualizationIntroduction
Scientific Plots
Introduction to R
Water Dimer Example
MolecularVisualizationVMD
Input
Graphics
Extensions
Saving and CapturingGraphics
Movie Making
MOE
Input
Graphics
Selection
Compute
LearningOutcomes
Introduction
Overview
• Why is visualization important?• Data versus Molecular visualization.
Data
●
●
●
●
●
●
●●
●
●
2 4 6 8 10
24
68
10
Simple Plot
Time/day
Und
erst
andi
ng
Molecular
Visualization
J. D. Madura
Schedule ofLectures
Lecture Objectives
Introduction
Data VisualizationIntroduction
Scientific Plots
Introduction to R
Water Dimer Example
MolecularVisualizationVMD
Input
Graphics
Extensions
Saving and CapturingGraphics
Movie Making
MOE
Input
Graphics
Selection
Compute
LearningOutcomes
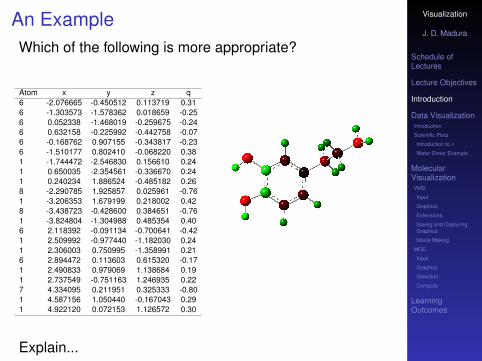
An ExampleWhich of the following is more appropriate?
Atom x y z q6 -2.076665 -0.450512 0.113719 0.316 -1.303573 -1.578362 0.018659 -0.256 0.052338 -1.468019 -0.259675 -0.246 0.632158 -0.225992 -0.442758 -0.076 -0.168762 0.907155 -0.343817 -0.236 -1.510177 0.802410 -0.068220 0.381 -1.744472 -2.546830 0.156610 0.241 0.650035 -2.354561 -0.336670 0.241 0.240234 1.886524 -0.485182 0.268 -2.290785 1.925857 0.025961 -0.761 -3.206353 1.679199 0.218002 0.428 -3.438723 -0.428600 0.384651 -0.761 -3.824804 -1.304988 0.485354 0.406 2.118392 -0.091134 -0.700641 -0.421 2.509992 -0.977440 -1.182030 0.241 2.306003 0.750995 -1.358991 0.216 2.894472 0.113603 0.615320 -0.171 2.490833 0.979069 1.138684 0.191 2.737549 -0.751163 1.246935 0.227 4.334095 0.211951 0.325333 -0.801 4.587156 1.050440 -0.167043 0.291 4.922120 0.072153 1.126572 0.30
Explain...
Visualization
J. D. Madura
Schedule ofLectures
Lecture Objectives
Introduction
Data VisualizationIntroduction
Scientific Plots
Introduction to R
Water Dimer Example
MolecularVisualizationVMD
Input
Graphics
Extensions
Saving and CapturingGraphics
Movie Making
MOE
Input
Graphics
Selection
Compute
LearningOutcomes
Visualizing Data
“Assessments of change, dynamics, and cause and effectare at the heart of thinking and explanation. Tounderstand is to know what cause provokes what effect,by what means, at what rate. How then is suchknowledge to be represented?”1
The goal is to design “...proper arrangement in space andtime images, words, numbers – for presenting informationabout motion, process, mechanism, cause, and effect.”1
Therefore visualization, in our case molecularvisualization, is extremely important since it is anextremely effective method to convey information.
1Tufte, Edward R. “Visual Explanations” , 1997, Graphics Press.
Visualization
J. D. Madura
Schedule ofLectures
Lecture Objectives
Introduction
Data VisualizationIntroduction
Scientific Plots
Introduction to R
Water Dimer Example
MolecularVisualizationVMD
Input
Graphics
Extensions
Saving and CapturingGraphics
Movie Making
MOE
Input
Graphics
Selection
Compute
LearningOutcomes
Visualizing Data“Excellence in statistical graphics consists of complexideas communicated with clarity, precision, andefficiency.” A quote from Edward R. Tufte
Therefore graphical data should• show that data• induce the viewer to think about the substance rather
than about the methodology• avoid distorting what the data have to say• make large datasets coherent• encourage the eye to compare different pieces of
data• reveal that data at several levels of detail, from a
broad overview to the fine structure• serve a reasonably clear purpose: description,
exploration, tabulation, or decoration• be closely integrated with the statistical and verbal
description of a data set.
Visualization
J. D. Madura
Schedule ofLectures
Lecture Objectives
Introduction
Data VisualizationIntroduction
Scientific Plots
Introduction to R
Water Dimer Example
MolecularVisualizationVMD
Input
Graphics
Extensions
Saving and CapturingGraphics
Movie Making
MOE
Input
Graphics
Selection
Compute
LearningOutcomes
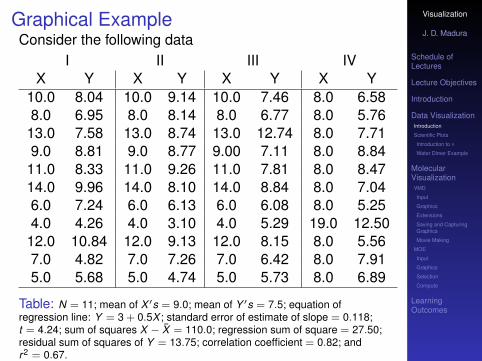
Graphical ExampleConsider the following data
I II III IVX Y X Y X Y X Y
10.0 8.04 10.0 9.14 10.0 7.46 8.0 6.588.0 6.95 8.0 8.14 8.0 6.77 8.0 5.7613.0 7.58 13.0 8.74 13.0 12.74 8.0 7.719.0 8.81 9.0 8.77 9.00 7.11 8.0 8.8411.0 8.33 11.0 9.26 11.0 7.81 8.0 8.4714.0 9.96 14.0 8.10 14.0 8.84 8.0 7.046.0 7.24 6.0 6.13 6.0 6.08 8.0 5.254.0 4.26 4.0 3.10 4.0 5.29 19.0 12.5012.0 10.84 12.0 9.13 12.0 8.15 8.0 5.567.0 4.82 7.0 7.26 7.0 6.42 8.0 7.915.0 5.68 5.0 4.74 5.0 5.73 8.0 6.89
Table: N = 11; mean of X ′s = 9.0; mean of Y ′s = 7.5; equation ofregression line: Y = 3 + 0.5X ; standard error of estimate of slope = 0.118;t = 4.24; sum of squares X − X̄ = 110.0; regression sum of square = 27.50;residual sum of squares of Y = 13.75; correlation coefficient = 0.82; andr2 = 0.67.
Visualization
J. D. Madura
Schedule ofLectures
Lecture Objectives
Introduction
Data VisualizationIntroduction
Scientific Plots
Introduction to R
Water Dimer Example
MolecularVisualizationVMD
Input
Graphics
Extensions
Saving and CapturingGraphics
Movie Making
MOE
Input
Graphics
Selection
Compute
LearningOutcomes
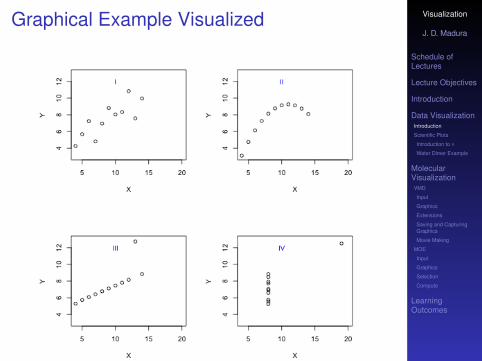
Graphical Example Visualized
Visualization
J. D. Madura
Schedule ofLectures
Lecture Objectives
Introduction
Data VisualizationIntroduction
Scientific Plots
Introduction to R
Water Dimer Example
MolecularVisualizationVMD
Input
Graphics
Extensions
Saving and CapturingGraphics
Movie Making
MOE
Input
Graphics
Selection
Compute
LearningOutcomes
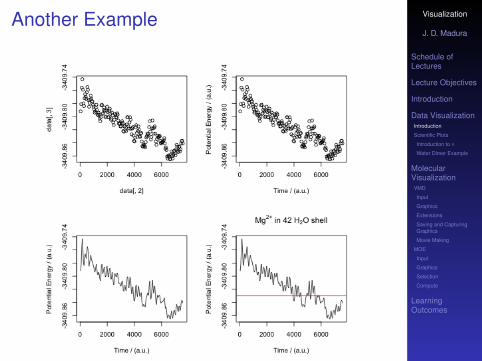
Another Example
Visualization
J. D. Madura
Schedule ofLectures
Lecture Objectives
Introduction
Data VisualizationIntroduction
Scientific Plots
Introduction to R
Water Dimer Example
MolecularVisualizationVMD
Input
Graphics
Extensions
Saving and CapturingGraphics
Movie Making
MOE
Input
Graphics
Selection
Compute
LearningOutcomes
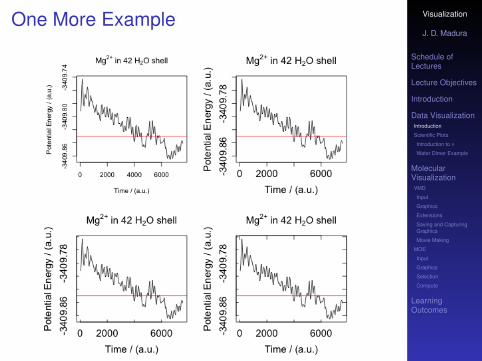
One More Example
Visualization
J. D. Madura
Schedule ofLectures
Lecture Objectives
Introduction
Data VisualizationIntroduction
Scientific Plots
Introduction to R
Water Dimer Example
MolecularVisualizationVMD
Input
Graphics
Extensions
Saving and CapturingGraphics
Movie Making
MOE
Input
Graphics
Selection
Compute
LearningOutcomes
Proper Figure Guidelines
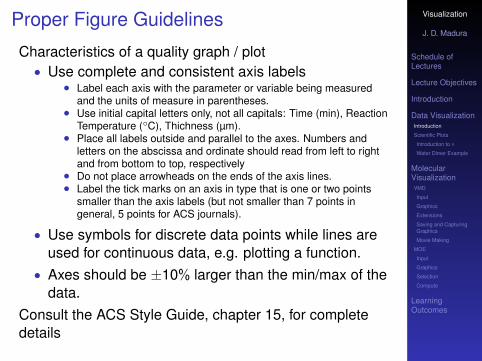
Characteristics of a quality graph / plot• Use complete and consistent axis labels
• Label each axis with the parameter or variable being measuredand the units of measure in parentheses.
• Use initial capital letters only, not all capitals: Time (min), ReactionTemperature (◦C), Thichness (µm).
• Place all labels outside and parallel to the axes. Numbers andletters on the abscissa and ordinate should read from left to rightand from bottom to top, respectively
• Do not place arrowheads on the ends of the axis lines.• Label the tick marks on an axis in type that is one or two points
smaller than the axis labels (but not smaller than 7 points ingeneral, 5 points for ACS journals).
• Use symbols for discrete data points while lines areused for continuous data, e.g. plotting a function.
• Axes should be ±10% larger than the min/max of thedata.
Consult the ACS Style Guide, chapter 15, for completedetails
Visualization
J. D. Madura
Schedule ofLectures
Lecture Objectives
Introduction
Data VisualizationIntroduction
Scientific Plots
Introduction to R
Water Dimer Example
MolecularVisualizationVMD
Input
Graphics
Extensions
Saving and CapturingGraphics
Movie Making
MOE
Input
Graphics
Selection
Compute
LearningOutcomes
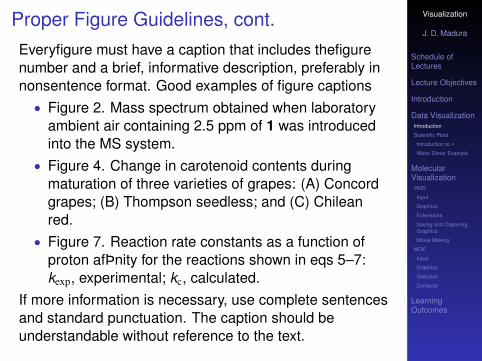
Proper Figure Guidelines, cont.Everyfigure must have a caption that includes thefigurenumber and a brief, informative description, preferably innonsentence format. Good examples of figure captions• Figure 2. Mass spectrum obtained when laboratory
ambient air containing 2.5 ppm of 1 was introducedinto the MS system.
• Figure 4. Change in carotenoid contents duringmaturation of three varieties of grapes: (A) Concordgrapes; (B) Thompson seedless; and (C) Chileanred.
• Figure 7. Reaction rate constants as a function ofproton afÞnity for the reactions shown in eqs 5–7:kexp, experimental; kc, calculated.
If more information is necessary, use complete sentencesand standard punctuation. The caption should beunderstandable without reference to the text.
Visualization
J. D. Madura
Schedule ofLectures
Lecture Objectives
Introduction
Data VisualizationIntroduction
Scientific Plots
Introduction to R
Water Dimer Example
MolecularVisualizationVMD
Input
Graphics
Extensions
Saving and CapturingGraphics
Movie Making
MOE
Input
Graphics
Selection
Compute
LearningOutcomes
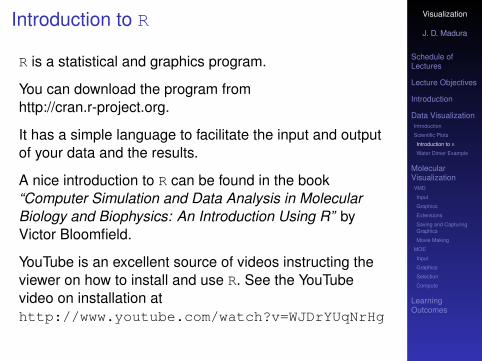
Introduction to R
R is a statistical and graphics program.
You can download the program fromhttp://cran.r-project.org.
It has a simple language to facilitate the input and outputof your data and the results.
A nice introduction to R can be found in the book“Computer Simulation and Data Analysis in MolecularBiology and Biophysics: An Introduction Using R” byVictor Bloomfield.
YouTube is an excellent source of videos instructing theviewer on how to install and use R. See the YouTubevideo on installation athttp://www.youtube.com/watch?v=WJDrYUqNrHg
Visualization
J. D. Madura
Schedule ofLectures
Lecture Objectives
Introduction
Data VisualizationIntroduction
Scientific Plots
Introduction to R
Water Dimer Example
MolecularVisualizationVMD
Input
Graphics
Extensions
Saving and CapturingGraphics
Movie Making
MOE
Input
Graphics
Selection
Compute
LearningOutcomes
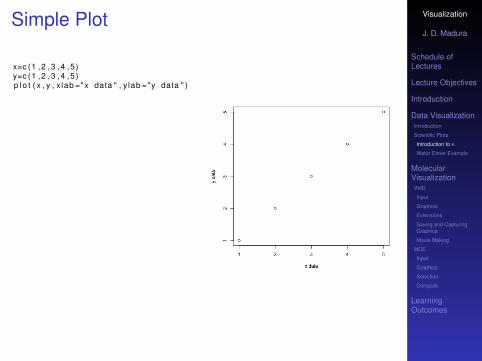
Simple Plot
x=c (1 ,2 ,3 ,4 ,5 )y=c (1 ,2 ,3 ,4 ,5 )p l o t ( x , y , x lab ="x data " , y lab ="y data " )
Visualization
J. D. Madura
Schedule ofLectures
Lecture Objectives
Introduction
Data VisualizationIntroduction
Scientific Plots
Introduction to R
Water Dimer Example
MolecularVisualizationVMD
Input
Graphics
Extensions
Saving and CapturingGraphics
Movie Making
MOE
Input
Graphics
Selection
Compute
LearningOutcomes
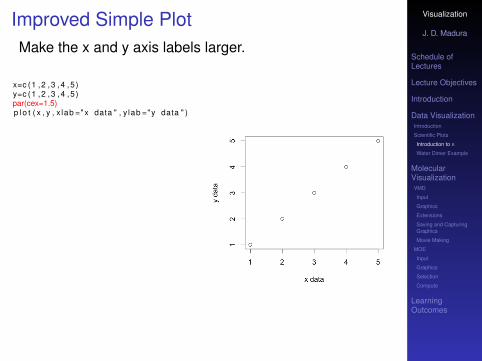
Improved Simple PlotMake the x and y axis labels larger.
x=c (1 ,2 ,3 ,4 ,5 )y=c (1 ,2 ,3 ,4 ,5 )par(cex=1.5)p l o t ( x , y , x lab ="x data " , y lab ="y data " )
Visualization
J. D. Madura
Schedule ofLectures
Lecture Objectives
Introduction
Data VisualizationIntroduction
Scientific Plots
Introduction to R
Water Dimer Example
MolecularVisualizationVMD
Input
Graphics
Extensions
Saving and CapturingGraphics
Movie Making
MOE
Input
Graphics
Selection
Compute
LearningOutcomes
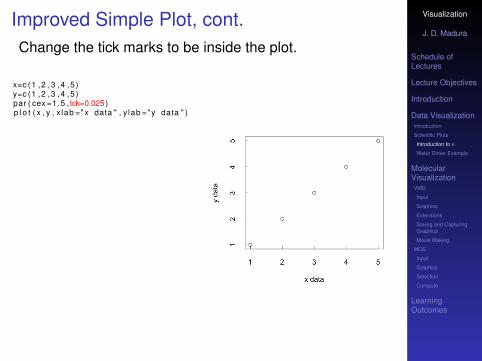
Improved Simple Plot, cont.Change the tick marks to be inside the plot.
x=c (1 ,2 ,3 ,4 ,5 )y=c (1 ,2 ,3 ,4 ,5 )par ( cex =1.5 , tck=0.025 )p l o t ( x , y , x lab ="x data " , y lab ="y data " )
Visualization
J. D. Madura
Schedule ofLectures
Lecture Objectives
Introduction
Data VisualizationIntroduction
Scientific Plots
Introduction to R
Water Dimer Example
MolecularVisualizationVMD
Input
Graphics
Extensions
Saving and CapturingGraphics
Movie Making
MOE
Input
Graphics
Selection
Compute
LearningOutcomes
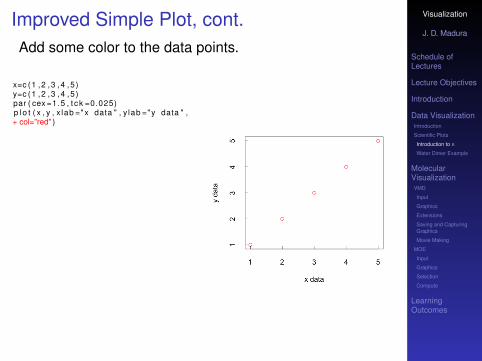
Improved Simple Plot, cont.Add some color to the data points.
x=c (1 ,2 ,3 ,4 ,5 )y=c (1 ,2 ,3 ,4 ,5 )par ( cex =1.5 , t ck =0.025)p l o t ( x , y , x lab ="x data " , y lab ="y data " ,+ col="red" )
Visualization
J. D. Madura
Schedule ofLectures
Lecture Objectives
Introduction
Data VisualizationIntroduction
Scientific Plots
Introduction to R
Water Dimer Example
MolecularVisualizationVMD
Input
Graphics
Extensions
Saving and CapturingGraphics
Movie Making
MOE
Input
Graphics
Selection
Compute
LearningOutcomes
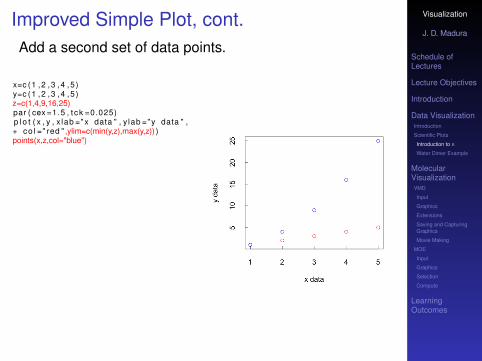
Improved Simple Plot, cont.Add a second set of data points.
x=c (1 ,2 ,3 ,4 ,5 )y=c (1 ,2 ,3 ,4 ,5 )z=c(1,4,9,16,25)par ( cex =1.5 , t ck =0.025)p l o t ( x , y , x lab ="x data " , y lab ="y data " ,+ co l =" red " ,ylim=c(min(y,z),max(y,z)) )points(x,z,col="blue")
Visualization
J. D. Madura
Schedule ofLectures
Lecture Objectives
Introduction
Data VisualizationIntroduction
Scientific Plots
Introduction to R
Water Dimer Example
MolecularVisualizationVMD
Input
Graphics
Extensions
Saving and CapturingGraphics
Movie Making
MOE
Input
Graphics
Selection
Compute
LearningOutcomes
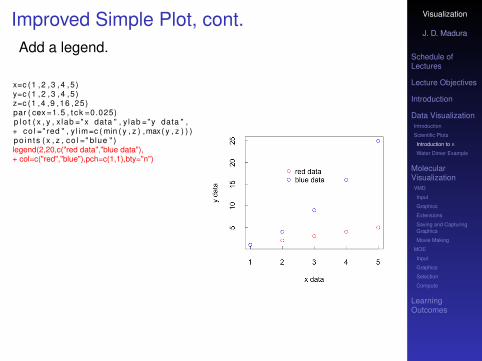
Improved Simple Plot, cont.Add a legend.
x=c (1 ,2 ,3 ,4 ,5 )y=c (1 ,2 ,3 ,4 ,5 )z=c (1 ,4 ,9 ,16 ,25)par ( cex =1.5 , t ck =0.025)p l o t ( x , y , x lab ="x data " , y lab ="y data " ,+ co l =" red " , y l im=c ( min ( y , z ) ,max( y , z ) ) )po in t s ( x , z , co l =" blue " )legend(2,20,c("red data","blue data"),+ col=c("red","blue"),pch=c(1,1),bty="n")
Visualization
J. D. Madura
Schedule ofLectures
Lecture Objectives
Introduction
Data VisualizationIntroduction
Scientific Plots
Introduction to R
Water Dimer Example
MolecularVisualizationVMD
Input
Graphics
Extensions
Saving and CapturingGraphics
Movie Making
MOE
Input
Graphics
Selection
Compute
LearningOutcomes
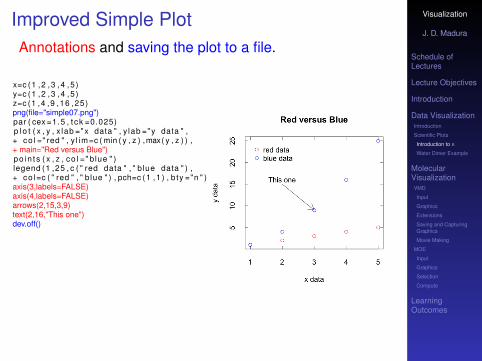
Improved Simple PlotAnnotations and saving the plot to a file.
x=c (1 ,2 ,3 ,4 ,5 )y=c (1 ,2 ,3 ,4 ,5 )z=c (1 ,4 ,9 ,16 ,25)png(file="simple07.png")par ( cex =1.5 , t ck =0.025)p l o t ( x , y , x lab ="x data " , y lab ="y data " ,+ co l =" red " , y l im=c ( min ( y , z ) ,max( y , z ) ) ,+ main="Red versus Blue")po in t s ( x , z , co l =" blue " )legend (1 ,25 , c ( " red data " , " b lue data " ) ,+ co l=c ( " red " , " b lue " ) , pch=c ( 1 , 1 ) , b ty ="n " )axis(3,labels=FALSE)axis(4,labels=FALSE)arrows(2,15,3,9)text(2,16,"This one")dev.off()
Visualization
J. D. Madura
Schedule ofLectures
Lecture Objectives
Introduction
Data VisualizationIntroduction
Scientific Plots
Introduction to R
Water Dimer Example
MolecularVisualizationVMD
Input
Graphics
Extensions
Saving and CapturingGraphics
Movie Making
MOE
Input
Graphics
Selection
Compute
LearningOutcomes
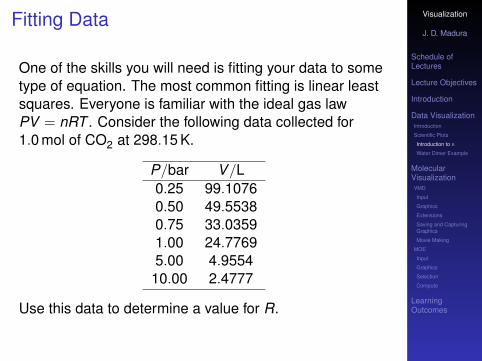
Fitting Data
One of the skills you will need is fitting your data to sometype of equation. The most common fitting is linear leastsquares. Everyone is familiar with the ideal gas lawPV = nRT . Consider the following data collected for1.0 mol of CO2 at 298.15 K.
P/bar V/L0.25 99.10760.50 49.55380.75 33.03591.00 24.77695.00 4.9554
10.00 2.4777
Use this data to determine a value for R.
Visualization
J. D. Madura
Schedule ofLectures
Lecture Objectives
Introduction
Data VisualizationIntroduction
Scientific Plots
Introduction to R
Water Dimer Example
MolecularVisualizationVMD
Input
Graphics
Extensions
Saving and CapturingGraphics
Movie Making
MOE
Input
Graphics
Selection
Compute
LearningOutcomes
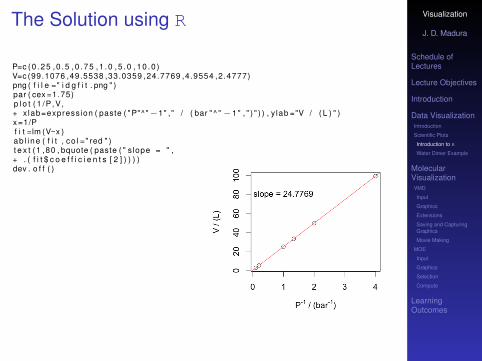
The Solution using R
P=c (0 . 25 ,0 .5 ,0 .75 ,1 . 0 , 5 .0 ,10 .0 )V=c (99.1076 ,49.5538 ,33.0359 ,24.7769 ,4.9554 ,2.4777)png ( f i l e =" i d g f i t . png " )par ( cex =1.75)p l o t ( 1 /P,V,+ x lab=expression ( paste ( "P"^"−1" ," / ( bar " ^ " −1 " , " ) " ) ) , y lab ="V / ( L ) " )x =1/Pf i t =lm (V~x )ab l i ne ( f i t , co l =" red " )t e x t (1 ,80 , bquote ( paste ( " s lope = " ,+ . ( f i t $ c o e f f i c i e n t s [ 2 ] ) ) ) )dev . o f f ( )
Visualization
J. D. Madura
Schedule ofLectures
Lecture Objectives
Introduction
Data VisualizationIntroduction
Scientific Plots
Introduction to R
Water Dimer Example
MolecularVisualizationVMD
Input
Graphics
Extensions
Saving and CapturingGraphics
Movie Making
MOE
Input
Graphics
Selection
Compute
LearningOutcomes
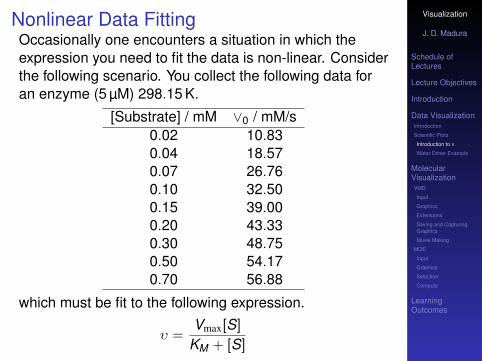
Nonlinear Data FittingOccasionally one encounters a situation in which theexpression you need to fit the data is non-linear. Considerthe following scenario. You collect the following data foran enzyme (5 µM) 298.15 K.
[Substrate] / mM ∨0 / mM/s0.02 10.830.04 18.570.07 26.760.10 32.500.15 39.000.20 43.330.30 48.750.50 54.170.70 56.88
which must be fit to the following expression.
υ =Vmax[S]
KM + [S]
Visualization
J. D. Madura
Schedule ofLectures
Lecture Objectives
Introduction
Data VisualizationIntroduction
Scientific Plots
Introduction to R
Water Dimer Example
MolecularVisualizationVMD
Input
Graphics
Extensions
Saving and CapturingGraphics
Movie Making
MOE
Input
Graphics
Selection
Compute
LearningOutcomes
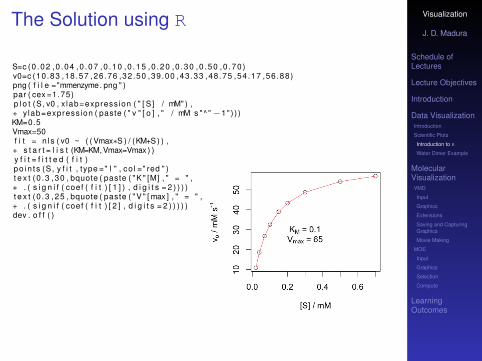
The Solution using R
S=c (0 .02 ,0 .04 ,0 .07 ,0 .10 ,0 .15 ,0 .20 ,0 .30 ,0 .50 ,0 .70 )v0=c (10.83 ,18.57 ,26.76 ,32.50 ,39.00 ,43.33 ,48.75 ,54.17 ,56.88)png ( f i l e ="mmenzyme. png " )par ( cex =1.75)p l o t (S, v0 , x lab=expression ( " [ S ] / mM" ) ,+ y lab=expression ( paste ( " v " [ o ] , " / mM s "^"−1" ) ) )KM=0.5Vmax=50f i t = n l s ( v0 ~ ( ( Vmax∗S ) / (KM+S) ) ,+ s t a r t = l i s t (KM=KM,Vmax=Vmax ) )y f i t = f i t t e d ( f i t )po in t s (S, y f i t , type =" l " , co l =" red " )t e x t (0 .3 ,30 , bquote ( paste ( "K " [M] , " = " ,+ . ( s i g n i f ( coef ( f i t ) [ 1 ] ) , d i g i t s = 2 ) ) ) )t e x t (0 .3 ,25 , bquote ( paste ( "V " [ max ] , " = " ,+ . ( s i g n i f ( coef ( f i t ) [ 2 ] , d i g i t s = 2 ) ) ) ) )dev . o f f ( )
Visualization
J. D. Madura
Schedule ofLectures
Lecture Objectives
Introduction
Data VisualizationIntroduction
Scientific Plots
Introduction to R
Water Dimer Example
MolecularVisualizationVMD
Input
Graphics
Extensions
Saving and CapturingGraphics
Movie Making
MOE
Input
Graphics
Selection
Compute
LearningOutcomes
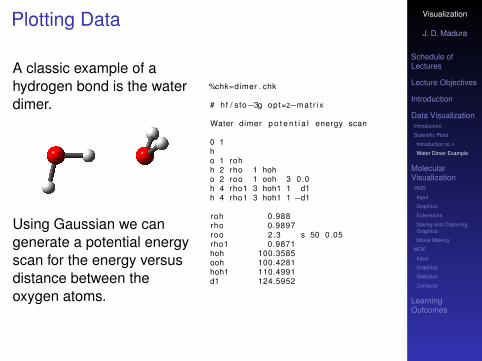
Plotting Data
A classic example of ahydrogen bond is the waterdimer.
Using Gaussian we cangenerate a potential energyscan for the energy versusdistance between theoxygen atoms.
%chk=dimer . chk
# hf / sto−3g opt=z−mat r i x
Water dimer p o t e n t i a l energy scan
0 1ho 1 rohh 2 rho 1 hoho 2 roo 1 ooh 3 0.0h 4 rho1 3 hoh1 1 d1h 4 rho1 3 hoh1 1 −d1
roh 0.988rho 0.9897roo 2.3 s 50 0.05rho1 0.9871hoh 100.3585ooh 100.4281hoh1 110.4991d1 124.5952

Visualization
J. D. Madura
Schedule ofLectures
Lecture Objectives
Introduction
Data VisualizationIntroduction
Scientific Plots
Introduction to R
Water Dimer Example
MolecularVisualizationVMD
Input
Graphics
Extensions
Saving and CapturingGraphics
Movie Making
MOE
Input
Graphics
Selection
Compute
LearningOutcomes
Water DimerAfter running the Gaussian calculation for the water dimerlook in the output file for
Summary o f Optimized P o t e n t i a l Surface Scan1 2 3 4 5
Eigenvalues −− −149.91807−149.92838−149.93180−149.93492−149.93730roh 0.98800 0.98710 0.98660 0.98671 0.98701rho 0.96936 0.97592 0.97671 0.97884 0.98162roo 2.30000 2.35000 2.40000 2.45000 2.50000rho1 0.98471 0.98552 0.98532 0.98549 0.98579hoh 102.28153 102.90172 102.38682 101.62750 101.23188ooh 123.21440 126.89952 115.20560 106.64471 103.93286hoh1 106.38848 105.50372 108.04529 110.58072 111.11540d1 126.66192 126.70510 125.41616 124.05844 123.83537
6 7 8 9 10Eigenvalues −− −149.93900−149.94014−149.94083−149.94117−149.94124
roh 0.98729 0.98755 0.98772 0.98792 0.98810
Using this data create a file, e.g. dimer.dat, with twocolumns. The first column is the number of the frame andthe second column is the Eigenvalue. For example1,−149.918072,−149.92838...
Visualization
J. D. Madura
Schedule ofLectures
Lecture Objectives
Introduction
Data VisualizationIntroduction
Scientific Plots
Introduction to R
Water Dimer Example
MolecularVisualizationVMD
Input
Graphics
Extensions
Saving and CapturingGraphics
Movie Making
MOE
Input
Graphics
Selection
Compute
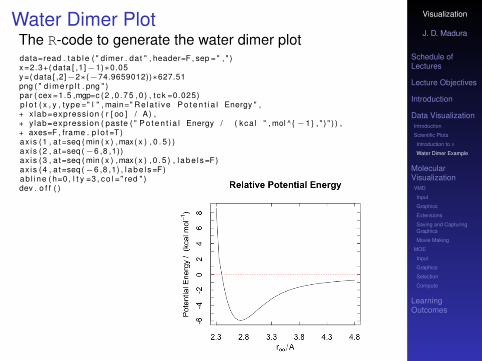
LearningOutcomes
Water Dimer PlotThe R-code to generate the water dimer plotdata=read . t ab l e ( " dimer . dat " , header=F , sep = " , " )x =2.3+( data [ ,1]−1)∗0.05y =( data [ ,2]−2∗(−74.9659012))∗627.51png ( " d ime rp l t . png " )par ( cex =1.5 ,mgp=c (2 ,0 .75 ,0 ) , t ck =0.025)p l o t ( x , y , type =" l " , main=" Re la t i ve P o t e n t i a l Energy " ,+ x lab=expression ( r [ oo ] / A) ,+ y lab=expression ( paste ( " P o t e n t i a l Energy / ( kca l " , mol ^ {−1 } , " ) " ) ) ,+ axes=F , frame . p l o t =T)ax is (1 , a t=seq ( min ( x ) ,max( x ) , 0 . 5 ) )ax is (2 , a t=seq (−6 ,8 ,1))ax is (3 , a t=seq ( min ( x ) ,max( x ) , 0 . 5 ) , l a b e l s =F)ax is (4 , a t=seq (−6 ,8 ,1) , l a b e l s =F)ab l i ne ( h=0 , l t y =3 , co l =" red " )dev . o f f ( )
Visualization
J. D. Madura
Schedule ofLectures
Lecture Objectives
Introduction
Data VisualizationIntroduction
Scientific Plots
Introduction to R
Water Dimer Example
MolecularVisualizationVMD
Input
Graphics
Extensions
Saving and CapturingGraphics
Movie Making
MOE
Input
Graphics
Selection
Compute
LearningOutcomes
VMD Overview
• Visual Molecular Dynamics• Open-source program• Performs visualization, analysis, and interfaces with
several external programs.• NAMD• APBS• MSMS
• Extended using Tcl/Tk
The program, VMD, can be freely downloaded from
http://http://www.ks.uiuc.edu/Research/vmd/
There are several VMD tutorials examples on thiswebpage.
Visualization
J. D. Madura
Schedule ofLectures
Lecture Objectives
Introduction
Data VisualizationIntroduction
Scientific Plots
Introduction to R
Water Dimer Example
MolecularVisualizationVMD
Input
Graphics
Extensions
Saving and CapturingGraphics
Movie Making
MOE
Input
Graphics
Selection
Compute
LearningOutcomes
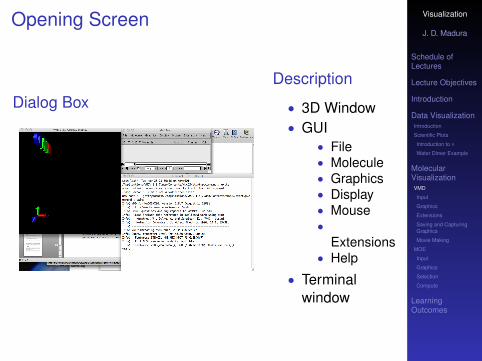
Opening Screen
Dialog BoxDescription
• 3D Window• GUI
• File• Molecule• Graphics• Display• Mouse•
Extensions• Help
• Terminalwindow
Visualization
J. D. Madura
Schedule ofLectures
Lecture Objectives
Introduction
Data VisualizationIntroduction
Scientific Plots
Introduction to R
Water Dimer Example
MolecularVisualizationVMD
Input
Graphics
Extensions
Saving and CapturingGraphics
Movie Making
MOE
Input
Graphics
Selection
Compute
LearningOutcomes
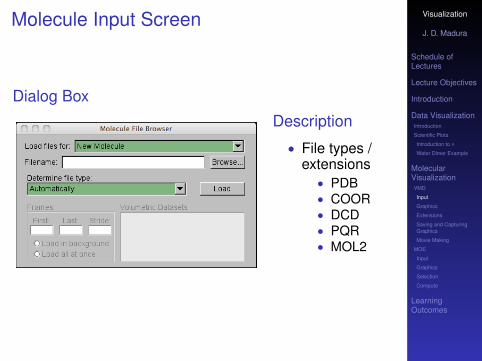
Molecule Input Screen
Dialog Box
Description
• File types /extensions
• PDB• COOR• DCD• PQR• MOL2
Visualization
J. D. Madura
Schedule ofLectures
Lecture Objectives
Introduction
Data VisualizationIntroduction
Scientific Plots
Introduction to R
Water Dimer Example
MolecularVisualizationVMD
Input
Graphics
Extensions
Saving and CapturingGraphics
Movie Making
MOE
Input
Graphics
Selection
Compute
LearningOutcomes
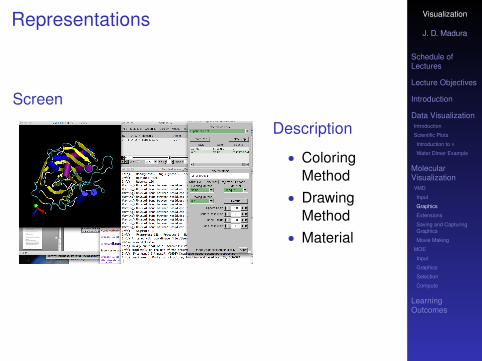
Representations
Screen
Description
• ColoringMethod
• DrawingMethod
• Material
Visualization
J. D. Madura
Schedule ofLectures
Lecture Objectives
Introduction
Data VisualizationIntroduction
Scientific Plots
Introduction to R
Water Dimer Example
MolecularVisualizationVMD
Input
Graphics
Extensions
Saving and CapturingGraphics
Movie Making
MOE
Input
Graphics
Selection
Compute
LearningOutcomes
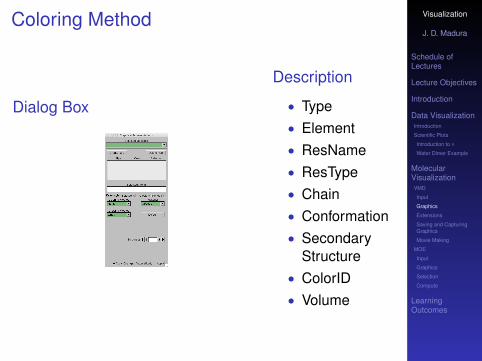
Coloring Method
Dialog Box
Description
• Type• Element• ResName• ResType• Chain• Conformation• Secondary
Structure• ColorID• Volume
Visualization
J. D. Madura
Schedule ofLectures
Lecture Objectives
Introduction
Data VisualizationIntroduction
Scientific Plots
Introduction to R
Water Dimer Example
MolecularVisualizationVMD
Input
Graphics
Extensions
Saving and CapturingGraphics
Movie Making
MOE
Input
Graphics
Selection
Compute
LearningOutcomes
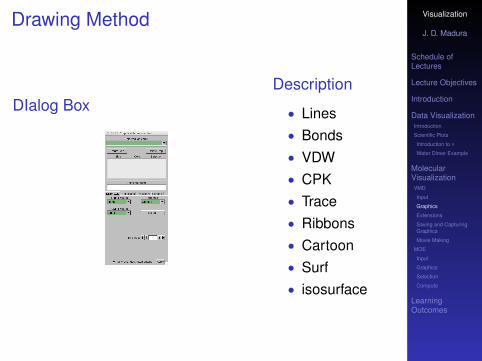
Drawing Method
DIalog BoxDescription
• Lines• Bonds• VDW• CPK• Trace• Ribbons• Cartoon• Surf• isosurface

Visualization
J. D. Madura
Schedule ofLectures
Lecture Objectives
Introduction
Data VisualizationIntroduction
Scientific Plots
Introduction to R
Water Dimer Example
MolecularVisualizationVMD
Input
Graphics
Extensions
Saving and CapturingGraphics
Movie Making
MOE
Input
Graphics
Selection
Compute
LearningOutcomes
Representations
Example 1 Example 2 Example 3
Visualization
J. D. Madura
Schedule ofLectures
Lecture Objectives
Introduction
Data VisualizationIntroduction
Scientific Plots
Introduction to R
Water Dimer Example
MolecularVisualizationVMD
Input
Graphics
Extensions
Saving and CapturingGraphics
Movie Making
MOE
Input
Graphics
Selection
Compute
LearningOutcomes
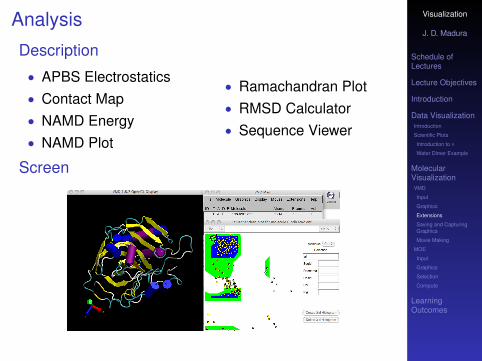
Analysis
Description
• APBS Electrostatics• Contact Map• NAMD Energy• NAMD Plot
• Ramachandran Plot• RMSD Calculator• Sequence Viewer
Screen
Visualization
J. D. Madura
Schedule ofLectures
Lecture Objectives
Introduction
Data VisualizationIntroduction
Scientific Plots
Introduction to R
Water Dimer Example
MolecularVisualizationVMD
Input
Graphics
Extensions
Saving and CapturingGraphics
Movie Making
MOE
Input
Graphics
Selection
Compute
LearningOutcomes
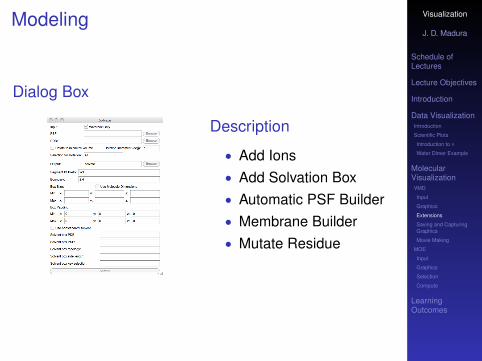
Modeling
Dialog Box
Description
• Add Ions• Add Solvation Box• Automatic PSF Builder• Membrane Builder• Mutate Residue
Visualization
J. D. Madura
Schedule ofLectures
Lecture Objectives
Introduction
Data VisualizationIntroduction
Scientific Plots
Introduction to R
Water Dimer Example
MolecularVisualizationVMD
Input
Graphics
Extensions
Saving and CapturingGraphics
Movie Making
MOE
Input
Graphics
Selection
Compute
LearningOutcomes
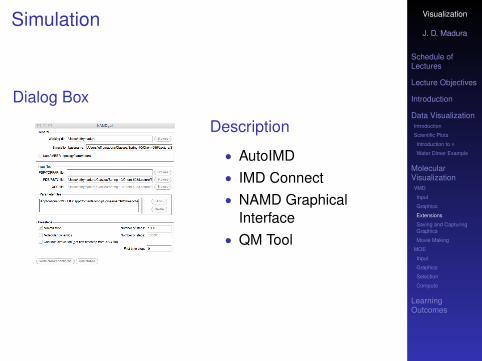
Simulation
Dialog Box
Description
• AutoIMD• IMD Connect• NAMD Graphical
Interface• QM Tool
Visualization
J. D. Madura
Schedule ofLectures
Lecture Objectives
Introduction
Data VisualizationIntroduction
Scientific Plots
Introduction to R
Water Dimer Example
MolecularVisualizationVMD
Input
Graphics
Extensions
Saving and CapturingGraphics
Movie Making
MOE
Input
Graphics
Selection
Compute
LearningOutcomes
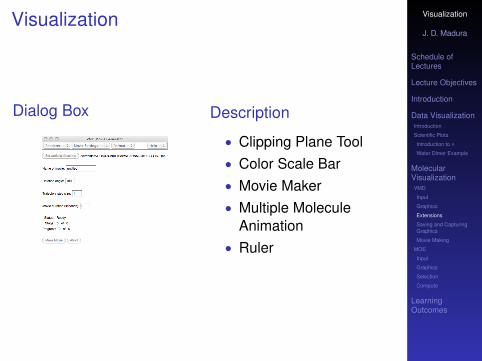
Visualization
Dialog Box Description
• Clipping Plane Tool• Color Scale Bar• Movie Maker• Multiple Molecule
Animation• Ruler
Visualization
J. D. Madura
Schedule ofLectures
Lecture Objectives
Introduction
Data VisualizationIntroduction
Scientific Plots
Introduction to R
Water Dimer Example
MolecularVisualizationVMD
Input
Graphics
Extensions
Saving and CapturingGraphics
Movie Making
MOE
Input
Graphics
Selection
Compute
LearningOutcomes
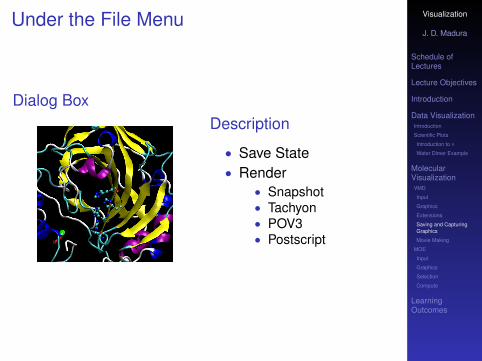
Under the File Menu
Dialog BoxDescription
• Save State• Render
• Snapshot• Tachyon• POV3• Postscript
Visualization
J. D. Madura
Schedule ofLectures
Lecture Objectives
Introduction
Data VisualizationIntroduction
Scientific Plots
Introduction to R
Water Dimer Example
MolecularVisualizationVMD
Input
Graphics
Extensions
Saving and CapturingGraphics
Movie Making
MOE
Input
Graphics
Selection
Compute
LearningOutcomes
Animation
Protein in Water
Visualization
J. D. Madura
Schedule ofLectures
Lecture Objectives
Introduction
Data VisualizationIntroduction
Scientific Plots
Introduction to R
Water Dimer Example
MolecularVisualizationVMD
Input
Graphics
Extensions
Saving and CapturingGraphics
Movie Making
MOE
Input
Graphics
Selection
Compute
LearningOutcomes
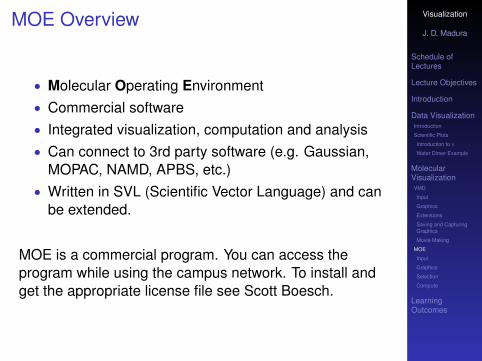
MOE Overview
• Molecular Operating Environment• Commercial software• Integrated visualization, computation and analysis• Can connect to 3rd party software (e.g. Gaussian,
MOPAC, NAMD, APBS, etc.)• Written in SVL (Scientific Vector Language) and can
be extended.
MOE is a commercial program. You can access theprogram while using the campus network. To install andget the appropriate license file see Scott Boesch.
Visualization
J. D. Madura
Schedule ofLectures
Lecture Objectives
Introduction
Data VisualizationIntroduction
Scientific Plots
Introduction to R
Water Dimer Example
MolecularVisualizationVMD
Input
Graphics
Extensions
Saving and CapturingGraphics
Movie Making
MOE
Input
Graphics
Selection
Compute
LearningOutcomes
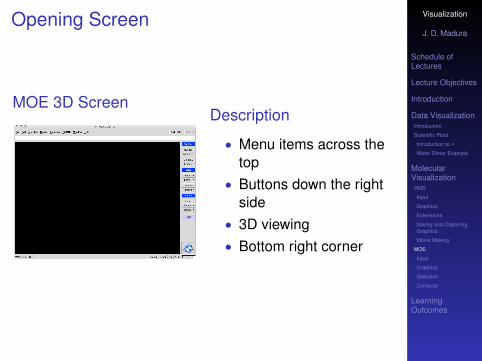
Opening Screen
MOE 3D ScreenDescription
• Menu items across thetop
• Buttons down the rightside
• 3D viewing• Bottom right corner
Visualization
J. D. Madura
Schedule ofLectures
Lecture Objectives
Introduction
Data VisualizationIntroduction
Scientific Plots
Introduction to R
Water Dimer Example
MolecularVisualizationVMD
Input
Graphics
Extensions
Saving and CapturingGraphics
Movie Making
MOE
Input
Graphics
Selection
Compute
LearningOutcomes
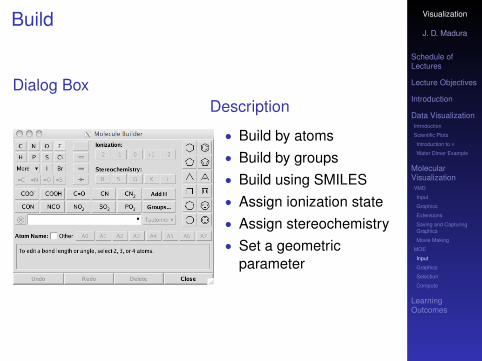
Build
Dialog BoxDescription
• Build by atoms• Build by groups• Build using SMILES• Assign ionization state• Assign stereochemistry• Set a geometric
parameter
Visualization
J. D. Madura
Schedule ofLectures
Lecture Objectives
Introduction
Data VisualizationIntroduction
Scientific Plots
Introduction to R
Water Dimer Example
MolecularVisualizationVMD
Input
Graphics
Extensions
Saving and CapturingGraphics
Movie Making
MOE
Input
Graphics
Selection
Compute
LearningOutcomes
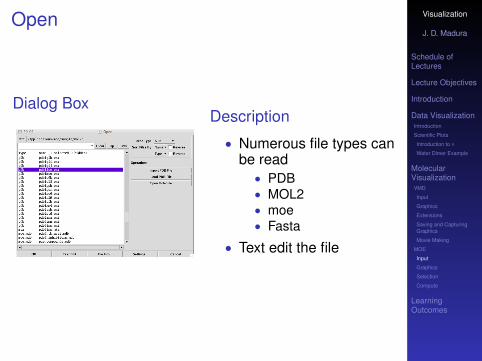
Open
Dialog BoxDescription
• Numerous file types canbe read
• PDB• MOL2• moe• Fasta
• Text edit the file

Visualization
J. D. Madura
Schedule ofLectures
Lecture Objectives
Introduction
Data VisualizationIntroduction
Scientific Plots
Introduction to R
Water Dimer Example
MolecularVisualizationVMD
Input
Graphics
Extensions
Saving and CapturingGraphics
Movie Making
MOE
Input
Graphics
Selection
Compute
LearningOutcomes
Render
ScreenDescription
• View• Hide• Show• Atoms• Ribbons• Draw

Visualization
J. D. Madura
Schedule ofLectures
Lecture Objectives
Introduction
Data VisualizationIntroduction
Scientific Plots
Introduction to R
Water Dimer Example
MolecularVisualizationVMD
Input
Graphics
Extensions
Saving and CapturingGraphics
Movie Making
MOE
Input
Graphics
Selection
Compute
LearningOutcomes
Commands
• Invert - inverts the current selection• Extend - extends the current selection based on
selected criteria• Ligand - selects the ligand• Pocket - selects the pocket• Receptor - selects the receptor• Solvent - selects the solvent• Potential - selects to force-field to be used• Atom Selector - selects atoms based on certain
criteria
Visualization
J. D. Madura
Schedule ofLectures
Lecture Objectives
Introduction
Data VisualizationIntroduction
Scientific Plots
Introduction to R
Water Dimer Example
MolecularVisualizationVMD
Input
Graphics
Extensions
Saving and CapturingGraphics
Movie Making
MOE
Input
Graphics
Selection
Compute
LearningOutcomes
Atom Selection
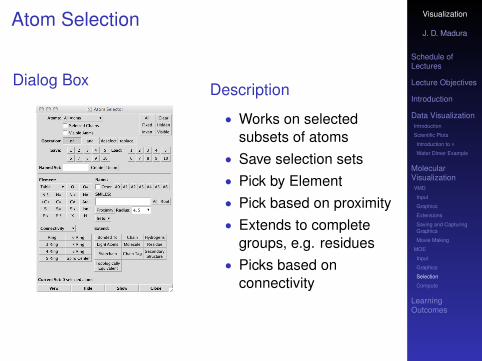
Dialog Box Description
• Works on selectedsubsets of atoms
• Save selection sets• Pick by Element• Pick based on proximity• Extends to complete
groups, e.g. residues• Picks based on
connectivity
Visualization
J. D. Madura
Schedule ofLectures
Lecture Objectives
Introduction
Data VisualizationIntroduction
Scientific Plots
Introduction to R
Water Dimer Example
MolecularVisualizationVMD
Input
Graphics
Extensions
Saving and CapturingGraphics
Movie Making
MOE
Input
Graphics
Selection
Compute
LearningOutcomes
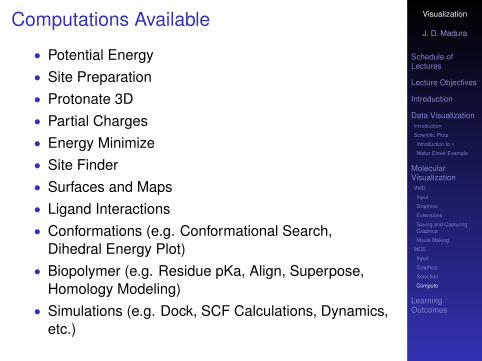
Computations Available
• Potential Energy• Site Preparation• Protonate 3D• Partial Charges• Energy Minimize• Site Finder• Surfaces and Maps• Ligand Interactions• Conformations (e.g. Conformational Search,
Dihedral Energy Plot)• Biopolymer (e.g. Residue pKa, Align, Superpose,
Homology Modeling)• Simulations (e.g. Dock, SCF Calculations, Dynamics,
etc.)
Visualization
J. D. Madura
Schedule ofLectures
Lecture Objectives
Introduction
Data VisualizationIntroduction
Scientific Plots
Introduction to R
Water Dimer Example
MolecularVisualizationVMD
Input
Graphics
Extensions
Saving and CapturingGraphics
Movie Making
MOE
Input
Graphics
Selection
Compute
LearningOutcomes
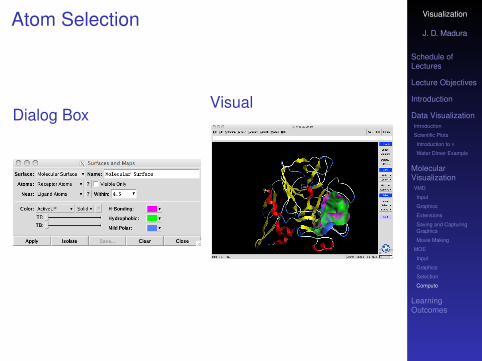
Atom Selection
Dialog BoxVisual
Visualization
J. D. Madura
Schedule ofLectures
Lecture Objectives
Introduction
Data VisualizationIntroduction
Scientific Plots
Introduction to R
Water Dimer Example
MolecularVisualizationVMD
Input
Graphics
Extensions
Saving and CapturingGraphics
Movie Making
MOE
Input
Graphics
Selection
Compute
LearningOutcomes
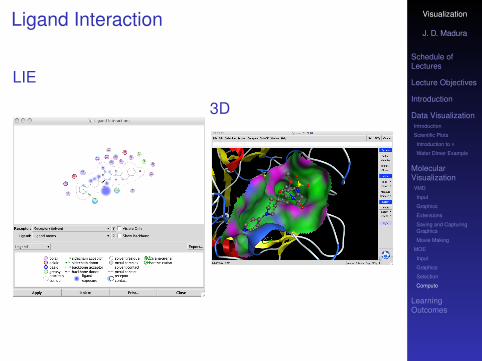
Ligand Interaction
LIE
3D
Visualization
J. D. Madura
Schedule ofLectures
Lecture Objectives
Introduction
Data VisualizationIntroduction
Scientific Plots
Introduction to R
Water Dimer Example
MolecularVisualizationVMD
Input
Graphics
Extensions
Saving and CapturingGraphics
Movie Making
MOE
Input
Graphics
Selection
Compute
LearningOutcomes
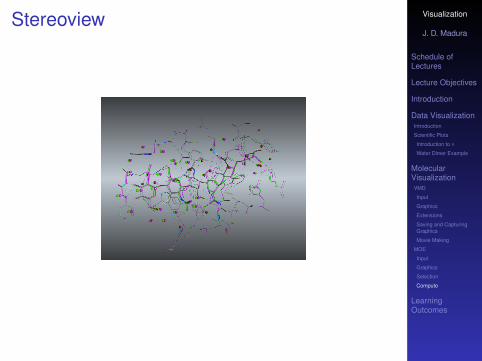
Stereoview
Visualization
J. D. Madura
Schedule ofLectures
Lecture Objectives
Introduction
Data VisualizationIntroduction
Scientific Plots
Introduction to R
Water Dimer Example
MolecularVisualizationVMD
Input
Graphics
Extensions
Saving and CapturingGraphics
Movie Making
MOE
Input
Graphics
Selection
Compute
LearningOutcomes
Movie

Visualization
J. D. Madura
Schedule ofLectures
Lecture Objectives
Introduction
Data VisualizationIntroduction
Scientific Plots
Introduction to R
Water Dimer Example
MolecularVisualizationVMD
Input
Graphics
Extensions
Saving and CapturingGraphics
Movie Making
MOE
Input
Graphics
Selection
Compute
LearningOutcomes
Outcomes
You should be able to• create a simple plot of (x,y) pairs of data and
properly label the plot using R.• describe the basic features of VMD and know how to
use them.• describe the basic features of MOE