Embed Size (px)
Citation preview

Data Analytics with a Real Time Monitoring System
- WAM System & SCADA System
Walter Sattinger C2.18
Web – 10th November 2020

1. Why SCADA / EMS Systems will have to be expanded?
2. Challenges and Application Examples
3. Realisation Approaches
4. Barriers and Possible Solutions
5. WAM System Integration Approaches
6. Conclusions & Expected Future Developments
7. References
Table of contents
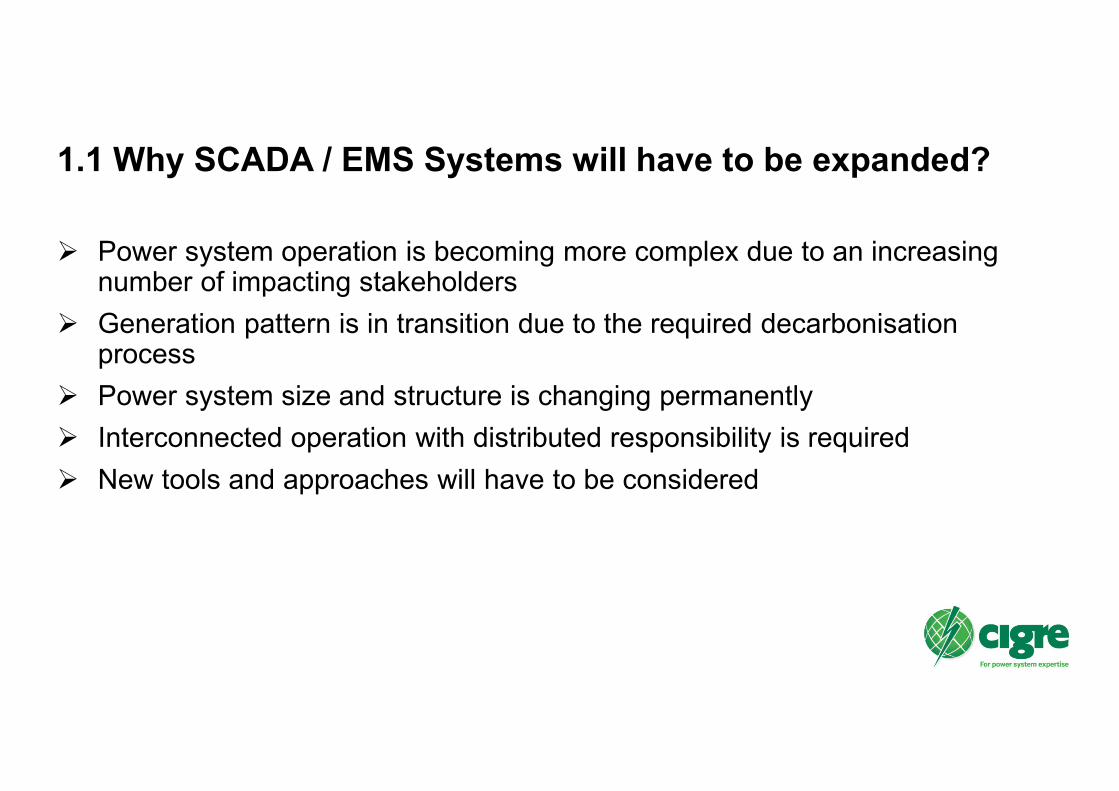
1.1 Why SCADA / EMS Systems will have to be expanded?
Power system operation is becoming more complex due to an increasing number of impacting stakeholders
Generation pattern is in transition due to the required decarbonisation process
Power system size and structure is changing permanently
Interconnected operation with distributed responsibility is required
New tools and approaches will have to be considered

1.2 Current and Future Challenges – New Energy Sources
4
demand-side
management
increase of
efficiency
nuclear power
exit
subvention of
renewable
generation
market
opening
decarbonisation
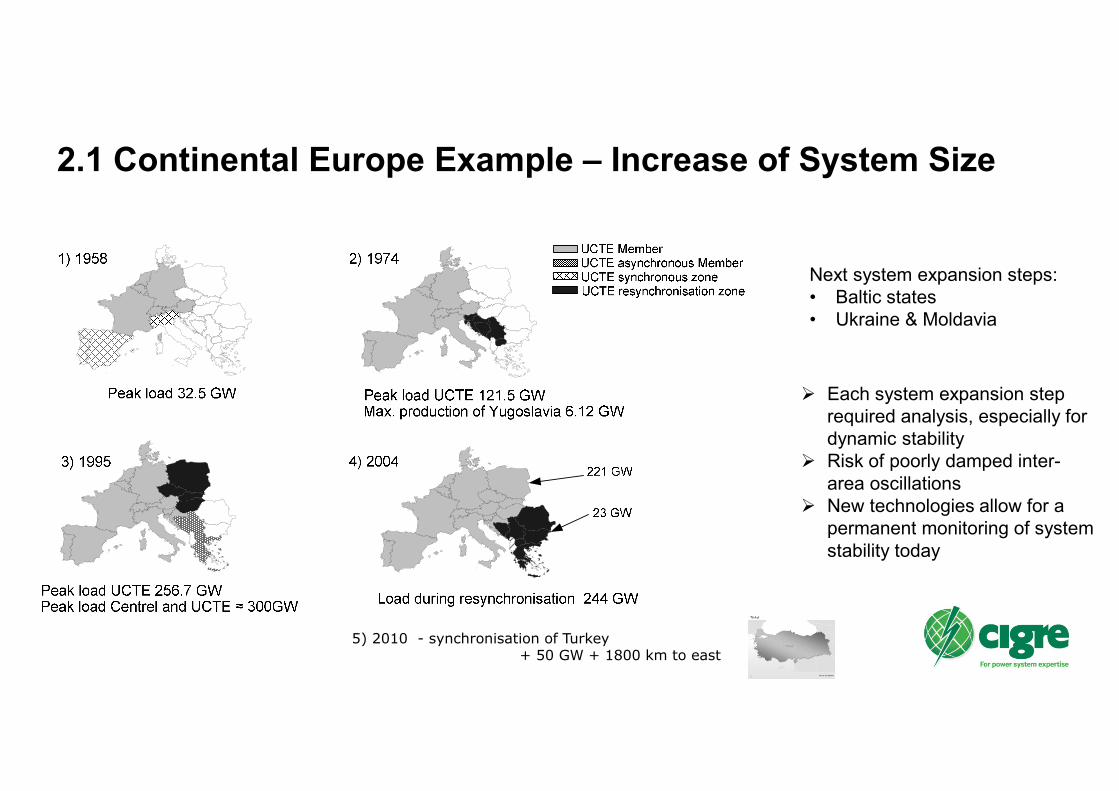
2.1 Continental Europe Example – Increase of System Size
5) 2010 - synchronisation of Turkey+ 50 GW + 1800 km to east
Each system expansion step
required analysis, especially for
dynamic stability
Risk of poorly damped inter-
area oscillations
New technologies allow for a
permanent monitoring of system
stability today
Next system expansion steps:
• Baltic states
• Ukraine & Moldavia

2.2 Continental Europe Example – Current Structure
2000 x 4200 km / 400 GW 26 Countries30 Transmission system operators530 Mio inhabitants220 - 440 GW system load

2.3 Impact of Different Stakeholders Behaviour –Deterministic Frequency Deviations
positive control power deviation
negative control power deviation
load ramp
Schedules for BRP & power plants

2.4 System Connection Monitoring – UCTE Power System Resynchronisation
ZONE 2
ZONE 1
PMU
PMU
Peak Load: 223 GW
Peak Load : 21 GW
PMU
PMU
2004 October 10th
9:34 – 10:58
Zagreb
European Electrical Reunification
5 x 380 kV
2 x 220 kV
1 x 110 kV

2.5 System Connection Monitoring
On
-lin
e-M
on
ito
rin
g o
f syste
m d
am
pin
g b
eh
avio
ur

3.1 Difference between SCADA and Phasor Approach
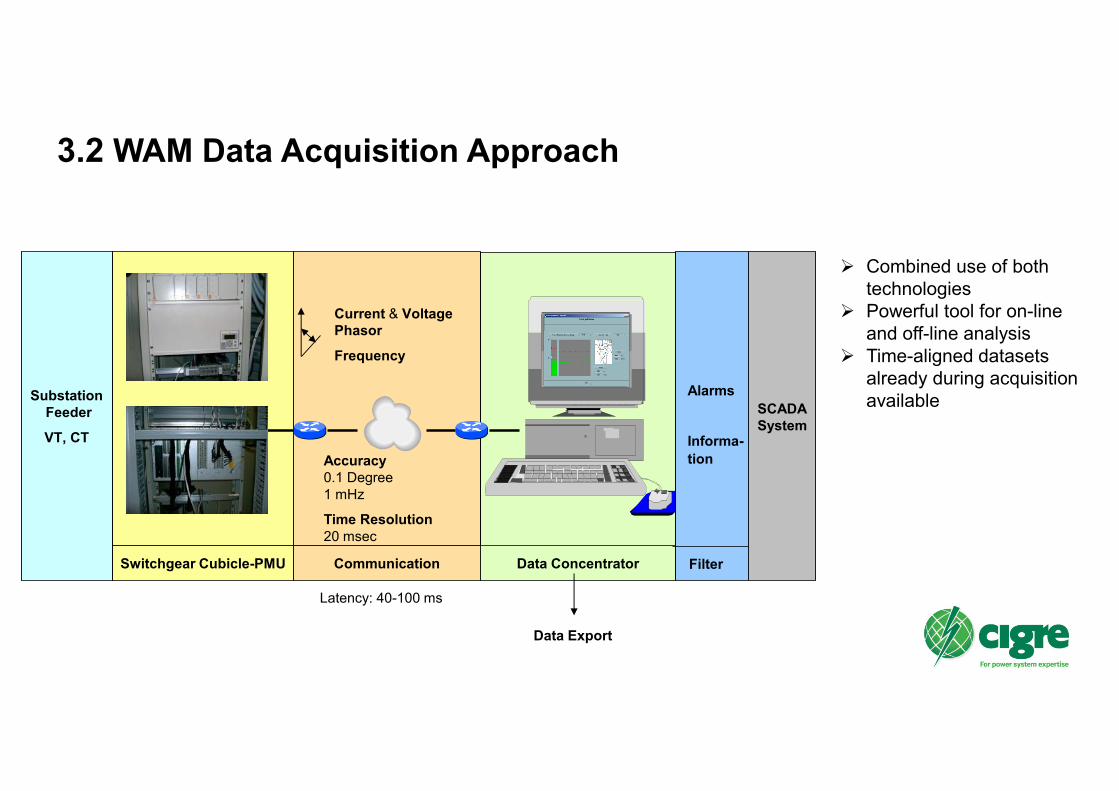
3.2 WAM Data Acquisition Approach
CommunicationSwitchgear Cubicle-PMU Data Concentrator
Current & Voltage
Phasor
Frequency
Accuracy
0.1 Degree
1 mHz
Time Resolution
20 msec
Substation
Feeder
VT, CT
Data Export
Alarms
Informa-
tion
Filter
SCADA
System
Combined use of both
technologies
Powerful tool for on-line
and off-line analysis
Time-aligned datasets
already during acquisition
available
Latency: 40-100 ms

3.3 History of Continental Europe WAM Setup – SG Example Connections
ATATÜRK
HES TM
TEMEL
Lİ TM
HAMİTAB
AT TM
Kasso
Recarei
HamitabatTemeliAtatürk
Participation in CE system
extension projects have created
the conditions required for a CE
WAM overview system
Start of WAM activities in 2003
as a pilot application

3.4 Key Messages – Main Applications Feedback
Crucial role of reliable telecommunication
Efficient use only by wide system data exchange
Clear rules and standards for data exchange including separation of market sensitive information data exchange
Example: Turkey island operation 2019, April 23nd, 9:03-9:39 CEST
0
0.05
0.1
0.15
0.2
0.25
0.3
00:00:00 04:00:00 08:00:00 12:00:00 16:00:00 20:00:00 00:00:00
Hz
Oscillation Freqency - Voltage Phase Angle: Mettlen - Ag. Stefanosxx
xx

3.5 Monitoring Application Examples
Oscillation Analysis
• Frequency ranges 0.002 Hz to 50 Hze.g. governor, electromechanical, control, power electronics & series capacitor
• Mode shape, coherence & source location
• Control tuning
Disturbances
• Frequency & angle disturbances – location & impact
• Islanding and resynchronisation
Model validation
• Dynamic models – transient & small signal
• Loadflow – line parameters, state estimator
Post event analysis & reporting

3.6 Monitoring & Control Timescale
15 minutes
Operator Dispatch
Human Response
3-15 s
Automated
Dispatch
200-600 ms
Wide-Area Defence
16-200 ms
Equipment
Protection
0.6-3 s
Automated
Trip
Automated Wide Area Control Control Room EMS/WAMSProtection
Local & Differential Fault Protection
Short-Term Voltage Stability
Long-Term Voltage Stability
Oscillatory Stability
Frequency Stability
Transient Stability
N-x Transient Stability

3.7 Monitoring OscillationsMany forms of oscillation over wide frequency range
Common-mode(0.005-0.1 Hz)
Electromechanical • Inter-area (0.1-1.0 Hz)• Local (0.7-2.0 Hz)
Modal Interaction• Electromechanical• Sub-Synchronous
Resonance
Voltage control mode
(1.5-6 Hz)
Power electronics(e.g. HVDC)
Out-of-Step
Periodic ForcingHydro rough-
runningWater column
oscillations
Very Low FrequencyCommon Modes
0.002 Hz
0.1 Hz
4 Hz
Electromechanical
Control modes
Rough running
Power electronic control modes
Sub-synchronous oscillation/resonance
12 Hz
46 Hz
Sta
ndard
PM
UEx
tend
ed r
ang
e

Group 1 ContributionsGroup 2 Contributions
3.8 Conclusions on Managing Oscillations
Many oscillation issues exist in Europe needing co-ordinated response
High level sparse PMUs can show Alarm on occurrence of large / poorly damped oscillation
Participating regions
Region(s) contributing to problems - where action helps
Detailed own-system PMU system can show Specific areas, plants or corridors of interest
Guidance for how to resolve in real-time or long-term
Long-term trends and risk assessments
All sizes of system or interconnection need oscillation risk management

3.9 Iberic Peninsula Oscillation on Sept. 1st 2020
Iberian mode dominant
over hours
One ES-FR 400 kV line
out of operation
Significant export from
Iberian peninsula to the
centre of the CE
system (higher 2 GW)
0.18 Hz mode
Up to 70 mHz peak-to-
peak

3.10 Current CE Power System Behaviour – WAM / SCADA View 1

3.11 Current CE Power System Behaviour – WAM / SCADA View 2
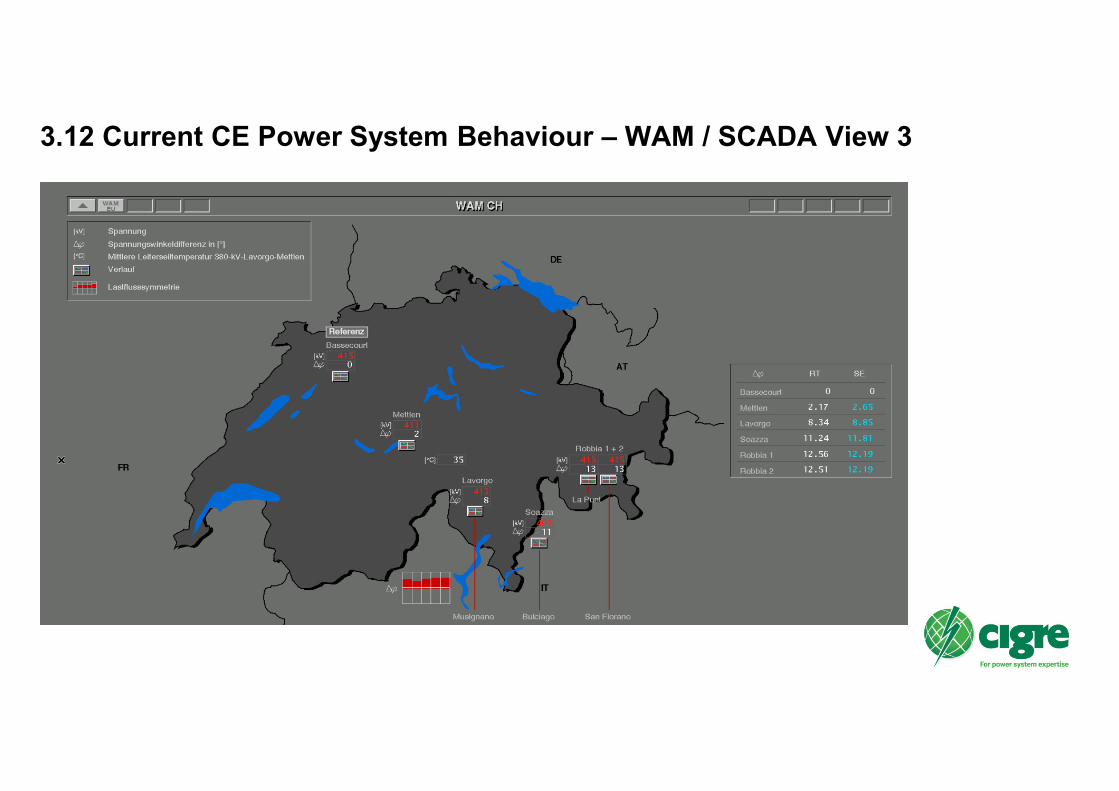
3.12 Current CE Power System Behaviour – WAM / SCADA View 3

3.13 Phase Angle Monitoring and Constraints
Transient and oscillatory stability constraints more closely related to angle difference than power
Power cut-set constraint on long corridor with infeeds (e.g. wind) changes with location of generation
Power-angle monitoring or constraint used as: Alarm on anomaly – large angle difference indicates
weakened network or long P transmission distance
Constraint definition as P&∆δ – closer to physical corridor dynamic limit than simple P cut-set
Phase angles can be useful in alarming and constraint management
δ

3.14 Black Start and Power System Restoration
PMU data is necessary to monitor the black start path
09:0
5:00
.000
09:0
5:50
.000
09:0
6:40
.000
09:0
7:30
.000
09:0
8:20
.000
09:0
9:10
.000
09:1
0:00
.000
09:1
0:50
.000
09:1
1:40
.000
09:1
2:30
.000
09:1
3:20
.000
09:1
4:10
.000
09:1
5:00
.000
09:1
5:50
.000
09:1
6:40
.000
09:1
7:30
.000
09:1
8:20
.000
09:1
9:10
.000
09:2
0:00
.000
09:2
0:50
.000
09:2
1:40
.000
09:2
2:30
.000
09:2
3:20
.000
09:2
4:10
.000
09:2
5:00
.000
09:2
5:50
.000
09:2
6:40
.000
09:2
7:30
.000
09:2
8:20
.000
09:2
9:10
.000
09:3
0:00
.000
09:3
0:50
.000
09:3
1:40
.000
09:3
2:30
.000
09:3
3:20
.000
09:3
4:10
.000
09:3
5:00
.000
09:3
5:50
.000
09:3
6:40
.000
09:3
7:36
.860
09:3
8:26
.860
09:3
9:16
.860
09:4
0:06
.860
09:4
0:56
.860
09:4
1:46
.860
09:4
2:36
.860
09:4
3:33
.220
09:4
4:23
.220
In black start, operators must immediately see success and stability of each stage in the black start plan.
Any failure to energise or resynchronise must be observed immediately and addressed correctly.
Future use of renewable & distributed generation for black start requires close attention to dynamics.
WAMs accelerate restoration
and reduce exposure to risk

3.15 Power System RestorationDynamics and stability important in load pickup and resynchronising
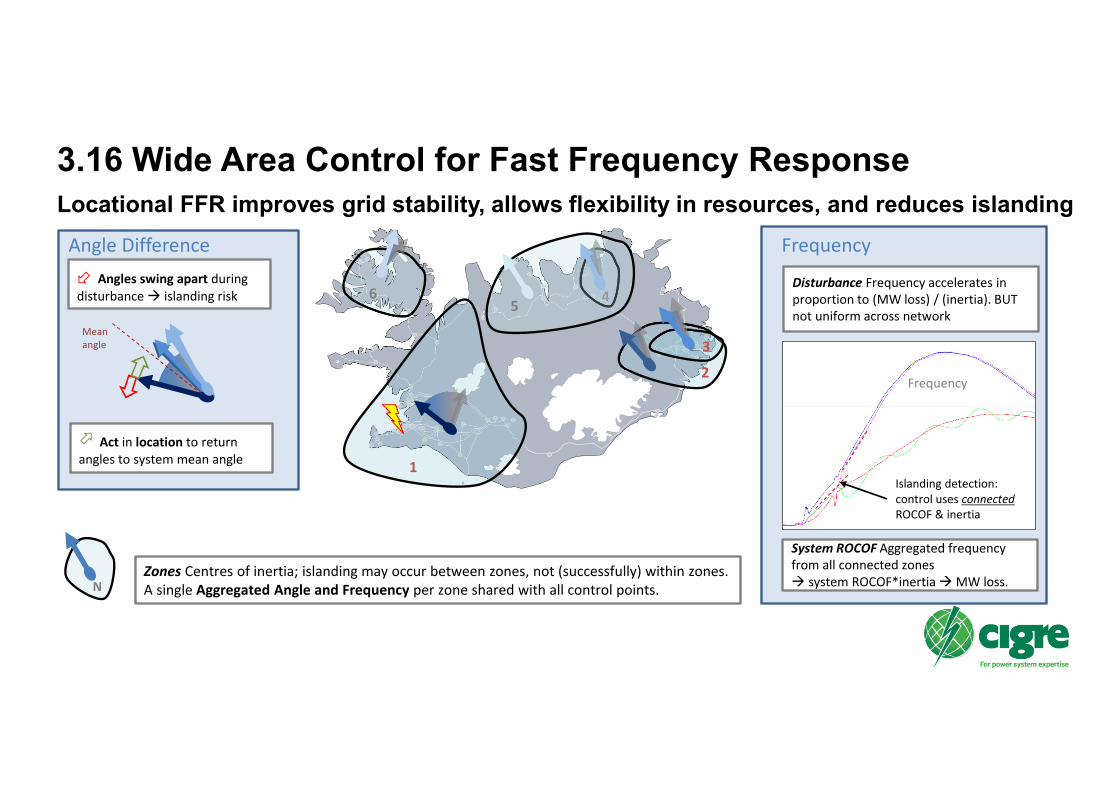
3.16 Wide Area Control for Fast Frequency Response
Locational FFR improves grid stability, allows flexibility in resources, and reduces islanding
1
2
3
6 4
Zones Centres of inertia; islanding may occur between zones, not (successfully) within zones. A single Aggregated Angle and Frequency per zone shared with all control points. N
Frequency
System ROCOF Aggregated frequency from all connected zones system ROCOF*inertia MW loss.
Islanding detection: control uses connectedROCOF & inertia
Disturbance Frequency accelerates in proportion to (MW loss) / (inertia). BUT not uniform across network
Angles swing apart during disturbance islanding risk
Act in location to return angles to system mean angle
Mean angle
Angle Difference Frequency
5

3.17 Landsnet Smart Grid for Locational FFR
❶❷
❶ ❷ ❹
❸
Control Centre
• Data Concentrator for PMU data• Control Room visualisation• Administration of PhasorControllers• Testing & trials
ISAL Smelter Load Control
• PhasorController• PMU data IN, 61850 GOOSE OUT• 1x interface unit to I/O plant control
Hrauneyjafoss (HRA) Fast Ramp
• PhasorController• PMU data IN, TPIO Digital Out• Governor acts on RAMP DOWN
& WICKET GATE CTRL
East Iceland Fish Factory Load Shed (x6 plants)
• PhasorController• PMU data IN, 61850 GOOSE OUT to 6x satellite I/O• Factories link satellite I/O to load breaker
❸
n
PhasorController20ms Real-Time PMU-based logic controller with specialist WACS function
block library
❹
❻ NAL Smelter Load Control
❻
7
7 Geothermal governor control (planned)
5
5

3.18 Fast Frequency Response Resources Using Existing Generation and Load for Efficient Fast, Stabilising Frequency Services
System lossPower
Time
4-8 s
Frequency
Time
Instantaneous balance
Steady-state balance
(governor response finished)
Long term balance
(redispatch to market)
20-40 s
Rapid Event-Triggered Responses (Wide Area & Local)
Rapid Frequency-Proportion &
Deadband (Local)
Frequency-Proportion & Delay (Local)
Dispatch / Market
Kinetic Energy Accel/Decel
UNIFIED TOTAL POWER BALANCING RESPONSE USING DIVERSE RESOURCE
Frequency response resources co-ordinated for total frequency response. Rapid event-triggered (k1*∆Ploss) Rapid freq-control (k2*∆F; deadband) Normal freq-control (k3*∆F with delay)
Aggregation enables many diverse resources to participate in service provision, including variable generation & demand response
Delivering overall response that is: Proportionality to event Discriminating real system events Enhancing grid stability Predictable aggregate response
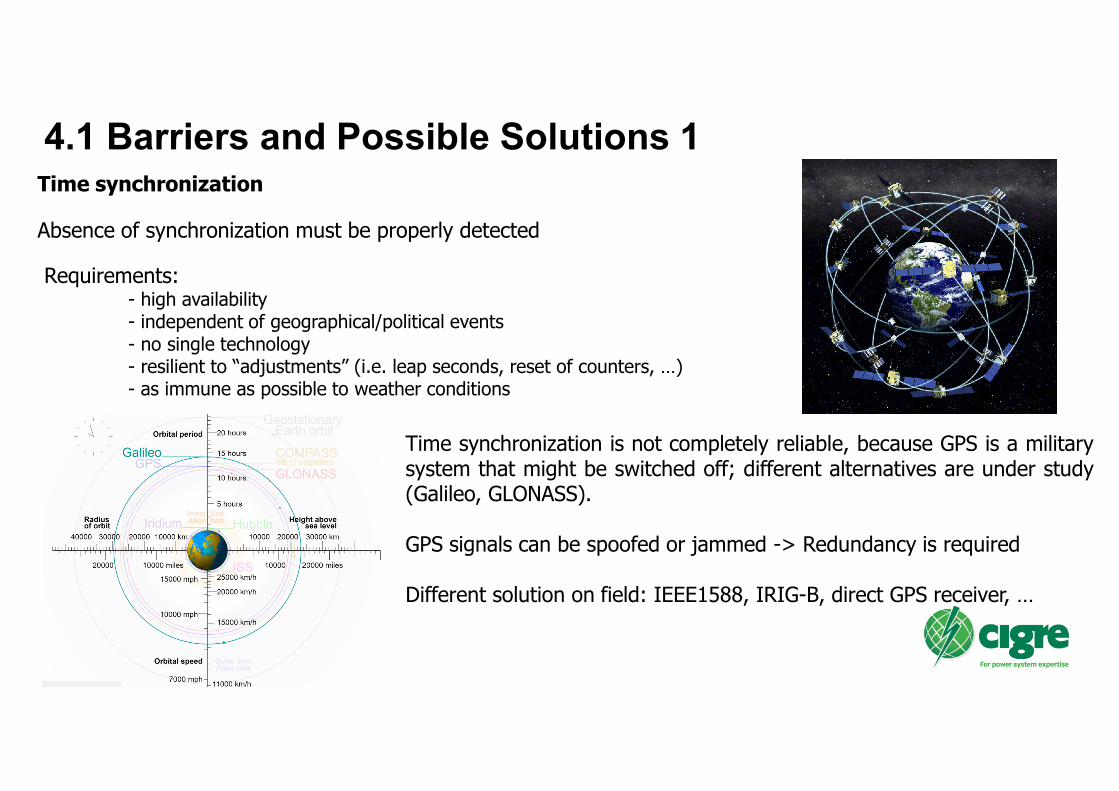
4.1 Barriers and Possible Solutions 1
Requirements:- high availability- independent of geographical/political events- no single technology- resilient to “adjustments” (i.e. leap seconds, reset of counters, …)- as immune as possible to weather conditions
Time synchronization
Absence of synchronization must be properly detected
Time synchronization is not completely reliable, because GPS is a militarysystem that might be switched off; different alternatives are under study(Galileo, GLONASS).
GPS signals can be spoofed or jammed -> Redundancy is required
Different solution on field: IEEE1588, IRIG-B, direct GPS receiver, …

4.2 Barriers and Possible Solutions 2
Recognition of a PMU losing synchronism
This event can cause a serious degradation of TVE and angle estimation. The erroneous or slow synchronismfault could endanger Special Protection Schemes based on angle difference monitoring or alarm generationbased on angle
During this real test, the PMU “resists” with TVE > 1%for about 40 minutes.
Under certain circumstances, some PMUs and PDCs do not recognize thesynchronism fault for several hours. Additional work on market products hasto be done to enable the transition to WADC.

4.3 Barriers and Possible Solutions 3
Telecommunication challenges
Cyber security issues
- Secure protocols- Firewalls- Segregation- Manage real time exchanges
between TSOs
Communication channels
- Low cost- Low latency and high determinism- Availability- High traffic management- Performances guaranteed

4.4 Barriers and Possible Solutions 4
Other challenges:
Multi-vendor base applications can lead to challenges whilst using visualization, oscillationmonitoring and events alarms tools, due to different precision for measured quantities.
Manage systems with several PMUs (selection of the signals, PDC, visualization tools etc.)
Improve the processing capabilities for post-mortem analysis
Training of the System/Grid Operator
Select information exchange between TSOs managing/filtering/encrypting data potentially sensitive for market

5.1 Applications: Control
Fast frequency responses proportional to the eventEstimation the actual resistance of conductors and mean real time temperatureDetect and successfully damp inter-area mode componentEmergency frequency control, voltage control, load shedding, system damping control, system isolation and restoration FACTS for the related damping control
FACTS application

5.2 Applications: Protection• Automatic Generation Shedding Schemes (AGSSs) are triggered by observing the positive-sequence voltage angle
difference between two transmission nodes when one of the parallel line is opened or closed (<100 ms)• IG-SIPS:
• on-line determination of the generator which is going to be tripped, • emergency stability control based on real-time response of the generators
• Fault location and impedance estimation using PMU• Under-frequency Load Shedding (UFLS) scheme and an Under-voltage Load Shedding (UVLS) scheme

5.3 Integration
TECHNICAL ISSUES
Corporate vs communication networks
Cybersecurity issues
• Data spoofing / manipulation
• Denial of service
• Malicious code injection
• “Man-in-the-middle” attacks
• Packet injection attack (“Sniffing”)
• Data validation (crosschecks, plausibility,
management of missing data, etc.)
• Big data approach and data analysis tools
• High availability on the application layer
• Convergence between SCADA and WAMs
NON TECHNICAL ISSUES
Operator’s acceptance and confidence:
The integration of WAM systems in the control room can only
be successful if operators are engaged in the development
phase, trained and committed to use new real-time applications
and data outside of ex-post analysis
Usability and capabilities of WAM system based control
applications
The Human-Machine-Interface (HMI) of WAM system control
room applications needs to provide operators with the
information they need, when they need it.
Missing regulatory aspects

5.4 Integration: Roadmap Approach 1
Facilitate the transition from an isolated WAM system infrastructure to an integrated production‐grade
operation application to support everyday operations in the control room
Improve leverage of the already deployed WAM system infrastructure to minimize the additional investment
while achieving the desired operational goals
Improve coordination of the use and enhancement of the existing WAM system (in terms of infrastructure,
applications and processes)
Analyse how the WAM system can help to improve real‐time operations, grid protection, automation and
control, in order to cope with the increasingly high level of renewable energy resources and growing reliability
requirements
Assist the management in approving further investments required for the full‐scale integration of WAM
system in the control room

5.5 Integration: Roadmap Approach 2
Benefits to markets
Reduced ancillary services
Reduced curtailment costs
Integration of distributed generation
Benefits to system operation
Risk mitigation – avoidance of widespread outages
Developments in protection
Enhanced detection of unusual systems disturbances
(e.g. oscillations, voltage instability)
Benefits to system planning / asset management
Reduced grid reinforcement costs
Benefits of more accurate system models
Benefits to interconnection analysis and understanding impacts
of high renewable penetration
Benefits to ex-post analysis
Benefits of faster and more certain analysis of events
BENEFIT MATRIX
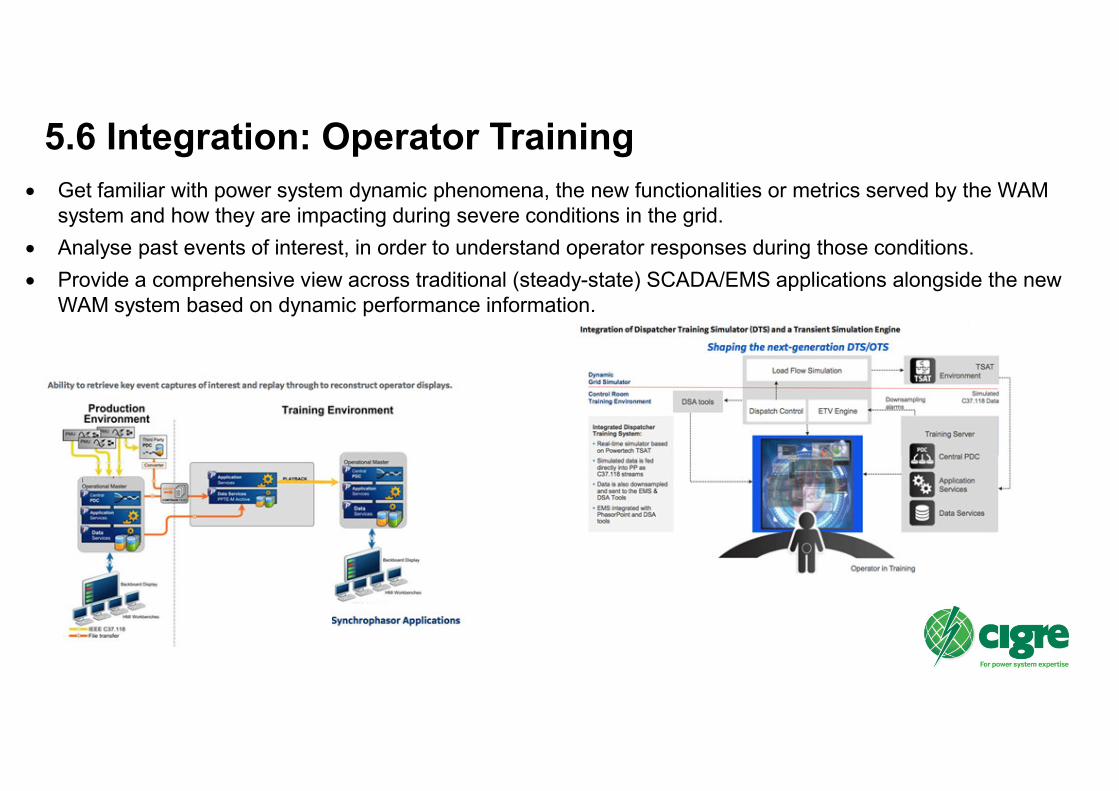
5.6 Integration: Operator Training
Get familiar with power system dynamic phenomena, the new functionalities or metrics served by the WAM
system and how they are impacting during severe conditions in the grid.
Analyse past events of interest, in order to understand operator responses during those conditions.
Provide a comprehensive view across traditional (steady-state) SCADA/EMS applications alongside the new
WAM system based on dynamic performance information.
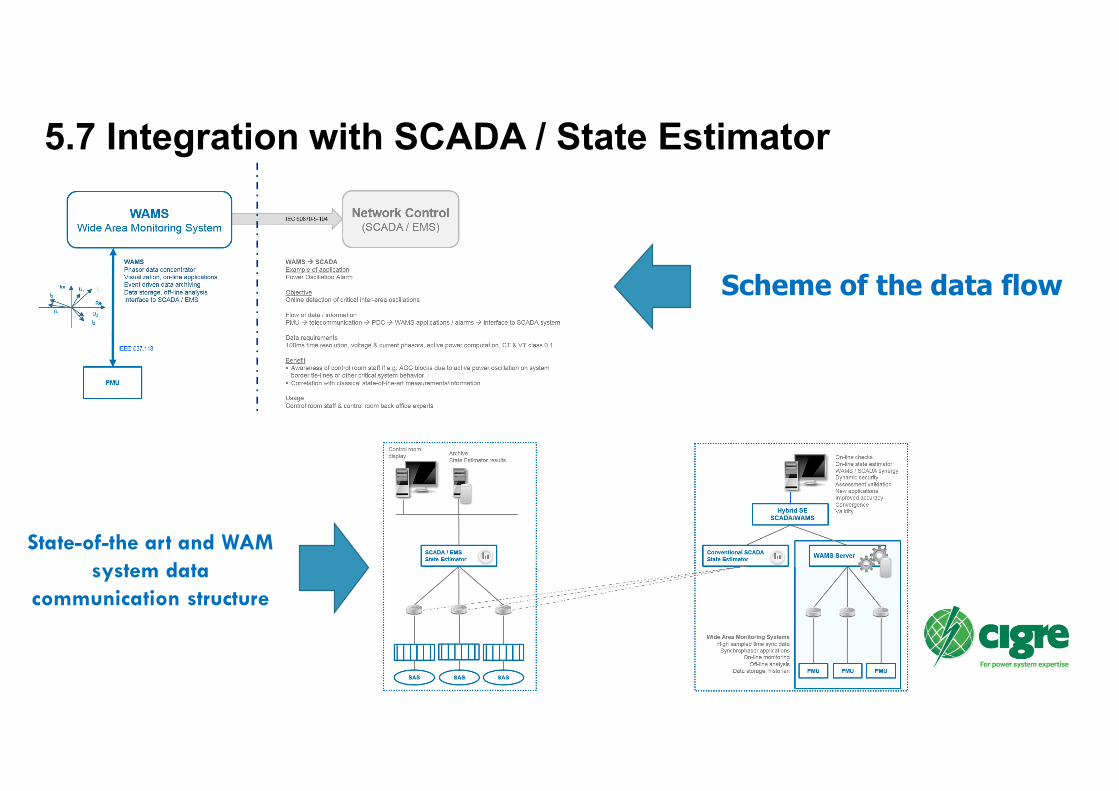
5.7 Integration with SCADA / State Estimator
Scheme of the data flow
State-of-the art and WAM
system data
communication structure

5.8 Architectures
• One central PDC data access point for
other utilities instead of connecting the
devices to a common network.
• Control access rights to the data
• Control the data that are provided to
other utilities by selecting the
synchrophasor data which are
transmitted to the clients
• Control the update rate for each client to
optimize communication bandwidth
Exchange data between
different utilities

6. Conclusions - Expected Future Developments
Supporting renewable energy transition. Increasing capacity for renewables. Managing risks.
Extending Wide Area Control & Protection use cases, methodologies, applications & testing
Locational fast frequency control, islanding management
Continuous damping & transient stability control
HVDC stability controls for AC support
WAMS/EMS Synergy: Deeper integration of WAM system with EMS, enabling co-ordinated alert/alarm viewing and
applications using multiple data sources.
Oscillation monitoring:
Improved operational procedures, training and guidance to harness real-time stability information
Extended range of frequencies for power electronic & SSR issues; needs new sampling software in PMUs
Data Analytics: Machine learning to extract more information on grid dynamic performance and diagnostics. Important
with increasing renewables/decreasing inertia. Combining EMS/WAMS/Weather etc. sources.
System Operating Limits: Advances in determining accurate, dynamic system operating limits for phase angle
differences and oscillations.
Risk Management: Identifying and resolving malfunctions or control tuning issues.
Cyber security methodologies addressing limitations of the present synchrophasor standards.

7. References
1. CIGRE TB 750 – Dec. 2018
2. Tutorial, “Wide Area Monitoring –
Control Room Applications”,
Aalborg, 2019, June 4th
3. Swissgrid SCADA & WAM System

Copyright © 2018
This tutorial has been prepared based upon
the work of CIGRE and its Working Groups.
If it is used in total or in part, proper
reference and credit should be given to
CIGRE.
Disclaimer notice
“CIGRE gives no warranty or assurance
about the contents of this publication, nor
does it accept any responsibility, as to the
accuracy or exhaustiveness of the
information. All implied warranties and
conditions are excluded to the maximum
extent permitted by law”.
Copyright &
Disclaimer notice