Embed Size (px)
Citation preview

DefenExternalDRDC-RAugust 2
Data milita
Yvan GauDRDC – C Bohdan KDRDC – C ISMOR 35th InternLondon, U Date of Pu
ce ReseLiterature
DDC-2018-P018
analytary OR
uthier Centre for Op
Kaluzny Centre for Op
national SymUK
ublication from
earch an(P) P117
tics: thR?
erational Res
erational Res
posium on M
m Ext Publish
nd Deve
CAN U
CAN UNCLA
he sam
search and An
search and An
ilitary Operati
her: July 2018
lopment
UNCLASSIFIE
ASSIFIED
me old
nalysis
nalysis
ional Researc
8
t Canad
ED
next b
ch (ISMOR)
a
big thinng for

Template in use: EO Publishing App for CR-EL Eng 2018-08-10-v1.dotm
© Her Majesty the Queen in Right of Canada (Department of National Defence), 2018 © Sa Majesté la Reine en droit du Canada (Ministère de la Défense nationale), 2018
CAN UNCLASSIFIED
CAN UNCLASSIFIED
IMPORTANT INFORMATIVE STATEMENTS
This document was reviewed for Controlled Goods by Defence Research and Development Canada using the Schedule to the Defence Production Act.
Disclaimer: This document is not published by the Editorial Office of Defence Research and Development Canada, an agency of the Department of National Defence of Canada but is to be catalogued in the Canadian Defence Information System (CANDIS), the national repository for Defence S&T documents. Her Majesty the Queen in Right of Canada (Department of National Defence) makes no representations or warranties, expressed or implied, of any kind whatsoever, and assumes no liability for the accuracy, reliability, completeness, currency or usefulness of any information, product, process or material included in this document. Nothing in this document should be interpreted as an endorsement for the specific use of any tool, technique or process examined in it. Any reliance on, or use of, any information, product, process or material included in this document is at the sole risk of the person so using it or relying on it. Canada does not assume any liability in respect of any damages or losses arising out of or in connection with the use of, or reliance on, any information, product, process or material included in this document.

1
DRDC-RDDC-[E18-0606-00354] Produced for: 35th International Symposium on Military Operational Research (ISMOR) Royal Holloway, University of London London, UK July 2018
Data analytics: the same old next big thing for military OR?
Yvan Gauthier1,2, Bohdan Kaluzny1 1DRDC Centre for Operational Research and Analysis
2Office of the Chief Data Officer Department of National Defence
Ottawa, Canada Email: {yvan.gauthier,bohdan.kaluzny}@forces.gc.ca
Abstract Business intelligence and data analytics are often presented as new or emerging means of increasing efficiency and enabling decision support in defence organisations. Yet, operational research (OR) has been used extensively since World War II to improve decision-making and efficiency in nearly every aspect of defence activities and military operations. What is defence analytics and how does it overlap with military OR? What changes have occurred over the last two decades to make data analytics so popular today? How should the military OR community adapt to these changes and position itself for the future? We attempt to answer these questions with the aid of a case study in which we apply machine learning to predict and analyse the responsiveness of the Royal Canadian Navy supply chain. We use the case study to illustrate a common data mining process and identify lessons from it.
Disclaimer: This paper is a publication of Defence Research and Development Canada. The reported results, their interpretation, and any opinions expressed therein, remain those of the authors and do not necessarily represent, or otherwise reflect, any official opinion or position of the Canadian Armed Forces (CAF), Department of National Defence (DND), or the Government of Canada.

2
Introduction
Background Data analytics is central to the digital transformation of industries and governments. The defence sector is particularly susceptible to the threats and opportunities that this transformation presents. Canada’s new defence policy statement Strong, Secured, Engaged (SSE) [1] asserts that “technological developments point to a future of defence that is expected to be vastly different than today with a greater emphasis on information technologies, data analytics, deep learning […] Any number of these advances has the potential to change the fundamental nature of military operations.”
The implementation plan [2] for this new defence policy states that “business intelligence and analytics are emerging as a means to enable alignment, drive efficiency, integrate and automate process, and readily extract decision-quality information from our systems of record.” The plan involves the establishment of a new defence analytics capability [3] led by a Chief Data Officer, who will drive analytics adoption with a view of “evolving towards a culture that facilitates evidence-based decision making [and] enabling performance management at all levels to ensure SSE delivery” [2]. Canada joins other countries already investing heavily in defence analytics, as demonstrated by recent spending made by the UK [4] and the US [5] in this area.
Issue For members of the military operations research (OR) community, these new investments are generally considered good news. However, the “emerging” nature of data analytics is debatable. Since World War II, OR has been used extensively to improve decision-making and efficiency in nearly every aspect of defence activities and military operations,1 often using quantitative techniques identical or similar to those used in data analytics. This begs the question: is data analytics the same old next big thing2 for military OR?
Outline This paper is divided into three sections. First, we first define and compare OR and analytics, and discuss developments having occurred over the last two decades that contribute to the rising popularity of data analytics. Second, we summarize an application of machine learning in which we predict and analyse the responsiveness of the Royal Canadian Navy supply chain. We use it as a case study to illustrate a typical data analytics process and identify lessons from the work. Third, we make suggestions on how the military OR community can position itself for success in the data analytics space.
Defining OR and Analytics Many definitions of OR and Analytics exist. The Institute for Operations Research and the Management Sciences (INFORMS) uses the following [8]:
OR: the application of scientific & mathematical methods to the study & analysis of problems involving complex systems.
Analytics: the scientific process of transforming data into insights for making better decisions.
One thing that stands out is that INFORMS presents OR as a problem-centric discipline, whereas analytics is described as data-centric. A similar distinction has been made by Rose [9] and Wegryn [10] 1 See “The Origins of OR” [6] for an exhaustive list of publications on the history of military OR. 2 The title of this paper is inspired from a blog post by Harry Powell [7].


5
(now the Defence Research and Development Canada (DRDC) Centre for Operational Research and Analysis) for two decades.
George Lindsey started his career during World War II as part of the British Army OR Group, to work in the section responsible for air defence and radar. Lindsey’s work involved improving automated fire control systems called predictors. Radar data was fed directly into predictors to automate the motion of anti-aircraft guns and the setting of the fuses based on the predictors’ commands. In George Lindsey’s words:
predictors were marvels of mechanical ingenuity. They were special purpose real-time analogue computers, long before digital technology or semiconductor chips had been invented [...] All predictors had to be provided with an assumption (which would now be called an algorithm) regarding the future motion of the moving target [...] Today such problems would be classified as artificial intelligence. [17]
What is fascinating about this example is that not only some of the fathers of military OR were doing what would now be called predictive analytics (using mechanical systems, no less), they were in fact doing prescriptive analytics by controlling and automating one of the most critical weapon systems in existence at the time. Many other examples could be given to show how data analytics, as we define it today, has actually been used for a long time by military OR analysts.
What has changed If data analytics is nothing new, how can we explain its recent rise in popularity over the last one or two decades? We suggest that a combination of factors, described below, are at play.
The ubiquity of analytics: in the past, few organisations outside the military and major corporations had meaningful capability and capacity to use data-driven decision support across the spectrum of their operations. This was in part due to the costs involved in having people with the required expertise, software, and computing equipment necessary to conduct analytics (some which will be discussed later). It was also probably due to a lack of awareness of what analytics was able to do and the value it provided.
Today, most organisations use data analytics to varying degrees, even small businesses. In fact, predictive and prescriptive analytics are now available to everybody for certain daily tasks. We all have access to online recommendations on what to buy, whom to connect with on social networks, what movies to watch, what routes to take. We also have access to sophisticated predictions on the outcome of various events, such as elections3 and sport competitions.4 With this omnipresence of analytics, it is not surprising that a new generation of defence leaders expect data-driven decision support to be readily available to them for a variety of planning issues.
The number of people and organisations doing analytics: as the demand for analytics increased, the offer also increased. Countless private and public organisations are now providing analytics services to others, or are monetising their own data. Companies such as Google and Facebook have become leaders in the development and application of machine learning, and they have close ties with academia. Within
3 The website fivethirtyeight.com alone published 1079 articles detailing predictive analytics related to the 2016 US Presidential Election [18]. 4 “Moneyball” [19] has greatly contributed to the popularity of sport analytics, but again, this type of analytics is nothing new to OR practitioners. George Lindsey published in 1963 a sabermetric still used today to evaluate batting performance in baseball, based on a linear weights formula [20].

6
governments, advanced analytics is not only conducted in defence anymore, and many government departments in Canada and elsewhere are building their own analytics capabilities.
A greater number of freelance consultants and experts have entered the field. In 2006, Netflix offered a million dollars to whoever would improve its recommendation algorithm to a certain level of accuracy. Over 40,000 teams and individuals from 186 different countries ultimately entered the contest [21]. Since then, platforms like Kaggle have appeared and other organisations are submitting data challenges (including defence research organisations such as the Defence Science and Technology Laboratory [22]) and are offering substantial prizes to data scientists who can improve upon their models. Thousands of them typically enter such competitions.
Lower software costs: the most widespread software tools and packages for data analysis used to be commercial (e.g., MATLAB, SAS, SPSS) and typically cost thousands of dollars per licence. Nowadays, open source software such as R [23] and Python [24] are freely available and include state-of-the-art packages developed by academia and industry. A good example is the TensorFlow [25] library released by Google in 2015 that powers many deep learning applications.
Lower computing costs: over the last 25 years, computing power available per dollar has increased by an order of magnitude roughly every four years (adjusted for inflation) [26][27]. Whereas only big organisations had access to supercomputers before, cloud computing has democratized their use. Cloud computing providers such as Amazon and Google now make it possible to set up large, high-performance clusters with pre-installed data science software in just a few minutes. The cost of memory and hard drive storage has also been dropping exponentially for about 30 years [27].
Advancements in statistics: the science behind many advanced analytics technique has improved too. For example, the Random Forest algorithm is an ensemble approach for classification and regression that has become widely used due to its high accuracy and superiority compared to other methods [28]. Yet, it was only introduced in 2001 [29]. Another example is deep learning. Although it has its roots in Hebbian learning theories and early neural networks of the 1950’s, it has made major advances in recent years and has proven “very good at discovering intricate structures in high-dimensional data and is therefore applicable to many domains of science, business and government” [30].
Data size and availability: machine learning algorithms need to be trained using large amounts of data, and this data has become more readily available than ever, thanks to corporate databases and enterprise resource systems. The size of the data available is also larger. Recent estimates show that by 2020, there will be 50 zettabytes5 of stored data across the world and that number will increase by an order of magnitude before 2030 [31]. The drawback is that processing very large amounts of data is often impossible to do in-memory. It requires map-reduce approaches and specialized software (e.g., Apache Spark), which only a small minority of OR analysts are currently proficient with.
New ways of delivering analytics: given the popularity of analytics and the number of players who have entered the field in recent years, it is not surprising that some of them have developed new ways of doing business, often in a very agile and effective fashion. By agile, we do not merely mean responsive, but aligned with agile development practices of the software development community, which values “individuals and interactions over processes and tools, working models valued over documentation, customer collaboration over contract negotiation, and responding to change over following a plan” [32]. In the analytics realm, this involves quick and iterative model development, client satisfaction through rapid delivery of usable results, and a focus on model performance when deployed operationally [33].
Model deployment is key. It represents a cultural shift for most OR practitioners. The traditional model for delivering OR involves building a decision support model, validating it, generating results,
5 This is the equivalent to 50 billions one terabyte disk drives.
7
documenting them and, typically after several weeks or months,6 giving clients a briefing and/or a report before they make a decision. In analytics, an agile and effective process involves rapidly deploying the decision model into some enterprise system for routine use by planners and decision makers.7
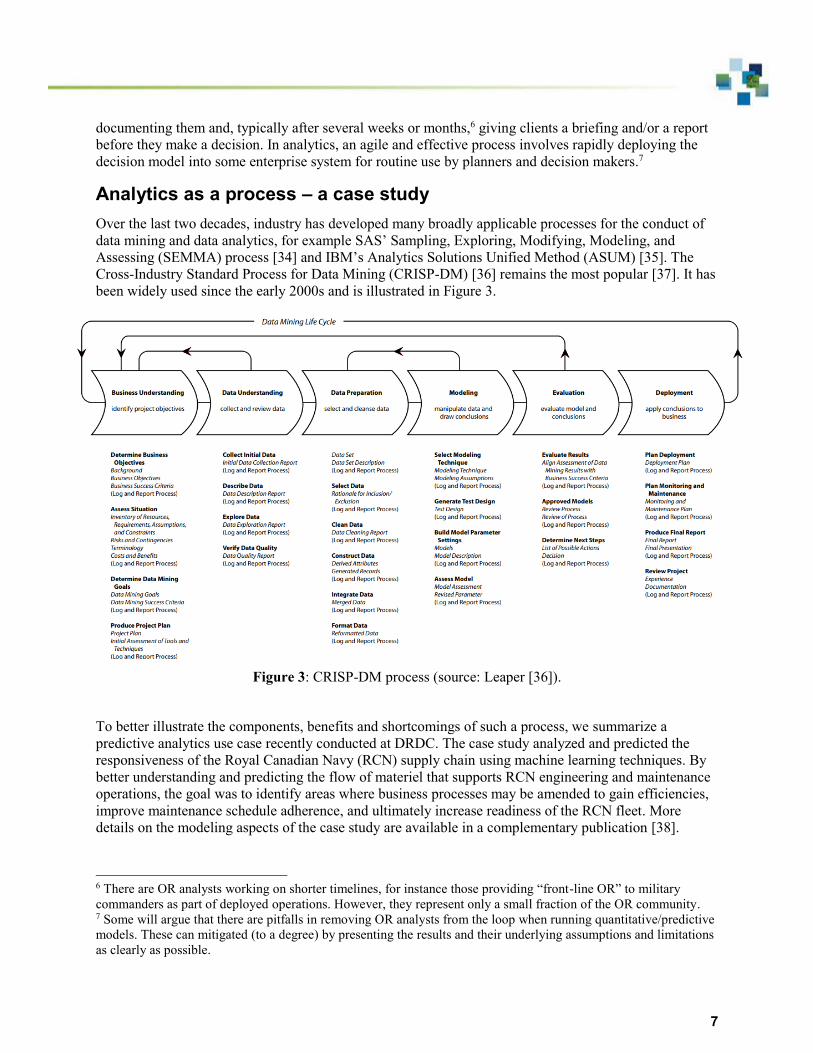
Analytics as a process – a case study Over the last two decades, industry has developed many broadly applicable processes for the conduct of data mining and data analytics, for example SAS’ Sampling, Exploring, Modifying, Modeling, and Assessing (SEMMA) process [34] and IBM’s Analytics Solutions Unified Method (ASUM) [35]. The Cross-Industry Standard Process for Data Mining (CRISP-DM) [36] remains the most popular [37]. It has been widely used since the early 2000s and is illustrated in Figure 3.
Figure 3: CRISP-DM process (source: Leaper [36]).
To better illustrate the components, benefits and shortcomings of such a process, we summarize a predictive analytics use case recently conducted at DRDC. The case study analyzed and predicted the responsiveness of the Royal Canadian Navy (RCN) supply chain using machine learning techniques. By better understanding and predicting the flow of materiel that supports RCN engineering and maintenance operations, the goal was to identify areas where business processes may be amended to gain efficiencies, improve maintenance schedule adherence, and ultimately increase readiness of the RCN fleet. More details on the modeling aspects of the case study are available in a complementary publication [38].
6 There are OR analysts working on shorter timelines, for instance those providing “front-line OR” to military commanders as part of deployed operations. However, they represent only a small fraction of the OR community. 7 Some will argue that there are pitfalls in removing OR analysts from the loop when running quantitative/predictive models. These can mitigated (to a degree) by presenting the results and their underlying assumptions and limitations as clearly as possible.

8
Phase 1 - Business understanding This initial phase focuses on understanding the project objectives and requirements from a business perspective, then converting this knowledge into a data mining problem definition and a preliminary plan designed to achieve the objectives [36].
In the present case, the first phase focused on developing a basic understanding of the RCN supply chain. Essentially, fleet maintenance facilities (FMFs) release work orders for specific maintenance jobs required on specific ships. The materiel needed for maintenance work orders is consolidated at least once a day into a Stock Transportation Order (STO) that Base Logistics (BLog) facilities may or may not be able to fulfil based on their respective inventories. If a materiel item is available, BLog issues it to the work order requiring it the soonest; otherwise, supply managers must procure or move materiel from another location before issuing it. The procurement process can be done in different ways, for example through local suppliers near the FMFs or through a national procurement process involving several steps and a wide range of national or international suppliers. All priority orders have a code that can take three values: "operationally critical" (materiel required in 6 days or less), "essential" (materiel required in 14 days or less), or "routine" (materiel required in 21 days or less). These are the orders we are primarily interested in because they all imply a required delivery date.
Predicting whether ordered materiel items will be received on time (or not) is obviously of interest to maintenance planners and supply managers, because it helps them mitigate the risk of slippage in maintenance schedules. Making such prediction, however, is challenging because the RCN currently does not have full visibility on the inventories of its external suppliers. Internally, the RCN also has challenges in tracking inventories and movements of goods within its own supply chain. A modernization effort started in 2017 to increase asset visibility through the supply chain, but this is a multi-year project for which limited data are presently available.
Fortunately, the RCN has many years of historical data that can be exploited to make predictions. In particular, the business processes for managing the movement of goods between BLog and FMFs have been fairly stable in recent years. This is the movement of goods we are focusing on in this work and we are characterizing the responsiveness of the RCN supply chain through the lens of the responsiveness of BLog to meet FMF's demands.
Phase 2 - Data understanding The data understanding phase starts with initial data collection and proceeds with activities that enable you to become familiar with the data, identify data quality problems, discover first insights into the data, and/or detect interesting subsets to form hypotheses regarding hidden information [36].
We used a data set recording materiel items that have been ordered and received for work orders made by two FMFs (FMF Cape Scott in Halifax NS, and FMF Cape Breton in Esquimalt BC) between 01 April 2014 and 31 March 2018, a period corresponding to the last four fiscal years. The raw data set included 98,432 records with over 40 fields of interest, such as the STO date, the Goods Issued (GI) date, the Goods Received (GR) date, the North Atlantic Treaty Organization (NATO) stock number, the supply manager code, the items' supply location, the items' receiving location, and several other fields.
We produced over 30 different plots (not shown here) to better understand the data, for example to understand the distribution of time between STO and GR dates, across several dimensions (requirement priority, supply locations, receiving locations, supply managers involved, materiel type/classification, etc.). We worked closely with staff from FMF Cape Scott and the Directorate of Naval Logistics to interpret them correctly.

9
Phase 3 - Data preparation The data preparation phase covers all activities needed to construct the final dataset (input for the modeling tool(s)) from the initial raw data [36].
We prepared the data for modeling in Python, through several steps. First, we reformatted multiple text fields, such as supply manager codes for which the format was not standardized.8 Second, we removed a small fraction of the records containing blatant errors (e.g., an item mark as received a few days before the actual STO date). Third, we removed all features deemed useless for prediction purposes (e.g., unique STO numbers associated with each row). Fourth, we numerally encoded all the labels (strings) associated with categorical variables. Fifth, we first discarded features that included information duplicated from (or highly correlated9 with) those of other features. Sixth, we engineered new features, for example by extracting the country code and the supply classification group from the NATO stock number, or by extracting the year, month and weekday from the STO date. Finally, we created a binary outcome variable showing whether delivery timelines had been met (or not) for each materiel item.
At this stage of the process, we had a total of 15 features of interest in the data and one outcome variable (the satisfaction of delivery timelines). We used recursive feature elimination using a Random Forest classifier to determine which of these features should be retained. We chose a Random Forest because tree-based methods are generally good for feature selection and, as will be shown later, this algorithm performs well for classification. In the end, 13 features were retained for further modeling.
Phase 4 - Modeling In this phase, various modeling techniques are selected and applied, and their parameters are calibrated to optimal values. Typically, there are several techniques for the same data mining problem type [36].
Using the Scikit-learn package [40] in Python, we first compared various classification models, including models based on Logistic Regression (Reg), Gradient Boosting, Naïve Bayes, Linear Discriminant Analysis (LDA), Neural Nets (multi-layer perceptrons), K-Nearest Neighbors (KNN), Classification and Regression Trees (CART), and Bagged CART. We trained all models on 90% of the data (keeping the remaining 10% for later testing) using 10 stratified folds. Because our data was highly categorical, tree-based methods showed a much higher classification accuracy than Naïve Bayes or Neural Nets. As shown in Figure 4, ensemble of trees work best and the two most accurate models are Bagged CART and Random Forest.
8 For example, a same supply manager position may have been identified as “(M)D Mar P 4-3-2-7”, “(M)D MAR P 4-3-2-7”, or “D MAR P 4-3-2-7”. By standardizing the format, we reduced by nearly half the number of possible values in that field. 9 We assessed the co-linearity of the features using a correlation matrix and removed features with Spearman's rho above 0.6. Between two highly correlated fields, we discarded the least informative one, that is, the one with the lowest number of categories. For example, the Planning Plant (taking one of two values: FMF Cape Scott in Halifax or FMF Cape Breton in Esquimalt) was highly correlated with the receiving storage location of a materiel item (taking one of 159 values), thus between the two features we kept the receiving location.

10
Figure 4: Accuracy of different classifiers on 10 training folds.
We tuned the classifiers through a randomized search across the hyperparameter space, again using the training set, and then applied the tuned classifiers on the test set. Tree ensembles remained the most accurate. When predicting if materiel will be received by FMFs on time (Yes or No), both the Bagged CART and Random Forest were correct for 77% of the STO items in the test set. Figure 5a presents the confusion matrix for the tune Bagged CART applied on the test set.
a) b)
Figure 5: Confusion matrices for predictions made on 9,822 items of the test set using tuned Bagged CART with a) probability threshold for classification p = 0.500 and b) with p = 0.667.

11
Phase 5 - Evaluation Before proceeding to deployment of the model, it is important to thoroughly evaluate it and review the steps executed to create it, to be certain the model properly achieves the business objectives [36].
Based on the results of Figure 5a, it is clearly possible to predict supply chain responsiveness based on STO features. Note that we are using a balanced test set where the actual number of “Yes” and “No” values is nearly the same. Accordingly, purely random predictions should yield approximately 50% accuracy, on average. Reaching a prediction accuracy of 77% is good in comparison,11 especially if we consider that predictions are made without any visibility on the suppliers’ inventories or transport information. This implies an error rate of 23%, but not all errors should be considered equal: it is worse to predict that an item will arrive on time when it will not (false positives, FP) than to predict that an item will not arrive on time when it will (false negatives, FN).
In the present case, there was 12% of false positives predictions on the test set. This figure can be reduced by changing the probability threshold p for binary classification, by default assumed to be p = 0.500. Using theory from Elkan [42] for a binary classifier, the cost-sensitive optimal probability threshold is:
p* = FP / (FP + FN).
For example, if we arbitrarily assume that the cost of an item unexpectedly arriving late (FP) in terms of maintenance schedule disruption, readiness reduction risk, etc. is twice the cost of an item unexpectedly arriving on time (FP) in terms of effort wasted on item tracking and unnecessary mitigation measures, then
p* = 2/3 ≈ 0.667.
Under the assumption above, the confusion matrix becomes the one showed in Figure 5b. The number of false positives goes down by more than half, while overall accuracy decreases marginally.
According to RCN supply planners, this level of predictive performance appears sufficiently high for maintenance planning purposes. From their perspective however, the algorithm’s classification performance is not a very useful result. What is more useful to them is to know the probability of an item being late as early as possible, and the model already calculates this probability.12
From a strategic perspective, understanding the key predictors of lateness is also highly valuable, as it helps to identify systemic problems in the supply chain. In our case, we compared the relative importance of the predictors using the permutation method of Parr [43] and identified the main variables (amongst those for which we had data) that drive supply chain responsiveness.
Phase 6 - Deployment Even if the purpose of the model is to increase knowledge of the data, the knowledge gained will need to be organized and presented in a way that the customer can use it. It often involves applying “live” models within an organization’s decision-making processes [36].
Deploying the case study prediction model for operational use by RCN planners is being accomplished in phases. The goal is to automatically generate predictions and reports in the database software hosting the live data. In the interim, largely due to current software limitations in the enterprise resource planning (ERP) system used by the RCN, the deployment is ad hoc; results generated in Python have to be 11 Cohen’s kappa (a metric that compares the observed accuracy with the expected accuracy from random chance) was 0.55, well above the 0.40 threshold for moderate performance according to Landis and Koch [41]. 12 Another useful prediction would be the date at which the item will arrive. We do not cover this part of the analysis here, but we also applied regression algorithms to estimate delivery times and the estimation errors were too large to make the predictions useful.

12
manually uploaded into a prediction dashboard residing in the ERP used by RCN planners. Figure 6 shows an example of such dashboard. It shows probabilities of different items to arrive late, as calculated by the prediction model described earlier.
Figure 6: Portion of a prediction report showing probability of items to be received on
time by FMFs (detailed STO information deliberately masked).
The ERP system is expected to be upgraded by the end of 2018, at which point it should become possible to automate the data preparation, modeling, training and evaluation steps described earlier. This will provide RCN planners with real-time predictions on materiel responsiveness. The dashboard will continuously represent live predictions when the system allows it, providing maintenance planners with an early warning of items that may not be available on time, as soon as an order for them is entered into the system. Maintenance planners will be able to use this information to ascertain which items will be available (or not), and identify mitigation measures or alternative procurement options with supply planners. Our ultimate deployment goal is to implement automatic data gathering and processing; model building, scoring, monitoring and updating; and prescription (immediate, automated mitigative action).
Discussion One could argue that the data mining process described here is not very different than the process typically followed by OR analysts during the course of their studies. After all, isn’t it natural to explore data and prepare it before building any quantitative model? Isn’t obvious that the model should be evaluated and validated before being deployed?
The key differences between analytics and OR probably reside at both ends of the process described earlier. Data analytics processes such as CRISP-DM implicitly assume that data sets are readily available or relatively easily to collect. The most time-consuming tasks are typically merging the data from multiple sources and preparing it for analysis. For military OR studies, especially studies related to related

13
to future operations or future capabilities (e.g., studies supporting capability development or concept development), there is often very little data to start with. Getting to the point where there is enough quality data to analyze can be an arduous path involving scenario development, experiments, wargames, expert elicitation, or other techniques, which can be fairly time-consuming in terms of preparation and application, and which require some experience to be applied. Moreover, the data ultimately obtained is often better described as “small data” than “big data.”
At the other end of the process, a minority of OR models are deployed for routine use by planners and decision-makers. In Canada, most OR models developed by DRDC are fit-for-purpose models developed in the context of specific studies and supporting one-off decisions. Some models are re-used on a recurring basis, but rarely by planners or decision makers themselves. Automated prescriptive models remain futuresque for the most part.
Despite these differences, there are many similarities and OR practitioners can learn from the analytics processes developed in industries. We identify a few lessons from the case study.
Analytics is truly an iterative process. As shown by all the arrows in Figure 3, data mining is not a linear process. The Business Understanding and Data Understanding phases are most critical, similar to any OR study. In analytics, however, it is tempting to jump quickly to the Data Understanding step because data sets are often just a query away. We fell into that trap and had to return asking questions to subject-matter experts many times during the course of the work. The data only became clear after discussing (at length) the business processes of the RCN supply chain and visiting the FMF in Halifax. Furthermore, we found that although the Modeling phase is key to the success of analytics – and probably the most enjoyable part of the work for data scientists – it is not necessarily the most time-consuming step. Many software packages, for example the caret package [44] in R, now exist to speed up the development, comparison and selection of statistical models.
Processes often need to be customized and streamlined. As mentioned earlier, there are many data processes for analytics (CRISP-DM, SEMMA, ASUM, etc.). Having compared them, we argue that there is no perfect, “one size fits all” process. The key is recognizing the benefit that a well-defined process offers. Having a well-defined process with suitable oversight ensures that business understanding; data gathering and processing; and model deployment phases get appropriate resources.
Document each phase. The CRISP-DM process (Figure 3) preaches that the work at every single step and sub-step of the process should be logged and reported. We found that difficult to do, partly because the process is not linear but very iterative. In our experience, it is simpler to document the analysis in a single analytic workbook (in our case a Jupyter Notebook; other options exist such as R Markdown notebooks). The workbook captures the work done at every step but the deployment step, including notes on business understanding and the code used for data understanding, preparation, modeling, and evaluation. We found this less confusing than documenting each step separately, and it makes the analysis easily reproducible, assuming the data files are available and do not change. Version control tools such as GIT are extremely useful to enable collaborative work and track the evolution of the analysis through the iterations. Documenting the analysis in scientific publications is also important: peer-reviews help validate the analytical approach and often offer constructive feedback for improvements.
Model deployment is necessary. The success of an analytics process hinges on model deployment. However model deployment can only be achieved if all preceding steps of the process are executed to completion. The key to successful model deployment is the development of a Deployment Plan. Model deployment may be evolutionary: ad hoc or manually generated reports can results in client buy-in and increased engagement. With our case study, a manually generated prediction report

14
offered a glimpse of its potential impact when fully automated. The next level of deployment is automating report production to provide decisions makers with real-time predictive analytics and foresight. Fully automated models, incorporating data scraping and processing; model building, updating and validating; and prescription (action), represent the Gold Standard.
Team composition and teamwork is essential. There is a variety of roles on an analytics project. A typical analytics process nicely breaks down the different roles and corresponding skill sets required: data stewards, client subject-matter expert, modeler, deployment lead, process manager, information technology architect, interface management, model manager, etc. People with different skillsets are needed and bring different perspectives. Close collaboration with clients is necessary to understand the client’s problems, processes and data in depth (co-location is ideal). Defence scientists are likely not optimally programmed or incentivised to “own” the entire process. Different incentives, mindsets, and skillsets (traditional OR/statistics vs. data analytics) are required.
Be agile. Day-to-day, an analytics project rarely has more than a handful of active participants. Not everyone contributes equally, in terms of time, but in an optimally composed team each member will provide critical unique qualifications. These may be a result of prior experience, vertical (client) knowledge, knowledge of proprietary ERPs, technical expertise, and strategic perspectives. For the RCN case study team members were chosen subjectively and thrust into project roles. In our case study, it was beneficial to employ a scrum approach, borrowing from agile software development best practices. Scrum relies on a self-organizing, cross-functional team: no one individual decides which person will do which task or how a problem should be solved. The team decides as a whole. To progress our case study, we relied on frequent meetings to define the next sprint – desired outcomes to achieve within a short-term. This allowed us to achieve progress and adjust for failures without losing too many resources.
Measure success correctly. While the success of an analytics process hinges on model deployment, the measures of success of a project should be at a strategic level. Did we answer the right question in the right way? Does the model really inform decisions? Was the assembled project team provided adequate resources? Did the project team work well together? Did the organization mature or evolve in its acceptance of analytics because of the project? It is interesting to note that Netflix did not use the $1 million dollar winning algorithm that would have increased the accuracy of the company's recommendation engine by 10 percent. The engineering costs were too high. Instead, the algorithm of a runner-up was used (offering 8.43% improvement) due to easier scalability [21]. However, it may be argued that Netflix’s true success in this case is its pioneering approach and achieving the Gold Standard of a fully automated prescriptive model used by millions of people.
Positioning OR for the future At this point, it is worth considering how the military OR community should adapt to the rise of data analytics. Before making any recommendations, however, we need to consider the strengths, weaknesses, opportunities and threats that data analytics presents to the community. The following is a short SWOT analysis (partly derived from [42] and from the previous sections) that provides some context on how the OR community can best position itself for the future:
Strengths: as illustrated in Figure 2, OR analysts typically know a broad range of quantitative techniques, which often goes beyond the set of techniques used in data analytics. OR analysts are also already used to work closely with their clients: in DRDC, most OR analysts are part of embedded teams supporting organisations across the Department of National Defence and the Canadian Armed Forces, and even deploy on missions. This proximity to subject-matter experts and military leaders makes it easier to frame problems and build a thorough understanding of the operational processes and

15
business processes of Defence. OR analysts also have a reputation to provide trusted, unbiased advice, and are able to work on sensitive and classified issues. Finally, they can generally leverage external knowledge and capabilities from a wide network of partners in industry, academia and allied nations. Few other actors in data analytics have access to such a broad network of partners.
Weaknesses: because data analytics is a rapidly evolving area, a minority of OR analysts have up-to-date data science skills to query, process, and analyze data, in particular very large data sets that require specialized tools to be processed. As mentioned earlier, they seldom deploy their models for routine use by planners and decision-makers, despite the fact that technology makes this easier than ever through enterprise IT systems and mobile applications. This is partly due to the fact that OR organisations do not always incentivize employees to perform the full spectrum of tasks involved in analytics, such as data cleansing and model deployment. Some of these tasks require a lot of effort, but not necessarily a lot of creativity or problem-solving skills, which tend to lead to scientific publications and are still much rewarded in some organisations. Furthermore, agile processes for conducting analytics have not been widely adopted in governments, as they are often incompatible with bureaucratic processes that may be already in place. Finally, ‘OR’ is arguably less trendy than ‘Analytics’ these days, and decision makers in Defence may not intuitively understand all the analytical skills OR practitioners bring to bear.
Opportunities: it is understood that the digital transformation of defence presents many opportunities for the OR community. Advanced analytics techniques such as machine learning can offer huge (and generally quantifiable) benefits to defence organisations in terms of savings, efficiencies and operational effectiveness. The development of such techniques also offers several opportunities in terms of innovative research that can be undertaken in partnership with industry, academia, and Allies. Machine learning (and more broadly advanced analytics) are fertile ground for innovation through competitions and challenges, such as the Kaggle competitions mentioned earlier. Success begets success and as OR practitioners continue to find new military applications of advanced analytics, the demand and opportunities for OR can be expected to grow rapidly.
Threats: probably the biggest mistake the OR community could make is to be complacent and treat data analytics as a fad. Because of all the reasons listed before, we argue that the demand for analytics and data-driven decision support products will only keep growing amongst defence organisations. Several private, public, and academic organisations beyond OR organisations now have the expertise and tools to deliver such products. These should all play a role in innovation and digital transformation of Defence. But in order to maintain a leadership role in the space of evidence-based decision support, OR organisations will need to embrace analytics, not dismiss it.
Given all this, how should the OR community prepare for the future? Figure 7 shows the combination of skillsets required for advanced defence analytics. Traditionally, military OR used to be a combination of scientific (i.e., mathematical and statistical) expertise judiciously applied to defence and security problems. However, OR did not necessarily require much coding or database skills. This is changing. To be successful in the advanced defence analytics space, a certain fraction of military OR practitioners will need to have up-to-date programing skills, for instance:
scientific computing (e.g., using Python, R and specialized libraries such as NumPy, pandas, SciPy, Scikit-learn, caret, PyMC3, Theano, Tensorflow);
data extraction, management & processing skills (e.g., using various SQL and NoSQL enterprise databases, graph databases, map-reduce tools/approaches); and
advanced and interactive data visualization skills (e.g., using Shiny, Tableau, D3.js).


17
Figure 7) where certain techniques are blindly applied by programmers without understanding their mathematical foundations or limitations, potentially leading to incorrect predictions or recommendations.
In Canada, the Office of the Chief Data Officer was established to improve data governance and increase the use of analytics for evidence-based decision making throughout the Department of National Defence. DRDC is supporting this new organisation by leading the development of advanced analytics models and supporting their deployment into enterprise systems. This is a growth area for the military OR community, with several opportunities for innovation and collaboration.
Conclusion Data analytics is definitely not new to OR practitioners. However, due to a combination of factors, the analytics landscape has changed dramatically over the last 20 years and we expect it will continue to change at a rapid pace. This presents risks and opportunities for the military OR community. To remain key providers of data-driven decision support, military OR organisations will need to adapt and be able to deliver what we call “advanced defence analytics,” keeping their focus on hard and important decision problems for which sophisticated statistical and optimization techniques are required.
Acknowledgements The authors are grateful to Dr. Van Fong, Ms. Manchun Fang, Ms. Emily Robinson, Ms. Annie Gong and Mr. Vlad Brion for their constructive comments on the original presentation on which this paper is based and their respective contributions to the case study discussed in this paper. The author are also grateful to CPO James Dick and LCdr Andrew Sargeant for sharing their expertise throughout the case study. Finally, thanks also to Cdr Tim Gibel, Cdr Andrew Monteiro, Mr. Sean Bourdon and Mr. Raman Pall for their initial guidance and suggestions regarding the selection of a case study.
References
[1] Department of National Defence (2017). Strong, Secure, Engaged: Canada's Defence Policy. http://dgpaapp.forces.gc.ca/en/canada-defence-policy/docs/canada-defence-policy-report.pdf (Access date: 18 May 2018).
[2] Department of National Defence (2018). Defence Plan 2018-2023. March 2018. [3] Department of National Defence (2017). CDS/DM Joint Directive to Develop and Operationalize a Defence
Program Analytics Capability. 28 July 2017. [4] Public Technology (2017). “MoD launches £6m fund to improve data use in defence decision-making.”
https://www.publictechnology.net/articles/news/mod-launches-%C2%A36m-fund-improve-data-use-defence-decision-making (Access date: 18 May 2018).
[5] Govini Inc. (2017). “DoD Artificial Intelligence, Big Data, and Cloud Taxonomy.” http://www.govini.com/dod-ai-big-data-and-cloud-taxonomy/ (Access date: 18 May 2018). The report states that DoD spending on AI, Big Data and Cloud reached $7.4 billion in FY2017, which is 32.4% higher than the $5.6 billion spent in FY2012.
[6] Institute for Operations Research and the Management Sciences – INFORMS (2018). “The Origins of OR.” https://www.informs.org/Explore/History-of-O.R.-Excellence/Bibliographies/The-Origins-of-OR (Access date: 18 May 2018).
[7] Harry Powell (2018). “Big Data isn't just the same-old-next-big-thing.” http://www.grroups.com/blog/big-data-isnt-just-the-same-old-next-big-thing (Access date: 18 May 2018).
[8] Institute for Operations Research and the Management Sciences – INFORMS (2017). “Operations Research & Analytics.” https://www.informs.org/Explore/Operations-Research-Analytics (Access date: 18 May 2018).

18
[9] Robert Rose (2016). “Defining analytics: a conceptual framework.” OR/MS Today, Vol 43:3, June 2016, https://www.informs.org/ORMS-Today/Public-Articles/June-Volume-43-Number-3/Defining-analytics-a-conceptual-framework (Access date: 18 May 2018).
[10] Glenn Wegryn (2014). “Top 5 Analytics Trends for 2015.” INFORMS Podcast, December 2014. [11] Gartner, Inc. (2018). “IT Glossary.” https://www.gartner.com/it-glossary/advanced-analytics (Access date: 18
May 2018). [12] Gartner, Inc. (2017). http://www.intelligentdatalytics.com/wp-content/uploads/2017/03/AI.jpg, (Access date:
18 May 2018). [13] The Operational Research Society (2017), “Categories of Analytics”,
http://www.theorsociety.com/Pages/Training/TrainingCourses.aspx, (Access date: 29 June 2018). [14] Merriam Webster (2018). “Definition of statistics.” https://www.merriam-webster.com/dictionary/statistics
(Access date: 18 May 2018). [15] David Donoho (2017). “50 Years of Data Science.” Journal of Computational and Graphical Statistics, 26:4,
745-766, DOI: 10.1080/10618600.2017.1384734 https://www.tandfonline.com/doi/full/10.1080/10618600.2017.1384734 (Access date: 18 May 2018).
[16] Ussama Fayyad, Gregory Piatetsky-Shapiro and Padhraic. Smyth (1996). “From data mining to knowledge discovery in databases.” AI magazine, 17(3), 37.
[17] George Lindsey (1995), “Some Personal Recollections of Army Operations Research on Radar in World War II.” Canadian Military History, Volume 4, Issue 2, 201, http://scholars.wlu.ca/cmh/vol4/iss2/8/ (Access date: 18 May 2018).
[18] “2016 Election.” https://fivethirtyeight.com/politics/elections/ (Access date: 18 May 2018). [19] Michael Lewis, Moneyball: The Art Of Winning An Unfair Game. New York: W.W. Norton, 2003. [20] George Lindsey (1963) “An Investigation of Strategies in Baseball.” Operations Research, 11, 447-501. [21] Wikipedia (2018). https://en.wikipedia.org/wiki/Netflix_Prize (Access date: 18 May 2018). [22] Defence Science and Technology Laboratory (2017) “Dstl’s Kaggle competition has been a great success.”
https://www.gov.uk/government/news/dstls-kaggle-competition-has-been-a-great-success. (Access date: 18 May 2018).
[23] R Core Team (2018). “R: A Language and Environment for Statistical Computing.” R Foundation for Statistical Computing, https://www.R-project.org (Access date: 18 May 2018).
[24] Wes McKinney (2011). “pandas: a Foundational Python Library for Data Analysis and Statistics.” https://www.scribd.com/doc/71048089/pandas-a-Foundational-Python-Library-for-Data-Analysis-and-Statistics (Access date: 18 May 2018).
[25] Martin Abadi et al. (2015). “TensorFlow: Large-scale machine learning on heterogeneous systems.” Software available from tensorflow.org. (Access date: 18 May 2018).
[26] AI Impact (2015). “Trends in the cost of computing.” https://aiimpacts.org/trends-in-the-cost-of-computing (Access date: 18 May 2018).
[27] Luke Muehlhauser and Mila Rieber (2014). “Exponential and non-exponential trends in information technology.” Machine Intelligence Research Institute, https://intelligence.org/2014/05/12/exponential-and-non-exponential/ (Access date: 18 May 2018).
[28] Khaled Fawagreh, Mohamed Medhat Gaber & Eyad Elyan (2014) “Random forests: from early developments to recent advancements.” Systems Science & Control Engineering, 2:1, 602-609, DOI: 10.1080/21642583.2014.956265.
[29] Leo Breiman (2001). “Random forests.” Machine Learning, 45(1). [30] Yann LeCun, Yoshua Bengio and Geoffrey Hinton (2015). “Deep Learning.” Nature. 521. 436-44.
10.1038/nature14539. [31] Raghunath Nambiar (2017). Transforming Industry Through Data Analytics, Boston:O’Reilly, 2017. [32] “Manifesto for Agile Software Development.” http://agilemanifesto.org/ (Access date: 18 May 2018). [33] Thomas Dinsmore (2012). “Agile Analytics.” http://www.ibmbigdatahub.com/blog/agile-analytics (Access
date: 18 May 2018).

19
[34] Mark Brown and John Brocklebank (1997). “Data Mining.” SAS Institute, http://www2.sas.com/proceedings/sugi22/DATAWARE/PAPER128.PDF (Access date: 18 May 2018).
[35] IBM (2016). “Analytics Solutions Unified Method.” ftp://ftp.software.ibm.com/software/data/sw-library/services/ASUM.pdf, https://ibm.co/1fX7BXN (Access date: 18 May 2018).
[36] Pete Chapman et al. (2000). “CRISP-DM 1.0.” https://ibm.co/1fX7BXN (Access date: 18 May 2018). [37] Gregory Piatetsky (2014). “CRISP-DM, still the top methodology for analytics, data mining, or data science
projects.” KDnuggets poll, http://bit.ly/25dBZtv (last accessed 21 Feb 2018). [38] Yvan Gauthier et al. (2018). “Predicting the Responsiveness of the Royal Canadian Navy's Supply Chain.”
Draft paper submitted to the 17th IEEE International Conference on Machine Learning and Applications [39] Nicole Leaper (2009). “A visual guide to CRISP-DM methodology,”
https://exde.wordpress.com/2009/03/13/a-visual-guide-to-crisp-dm-methodology/, licensed under Creative Commons (Access date: 18 May 2018).
[40] Fabian Pedregosa et al. (2011). “Scikit-learn: Machine Learning in Python.” JMLR 12, pp. 2825-2830, 2011. [41] J. Richard Landis and Gary G. Koch (1977). “The measurement of observer agreement for categorical data,”
Biometrics. 33 (1): 159–174. doi:10.2307/2529310. [42] Charles Elkan (2001), “The Foundations of Cost-Sensitive Learning.” Proceedings of the Seventeenth
International Joint Conference on Artificial Intelligence, http://cseweb.ucsd.edu/~elkan/rescale.pdf (Access date: 18 May 2018).
[43] Terence Parr, Kerem Turgutlu, Christopher Csiszar, and Jeremy Howard (2018), “Beware Default Random Forest Importances.” http://parrt.cs.usfca.edu/doc/rf-importance/index.html (Access date: 18 May 2018).
[44] Max Kuhn et al. (2016). caret: Classification and Regression Training. R package version 6.0-71. https://cran.r-project.org/package=caret (Access date: 18 May 2018).
[45] Yvan Gauthier (2018). “Defence Program Analytics and its Implications for DRDC.” Presentation to DND Associate Deputy Minister (Science and Technology), January 2018.
[46] Drew Conway (2013). “The Data Science Venn Diagram.” http://drewconway.com/zia/2013/3/26/the-data-science-venn-diagram (Access date: 18 May 2018).
[47] Anna Schneider (2013). “Data Science Skillset.” Berkeley Science Review, 30 Jul 2013, http://berkeleysciencereview.com/wp-content/uploads/2014/04/spring_2014_azam_01.jpg (Access date: 18 May 2018).
© Her Majesty the Queen in Right of Canada, as represented by the Minister of National Defence, 2018
© Sa Majesté la Reine (en droit du Canada), telle que représentée par le ministre de la Défense nationale, 2018

DOCUMENT CONTROL DATA *Security markings for the title, authors, abstract and keywords must be entered when the document is sensitive
1. ORIGINATOR (Name and address of the organization preparing the document. A DRDC Centre sponsoring a contractor's report, or tasking agency, is entered in Section 8.) ISMOR 35th International Symposium on Military Operational Research (ISMOR) London, UK
2a. SECURITY MARKING (Overall security marking of the document including special supplemental markings if applicable.)
CAN UNCLASSIFIED
2b. CONTROLLED GOODS
NON-CONTROLLED GOODS DMC A
3. TITLE (The document title and sub-title as indicated on the title page.) Data analytics: the same old next big thing for military OR?
4. AUTHORS (Last name, followed by initials – ranks, titles, etc., not to be used) Gauthier, Y.; Kaluzny, B.
5. DATE OF PUBLICATION (Month and year of publication of document.) July 2018
6a. NO. OF PAGES (Total pages, including Annexes, excluding DCD, covering and verso pages.)
19
6b. NO. OF REFS (Total references cited.)
47 7. DOCUMENT CATEGORY (e.g., Scientific Report, Contract Report, Scientific Letter.)
External Literature (P)
8. SPONSORING CENTRE (The name and address of the department project office or laboratory sponsoring the research and development.) DRDC – Centre for Operational Research and Analysis Defence Research and Development Canada Carling Campus, 60 Moodie Drive, Building 7S.2 Ottawa, Ontario K1A 0K2 Canada
9a. PROJECT OR GRANT NO. (If appropriate, the applicable research and development project or grant number under which the document was written. Please specify whether project or grant.)
9b. CONTRACT NO. (If appropriate, the applicable number under which the document was written.)
10a. DRDC PUBLICATION NUMBER (The official document number by which the document is identified by the originating activity. This number must be unique to this document.) DRDC-RDDC-2018-P117
10b. OTHER DOCUMENT NO(s). (Any other numbers which may be assigned this document either by the originator or by the sponsor.)
11a. FUTURE DISTRIBUTION WITHIN CANADA (Approval for further dissemination of the document. Security classification must also be considered.)
Public release
11b. FUTURE DISTRIBUTION OUTSIDE CANADA (Approval for further dissemination of the document. Security classification must also be considered.)

12. KEYWORDS, DESCRIPTORS or IDENTIFIERS (Use semi-colon as a delimiter.)
Data Analytics; Military OR; Military Supply Chain 13. ABSTRACT/RÉSUMÉ (When available in the document, the French version of the abstract must be included here.)
Business intelligence and data analytics are often presented as new or emerging means of increasing efficiency and enabling decision support in defence organisations. Yet, operational research (OR) has been used extensively since World War II to improve decision-making and efficiency in nearly every aspect of defence activities and military operations. What is defence analytics and how does it overlap with military OR? What changes have occurred over the last two decades to make data analytics so popular today? How should the military OR community adapt to these changes and position itself for the future? We attempt to answer these questions with the aid of a case study in which we apply machine learning to predict and analyse the responsiveness of the Royal Canadian Navy supply chain. We use the case study to illustrate a common data mining process and identify lessons from it.