Embed Size (px)
Citation preview

London Fire Risk Analysis (London Fire Brigade Jan 2012-Aug 2015 Data)
Prepared by Jie Wu
Dataset:600k+ rows*23 columns csv file370k+ rows*27 columns csv file
Main Tools and Libraries for AnalysisPython (Pandas, DataFrame, sqlite3)RExcel

Agenda Executive Summary Incident and Mobilisation
Overview Fire Incident
• Seasonality• Hour of Day• Area• Trend of Top 5 Areas with Most Fires• Property Category• Area and Property Category• Property Type• Trend by Property Type
Fire Severity• Arrival time• Stay time
2

Executive Summary Fire risks are analysed using the Fire Incident (indicating fire
probability) and Fire Mobilisation (indicating fire severity) data. Incident trends:
• Incidents dropped slightly from 2012 to 2014. Analysis of top 5 areas with most fires, major property categories and property types shows no distinct trend (though slight decrease in some cases) year on year.
• Seasonality exists, fire risk is high in summer and low in winter.• Day-time variation exists, fire risk is high in the evenings and low in early mornings.
High risk property categories: Dwelling (29% of total fires), outdoor structure (25%) and outdoor (23%).
High risk property types: refuse related (c26% of total fires), purpose build and converted flats/maisonettes (16%), single occupancy house (10%) and car (6%).
High risk areas: Tower Hamlets, Westminster, Southwark, Croydon and Newham per number of incidents. Lambeth, Westminter, Camden, Croydon and Bromley occurred in more than one property
categories as top 3 highest risk areas. Fire severity indicators:
• Stay time (time spent to put out fires) ranges from 17-24 minutes for different areas, indicates more severe fires in Waltham Forest & Barking, smaller fires in Westminster & Camden.
• Average arrival/response time is 30mins and does not differ significantly for different areas.3

Methodology‘Fire’ is the population of interest for this study therefore further analysis are focused on Fire only.The mobilisation dataset seems incomplete (e.g. 22,630 Fire mobilisations were recorded for 2012-2015, however, c95% of these are for 2012). Post 2012 mobilisation datais therefore excluded from this study.Incident data is analysed to understand the risk drivers (e.g. region, property type) of fire and related trendsMobilisation data is analysed to estimate the severity of fires in different areas.Analytical tools used include SQL, Python and Excel.
4
Incident and Mobilisation – Overview
ObservationA total of 374,323 incidents were recorded by London Fire Brigade (LFB) during Jan 2012-Aug 2015, among which 111,601 incidents have been mobilised. Among the total recorded incidents, c20% are ‘Fire’ (77,572 incidents and 22,630 mobilised).In 2012, 21,487 Fires were recorded and 21,468 mobilised (c100%). A significant amount of 2013-2015 mobilisation data seems to be missing, resulting in low mobilisation rate (c2%) from 2013 onwards
False Alarm, 183,683
Fire, 77,572
Special Service, 113,068
LFB recorded incidents by type (Jan 2012-Aug 2015)
False Alarm, 55,047
Fire, 22,630
Special Service, 33,924
LFB recorded mobilisation by type (Jan 2012-Aug 2015)

0500
100015002000250030003500
Jan Feb Mar Apr May Jun Jul Aug Sep Oct Nov Dec
Numb
er of
Fire in
ciden
ts
Aggregate trend of Fire incidents by year (Jan 2012-Aug 2015)Year 2012 Year 2013 Year 2014 Year 2015
Commentary At aggregate level, the number of Fire incidents seems to have reduced only slightly year on year (2015 data is only up
to Aug). Within each year, summer (e.g. July) appears to have most fires, winner appears to have least fires (Dec and Jan) as
expected. However, note that the low record in Dec/Jan could also be due to people not reporting/recording incidents due to holidays.
5
Fire Incident – Seasonality

01000200030004000500060007000
0 1 2 3 4 5 6 7 8 9 10 11 12 13 14 15 16 17 18 19 20 21 22 23
Fires
Total Fire incidents by hours of day (Jan 2012-Aug 2015)
6
Fire Incident – Hour of Day
Commentary More fires seem to happen in the evening (17:00-20:00), in line with the peak of cooking activities. Fewer fires seem to happen in the morning (04:00-07:00), which could be partly due to people not reporting or noticing the
fire during sleeping hours.

- 500
1,000 1,500 2,000 2,500 3,000 3,500 4,000 4,500
TOWE
R HAM
LETS
WEST
MINST
ERSO
UTHW
ARK
CROY
DON
NEWH
AMHIL
LINGD
ONLA
MBET
HBR
OMLE
YEN
FIELD
GREE
NWICH
EALIN
GHA
CKNE
YBA
RNET
LEWI
SHAM
BARK
ING AN
D…HO
UNSL
OWCA
MDEN
WAND
SWOR
THBR
ENT
WALT
HAM F
ORES
THA
VERIN
GHA
RINGE
YRE
DBRID
GEBE
XLEY
ISLING
TON
SUTT
ONME
RTON
HAMM
ERSM
ITH…
HARR
OWKE
NSING
TON A
ND…
RICHM
OND U
PON…
KINGS
TON U
PON…
NOT G
EO-CO
DED
CITY O
F LON
DON
Fires
Total Fire incidents by area (Jan 2012-Aug 2015)
7
Fire Incident – Area
Commentary During Jan 2012-Aug 2015, Tower Hamlets, Westminster, Southwark, Croydon and Newham had most fires. Trend
and seasonality in these areas are investigated further on the next slide. City of London, Border of London (Not Geo-Coded), Kingston Upon Thames, Richmond Upon Thames and
Kensington & Chelsea had least fires.

020406080
100120140160
2012-0
1201
2-02
2012-0
3201
2-04
2012-0
5201
2-06
2012-0
7201
2-08
2012-0
9201
2-10
2012-1
1201
2-12
2013-0
1201
3-02
2013-0
3201
3-04
2013-0
5201
3-06
2013-0
7201
3-08
2013-0
9201
3-10
2013-1
1201
3-12
2014-0
1201
4-02
2014-0
3201
4-04
2014-0
5201
4-06
2014-0
7201
4-08
2014-0
9201
4-10
2014-1
1201
4-12
2015-0
1201
5-02
2015-0
3201
5-04
2015-0
5201
5-06
2015-0
7201
5-08
Numb
er of
Fire in
ciden
ts
Trend of Fire incidents by month, top 5 areas with most fires (Jan 2012- Aug 2015)
TOWER HAMLETS WESTMINSTER SOUTHWARK CROYDON NEWHAM
8
Fire Incident – Trend of Top 5 Areas with Most Fires
Commentary The number of Fire incidents shows no distinct increasing or decreasing trend over time. Some seasonality is displayed in the top 5 areas with most fires. In particular, peaks are observed in summer (around
June/July). These patterns are consistent with those shown in the aggregate Fire incidents.

Dwelling, 22828Outdoor Structure,
19768
Outdoor, 17857
Non Residential,
7994
Road Vehicle, 7422 Other Residential,
1590Rail Vehicle, 53
Boat, 45Aircraft, 15
Other, 113
Total Fires incidents by property categories (Jan 2012-Aug 2015)
9
Fire Incident – Property Category
Commentary There are 9 property categories reported. Dwelling is the highest Fire risk property category (c29% of total fires) during Jan 2012-Aug 2015. Outdoor structure and Outdoor also displayed high fire risks, contributing to 25% and 23% of total Fire incidents
respectively. A smaller number of fires came from transportations (10% for Road Vehicle, Rail Vehicle, Boat and Aircraft together)

Top 3 areas with most/least Fires by property category (Jan 2012-Aug 2015)Property category Dwelling Outdoor
StructureOutdoor Non Residential Road Vehicle Other Residential
Total Fires 22828 19768 17857 7994 7422 1590
Top 3 areas with most Fires
SOUTHWARK TOWER HAMLETS
BROMLEY WESTMINSTER HILLINGDON CAMDENLAMBETH WESTMINSTER HILLINGDON CAMDEN CROYDON WESTMINSTERHACKNEY SOUTHWARK CROYDON HILLINGDON BROMLEY LAMBETH
% of category Fires 14.7% 22.4% 15.9% 17.9% 16.5% 23.1%% of total Fires 4.3% 5.7% 3.7% 1.8% 1.6% 0.5%
Top 3 areas with least Fires
KINGSTON UPON THAMES
RICHMOND UPON THAMES
KENSINGTON AND CHELSEA
KINGSTON UPON THAMES
KENSINGTON AND CHELSEA
CITY OF LONDON
NOT GEO-CODED
CITY OF LONDON
NOT GEO-CODED
RICHMOND UPON THAMES
RICHMOND UPON THAMES
BARKING AND DAGENHAM
CITY OF LONDON
NOT GEO-CODED
CITY OF LONDON
NOT GEO-CODED
CITY OF LONDON NOT GEO-CODED
% of category Fires 2.0% 1.6% 1.3% 4.1% 2.5% 1.4%% of total Fires 0.6% 0.4% 0.3% 0.4% 0.2% 0.0%
10
Fire Incident – Area and Property Category
CommentaryThis table shows the 3 highest and lowest Fire risk areas by different property categories.The top 3 areas contribute to c15-20% of Fires in each property category.Lambeth, Westminter, Camden, Croydon and Bromley have occurred in more than one property categories for ‘top 3 most Fires’.

0200400600800
100012001400
2012-0
1201
2-02
2012-0
3201
2-04
2012-0
5201
2-06
2012-0
7201
2-08
2012-0
9201
2-10
2012-1
1201
2-12
2013-0
1201
3-02
2013-0
3201
3-04
2013-0
5201
3-06
2013-0
7201
3-08
2013-0
9201
3-10
2013-1
1201
3-12
2014-0
1201
4-02
2014-0
3201
4-04
2014-0
5201
4-06
2014-0
7201
4-08
2014-0
9201
4-10
2014-1
1201
4-12
2015-0
1201
5-02
2015-0
3201
5-04
2015-0
5201
5-06
2015-0
7201
5-08
Numb
er of
Fires
incide
nts
Trend of Fires incidents by property category (Jan 2012-Aug 2015)Dwelling Outdoor Structure Outdoor Non Residential Road Vehicle Other Residential
Commentary The number of Fire incidents over time seems to have stayed fairly constant for all major property categories. Outdoor and Outdoor Structure displayed quite obvious seasonality. In particular, more Fires are reported in summer
(around July) and fewer in winter (around December), as expected. Other categories did not show seasonality, this seems reasonable since indoor activities are less impacted by weather.11
Fire Incident – Trend by Property Category

Top Property Types by Total Fires (Jan 2012-Aug 2015)Property Type Number of Fires % Over Total Fires Cumulative %Small refuse/rubbish container 9969 13% 13%House - single occupancy 7585 10% 23%Loose refuse 5690 7% 30%Purpose Built Flats/Maisonettes - Up to 3 storeys 4667 6% 36%Car 4554 6% 42%Purpose Built Flats/Maisonettes - 4 to 9 storeys 4287 6% 47%Large refuse/rubbish container (eg skip, paladin) 3475 4% 52%Domestic garden (vegetation not equipment) 2905 4% 56%Tree scrub 2277 3% 59%Converted Flat/Maisonette - Up to 2 storeys 1610 2% 61%Converted Flat/Maisonettes - 3 or more storeys 1492 2% 63%Common external bin storage area 1249 2% 64%Self contained Sheltered Housing 1244 2% 66%Wheelie bin (domestic size) 1187 2% 67%Motorcycle 1164 2% 69%Hedge 1139 1% 70%Purpose Built Flats/Maisonettes - 10 or more storeys 1062 1% 72%Commentary There are 286 property types reported, some types are related. The top 4 broader types contribute to c60% of all Fires. Seasonality of these types are investigated further (next slide). Refuse related issues have the highest Fire incidents over Jan 2012-Aug 2015 (c26% of total fires). Purpose Build and Converted Flats/Maisonettes have the second highest Fire incidents (c16% adding all storeys). This is followed by single occupancy house (c10%) and car (6%).
12
Fire Incident – Property Type
13
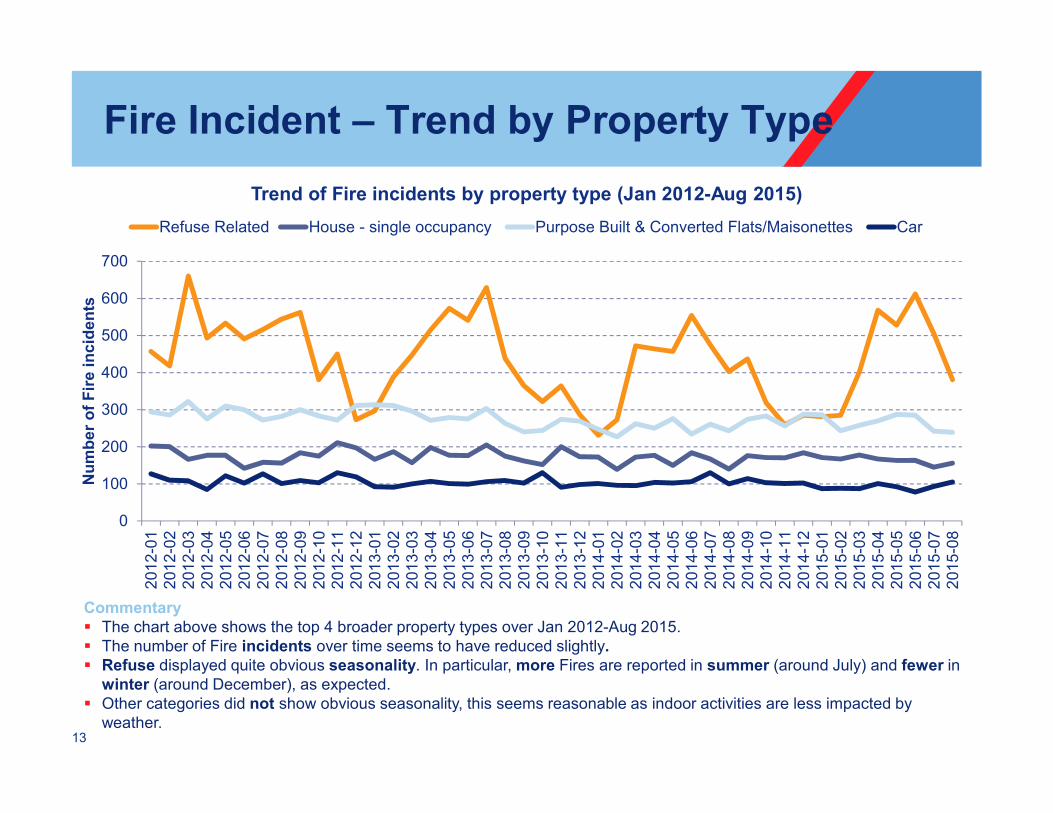
Fire Incident – Trend by Property Type
Commentary The chart above shows the top 4 broader property types over Jan 2012-Aug 2015. The number of Fire incidents over time seems to have reduced slightly. Refuse displayed quite obvious seasonality. In particular, more Fires are reported in summer (around July) and fewer in
winter (around December), as expected. Other categories did not show obvious seasonality, this seems reasonable as indoor activities are less impacted by
weather.
0100200300400500600700
2012-0
1201
2-02
2012-0
3201
2-04
2012-0
5201
2-06
2012-0
7201
2-08
2012-0
9201
2-10
2012-1
1201
2-12
2013-0
1201
3-02
2013-0
3201
3-04
2013-0
5201
3-06
2013-0
7201
3-08
2013-0
9201
3-10
2013-1
1201
3-12
2014-0
1201
4-02
2014-0
3201
4-04
2014-0
5201
4-06
2014-0
7201
4-08
2014-0
9201
4-10
2014-1
1201
4-12
2015-0
1201
5-02
2015-0
3201
5-04
2015-0
5201
5-06
2015-0
7201
5-08
Numb
er of
Fire in
ciden
ts
Trend of Fire incidents by property type (Jan 2012-Aug 2015)Refuse Related House - single occupancy Purpose Built & Converted Flats/Maisonettes Car

AreaAvg Arrival Time
(minute) AreaAvg Arrival Time
(minute) AreaAvg Arrival Time
(minute)HAVERING 30 LAMBETH 30 WESTMINSTER 29 HARROW 30 BEXLEY 30 REDBRIDGE 29 WANDSWORTH 30 KENSINGTON AND
CHELSEA30 HOUNSLOW 29
GREENWICH 30 CAMDEN 30 BARKING AND DAGENHAM
29 HILLINGDON 30 KINGSTON UPON
THAMES30 TOWER HAMLETS 29
EALING 30 ISLINGTON 30 HARINGEY 29 HAMMERSMITH AND FULHAM
30 WALTHAM FOREST 30 CITY OF LONDON 29 LEWISHAM 30 SUTTON 30 MERTON 29 SOUTHWARK 30 NEWHAM 29 BRENT 29 BARNET 30 BROMLEY 29 NOT GEO-CODED 28 RICHMOND UPON THAMES
30 ENFIELD 29 CROYDON 30 HACKNEY 29
14
Fire Severity – Arrival Time
Commentary Arrival time extracted from the Fire Mobilisation dataset shows the duration from the incident being reported to the fire
brigade arriving at the fire site. Shorter arrival time indicates swift fire brigade response in an area and possible lower fire severity as a result (since fires
are controlled earlier on). The average arrival time is 30 minutes after call. The differences (up to 2 minutes) in average time of arrival of different areas do not seem significant.

AreaAvg Stay Time
(minute) AreaAvg Stay Time
(minute) AreaAvg Stay Time
(minute) WALTHAM FOREST 24 GREENWICH 21 NOT GEO-CODED 20 BARKING AND DAGENHAM
24 CROYDON 21 ISLINGTON 19 WANDSWORTH 23 HARINGEY 21 KENSINGTON AND
CHELSEA19
NEWHAM 22 LAMBETH 21 HARROW 19 REDBRIDGE 22 SUTTON 21 RICHMOND UPON
THAMES19
HOUNSLOW 22 TOWER HAMLETS 21 CITY OF LONDON 19 BRENT 22 LEWISHAM 21 KINGSTON UPON
THAMES19
ENFIELD 22 BARNET 21 HAMMERSMITH AND FULHAM
18 HILLINGDON 22 SOUTHWARK 20 WESTMINSTER 17 BEXLEY 22 HACKNEY 20 CAMDEN 17 HAVERING 22 MERTON 20 BROMLEY 21 EALING 20 CommentaryStay time calculated from the Fire Mobilisation dataset shows how long the fire brigade stayed at the site to put out the fire (time spent by vehicles sent to put out the same fire are added together). Longer stay time indicates that the fire is more severe (requires more time and vehicles to put out). The average stay time is 20 minutes (range 17-24 minutes). The difference in stay time seems relatively significant (xx% longest vs. shortest) and can be used to estimate fire severity.Waltham Forest and Barking had more severe fires. Note that the data includes the big ‘Olympic’ fire in Aug 2012 in these areas, where LFB mobilised more than 200 firefighters with cumulative stay time of more than 5,000 minutes.Westminster and Camden seem to have smaller fires.15
Fire Severity – Stay Time

THANK YOU FOR YOUR ATTENTION.
16