Embed Size (px)
Citation preview

Chapter 6
Student Work and Teacher Practices in Mathematics 145
Data Analysis, Statistics,and Probability
Content Strand Description
Questions in this content strand assessed students’ skills in collecting, organizing, reading,representing, and interpreting data. Also assessed were students’ understanding of the basicelements of sampling, data analysis, and probability as well as their competence in calculatingsimple statistics and probabilities. Many questions required a constructed response and askedstudents to do a variety of tasks, such as completing or discussing charts and graphs ordescribing the best ways to collect or display data.
Students at grade 4 were expected to be familiar with a variety of types of graphs(typically pictorial), make predictions from data and explain their reasoning, and use the basicconcept of chance. At grade 8, students were expected to analyze statistical claims and designexperiments, demonstrate some understanding of sampling, and be able to make predictionsbased on complex data. Students at grade 12 were expected to use a wide variety of statisticaltechniques to model situations and solve problems. They also were expected to understand andapply concepts of probability to dependent and independent events and to have someknowledge of conditional probability.
Examples of Individual Questions andStudent Performance
A number of the Data Analysis, Statistics, and Probability questions from the NAEP 1996mathematics assessment are shown in this chapter. Presentation of the questions is organizedaround three areas of emphasis. Tables, graphs, and charts includes questions that assessedstudents’ abilities to interpret and display data; sampling and statistics includes questions thatassessed students’ knowledge and skills in these areas; and probability includes questions thatassessed students’ understanding of and ability to calculate the probability of simple andrelated events.

146 Student Work and Teacher Practices in Mathematics
All sample questions from this content strand are mapped onto the NAEP mathematicsscale as shown in Figure 6.1. Specific instructions on how to interpret this map are given at theend of Chapter 2. The map is included to provide an indication of the relative difficulty of eachexample question and, thus, to indicate the type of material mastered within this content strandby students with varying degrees of mathematics proficiency. As noted in previous chapters,however, the difficulty of any question is a function of the relationship between characteristicsspecific to the question (e.g., format, absence or presence of graphics, real-world application),the specific mathematics content associated with the question, and students’ opportunities tolearn this content. It should be remembered also that overall performance on the Data Analysis,Statistics, and Probability content strand is not determined solely by performance on theexamples presented here. These examples illustrate only some of what students know andcan do.

Student Work and Teacher Practices in Mathematics 147
Map of Selected Data Analysis, Statistics, andProbability Questions on the NAEP Composite
Mathematics Scale (Item Map)
Grade 12
Average:
Grade 8
Average:
Grade 4
Average:
NOTE: Each mathematics question was mapped onto the NAEP 0 to 500 mathematics scale. The position of the question on thescale represents the scale score obtained by students who had a 65 percent probability of successfully answering the question.(The probability was 74 percent for a 4-option multiple-choice question and 72 percent for a 5-option multiple-choice question.)Only selected questions are presented. The number 4, 8, or 12 in parentheses is the grade level at which the question was asked.SOURCE: National Center for Education Statistics, National Assessment of Educational Progress (NAEP) 1996Mathematics Assessment.
NOTE: Position of questions is approximate.
NAEP Scale
Figure 6.1
(12) Use Data in Table to Compute Average Hourly Wageand Determine When Wage Rate Changes (420)
(8) Recognize Misleading Graph (475)
(8) Reason About Sample Space (235)
(8) Use Data from a Chart (286)
(12) Use Data from a Chart (295)
(246) Read a Bar Graph (4)
(463) Compare Mean and Median (12)
(411) Compare Probabilities (12)
(289) Identify Representative Sample (8)
(278) Determine a Probability (4)
(265) Use Data from a Chart (4)

148 Student Work and Teacher Practices in Mathematics
Tables, graphs, and chartsThese questions assessed students’ abilities to interpret and display data in tables, graphs, andcharts. At all grade levels, students had to read and interpret data, make predictions, computewith data, and interpolate and extrapolate. They also had to translate data into tables andgraphs. Questions for fourth-grade students often used pictographs, with symbols representingsingle or multiple units. Fourth-grade students also were evaluated on their ability to interpretsimple pie charts. Questions for older students included stem-and-leaf and box-and-whiskerplots. Graphs and charts often involved percents, and graphs often compared units on twodimensions. Students in eighth and twelfth grade were asked to make decisions about the bestrepresentation of data for certain situations or to compare data in two different tables, graphs,or charts.
Four examples of questions are presented here — one at each grade level and one thatappeared at all three grade levels. The first example is a multiple-choice question thatappeared on the assessment for fourth-grade students. The question presented students with abar graph representing class votes on favorite types of music. Results for three types of musicand a residual “other” category were displayed separately for boys and girls. A legend indicatedthat the square symbol used in the graph represented one student. Students were to determinethe type of music preferred by most of the students in the class. In order to respond correctly,students had to add the number of votes for boys and girls together within categories andcompare the totals.
The correct option is B.

Student Work and Teacher Practices in Mathematics 149
This question was not very difficult for fourth-grade students. It mapped at a score of246 on the NAEP composite mathematics scale. Student performance data are presented inTables 6.1 and 6.2. Nearly 60 percent of the students responded correctly to the question.Another 36 percent of the students chose Option C (country music) as the appropriate response.These students may not have understood that they had to sum the data for girls and boys andmay have simply chosen the category with the longest bar. Table 6.2 shows that approximatelytwo-thirds of the students at the Basic achievement level and more than 80 percent of those atthe Proficient level responded correctly to the question.
Percentage Correct for “Read a Bar Graph”
Percentage Correct
*** Sample size is insufficient to permit a reliable estimate.SOURCE: National Center for Education Statistics, National Assessment of Educational Progress (NAEP) 1996Mathematics Assessment.
Overall 59
Males 61Females 57
White 67Black 33
Hispanic 45Asian/Pacific Islander ***
American Indian ***
Table 6.1
Grade 4
Overall Below Basic Basic Proficient Advanced
59 38 66 82 ***
Percentage Correct Within Achievement-LevelIntervals for “Read a Bar Graph”
NAEP Grade 4 Composite Scale Range
*** Sample size is insufficient to permit a reliable estimate.SOURCE: National Center for Education Statistics, National Assessment of Educational Progress (NAEP) 1996Mathematics Assessment.
Table 6.2

150 Student Work and Teacher Practices in Mathematics
The second example for this area was a question that appeared on the assessment for allthree grade levels. It is a short constructed-response question for which students had tointerpret data from a table and then explain their interpretation. The data in this question againrepresented votes, this time regarding shapes that were being considered for a class symbol.(The question fell within a block for which students were supplied with cardboard shapes ormanipulatives. The designations N, P, and Q that are used in the question refer to theseshapes.) Based on the preference data from three classes, students were to determine whichshape should be selected for the symbol and tell why. The correct response was shape Nbecause it received more total votes than the other two shapes; students also could have statedthat it was the first choice in one class and the second choice in the others.

Student Work and Teacher Practices in Mathematics 151
A sample “correct” response follows. In this response, the student chose shape N,supporting this choice by adding up the total number of votes for each shape and showing thatshape N received the most votes overall.
Sample “correct” response
These next two samples are “incorrect” responses. In the first, the student correctlychose shape N but provided an incorrect explanation. It is followed by a sample response from astudent who chose shape Q.
Sample “incorrect” response 1

152 Student Work and Teacher Practices in Mathematics
Sample “incorrect” response 2
This question was somewhat difficult for students in grade 4 but easier for students ingrades 8 and 12. The performance results are displayed in Tables 6.3 and 6.4. Table 6.3 showsthe percentage of students at each grade who 1) chose shape N and had a correct explanation,2) who chose shape N but had no or an incorrect explanation, 3) who chose shape Q, and 4) whomade some other incorrect response.1 Only the responses of students who chose shape N andhad a correct explanation were rated “correct.”
Approximately one-third of the fourth-grade students, one-half of the eighth-gradestudents, and two-thirds of the twelfth-grade students chose shape N for the symbol and hadcorrect explanations. At each of the three grades, the percentage of students who chose shape Nbut had no or incorrect explanations was between 12 and 17 percent. Perhaps the mostinteresting difference was in the percent of students who chose shape Q. Thirty-two percent ofthe fourth-grade students (equivalent to the percentage who answered correctly) chose shape Q.At grade 8, this percentage dropped by half, and at grade 12, only nine percent of the studentschose shape Q. At the earlier grades, students may be more inclined than at later grades simplyto base their response on the largest single number in the table rather than to sum the dataacross classes. Another possible explanation is that, at the fourth-grade level, students simplyanswered their favorite shape.
1 Student responses for this and all other constructed-response questions also could have been scored as “off task,” whichmeans that the student provided a response, but it was deemed not related in content to the question asked. There aremany examples of these types of responses, but a simple one would be “I don’t like this test.” Responses of this sortcould not be rated. In contrast, responses scored as “incorrect” were valid attempts to answer the question that weresimply wrong.

Student Work and Teacher Practices in Mathematics 153
Overall 67 17 9 6 1
Males 66 20 7 6 2Females 67 16 10 6 1
White 70 18 7 4 1Black 58 15 16 8 2
Hispanic 55 21 9 12 4Asian/Pacific Islander 67 14 10 7 2
American Indian *** *** *** *** ***
Geometry Taken 68 18 8 5 1
Highest Algebra-CalculusCourse Taken:
Pre-Algebra 65 10 11 9 3First-Year Algebra 61 20 10 6 2
Second-Year Algebra 69 18 8 5 0Third-Year Algebra/Pre-Calculus 71 17 6 5 1
Calculus 75 10 10 4 0
Score Percentages for “Use Data from a Chart”
Correct Incorrect OmitShape N–No,
Shape N–Correct or Incorrect,Explanation Explanation Shape Q Other
NOTE: Row percentages may not total 100 due to rounding. Responses that could not be rated were excluded.*** Sample size is insufficient to permit a reliable estimate.– – Data for grade 8 Asian/Pacific Islanders are not reported due to concerns about the accuracy and precision of thenational estimates. See Appendix A for further detail.! Statistical tests involving this value should be interpreted with caution. Standard error estimates may not be accuratelydetermined and/or the sampling distribution of the statistics does not match statistical test assumptions (see Appendix A).SOURCE: National Center for Education Statistics, National Assessment of Educational Progress (NAEP) 1996Mathematics Assessment.
Table 6.3
Grade 8
Grade 12
Overall 32 12 32 21 3
Males 31 12 30 23 3Females 33 12 33 18 3
White 38 12 32 14 3Black 13 11 34 39 3
Hispanic 16 13 25 39 6Asian/Pacific Islander 33 18 31 16 2!
American Indian *** *** *** *** ***
Overall 58 15 16 10 0
Males 57 16 16 11 0Females 60 14 16 10 0!
White 64 15 13 7 0!Black 38 20 21 20 2
Hispanic 52 9 20 19 0!Asian/Pacific Islander – – – – – – – – – –
American Indian *** *** *** *** ***
Mathematics Course Taking:Eighth-Grade Mathematics 56 16 19 10 0
Pre-Algebra 57 14 17 11 0Algebra 67 15 9 10 0
Grade 4

154 Student Work and Teacher Practices in Mathematics
Table 6.4 shows, for each grade, the percentage of students within each of the NAEPachievement levels who responded correctly to the question. At grade 4, only students who wereat least at the Proficient level had a greater than 50 percent chance of answering correctly. Atgrade 8, more than two-thirds of students at the Basic level provided “correct” responses, and atgrade 12, even students below the Basic level had a 50 percent chance of correct response. Thequestion mapped at a score of 265 on the NAEP composite mathematics scale for grade 4students. At grade 8, the question mapped at 286, and at grade 12, the question mapped at 295.
The third sample for this area is an extended constructed-response question foreighth-grade students. Students were presented with two graphs displaying the number of ridersfor the Metro Rail Company over a 6-month period. The difference between the graphs was thatone displayed the scale for the number of riders in increments of 2,000 while the otherdisplayed the scale in increments of 100. The question itself had two components, althoughthese were scored together to provide a single rating for the question. First, students wereinstructed to choose, and justify their choice for, the graph that would best convince others thatthe Metro Rail Company made a lot more money from ticket sales in March than in October.Second, students were asked to explain why some people might consider the graph they choseto be misleading.
Overall Below Basic Basic Proficient Advanced
Grade 4 32 8 32 61 ***Grade 8 58 38 68 77 ***
Grade 12 67 51 73 77 ***
Percentage Correct Within Achievement-LevelIntervals for “Use Data from a Chart”
*** Sample size is insufficient to permit a reliable estimate.SOURCE: National Center for Education Statistics, National Assessment of Educational Progress (NAEP) 1996Mathematics Assessment.
NAEP Grades 4, 8, and 12 Composite Scale Ranges
Table 6.4

Student Work and Teacher Practices in Mathematics 155
156 Student Work and Teacher Practices in Mathematics
The correct answer for the first part of the question was Graph B because itappeared to show a large increase from October to March. Acceptable variations on thisexplanation included:
● The line in Graph B goes up more, has a more dramatic rise, or climbs higher.
● Graph B climbs faster.
● Graph B is steeper.
● Graph B shows a larger visual increase.
For the second part of the question, students were expected to recognize that Graph Bmight be considered misleading because it exaggerated a relatively small increase in ridership(misuse of scale). Acceptable variations of this reason included:
● Graph B has a smaller scale.
● Graph A has a larger scale.
● The numbers on B are smaller than those on A (they increase by 100s not 1,000s).
The use of the term “range” instead of “scale” was not considered acceptable.

Student Work and Teacher Practices in Mathematics 157
Student responses were considered “correct” if they identified B as the best graph andhad a complete explanation for both parts of the question. An example of a “correct” responsefollows. In this example, the student used the term “range” in both answers, which would not,in itself, be considered “correct”; however, the student also said that Graph B should be chosenbecause it climbs faster and is misleading because it only has 100 at a time. Both of thesestatements were considered “correct” responses.
Sample “correct” response
158 Student Work and Teacher Practices in Mathematics
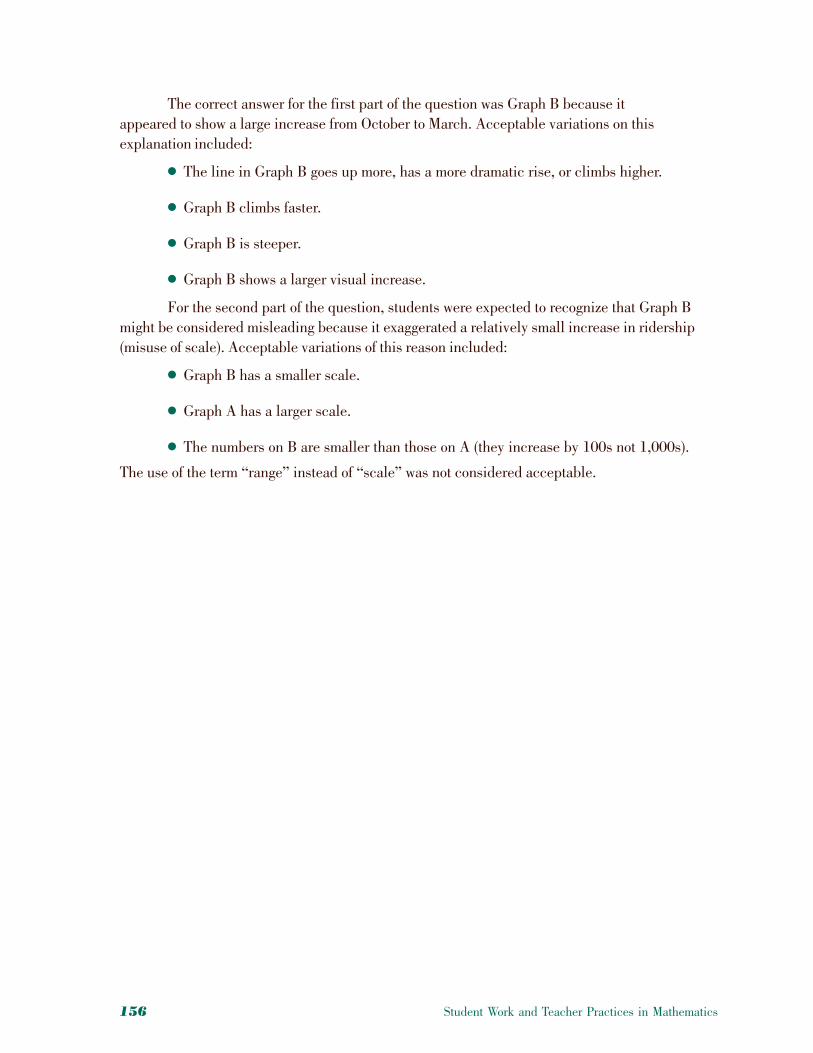
Student responses were rated as “partial” if they chose Graph B and had an incomplete,but partially correct, explanation for one or both parts of the question. For example, in thefollowing sample response the student gave a complete explanation of why B should be chosen,but an incomplete explanation of why Graph B could be considered misleading. When thequestion was anchored to the NAEP scale, the “correct” and “partial” rating categorieswere collapsed.
Sample “partial” response

Student Work and Teacher Practices in Mathematics 159
Students also could have had responses that identified Graph B as the best graph butoffered no explanations or only incorrect explanations. Answers of this type, which areillustrated in the following example, were rated as “minimal.”
Sample “minimal” response

160 Student Work and Teacher Practices in Mathematics
Student responses, such as the following, that did not identify B as the best graph wererated “incorrect.”
Sample “incorrect” response
Table 6.5 shows that only 2 percent of the students chose Graph B and gave completeexplanations, while 19 percent chose Graph B and gave incomplete, but partially correct,explanations for at least one part of the question. However, 35 percent of the eighth-gradestudents who were taking algebra were able to provide at least partially correct explanations forchoosing Graph B. This was a higher percentage than was obtained for students enrolled inpre-algebra or eighth-grade mathematics. Overall, 30 percent of the students did not evenattempt the question.

Student Work and Teacher Practices in Mathematics 161
Table 6.6 shows that 35 percent of the eighth-grade students who were classified asProficient on the NAEP composite mathematics scale, 22 percent of the students classified asBasic, and only 7 percent of the students classified as performing below Basic chose Graph Band responded with at least partially correct explanations to the two parts of the question. Thequestion mapped at a score of 475.
Overall 2 19 34 14 30
Males 2 19 32 15 31Females 2 18 36 14 30
White 2 23 34 11 28Black 2! 6 38 21 33
Hispanic 0! 7 24 25 43Asian/Pacific Islander – – – – – – – – – –
American Indian *** *** *** *** ***
Mathematics Course Taking:Eighth-Grade Mathematics 1 16 32 19 32
Pre-Algebra 3 13 38 15 30Algebra 3 32 31 6 28
Correct Partial Minimal Incorrect OmitGraph B– Graph B–Incomplete Graph B–Complete but Partially No or Incorrect
Explanation Correct Explanation Explanation
Score Percentages for“Recognize Misleading Graph”
NOTE: Row percentages may not total to 100 due to rounding. Responses that could not be rated were excluded.*** Sample size is insufficient to permit a reliable estimate.– – Data for grade 8 Asian/Pacific Islanders are not reported due to concerns about the accuracy and precision of thenational estimates. See Appendix A for further detail.! Statistical tests involving this value should be interpreted with caution. Standard error estimates may not be accuratelydetermined and/or the sampling distribution of the statistics does not match statistical test assumptions (see Appendix A).SOURCE: National Center for Education Statistics, National Assessment of Educational Progress (NAEP) 1996Mathematics Assessment.
Table 6.5
Grade 8
Overall Below Basic Basic Proficient Advanced
20 7 22 35 ***
Percentage at Least Partial WithinAchievement-Level Intervals for“Recognize Misleading Graph”
NAEP Grade 8 Composite Scale Range
*** Sample size is insufficient to permit a reliable estimate.SOURCE: National Center for Education Statistics, National Assessment of Educational Progress (NAEP) 1996Mathematics Assessment.
Table 6.6

162 Student Work and Teacher Practices in Mathematics
The final example for this area is a short constructed-response question that was used atgrade 12. The question presented a table summarizing time of day and number of hours worked,average hourly wage, and daily earnings for an individual on each of 5 days. For the fourth day,the cells for average hourly wage and total earnings were left blank. As in the previous example,this question had two parts that were considered together in determining the student’s score. Inthe first part, students were given the total earnings for all 5 days and asked to use thisinformation, in conjunction with the table, to determine the average hourly wage for day 4. Torespond correctly, students had to add the daily earnings for the 4 days presented ($119.00),subtract this from the total earnings of $153.50, and divide by the total number of hours workedon the fourth day. This yielded the correct answer of $5.75. For the second part of the question,students were to use the information on time of day and number of hours worked, along with theaverage hourly rate, to determine the time of day at which the hourly rate changed. The correctanswer was 5:00 p.m.

Student Work and Teacher Practices in Mathematics 163
Student responses were rated “correct,” “partial,” or “incorrect.” “Correct” responsesidentified both the correct hourly wage and the correct time of the rate change. “Partial”responses identified either the correct average hourly wage or the correct time of the ratechange, and “incorrect” responses did not correctly identify either. Following are three sampleresponses. The first two responses were rated “partial”; each student correctly computed theaverage hourly wage for the fourth day, but in the second part of the question the firstrespondent entered the total daily earnings for day 4 instead of the time of the rate change, andthe second respondent entered 2:00 (the time the individual started work on day 4).
Sample “partial” response 1
Sample “partial” response 2

164 Student Work and Teacher Practices in Mathematics
The third sample response was rated “incorrect.” This student entered the total dailyearnings for the fourth day as a response to the first question and identified 3:00 p.m. as thetime of the rate change.
Sample “incorrect” response
Performance data are presented in Tables 6.7 and 6.8. Thirteen percent of studentsanswered both parts of the question correctly, whereas 43 percent responded correctly to one ofthe two parts. Students who had taken calculus were more likely to respond correctly thanstudents who had not taken calculus, and students who had taken at least third-year algebra orpre-calculus were more likely than those who had taken less mathematics to provide at least apartially correct response.

Student Work and Teacher Practices in Mathematics 165
The question mapped at a score of 420. Twenty-three percent of the studentsclassified as Proficient and 14 percent of those classified as Basic were credited with a fullycorrect response.
NOTE: Row percentages may not total 100 due to rounding. Responses that could not be rated were excluded.*** Sample size is insufficient to permit a reliable estimate.SOURCE: National Center for Education Statistics, National Assessment of Educational Progress (NAEP) 1996Mathematics Assessment.
Score Percentages for “Use Data in Table toCompute Average Hourly Wage and Determine
When Wage Rate Changes”
Correct Partial Incorrect Omit
Overall 13 43 40 3
Males 13 43 40 3Females 13 43 40 3
White 16 46 36 2Black 4 38 51 7
Hispanic 11 36 46 7Asian/Pacific Islander 15 44 37 4
American Indian *** *** *** ***
Geometry Taken 14 46 36 3
Highest Algebra-CalculusCourse Taken:
Pre-Algebra *** *** *** ***First-Year Algebra 8 36 51 4
Second-Year Algebra 15 45 37 3Third-Year
Algebra/Pre-Calculus 14 53 31 2Calculus 25 59 14 2
Table 6.7
Grade 12
Overall Below Basic Basic Proficient Advanced
13 4 14 23 ***
Percentage Correct Within Achievement-LevelIntervals for “Use Data in Table to Compute
Average Hourly Wage and Determine When WageRate Changes”
NAEP Grade 12 Composite Scale Range
*** Sample size is insufficient to permit a reliable estimate.SOURCE: National Center for Education Statistics, National Assessment of Educational Progress (NAEP) 1996Mathematics Assessment.
Table 6.8

166 Student Work and Teacher Practices in Mathematics
Sampling and statisticsQuestions in this area, which appeared primarily on the instruments for eighth- andtwelfth-grade students, assessed students’ understanding of and ability to apply sampling theoryand statistical analyses. Students were asked questions regarding sampling, datarepresentation, and data summarization. They were evaluated on their understanding of thevarious measures of central tendency as well as on their ability to calculate these measures.Students also needed to understand concepts related to correlation. Three questions arepresented here. Two were eighth-grade multiple-choice questions, and one was a twelfth-gradeextended constructed-response question.
The first eighth-grade question assessed students’ understanding of what can happenwhen a sample is taken. Students were told that a bag contained two red candies and one yellowcandy and that each of two persons took one candy out of the bag, without replacement. Thequestion then listed four combinations of candy colors and asked which combinations couldhave been drawn by these two people, given the candies in the bag. Only the fourthcombination, both picking yellow candies, was not possible.
Table 6.9 presents the percentages of students responding correctly to none, one, two,three, or all four of the statements of sampling possibilities. Nearly 80 percent respondedcorrectly to all four statements, and another 10 percent responded correctly to at least three ofthe statements. More females than males responded correctly to all four questions. When thequestion was anchored to the NAEP scale, the categories of none, one, or two correct responsesto statements were collapsed.

Student Work and Teacher Practices in Mathematics 167
NOTE: Row percentages may not total 100 due to rounding. Responses that could not be rated were excluded.*** Sample size is insufficient to permit a reliable estimate.– – Data for grade 8 Asian/Pacific Islanders are not reported due to concerns about the accuracy and precision of thenational estimates. See Appendix A for further detail.! Statistical tests involving this value should be interpreted with caution. Standard error estimates may not be accuratelydetermined and/or the sampling distribution of the statistics does not match statistical test assumptions (see Appendix A).SOURCE: National Center for Education Statistics, National Assessment of Educational Progress (NAEP) 1996Mathematics Assessment.
Score Percentages for“Reason About Sample Space”
Overall 79 10 3 6 1 0
Males 75 11 4 8 2 0Females 85 9 2 4 1 0
White 86 8 2 2 0 0!Black 61 14 7 14 4 0!
Hispanic 65 13 3 16 3 0!Asian/Pacific Islander – – – – – – – – – – – –
American Indian *** *** *** *** *** ***
Mathematics Course Taking:Eighth-Grade Mathematics 76 12 5 6 1 1
Pre-Algebra 82 11 2 5 1 0Algebra 86 7 1 4 2 0
Table 6.9
Grade 8
Number Correct
4 3 2 1 None Omit
This question was very easy for eighth-grade students. Table 6.10 shows that at leastthree-quarters of the students who performed below the Basic level on the NAEP mathematicsassessment gave the correct response to at least three statements, as did nearly all of thestudents in the other achievement level categories. The question mapped at a score of 235.
! Statistical tests involving this value should be interpreted with caution. Standard error estimates may not be accuratelydetermined and/or the sampling distribution of the statistics does not match statistical test assumptions (see Appendix A).SOURCE: National Center for Education Statistics, National Assessment of Educational Progress (NAEP) 1996Mathematics Assessment.
Overall Below Basic Basic Proficient Advanced
89 75 97 99! 100!
Percentage with at Least Three Correct WithinAchievement-Level Intervals for“Reason About Sample Space”
NAEP Grade 8 Composite Scale Range
Table 6.10

168 Student Work and Teacher Practices in Mathematics
The second example for this area is also an eighth-grade multiple-choice question. Thisquestion assessed students’ understanding of what constitutes a representative sample.Students were told that a poll was being taken at a junior high school to determine the schoolmascot and were asked where they could find a sample of students to interview that was mostrepresentative of the students in the school.
The correct option is B.
This question also was fairly easy for eighth-grade students. Table 6.11 shows that65 percent of the students answered correctly. One percent of the students chose Option D, theFrench class, while approximately 10 percent of the students chose each of the remaining threeoptions. The question mapped at a score of 289, and most of the students whose performancewas classified as Basic or above chose the correct option.

Student Work and Teacher Practices in Mathematics 169
Overall 65
Males 64Females 66
White 73Black 48
Hispanic 47Asian/Pacific Islander – –
American Indian ***
Mathematics Course Taking:Eighth-Grade Mathematics 59
Pre-Algebra 67Algebra 74
Percentage Correct for“Identify Representative Sample”
Percentage Correct
*** Sample size is insufficient to permit a reliable estimate.– – Data for grade 8 Asian/Pacific Islanders are not reported due to concerns about the accuracy and precision of thenational estimates. See Appendix A for further detail.SOURCE: National Center for Education Statistics, National Assessment of Educational Progress (NAEP) 1996Mathematics Assessment.
Table 6.11
Grade 8
Overall Below Basic Basic Proficient Advanced
65 43 72 87 96!
Percentage Correct Within Achievement-LevelIntervals for “Identify Representative Sample”
NAEP Grade 8 Composite Scale Range
! Statistical tests involving this value should be interpreted with caution. Standard error estimates may not be accuratelydetermined and/or the sampling distribution of the statistics does not match statistical test assumptions (see Appendix A).SOURCE: National Center for Education Statistics, National Assessment of Educational Progress (NAEP) 1996Mathematics Assessment.
Table 6.12

170 Student Work and Teacher Practices in Mathematics
The final example for this area is an extended constructed-response question for grade 12in which students were asked to determine whether the mean or median better represented thetypical daily attendance in each of two theaters and to justify their answers. They were providedwith data on each theater’s daily attendance over a 5-day period, along with the median and themean of the 5 days. Theater A had a nontypical, or outlier, value for attendance on day 4. Theattendance for Theater B was bimodal.

Student Work and Teacher Practices in Mathematics 171
The correct answer for Theater A was the median, and the correct answer for Theater Bwas the mean. The appropriate explanation for the choice of the median for Theater A conveyedthe idea that the attendance on day 4 was significantly different from attendance on the otherdays. Appropriate explanations for the choice of the mean for Theater B were variations on thefollowing:
● There are two clusters of data;
● The median is representative of one of the clusters, while the mean is representative ofboth; and
● 82 is a better indicator of where the “center” of the five data points is located.
Responses were rated as “extended,” “satisfactory,” “partial,” “minimal,” and“incorrect.” However, when the question was anchored to the NAEP scale, the “extended” and“satisfactory” rating categories were collapsed. A description of the ratings and sampleresponses for each rating category follow.
In order to have been rated as “extended,” a student’s response had to identify theappropriate measure for each theater and provide a correct explanation for at least one of thechoices. The following is a sample of an “extended” response. After correctly identifying eachstatistic, the student explained that the median is better for Theater A because the mean ispulled down by 1 day, and that the mean is better for Theater B because it is closer tothe middle.
Sample “extended” response

172 Student Work and Teacher Practices in Mathematics
Students’ responses also could be rated as “partial” or “minimal.” “Partial” responseseither correctly identified the better measure for both theaters but did not provide appropriateexplanations for either, or correctly identified and explained only one measure. Two examples of“partial” responses follow.
In the following sample, rated as “satisfactory,” the student indicated the better measurefor both theaters, but only provided a complete explanation for Theater A.
Sample “satisfactory” response

Student Work and Teacher Practices in Mathematics 173
Sample “partial” response 2
Sample “partial” response 1

174 Student Work and Teacher Practices in Mathematics
The next two sample responses were rated as “minimal.” Both students correctlyidentified the better measure for only one of the theaters (the first for Theater A and the secondfor Theater B); however, neither had an appropriate explanation. The first student came closewith the explanation of the median for Theater A, but failed to complete the thought that theattendance for day 4 was an outlier compared to the other 4 days.
Sample “minimal” response 1

Student Work and Teacher Practices in Mathematics 175
Sample “minimal” response 2
All other responses were considered “incorrect.” The final example is of an “incorrect” response.
Sample “incorrect” response

176 Student Work and Teacher Practices in Mathematics
Tables 6.13 and 6.14 present student performance data for this question. The questionwas fairly difficult, and only four percent of the students chose the better measure for boththeaters and gave a complete explanation for at least one of their choices. Slightly more than30 percent of the students omitted the question, and over half of the students produced responsesthat were rated “incorrect” or “minimal.” Students who had taken at least third-year algebra orpre-calculus were more likely than other students to choose the better measures for boththeaters and offer at least one complete explanation; however, even among this group thepercentage of responses that were at least “satisfactory” was small.
Extended Satisfactory Partial Minimal Incorrect OmitBetter Measure
and Complete
Better Measure Explanation
Better Measure Both Theaters; 1 Theater; or Better Better Measure
Both Theaters; Complete Measure Both Theaters 1 Theater; No
Complete Explanation with No or or Incomplete
Explanation for 1 Theater Incomplete Explanation Explanation
Score Percentages for“Compare Mean and Median”
Overall 1 3 10 28 25 31
Males 1 3 12 25 23 32Females 0! 2 9 31 27 30
White 1 4 12 30 25 27Black 0! 0! 7 25 24 42
Hispanic 0! 1! 6 18 24 48Asian/Pacific Islander 1! 4 7 25 24 34
American Indian *** *** *** *** *** ***
Geometry Taken 1 3 10 29 27 30
Highest Algebra-CalculusCourse Taken:
Pre-Algebra *** *** *** *** *** ***First-Year Algebra 0 2 8 28 26 33
Second-Year Algebra 0 2 10 29 26 30Third-Year
Algebra/Pre-Calculus 0 6 18 31 18 25Calculus 6 10 11 26 25 21
NOTE: Row percentages may not total 100 due to rounding. Responses that could not be rated were excluded.*** Sample size is insufficient to permit a reliable estimate.! Statistical tests involving this value should be interpreted with caution. Standard error estimates may not be accuratelydetermined and/or the sampling distribution of the statistics does not match statistical test assumptions (see Appendix A).SOURCE: National Center for Education Statistics, National Assessment of Educational Progress (NAEP) 1996Mathematics Assessment.
Table 6.13
Grade 12
Student Work and Teacher Practices in Mathematics 177
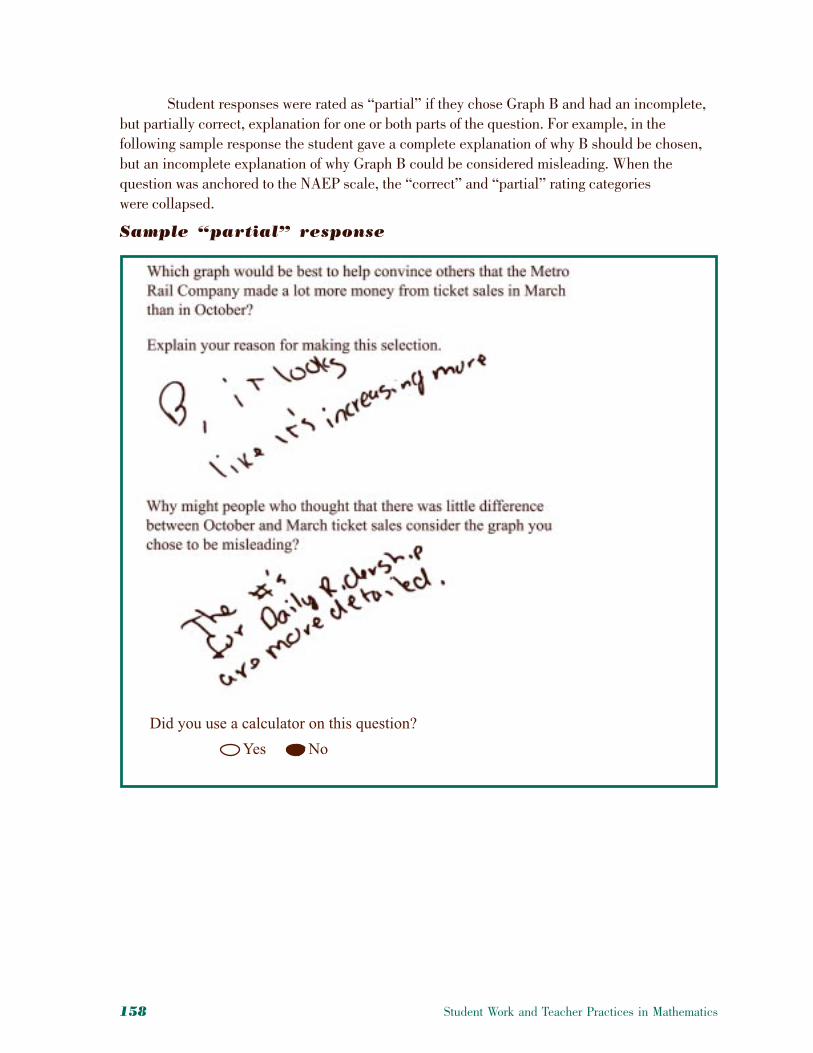
Table 6.14 shows that few of the students within any of the achievement levelclassifications received full credit on this question, and when the question was anchored to theNAEP scale, the “extended” and “satisfactory” rating categories were collapsed. The questionmapped at 463 on the NAEP composite mathematics scale.
ProbabilityThis area included questions measuring students’ understanding of probabilistic events andtheir ability to determine the probability of simple and compound events. Questions forfourth-grade students used less advanced terminology than those for older students, andprobabilities were simpler to calculate. Questions for older students required them to predictoutcomes given two or more dependent events. Some questions also involved percents andproportions. Two questions are presented as examples for this area. One is a fourth-grademultiple-choice question, and the other is a twelfth-grade extended constructed-responsequestion.
The following example question asked fourth-grade students to determine the chancesthat the person randomly chosen to be the captain of a swim team would be a fifth grader, giventhat the membership of the swim team was divided between fifth- and sixth-grade students in aspecified manner. The language used in this example is typical of the probability questionspresented in the fourth-grade assessment.
Overall Below Basic Basic Proficient Advanced
4 0! 2 13 ***
Percentage at Least Satisfactory WithinAchievement-Level Intervals for“Compare Mean and Median”
NAEP Grade 12 Composite Scale Range
*** Sample size is insufficient to permit a reliable estimate.! Statistical tests involving this value should be interpreted with caution. Standard error estimates may not be accuratelydetermined and/or the sampling distribution of the statistics does not match statistical test assumptions (see Appendix A).SOURCE: National Center for Education Statistics, National Assessment of Educational Progress (NAEP) 1996Mathematics Assessment.
Table 6.14

178 Student Work and Teacher Practices in Mathematics
The correct option is C.
Tables 6.15 and 6.16 display student performance data on this question. Approximatelyone-third of the students responded correctly. Twenty-two percent of the students choseOption A, the probability that any individual student would be chosen, whereas 16 percentchose Option B, and 28 percent chose Option D. The appeal of the latter option may have beenthat it contained both of the numbers specified in the stem of the question. Clearly, manyfourth-grade students did not know how to determine chance.
Overall 31
Males 32Females 30
White 34Black 22
Hispanic 26Asian/Pacific Islander 35
American Indian ***
Percentage Correct for “Determine a Probability”
Percentage Correct
*** Sample size is insufficient to permit a reliable estimate.SOURCE: National Center for Education Statistics, National Assessment of Educational Progress (NAEP) 1996Mathematics Assessment.
Table 6.15
Grade 4

Student Work and Teacher Practices in Mathematics 179
Table 6.16 shows the percentage of students within each of the achievement levelintervals who responded correctly to this question. Half of the students classified as Proficientresponded correctly compared with approximately one-quarter of the students at each of thelower two levels. The question mapped at 278.
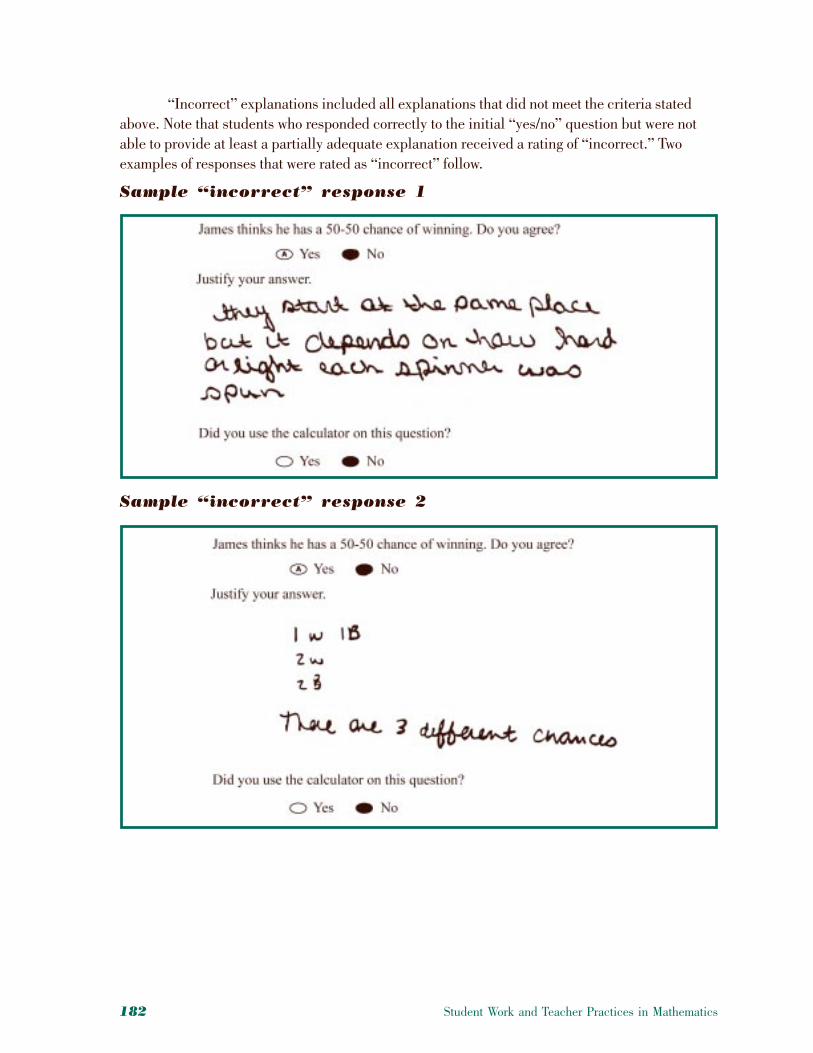
The final example is a twelfth-grade extended constructed-response question on jointprobabilities. The question showed two spinners that were half black and half white, andstudents were told that to “win,” both arrows had to land on black when the spinner was spunonce. They then were asked whether they agreed that there was a 50-50 chance of thishappening and instructed to justify their answers. The correct response was “no” because thepossibility of either event happening was 1 in 2; therefore, the possibility of both happening was1 in 4, or 25 percent.
Overall Below Basic Basic Proficient Advanced
31 23 24 54 ***
Percentage Correct Within Achievement-LevelIntervals for “Determine a Probability”
NAEP Grade 4 Composite Scale Range
*** Sample size is insufficient to permit a reliable estimate.SOURCE: National Center for Education Statistics, National Assessment of Educational Progress (NAEP) 1996Mathematics Assessment.
Table 6.16

180 Student Work and Teacher Practices in Mathematics
Sample “correct” response 2
Students’ explanations were rated “correct,” “partial,” or “incorrect.” A “correct”explanation had to indicate that the actual chances were 1 in 4, or 25 percent, and correctlyjustify this conclusion. Both of the following responses were considered “correct.”
Sample “correct” response 1

Student Work and Teacher Practices in Mathematics 181
Students also could have simply drawn a diagram similar to the one presented in thesecond sample above and still have been considered as giving a “correct” response. For aresponse to have been rated as “partial,” students had to do one of the following:
● list the sample space correctly, but with less than a complete explanation;
● draw a correct tree diagram, but with less than a complete explanation; or
● simply state that the chance would be 1 in 4.
In the following example of a “partial” explanation, the student described the samplespace but did not tell what the actual chances of winning were.
Sample “partial” response
182 Student Work and Teacher Practices in Mathematics
Sample “incorrect” response 2
“Incorrect” explanations included all explanations that did not meet the criteria statedabove. Note that students who responded correctly to the initial “yes/no” question but were notable to provide at least a partially adequate explanation received a rating of “incorrect.” Twoexamples of responses that were rated as “incorrect” follow.
Sample “incorrect” response 1

Student Work and Teacher Practices in Mathematics 183
Student performance data are presented in Tables 6.17 and 6.18. Forty-four percent ofthe students provided an “incorrect” response to the initial question, meaning that they did notanswer “no” to whether there was a 50-50 chance of the spinners both landing on black.Approximately one-quarter of the students answered the initial question correctly but providedan incorrect explanation. The remainder were able to give an explanation that was at leastpartially correct. Students whose highest course was calculus were substantially more likelythan other students to provide a fully correct explanation: 34 percent of these students provideda response rated “correct.” Males were more likely than females to provide at least a partialexplanation to the question.
Overall 8 20 24 44 4
Males 9 23 25 40 3Females 7 16 24 49 4
White 9 23 26 39 3Black 4 8 18 62 7
Hispanic 5 7 18 65 4Asian/Pacific Islander 11 20 29 38 1!
American Indian *** *** *** *** ***
Geometry Taken 8 22 25 41 4
Highest Algebra-CalculusCourse Taken:
Pre-Algebra *** *** *** *** ***First-Year Algebra 5 12 24 56 3
Second-Year Algebra 7 21 28 42 3Third-Year
Algebra/Pre-Calculus 8 37 21 26 8Calculus 34 24 16 19 6
NOTE: Row percentages may not total 100 due to rounding. Responses that could not be rated were excluded.*** Sample size is insufficient to permit a reliable estimate.! Statistical tests involving this value should be interpreted with caution. Standard error estimates may not be accuratelydetermined and/or the sampling distribution of the statistics does not match statistical test assumptions (see Appendix A).SOURCE: National Center for Education Statistics, National Assessment of Educational Progress (NAEP) 1996Mathematics Assessment.
Score Percentages for “Compare Probabilities”Table 6.17
Correct Partial Incorrect OmitCorrect Answer Correct Answer Correct Answerto “Yes/No” to “Yes/No” to “Yes/No” Incorrect Answer
Question; Correct Question; Partial Question; Incorrect to “Yes/No”Explanation Explanation Explanation Question
Grade 12
184 Student Work and Teacher Practices in Mathematics
Summary
This content strand included questions that assessed students’ understanding of data, includinghow to best collect, display, and interpret data. Questions also assessed students’ understandingof statistics and probability and their competence in calculating statistics and determiningprobabilities. Statistics included mean, median, mode, and standard deviation of distributions,and probabilities could be simple, dual, or conditional.
As might be expected, straightforward interpretations of graphs, charts, and tables wereeasier for students than questions that asked them to perform calculations with displayed data.Students also had difficulty explaining why one method of reporting or displaying data wasbetter than another, even though they may have recognized which was the better method.Questions asking students to determine chance or probability were generally difficult for them.
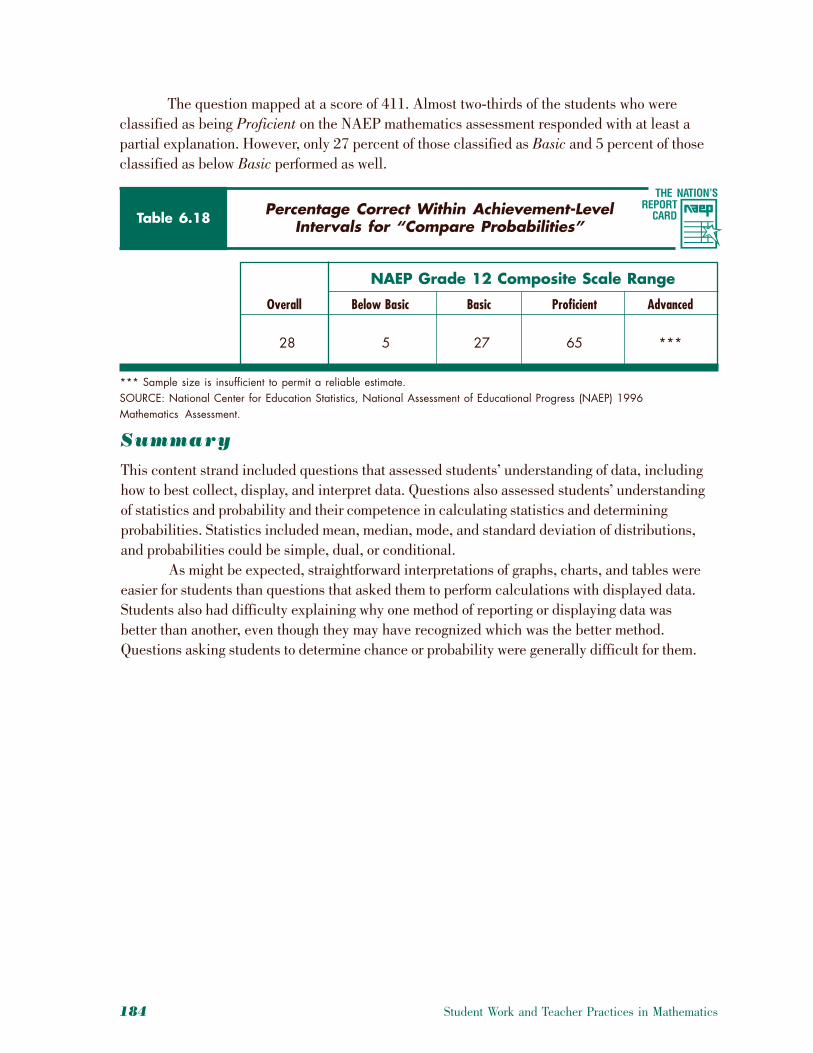
The question mapped at a score of 411. Almost two-thirds of the students who wereclassified as being Proficient on the NAEP mathematics assessment responded with at least apartial explanation. However, only 27 percent of those classified as Basic and 5 percent of thoseclassified as below Basic performed as well.
Overall Below Basic Basic Proficient Advanced
28 5 27 65 ***
Percentage Correct Within Achievement-LevelIntervals for “Compare Probabilities”
NAEP Grade 12 Composite Scale Range
*** Sample size is insufficient to permit a reliable estimate.SOURCE: National Center for Education Statistics, National Assessment of Educational Progress (NAEP) 1996Mathematics Assessment.
Table 6.18