Embed Size (px)
Citation preview
www.helsinki.fi/yliopisto
Data Analysis from Mobile Networks
Petteri Nurmi
9.2.2012Matemaattis-luonnontieteellinen tiedekunta / Henkilön nimi / Esityksen nimi 1
www.helsinki.fi/yliopisto
• What is the location area identifier? How it relates to location area code?
• What is a call detail record (CDR)? How it differs from data collected through mobile handsets?
• How CDR data can be used to estimate social networks?
• What kind of features can be extracted through CDR analysis?
• What kind of applications are there for CDR analysis?
9.2.2012 2Matemaattis-luonnontieteellinen tiedekunta / Henkilön nimi / Esityksen nimi
Questions
www.helsinki.fi/yliopisto
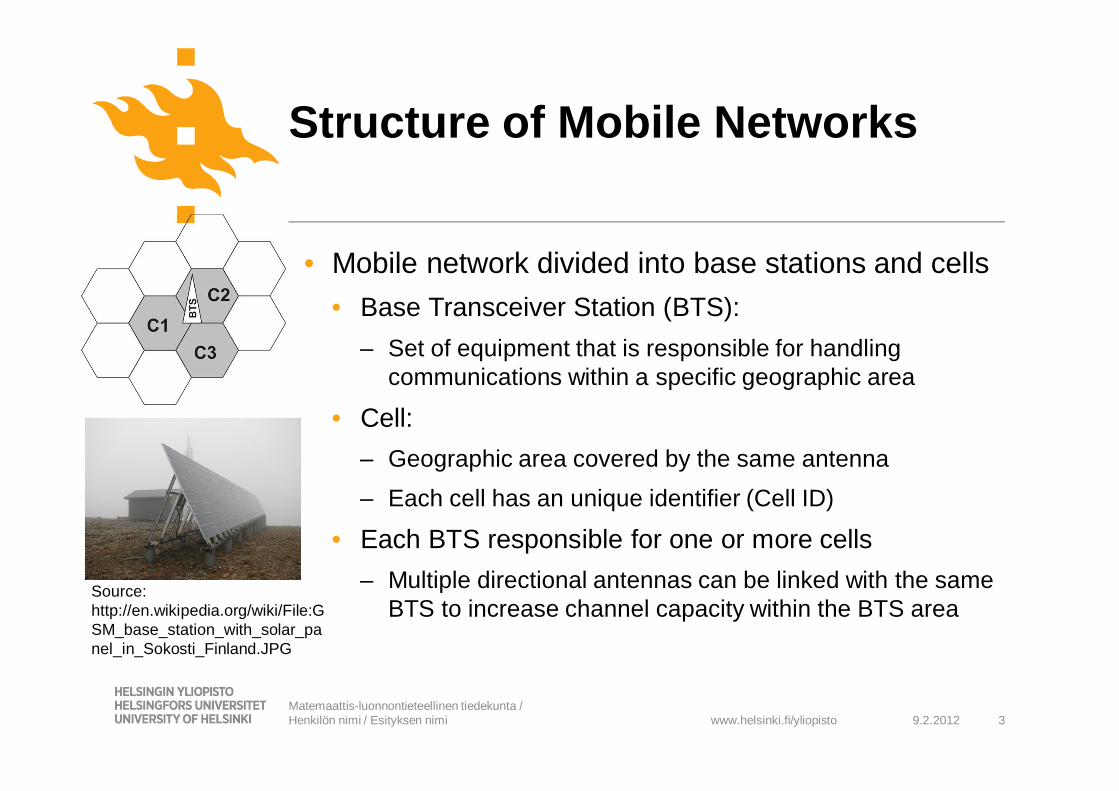
• Mobile network divided into base stations and cells• Base Transceiver Station (BTS):
Set of equipment that is responsible for handling communications within a specific geographic area
• Cell:Geographic area covered by the same antennaEach cell has an unique identifier (Cell ID)
• Each BTS responsible for one or more cellsMultiple directional antennas can be linked with the same BTS to increase channel capacity within the BTS area
9.2.2012 3Matemaattis-luonnontieteellinen tiedekunta / Henkilön nimi / Esityksen nimi
Structure of Mobile Networks
Source: http://en.wikipedia.org/wiki/File:GSM_base_station_with_solar_panel_in_Sokosti_Finland.JPG
www.helsinki.fi/yliopisto
• Location Area• A cluster of cells referred to as a location area• Smallest unit for which the network maintains
information about the location of a mobile unit
• Location Area Identifier (LAI)• Globally unique• Three parts: mobile country code (MCC), mobile
network code (MNC) and location area code (LAC)
• Cell level information available to the network only when the terminal is active (i.e., transmitting)
9.2.2012 4Matemaattis-luonnontieteellinen tiedekunta / Henkilön nimi / Esityksen nimi
Mobile Networks
www.helsinki.fi/yliopisto
• Record that is generated by the network when a phone call (or other type of connection) takes place• Making or receiving a phone call• Using a service (SMS/MMS/Data Connectivity)
• Contains (among other things):• Identifier of the initiating party (calling number)• Identifier of the receiving party (number or website)• Duration, type of connection, time• BTS responsible for handling the call
9.2.2012 5Matemaattis-luonnontieteellinen tiedekunta / Henkilön nimi / Esityksen nimi
Call Detail Record
www.helsinki.fi/yliopisto
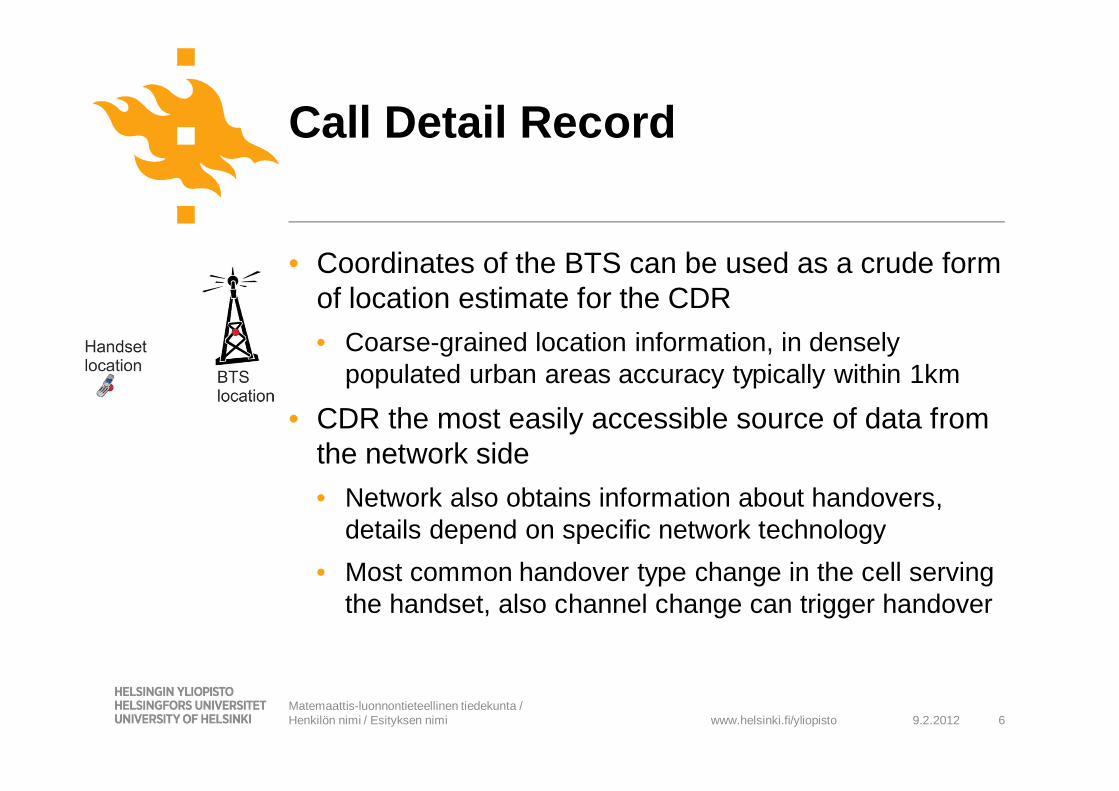
• Coordinates of the BTS can be used as a crude form of location estimate for the CDR• Coarse-grained location information, in densely
populated urban areas accuracy typically within 1km
• CDR the most easily accessible source of data from the network side• Network also obtains information about handovers,
details depend on specific network technology• Most common handover type change in the cell serving
the handset, also channel change can trigger handover
9.2.2012 6Matemaattis-luonnontieteellinen tiedekunta / Henkilön nimi / Esityksen nimi
Call Detail Record
www.helsinki.fi/yliopisto
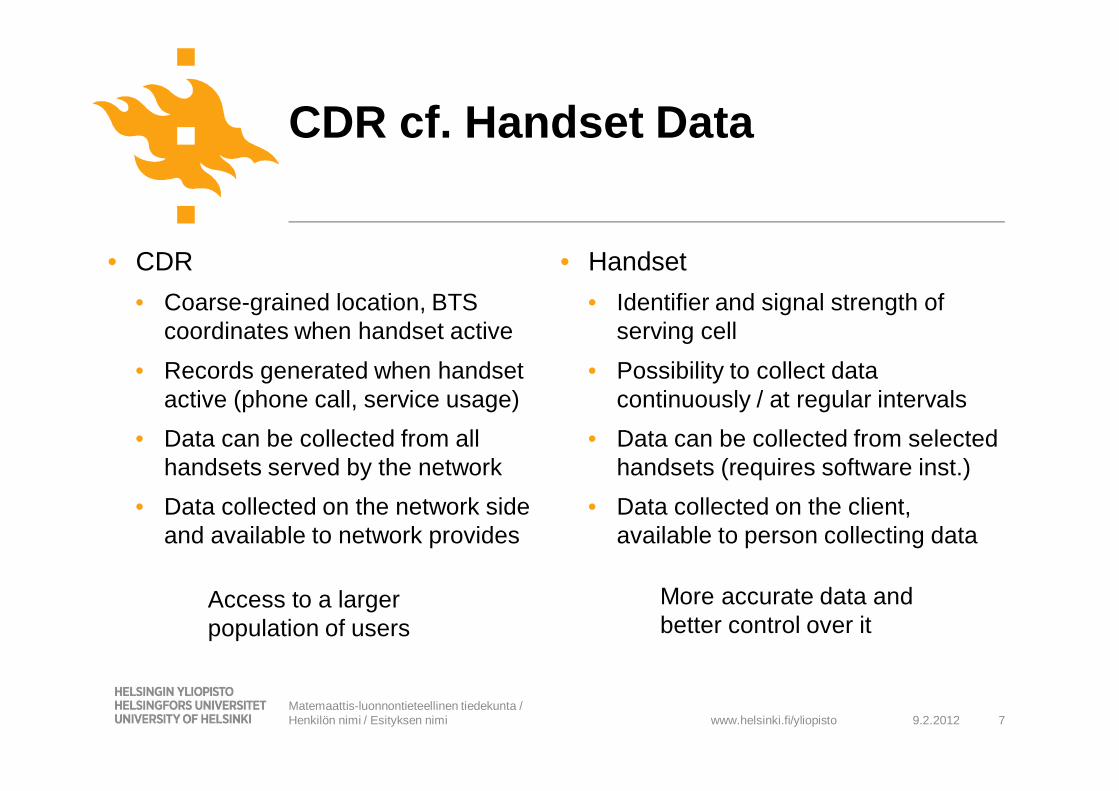
• CDR• Coarse-grained location, BTS
coordinates when handset active• Records generated when handset
active (phone call, service usage)• Data can be collected from all
handsets served by the network• Data collected on the network side
and available to network provides
9.2.2012 7Matemaattis-luonnontieteellinen tiedekunta / Henkilön nimi / Esityksen nimi
CDR cf. Handset Data
• Handset• Identifier and signal strength of
serving cell• Possibility to collect data
continuously / at regular intervals• Data can be collected from selected
handsets (requires software inst.)• Data collected on the client,
available to person collecting data
Access to a larger population of users
More accurate data and better control over it
www.helsinki.fi/yliopisto 9.2.2012 8Matemaattis-luonnontieteellinen tiedekunta / Henkilön nimi / Esityksen nimi
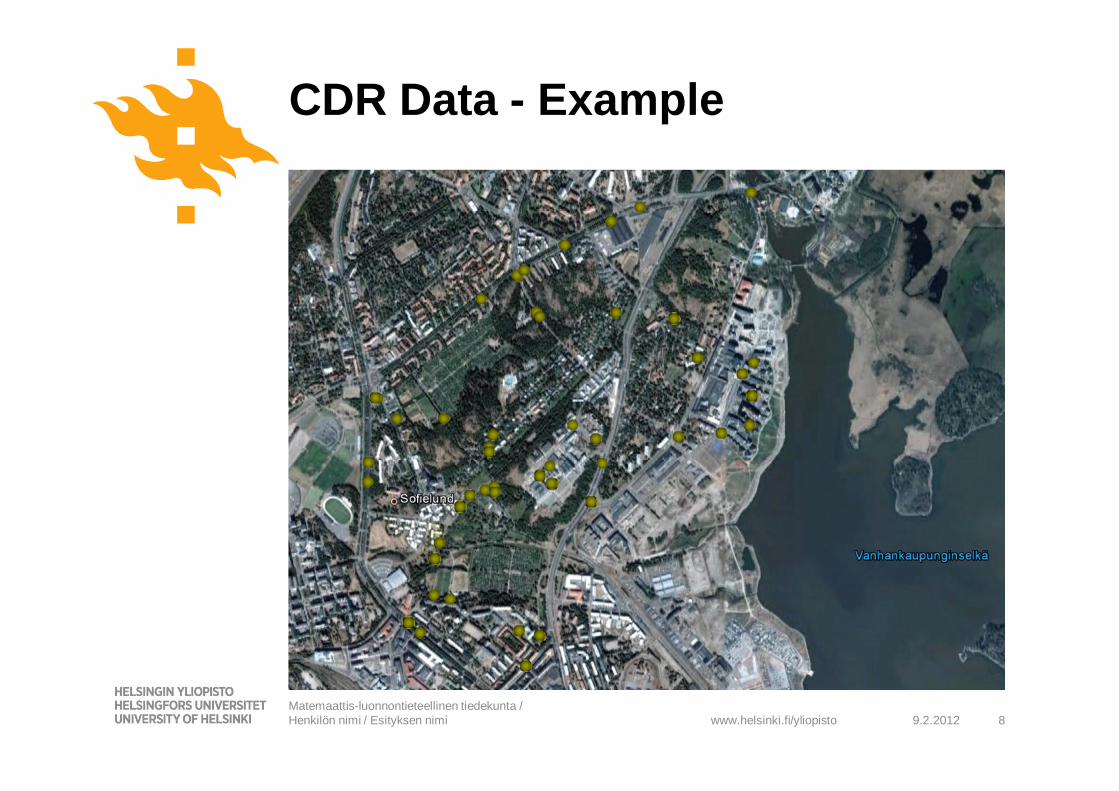
CDR Data - Example
www.helsinki.fi/yliopisto
• Consumption analysis• User profiling based on communication patterns
• Social Network analysis• Detecting community/group structures, understanding
true communication behavior, churn prediction etc.• Mobility analysis
• Characterizing mobility of an individual or a large population, estimating road or public transport usage
• Behavioral profiling• Socioeconomic or psychological profiling based on
features extracted from CDR measurements
9.2.2012 9Matemaattis-luonnontieteellinen tiedekunta / Henkilön nimi / Esityksen nimi
CDR Analysis
www.helsinki.fi/yliopisto 9.2.2012 10Matemaattis-luonnontieteellinen tiedekunta / Henkilön nimi / Esityksen nimi
Example – Senseable City Rome
http://www.youtube.com/watch?v=RbhBz5UwRDQ
www.helsinki.fi/yliopisto
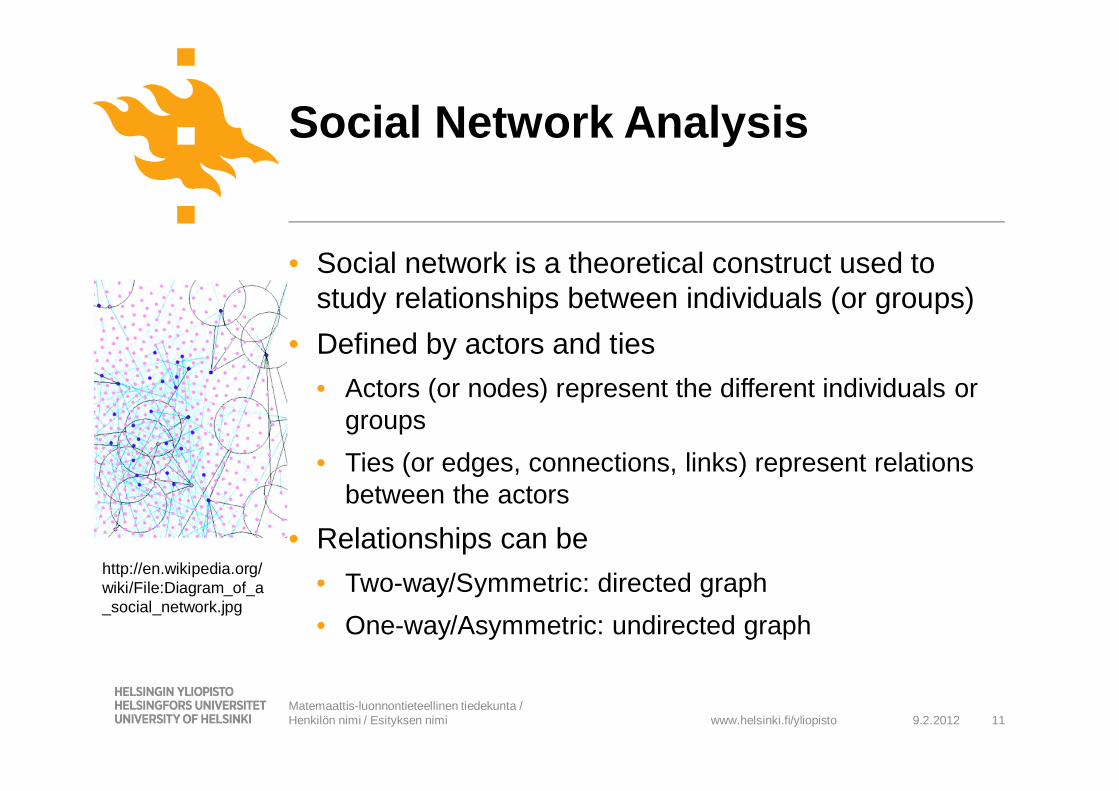
• Social network is a theoretical construct used to study relationships between individuals (or groups)
• Defined by actors and ties• Actors (or nodes) represent the different individuals or
groups• Ties (or edges, connections, links) represent relations
between the actors
• Relationships can be• Two-way/Symmetric: directed graph• One-way/Asymmetric: undirected graph
9.2.2012 11Matemaattis-luonnontieteellinen tiedekunta / Henkilön nimi / Esityksen nimi
Social Network Analysis
http://en.wikipedia.org/wiki/File:Diagram_of_a_social_network.jpg
www.helsinki.fi/yliopisto
• CDR, and other communication data, can be used to construct a multidimensional social network• Weighted graph, each edge linked with a vector of attributes
Number of calls made between two actors and their total durationMessage counts (SMS and MMS)Calls during specific time (prime-time, weekend, etc.)
• Weights represent the importance of the different attributesCan be used to cluster the connections to subgroups (e.g., strong connections, sporadic connections, non-connections/noise etc.)
• Relationships can be constructed either considering symmetric or asymmetric connections• Symmetric: edge created when communication two-way• Asymmetric: edges created from all communication data
9.2.2012 12Matemaattis-luonnontieteellinen tiedekunta / Henkilön nimi / Esityksen nimi
From CDR to Social Network
www.helsinki.fi/yliopisto
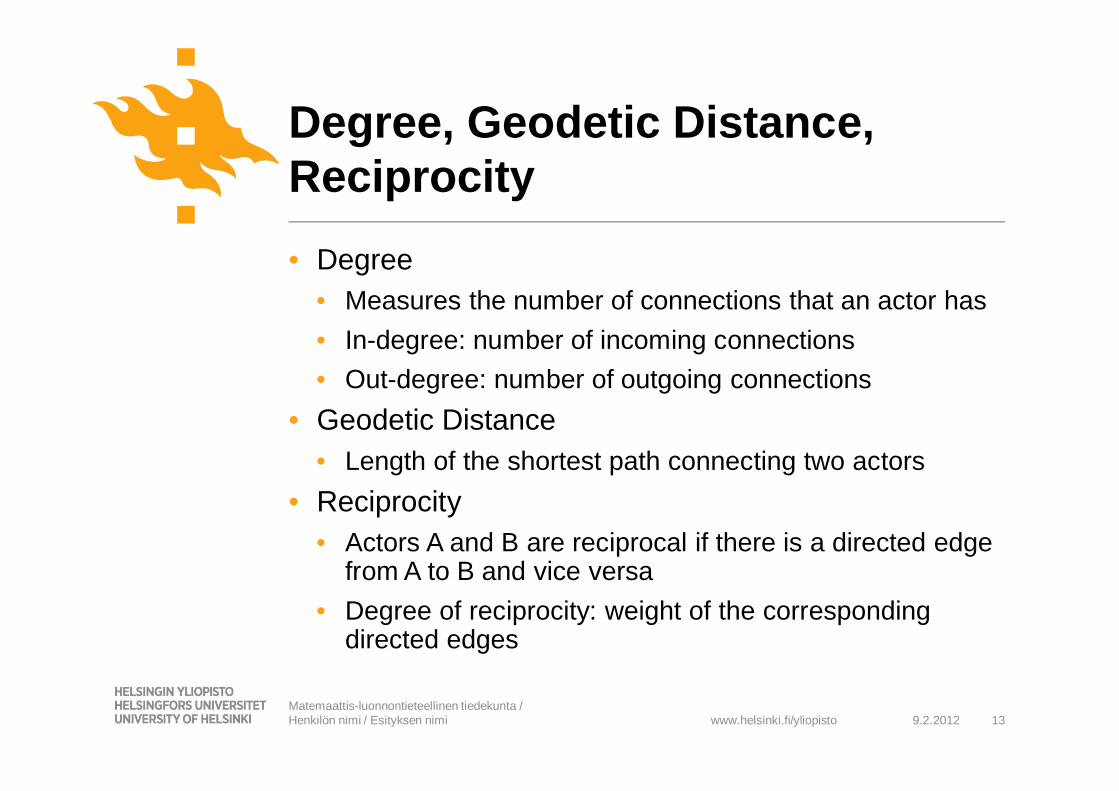
• Degree • Measures the number of connections that an actor has• In-degree: number of incoming connections• Out-degree: number of outgoing connections
• Geodetic Distance• Length of the shortest path connecting two actors
• Reciprocity• Actors A and B are reciprocal if there is a directed edge
from A to B and vice versa• Degree of reciprocity: weight of the corresponding
directed edges
9.2.2012 13Matemaattis-luonnontieteellinen tiedekunta / Henkilön nimi / Esityksen nimi
Degree, Geodetic Distance, Reciprocity
www.helsinki.fi/yliopisto 9.2.2012 14Matemaattis-luonnontieteellinen tiedekunta / Henkilön nimi / Esityksen nimi
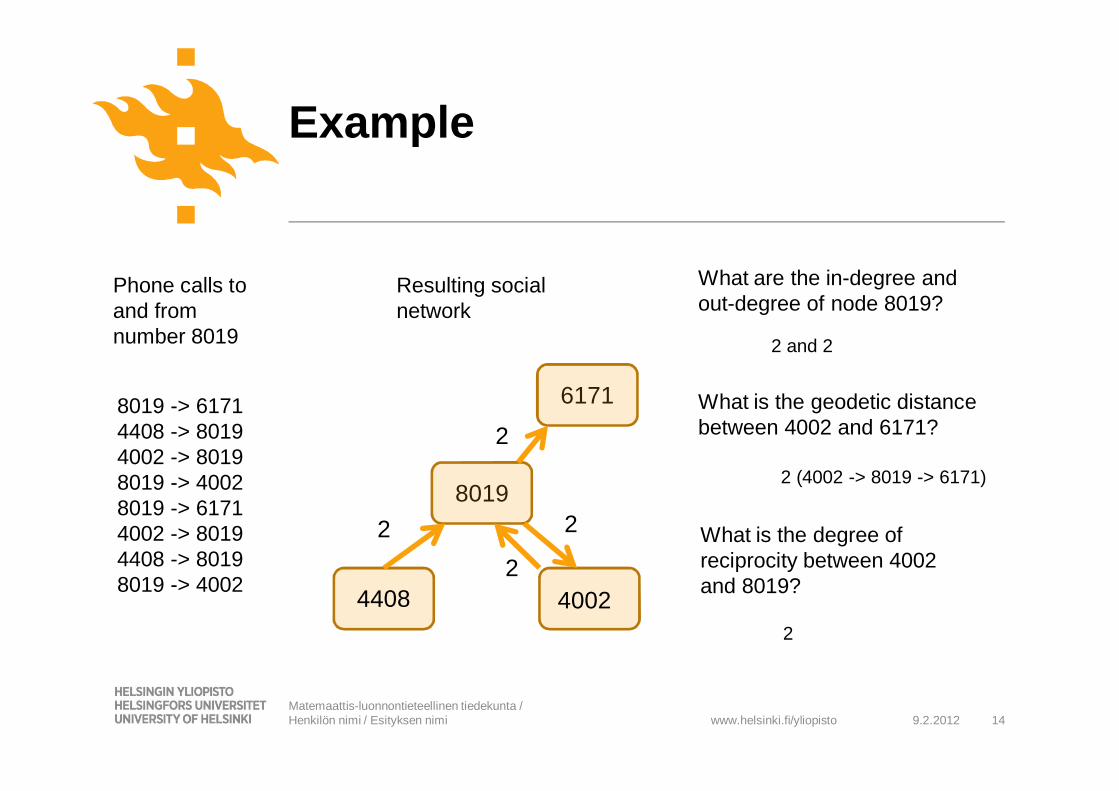
Example
8019 -> 61714408 -> 80194002 -> 80198019 -> 40028019 -> 61714002 -> 80194408 -> 80198019 -> 4002
Phone calls to and from number 8019
8019
6171
40024408
2
2
22
Resulting social network
What are the in-degree and out-degree of node 8019?
What is the geodetic distance between 4002 and 6171?
What is the degree of reciprocity between 4002 and 8019?
2 and 2
2 (4002 -> 8019 -> 6171)
2
www.helsinki.fi/yliopisto
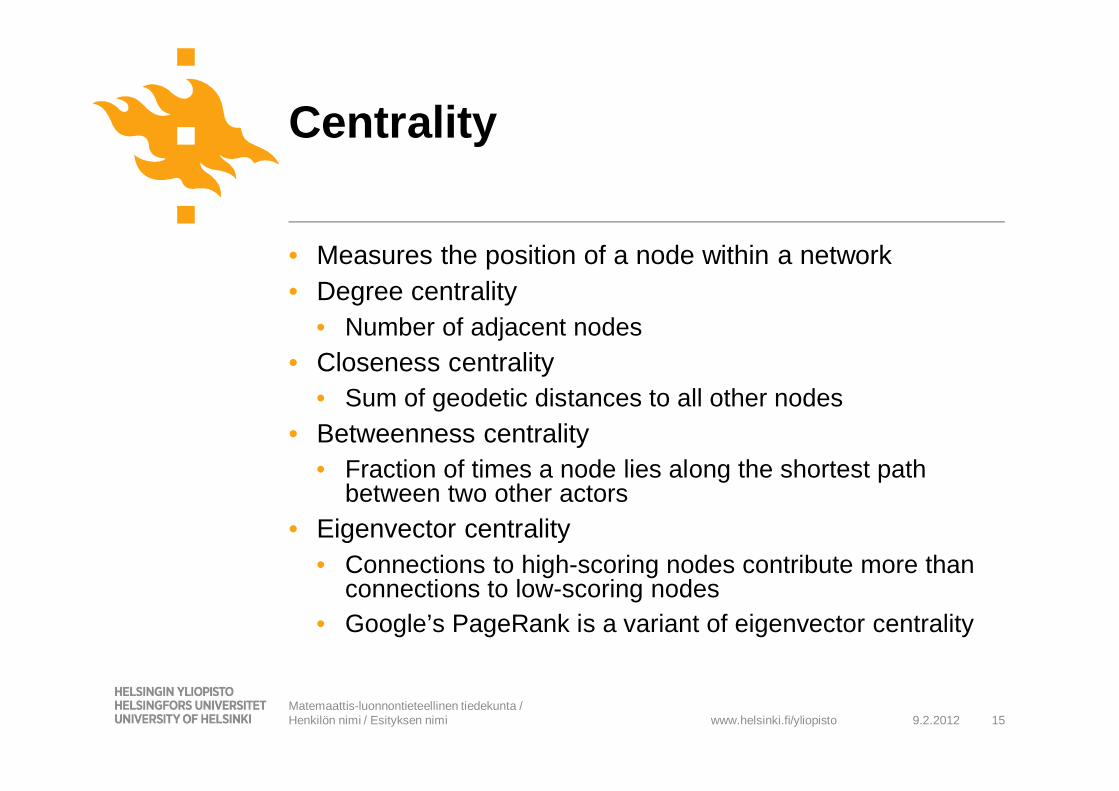
• Measures the position of a node within a network• Degree centrality
• Number of adjacent nodes• Closeness centrality
• Sum of geodetic distances to all other nodes• Betweenness centrality
• Fraction of times a node lies along the shortest path between two other actors
• Eigenvector centrality• Connections to high-scoring nodes contribute more than
connections to low-scoring nodes• Google’s PageRank is a variant of eigenvector centrality
9.2.2012 15Matemaattis-luonnontieteellinen tiedekunta / Henkilön nimi / Esityksen nimi
Centrality
www.helsinki.fi/yliopisto 9.2.2012 16Matemaattis-luonnontieteellinen tiedekunta / Henkilön nimi / Esityksen nimi
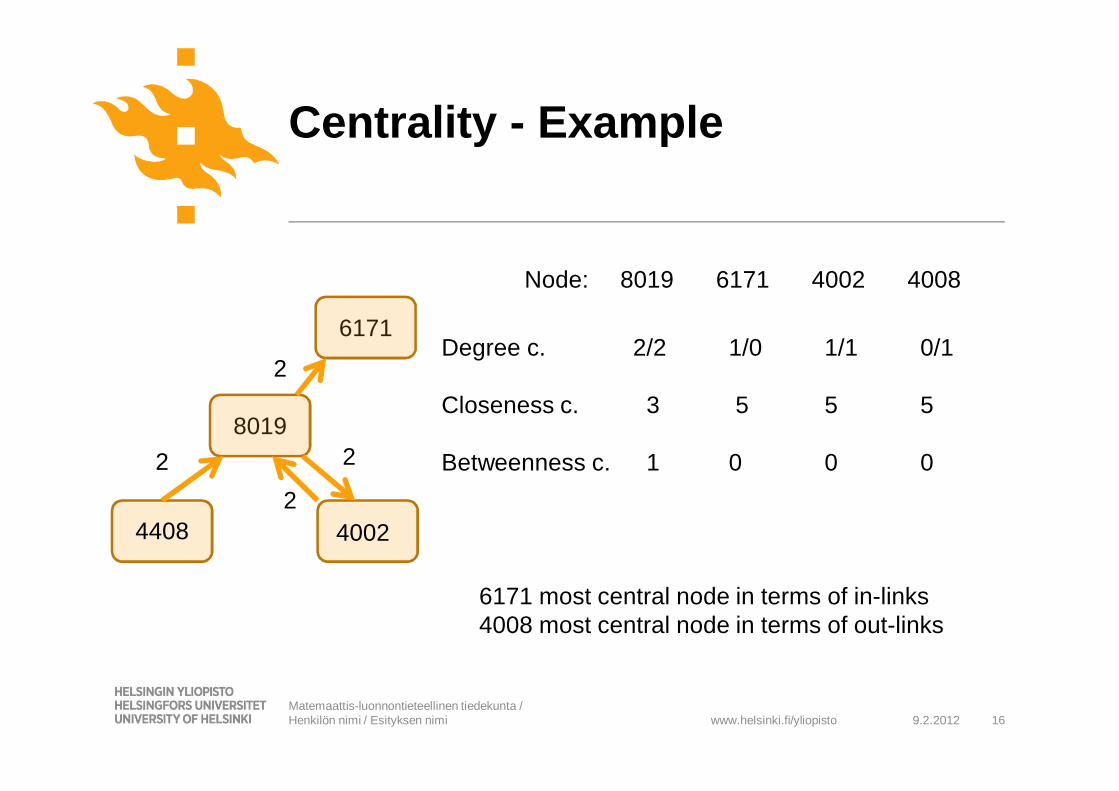
Centrality - Example
8019
6171
40024408
2
2
22
Node: 8019 6171 4002 4008
Degree c. 2/2 1/0 1/1 0/1
Closeness c. 3 5 5 5
Betweenness c. 1 0 0 0
6171 most central node in terms of in-links4008 most central node in terms of out-links
www.helsinki.fi/yliopisto
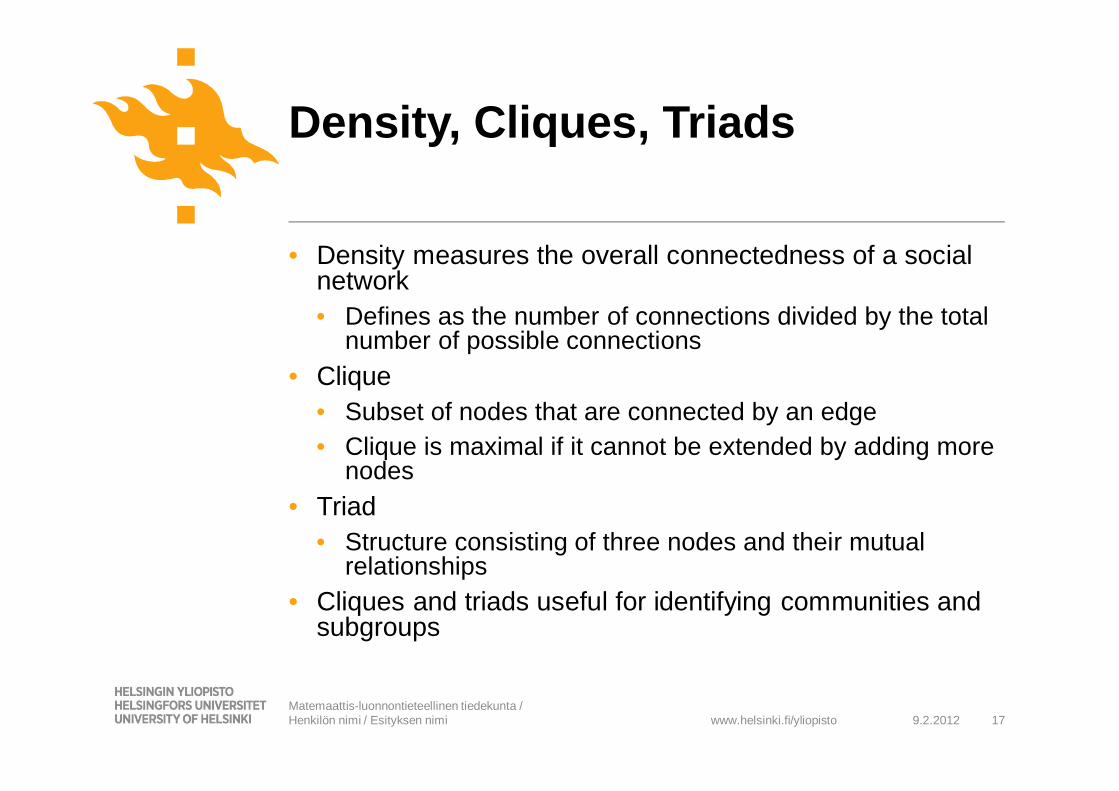
• Density measures the overall connectedness of a social network• Defines as the number of connections divided by the total
number of possible connections• Clique
• Subset of nodes that are connected by an edge• Clique is maximal if it cannot be extended by adding more
nodes• Triad
• Structure consisting of three nodes and their mutual relationships
• Cliques and triads useful for identifying communities and subgroups
9.2.2012 17Matemaattis-luonnontieteellinen tiedekunta / Henkilön nimi / Esityksen nimi
Density, Cliques, Triads
www.helsinki.fi/yliopisto 9.2.2012 18Matemaattis-luonnontieteellinen tiedekunta / Henkilön nimi / Esityksen nimi
Density and Cliques - Example
8019
6171
40024408
2
2
22
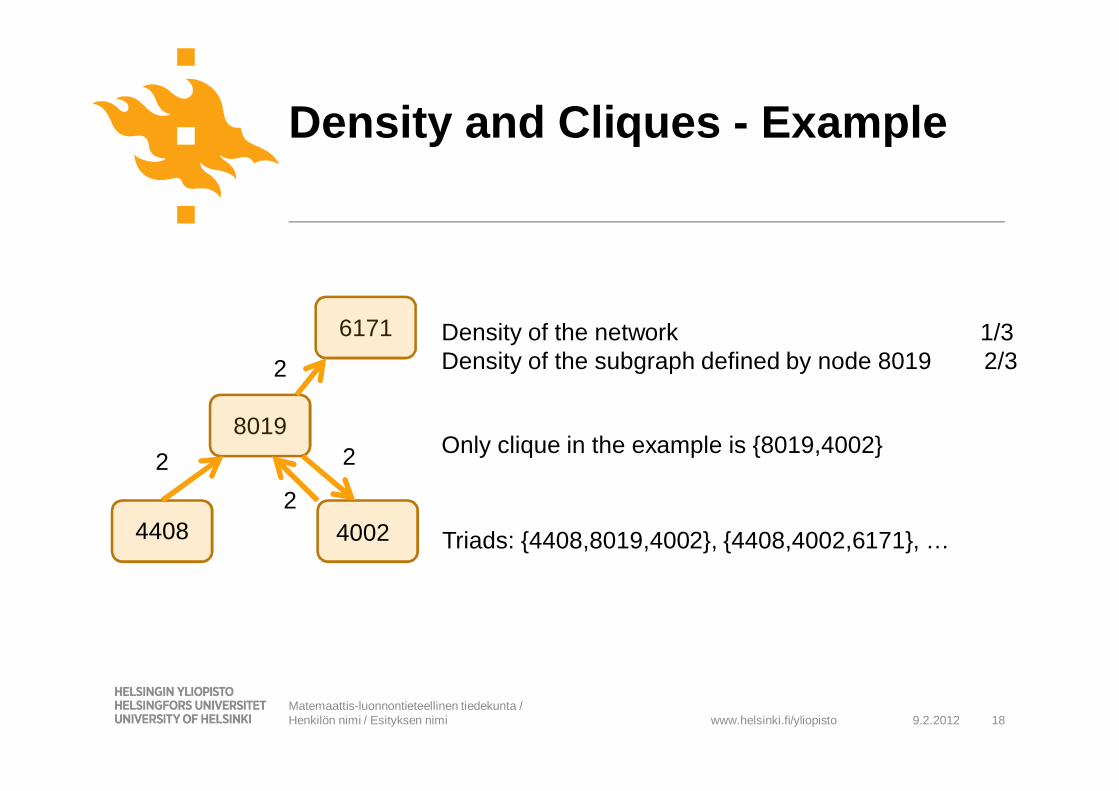
Density of the network 1/3Density of the subgraph defined by node 8019 2/3
Only clique in the example is {8019,4002}
Triads: {4408,8019,4002}, {4408,4002,6171}, …
www.helsinki.fi/yliopisto 9.2.2012 19Matemaattis-luonnontieteellinen tiedekunta / Henkilön nimi / Esityksen nimi
Example –Connected States of America
http://www.youtube.com/watch?v=eFKZnbIAboI
www.helsinki.fi/yliopisto
• “Similarity breeds connection”• Personal networks tend to be homogenous with regard to many
socio-demographic, behavioral and intrapersonal characteristics• Selection
• People tend to form relationships with others who are already similar to them
• Social influence• People adopt behaviors exhibited by persons they interact with
• Why it matters?• Churn: subscribers are more likely to transfer business elsewhere
if they have close acquaintances that have transferred recently• Handset similarities: likelihood of having a particular handset
increases with the number of close connections with the handset• Other user profile similarities can be detected as well
9.2.2012 20Matemaattis-luonnontieteellinen tiedekunta / Henkilön nimi / Esityksen nimi
Homophily Principle
www.helsinki.fi/yliopisto
• Individual mobility• Detecting important places
Home or work place detectionOther important locations
• Degree of mobilityArea of influence and its diameterRadius of gyration
• Collective mobility• Mathematical characterization of mobility• Estimation of traffic volumes• Estimation of origin-destination flows
9.2.2012 21Matemaattis-luonnontieteellinen tiedekunta / Henkilön nimi / Esityksen nimi
Mobility Patterns
www.helsinki.fi/yliopisto
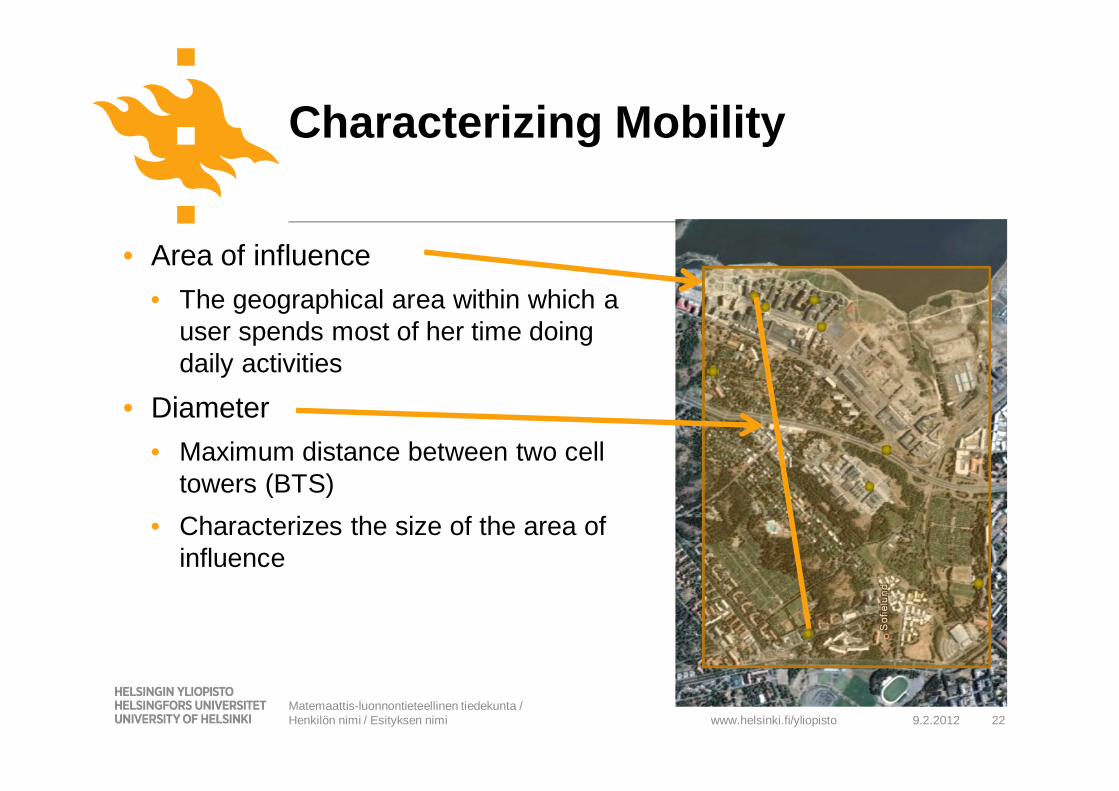
• Area of influence• The geographical area within which a
user spends most of her time doing daily activities
• Diameter• Maximum distance between two cell
towers (BTS)• Characterizes the size of the area of
influence
9.2.2012 22Matemaattis-luonnontieteellinen tiedekunta / Henkilön nimi / Esityksen nimi
Characterizing Mobility
www.helsinki.fi/yliopisto
• Radius of gyration• Typical distance that an individual covers in daily mobility
• Calculation1. Assign a weight for each BTS observed in the CDR
measurementsRelative usage of a BTS, e.g., in terms of number of records or total duration of traffic through a BTS
2. Calculate a weighted center of mass using the BTS coordinates and weights
3. Calculate the distance between each BTS and the weighted center of mass
4. Radius of gyration is the mean of these distances
9.2.2012 23Matemaattis-luonnontieteellinen tiedekunta / Henkilön nimi / Esityksen nimi
Radius of Gyration
www.helsinki.fi/yliopisto 9.2.2012 24Matemaattis-luonnontieteellinen tiedekunta / Henkilön nimi / Esityksen nimi
Radius of Gyration Example
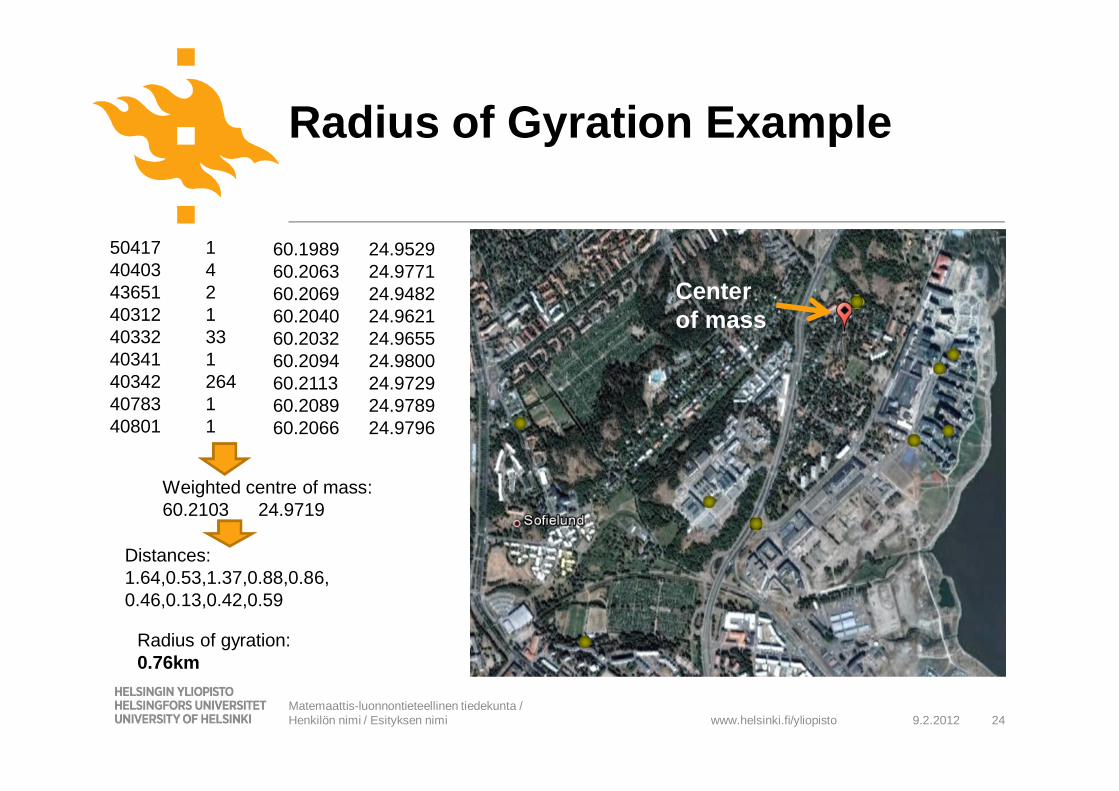
60.1989 24.952960.2063 24.977160.2069 24.948260.2040 24.962160.2032 24.965560.2094 24.980060.2113 24.972960.2089 24.978960.2066 24.9796
50417 140403 443651 240312 140332 3340341 140342 26440783 140801 1
Weighted centre of mass:60.2103 24.9719
Center of mass
Distances:1.64,0.53,1.37,0.88,0.86,0.46,0.13,0.42,0.59
Radius of gyration:0.76km
www.helsinki.fi/yliopisto
• Basic idea same as in coordinate-based place detection• Detect geographic areas that contain numerous
measurements within a spatially small area• Use temporal and spatial constraints to determine whether
the place is meaningful or not• CDR data cannot be reliably used to estimate the time the
user spends in a location• Importance can be estimated considering
• Percentage of tower days, i.e., on how many days one of the BTS in a cluster was connected to
• Number of days between first and last contact with any cell tower in the cluster
• Number of days on which any BTS in a cluster was contacted compared to other clusters from a user
9.2.2012 25Matemaattis-luonnontieteellinen tiedekunta / Henkilön nimi / Esityksen nimi
Important Place Detection
www.helsinki.fi/yliopisto 9.2.2012 26Matemaattis-luonnontieteellinen tiedekunta / Henkilön nimi / Esityksen nimi
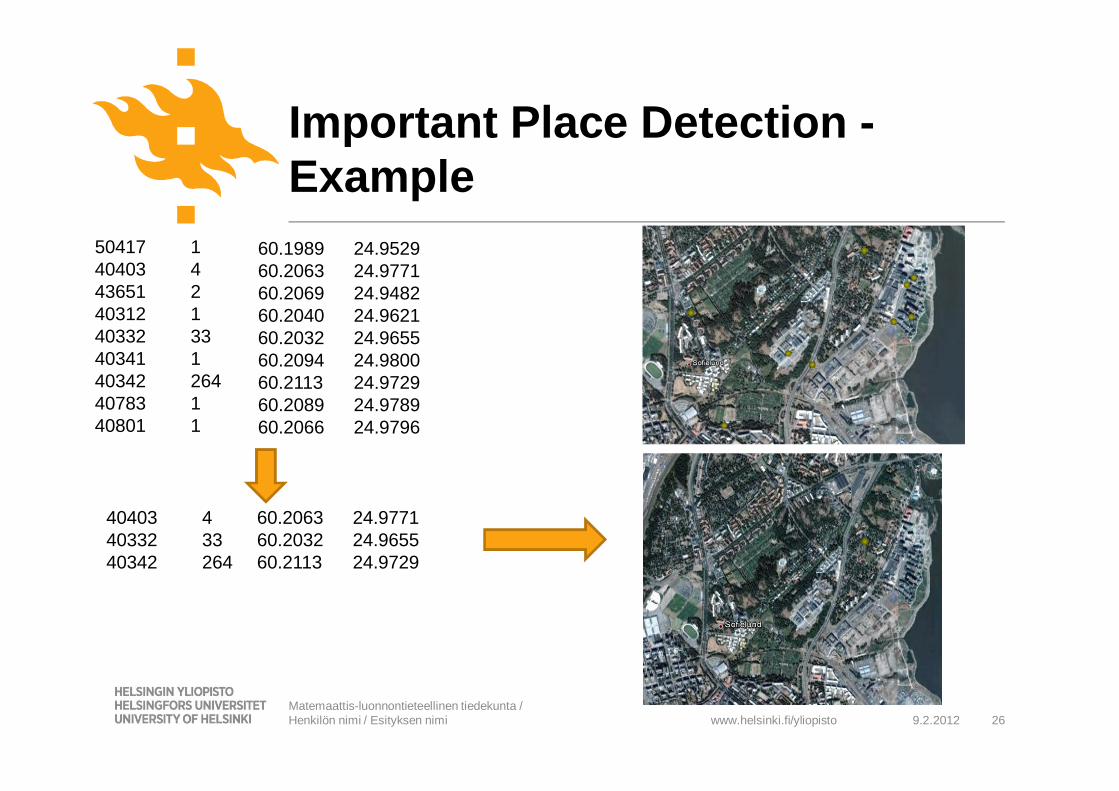
Important Place Detection -Example
60.1989 24.952960.2063 24.977160.2069 24.948260.2040 24.962160.2032 24.965560.2094 24.980060.2113 24.972960.2089 24.978960.2066 24.9796
50417 140403 443651 240312 140332 3340341 140342 26440783 140801 1
60.2063 24.977160.2032 24.965560.2113 24.9729
40403 440332 3340342 264
www.helsinki.fi/yliopisto
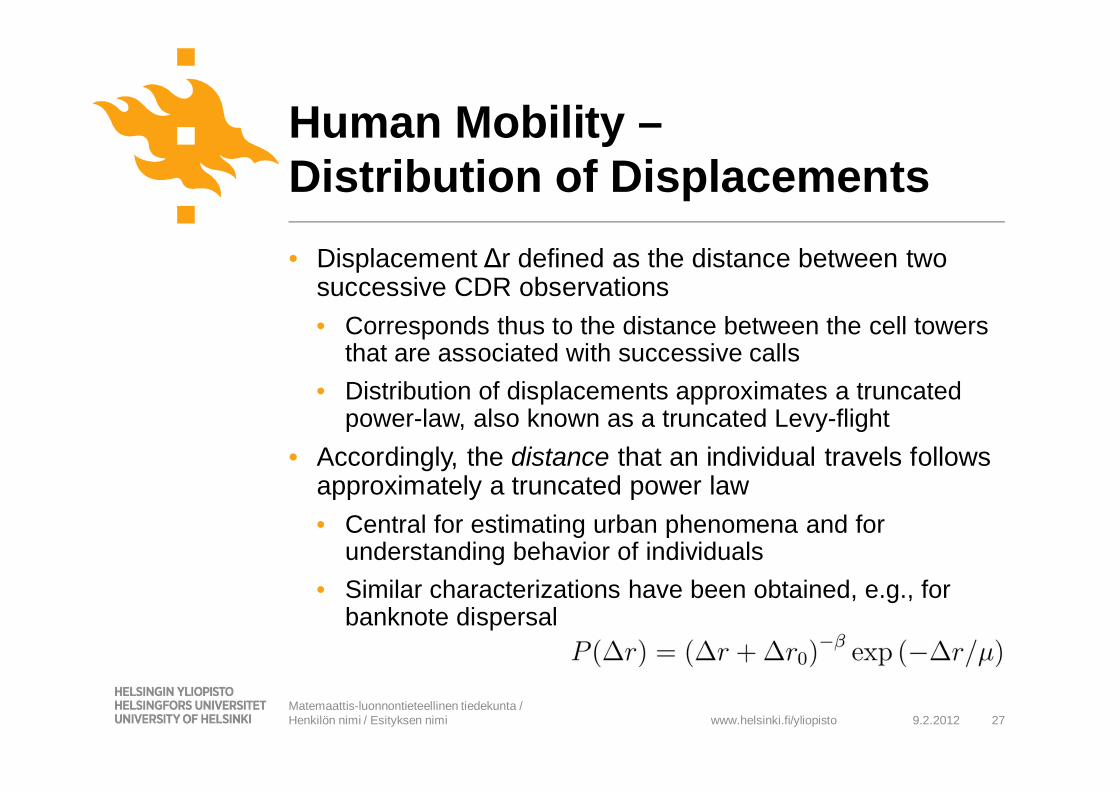
• Displacement r defined as the distance between two successive CDR observations• Corresponds thus to the distance between the cell towers
that are associated with successive calls• Distribution of displacements approximates a truncated
power-law, also known as a truncated Levy-flight• Accordingly, the distance that an individual travels follows
approximately a truncated power law• Central for estimating urban phenomena and for
understanding behavior of individuals• Similar characterizations have been obtained, e.g., for
banknote dispersal
9.2.2012 27Matemaattis-luonnontieteellinen tiedekunta / Henkilön nimi / Esityksen nimi
Human Mobility –Distribution of Displacements
www.helsinki.fi/yliopisto
• Basic idea:• Detect start and end locations for trips using a place
identification algorithmPlace identification necessary to overcome oscillations in location due to cell handovers
• Divide geographic area under investigation into regions and assign a region for each origin and destination
• Group trips with same origin and destination regions together using different temporal windows
Weekly, daily, hourly etc.
9.2.2012 28Matemaattis-luonnontieteellinen tiedekunta / Henkilön nimi / Esityksen nimi
Collective Mobility –Origin-Destination Flows
www.helsinki.fi/yliopisto
• Socioeconomic Level (SEL) (or status SES)• Characterization of an individual (or household)
economic and social status relative to rest of the society• Typically defined as a combination of income related
variables (salary, wealth, education)
• SEL Map• Characterization of socioeconomic level at different
geographical areas• Typically indicator values stratified to a small number of
levels, e.g., high, middle and low socioeconomic status• Computed by national statistical institutes
9.2.2012 29Matemaattis-luonnontieteellinen tiedekunta / Henkilön nimi / Esityksen nimi
Socioeconomic Level
www.helsinki.fi/yliopisto
• Socioeconomic status correlates with features that can be extracted from CDR data• Behavioral features
Number of incoming/outgoing calls and messages, handset type, total duration of calls, expenses, …
• Social network featuresDegree of social network, frequency of communication, …
• Mobility featuresDiameter of the area of influence, radius of gyration, total distance traveled, …
• Socioeconomic status can thus be predicted by training a classifier/regression model• Features as before, class variable for training the SEL
level of an individual as given by existing maps
9.2.2012 30Matemaattis-luonnontieteellinen tiedekunta / Henkilön nimi / Esityksen nimi
Socioeconomic Prediction
www.helsinki.fi/yliopisto
• The Big Five personality model• Five traits that characterize personality
Openness to experience, Conscientiousness, Extraversion, Agreeableness, Neuroticism
• Personality assessed using a questionnaire that presents positive and negative statements one at a time
• For each trait, questionnaire returns a trait score that describes how characteristic the trait is in the individual
• Personality detection attempts to automatically determine personality traits• CDR data and social network data can be used to infer
personality traits to some extent
9.2.2012 31Matemaattis-luonnontieteellinen tiedekunta / Henkilön nimi / Esityksen nimi
Personality Detection
www.helsinki.fi/yliopisto
• Automatic personality detection can be seen as a regression problem• Estimate the score of a personality trait based on features
extracted from CDR data and social network• CDR variables:
• Duration of received phone calls, number of received and placed phone calls, number of SMS/MMS sent/received etc.
• Social network variables:• Degree of the actor (number of contacts), density of subgraph
formed by neighboring nodes• Number of strong contacts (frequent calling partners), efficiency
to reach nodes• Best results for openness, extroversion and agreeableness
traits (mean squared error < .7)
9.2.2012 32Matemaattis-luonnontieteellinen tiedekunta / Henkilön nimi / Esityksen nimi
Personality Detection
www.helsinki.fi/yliopisto
Summary
9.2.2012 33Matemaattis-luonnontieteellinen tiedekunta / Henkilön nimi / Esityksen nimi
http://www.youtube.com/watch?v=2aEPkyOBtRo
www.helsinki.fi/yliopisto
• Mobile networks• Divided into base stations and cells
• Call detail record• Record that is generated by the network when a call or
other communication service is used
• CDR-based social network analysis• Communication patterns can be used to construct
social network structure between people• Features such as degree, centrality, subgraph density
etc. can be used to profile individuals
9.2.2012 34Matemaattis-luonnontieteellinen tiedekunta / Henkilön nimi / Esityksen nimi
Summary
www.helsinki.fi/yliopisto
• CDR-based mobility analysis• Area of influence, diameter and radius of gyration
features that characterize the spatial spread of an individual’s communication and movement patterns
• Places can be identified analogously to the approaches used on coordinate data
• User modeling• Socioeconomic prediction• Personality detection• …
9.2.2012 35Matemaattis-luonnontieteellinen tiedekunta / Henkilön nimi / Esityksen nimi
Summary
www.helsinki.fi/yliopisto
• Isaacman, S.; Becker, R.; Cáceres, R.; Kobourov, S.; Martonosi, M.; Rowland, J. & Varshavsky, A., Identifying Important Places in People's Lives from Cellular Network Data, Proceedings of the 9th International Conferece on Pervasive Computing (Pervasive), 2011, 133-151
• Becker, R. A.; Caceres, R.; Hanson, K.; Loh, J. M.; Urbanek, S.; Varshavsky, A. & Volinsky, C., Route classification using cellular handoff patterns, Proceedings of the 13th international conference on Ubiquitous computing, ACM, 2011, 123-132
• Becker, R. A.; Caceres, R.; Hanson, K.; Loh, J. M.; Urbanek, S.; Varshavsky, A. & Volinsky, C., A Tale of One City: Using Cellular Network Data for Urban PlanningIEEE Pervasive Computing, IEEE Computer Society, 2011, 10, 18-26
• Soto, V. & Fras-Martnez, E., Automated land use identification using cell-phone records. Proceedings of the 3rd ACM international workshop on MobiArch (HotPlanet), ACM, 2011, 17-22
• Soto, V.; Frias-Martinez, V.; Virseda, J. & Frias-Martinez, E., Prediction of Socioeconomic Levels Using Cell Phone Records, Proceedings of the 19th International Conference on User Modeling, Adaption and Personalization (UMAP), 2011
• Calabrese, F.; Pereira, F. C.; Lorenzo, G. D.; Liu, L. & Latti, C., The Geography of Taste: Analyzing Cell-Phone Mobility and Social Events, Proceedings of the 8th International Conference on Pervasive Computing (Pervasive), Springer, 2010, 6030, 22-37
9.2.2012 36Matemaattis-luonnontieteellinen tiedekunta / Henkilön nimi / Esityksen nimi
Literature
www.helsinki.fi/yliopisto
• Song, C.; Qu, Z.; Blumm, N. & Barabási, A.-L., Limits of Predictability in Human Mobility, Science, 2010, 19, 1018-1021
• González, M. C.; Hidalgo, C. A. & Barabási, A.-L., Understanding individual human mobility patterns, Nature, 2008, 453, 779-782
• Lazer, D.; Adamic, A. P. L.; Aral, S.; Barabási, A.-L.; Brewer, D.; Christakis, N.; Contractor, N.; Fowler, J.; Gutmann, M.; Jebara, T.; King, G.; Macy, M.; 2, D. R. & Alstyne, M. V., Computational Social Science, Science, 2009, 323, 721-723
• Eagle, N. & Pentland, A., Reality mining: sensing complex social systemsPersonal and Ubiquitous Computing, 2006, 10, 255-268
• Vieira, M. R.; Frías-Martínez, V.; Oliver, N. & Frías-Martínez, E., Characterizing Dense Urban Areas from Mobile Phone-Call Data: Discovery and Social DynamicsProceedings of the 2010 IEEE Second International Conference on Social Computing, IEEE, 2010, 241-248
• Vieira, M. R.; Frias-Martinez, E.; Bakalov, P.; Frias-Martinez, V. & Tsotras, V. J.Querying Spatio-temporal Patterns in Mobile Phone-Call DatabasesProceedings of the 11th International Conference on Mobile Data Management (MDM), IEEE, 2010, 239-248
• Calabrese, F.; Di Lorenzo, G.; Liu, L. & Ratti, C.Estimating Origin-Destination Flows Using Mobile Phone Location DataIEEE Pervasive Computing, 2011, 10, 36-44
9.2.2012 37Matemaattis-luonnontieteellinen tiedekunta / Henkilön nimi / Esityksen nimi
Literature