Embed Size (px)
Citation preview

Argonne Training Program on Extreme-Scale Computing (ATPESC)
Data Analysis and Visualization

ATPESC 2017, July 30 – August 11, 2017 2
Visualization & Data Analysis Time Title of presentation Lecturer
8:30 am Visualization Introduction Mike Papka, Joe Insley, Silvio Rizzi, ANL
9:30 am Large Scale Visualization with ParaView (Presentation) Dan Lipsa, Kitware
10:30 am Break
11:00 am Large Scale Visualization with ParaView (Hands-on Exercises) Dan Lipsa, Kitware
12:00 pm Visualization and Analysis of Massive Data with VisIt (Presentation) Cyrus Harrison, LLNL
12:30 pm Lunch and Hands-on Exercises
1:30 pm Visualization and Analysis of Massive Data with VisIt (Hands-on Exercises) Cyrus Harrison, LLNL
3:00 pm Break
3:30 pm Scalable Molecular Visualization and Analysis Tools in VMD John Stone, UIUC
4:30 pm Exploring Visualization with Jupyter Notebooks Mike Papka, Joe Insley, Silvio Rizzi, ANL
5:30 pm Dinner Talk: Big Data Brain Maps at Argonne National Laboratory Bobby Kasthuri
6:30 pm Hands-on Exercises

Argonne Training Program on Extreme-Scale Computing (ATPESC)
Mike Papka Joe Insley Silvio Rizzi Argonne Leadership Computing Facility Argonne National Laboratory Q Center, St. Charles, IL (USA) August 10, 2017
Visualization
Introduction

ATPESC 2017, July 30 – August 11, 2017 4
Here’s the plan…
• Examples of visualizations • Visualization resources • Visualization tools and formats • Data representations • Annotation and movie creation • Visualization for debugging • In-Situ Visualization and Analysis

ATPESC 2017, July 30 – August 11, 2017 5 5 Ultravis '15 | Nov 16, 2015
Anterior Cerebral
Middle Cerebral
Aneurysm
Basilar
Vertebral
Left Interior Carotid Artery
Right Interior Carotid Artery
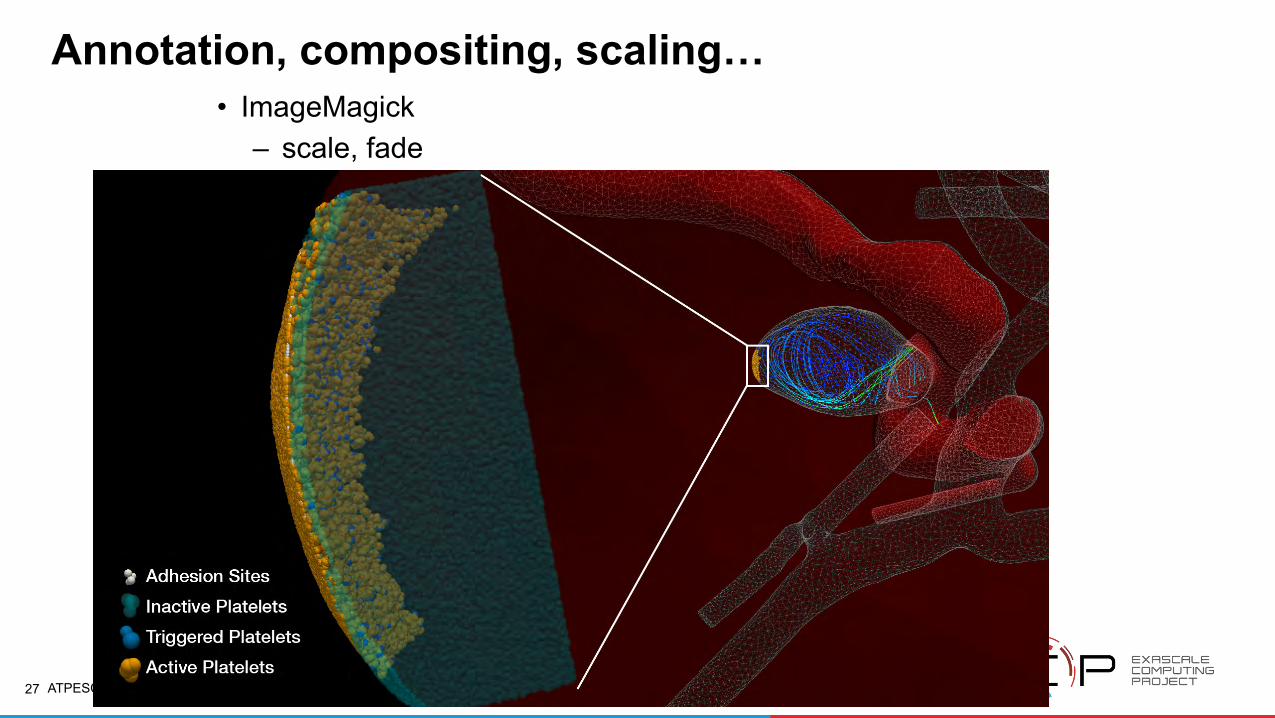
Multi-Scale Simulation / Visualization Arterial Blood Flow
Platelets
Data courtesy of: George Karniadakis
and Leopold Grinberg, Brown University

ATPESC 2017, July 30 – August 11, 2017 6
Climate Data courtesy of: Mark Taylor, Sandia National Laboratory; Rob Jacob, Argonne National Laboratory; Warren Washington, National Center for Atmospheric Research

ATPESC 2017, July 30 – August 11, 2017 7
Data courtesy of: Anurag Gupta and Umesh Paliath, General Electric Global Research
Aerospace (Jet Nozzle Noise)

ATPESC 2017, July 30 – August 11, 2017 8
Materials Science / Molecular
Data courtesy of: Jeff Greeley, Nichols Romero, Argonne National Laboratory
Data courtesy of: Advanced Photon Source, Argonne National Laboratory
Data courtesy of: Subramanian
Sankaranarayanan, Argonne National
Laboratory
ATPESC 2017, July 30 – August 11, 2017 9
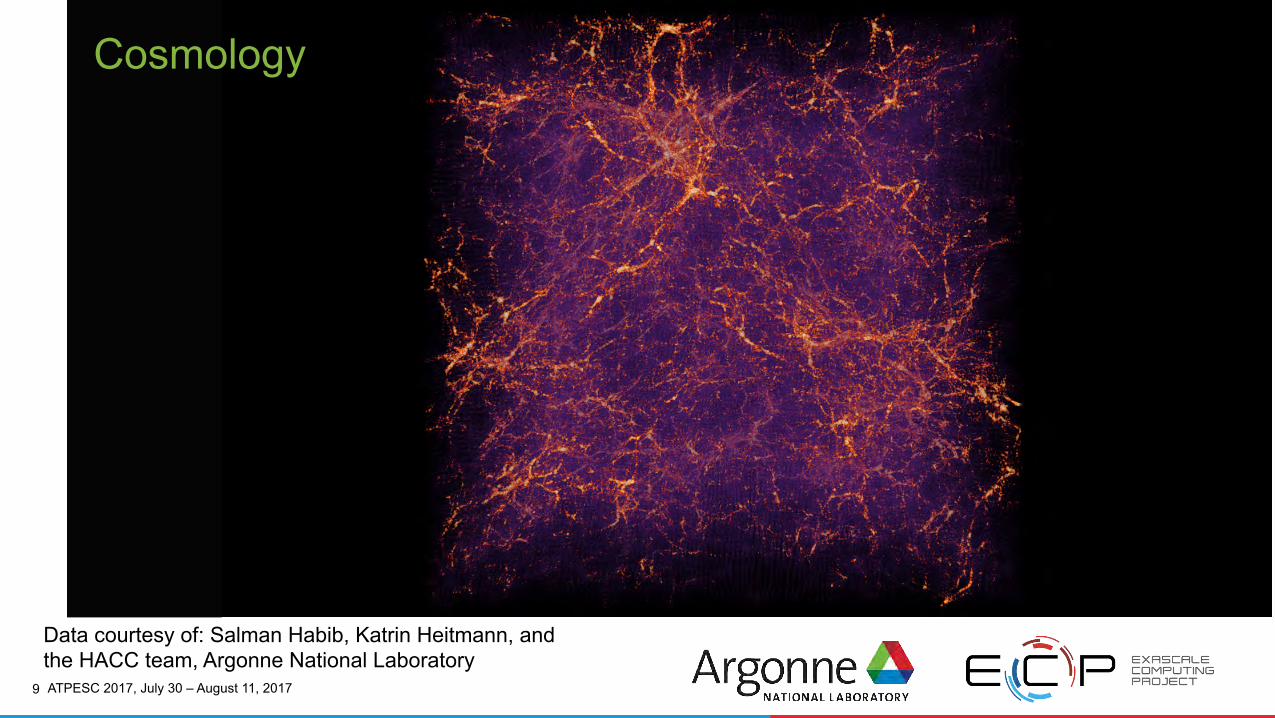
Data courtesy of: Salman Habib, Katrin Heitmann, and the HACC team, Argonne National Laboratory
Cosmology
ATPESC 2017, July 30 – August 11, 2017 10
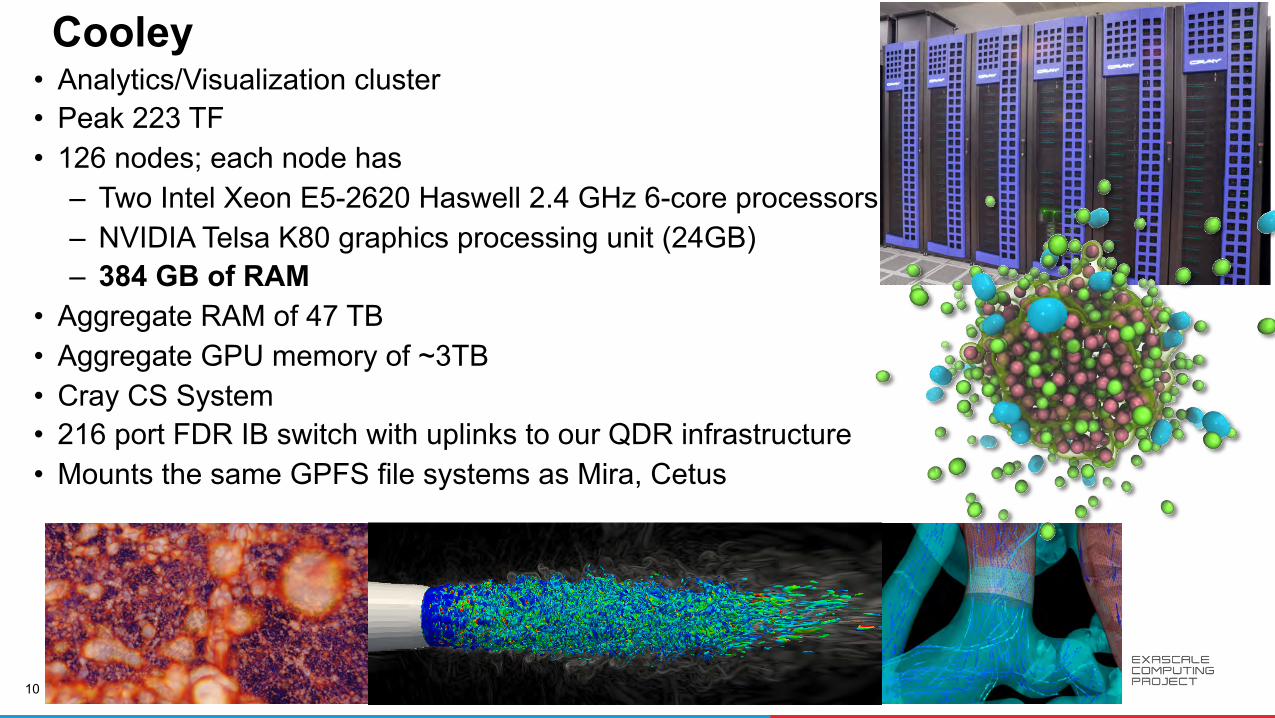
Cooley • Analytics/Visualization cluster • Peak 223 TF • 126 nodes; each node has
– Two Intel Xeon E5-2620 Haswell 2.4 GHz 6-core processors – NVIDIA Telsa K80 graphics processing unit (24GB) – 384 GB of RAM
• Aggregate RAM of 47 TB • Aggregate GPU memory of ~3TB • Cray CS System • 216 port FDR IB switch with uplinks to our QDR infrastructure • Mounts the same GPFS file systems as Mira, Cetus

ATPESC 2017, July 30 – August 11, 2017 11
VISUALIZATION TOOLS AND DATA FORMATS

ATPESC 2017, July 30 – August 11, 2017 12
All Sorts of Tools
• Visualization Applications – VisIt – ParaView – EnSight
• Domain Specific – VMD, PyMol, Ovito
• APIs – VTK: visualization – ITK: segmentation &
registration
• GPU performance – vl3: shader-based volume
rendering • Analysis Environments
– Matlab – Parallel R
• Utilities – GnuPlot – ImageMagick

ATPESC 2017, July 30 – August 11, 2017 13
ParaView & VisIt vs. vtk • ParaView & VisIt
– General purpose visualization applications – GUI-based – Scriptable – Extendable – Built on top of vtk (largely)
• vtk – Programming environment / API – Additional capabilities, finer control – Smaller memory footprint – Requires more expertise (build custom applications)
ATPESC 2017, July 30 – August 11, 2017 14
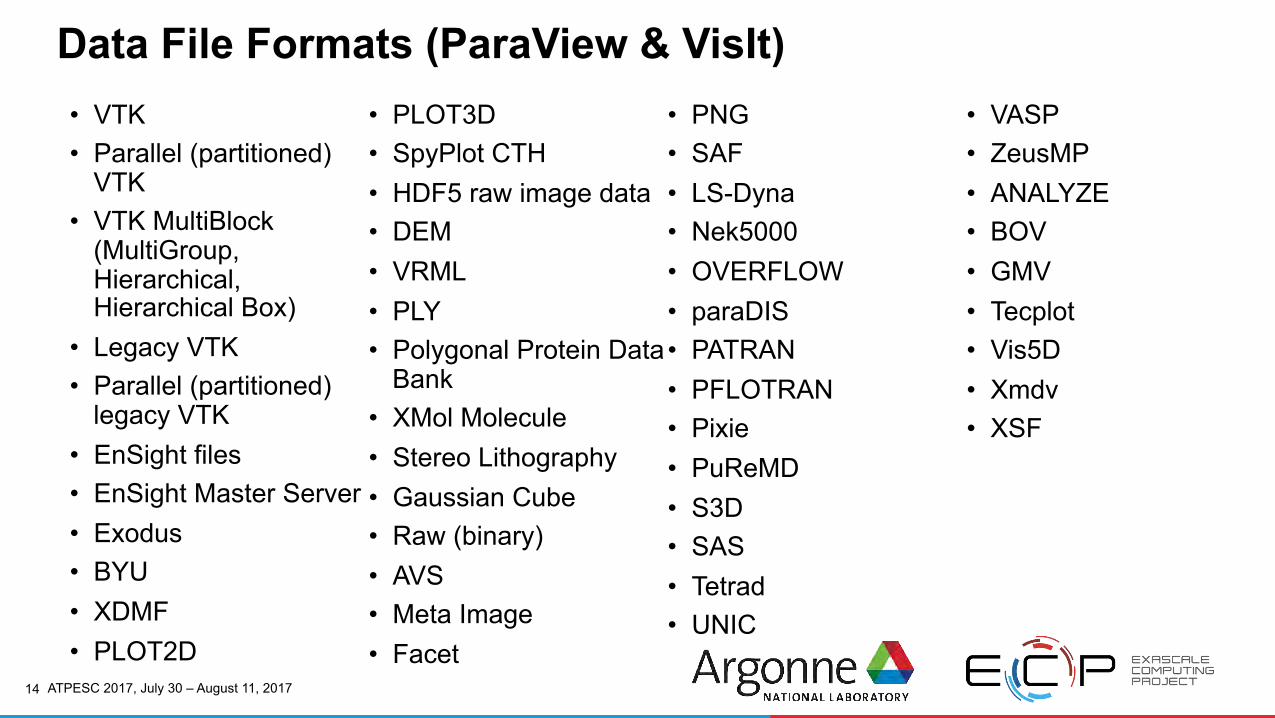
Data File Formats (ParaView & VisIt) • VTK • Parallel (partitioned)
VTK • VTK MultiBlock
(MultiGroup, Hierarchical, Hierarchical Box)
• Legacy VTK • Parallel (partitioned)
legacy VTK • EnSight files • EnSight Master Server • Exodus • BYU • XDMF • PLOT2D
• PLOT3D • SpyPlot CTH • HDF5 raw image data • DEM • VRML • PLY • Polygonal Protein Data
Bank • XMol Molecule • Stereo Lithography • Gaussian Cube • Raw (binary) • AVS • Meta Image • Facet
• PNG • SAF • LS-Dyna • Nek5000 • OVERFLOW • paraDIS • PATRAN • PFLOTRAN • Pixie • PuReMD • S3D • SAS • Tetrad • UNIC
• VASP • ZeusMP • ANALYZE • BOV • GMV • Tecplot • Vis5D • Xmdv • XSF

ATPESC 2017, July 30 – August 11, 2017 15
Data Wrangling • XDMF
– XML wrapper around HDF5 data – API for writing from simulation code – Can define
• data sets, subsets, hyperslabs • vtk
– Could add to your simulation code – Can write small utilities to convert data
• Use your own read routines • Write vtk data structures
– C++ and Python bindings

ATPESC 2017, July 30 – August 11, 2017 16
• Format – Existing tools support many flavors – Use one of these formats – Use (or write) a format converter – Write a custom reader for existing tool – Write your own custom vis tool
• Serial vs. Parallel/Partitioned – Single big file vs. many small files: middle ground generally
best • vtk data types • XDMF for HDF5 (VisIt and ParaView) • Custom
Data Organization
16

ATPESC 2017, July 30 – August 11, 2017 17
Data Organization • Serial vs. Parallel/Partitioned
– Performance trade-offs • vtk/paraview: serial files all data read on head node, partitioned and distributed • vtk/paraview: parallel files: serial files partitioned
Performance example: • Single serial .vtu file (unstructured grid)
– Data size: ~3.8GB – Read time on 64 processes: > 15 minutes
• most of this was spent partitioning and distributing
• Partitioned .pvtu file (unstructured grid) – Data size: ~8.7GB (64 partitions) – Read time on 64 processes: < 1 second
17

ATPESC 2017, July 30 – August 11, 2017 18
DATA REPRESENTATIONS

ATPESC 2017, July 30 – August 11, 2017 19
Data Representations: Volume Rendering

ATPESC 2017, July 30 – August 11, 2017 20
Data Representations: Glyphs • 2D or 3D geometric object to represent
point data
• Location dictated by coordinate – 3D location on mesh – 2D position in table/graph
• Attributes graphical entity dictated by attributes of a data – color, size, orientation
ATPESC 2017, July 30 – August 11, 2017 21
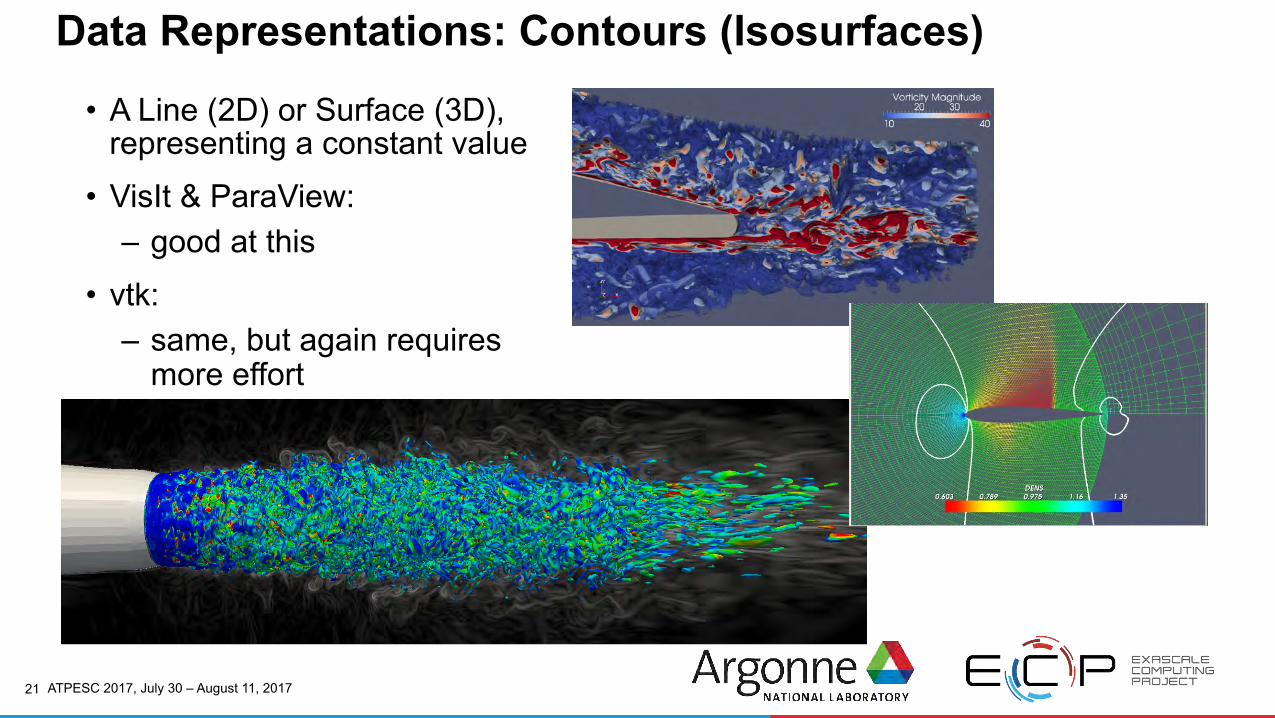
Data Representations: Contours (Isosurfaces)
• A Line (2D) or Surface (3D), representing a constant value
• VisIt & ParaView: – good at this
• vtk: – same, but again requires
more effort

ATPESC 2017, July 30 – August 11, 2017 22
Data Representations: Cutting Planes • Slice a plane through the data
– Can apply additional visualization methods to resulting plane
• VisIt & ParaView & vtk good at this
• VMD has similar capabilities for some data formats

ATPESC 2017, July 30 – August 11, 2017 23
Data Representations: Streamlines • From vector field on a mesh (needs connectivity)
– Show the direction an element will travel in at any point in time.
• VisIt & ParaView & vtk good at this

ATPESC 2017, July 30 – August 11, 2017 24
Molecular Dynamics Visualization • VMD:
– Lots of domain-specific representations
– Many different file formats – Animation – Scriptable – Not parallel
• VisIt & ParaView: – Limited support for these types
of representations, but improving
• VTK: – Anything’s possible if you try hard
enough

ATPESC 2017, July 30 – August 11, 2017 25
ANNOTATION AND MOVIE CREATION

ATPESC 2017, July 30 – August 11, 2017 26
Annotation, compositing, scaling… • ImageMagick
– convert, composite, montage, etc.
convert comp-test-in-3200x2000.png –font Arial.ttf -pointsize 40 -gravity northwest -fill black -draw 'rectangle 18,103,821,157' legend-big.png -geometry +20+105 -composite -fill black -draw 'rectangle 2375,103,3178,157' legend-big.png -geometry +2377+105 -composite -fill black -draw 'rectangle 18,1815,821,1869' legend-big.png -geometry +20+1817 -composite -fill black -draw 'rectangle 2375,1815,3178,1869' legend-big.png -geometry +2377+1817 -composite -stroke '#000F' -strokewidth 3 -annotate +13+155 '0.0' -stroke none -fill white -annotate +13+155 '0.0' -stroke '#000F' -strokewidth 3 -annotate +755+155 '25.0' -stroke none -fill white -annotate +755+155 '25.0' -pointsize 40 -gravity northeast -stroke '#000F' -strokewidth 3 -annotate +775+155 '0.0' -stroke none -fill white -annotate +775+155 '0.0' -stroke '#000F' -strokewidth 3 -annotate +20+155 '83.4' -stroke none -fill white -annotate +20+155 '83.4' -gravity southwest -stroke '#000F' -strokewidth 3 -annotate +13+83 '0.0' -stroke none -fill white -annotate +13+83 '0.0' -stroke '#000F' -strokewidth 3 -annotate +702+83 '5.0e-27' -stroke none -fill white -annotate +702+83 '5.0e-27' -gravity southeast -stroke '#000F' -strokewidth 3 -annotate +775+83 '0.0' -stroke none -fill white -annotate +775+83 '0.0' -stroke '#000F' -strokewidth 3 -annotate +28+83 '5.0e-5' -stroke none -fill white -annotate +28+83 '5.0e-5' -depth 8 comp-test-image02.png
convert comp-test-in-3200x2000.png –font Arial.ttf -pointsize 40 -gravity northwest -fill black -draw 'rectangle 18,103,821,157' legend-big.png -geometry +20+105 -composite -fill black -draw 'rectangle 2375,103,3178,157' legend-big.png -geometry +2377+105 -composite -fill black -draw 'rectangle 18,1815,821,1869' legend-big.png -geometry +20+1817 -composite -fill black -draw 'rectangle 2375,1815,3178,1869' legend-big.png -geometry +2377+1817 -composite -stroke '#000F' -strokewidth 3 -annotate +13+155 '0.0' -stroke none -fill white -annotate +13+155 '0.0' -stroke '#000F' -strokewidth 3 -annotate +755+155 '25.0' -stroke none -fill white -annotate +755+155 '25.0' -pointsize 40 -gravity northeast -stroke '#000F' -strokewidth 3 -annotate +775+155 '0.0' -stroke none -fill white -annotate +775+155 '0.0' -stroke '#000F' -strokewidth 3 -annotate +20+155 '83.4' -stroke none -fill white -annotate +20+155 '83.4' -gravity southwest -stroke '#000F' -strokewidth 3 -annotate +13+83 '0.0' -stroke none -fill white -annotate +13+83 '0.0' -stroke '#000F' -strokewidth 3 -annotate +702+83 '5.0e-27' -stroke none -fill white -annotate +702+83 '5.0e-27' -gravity southeast -stroke '#000F' -strokewidth 3 -annotate +775+83 '0.0' -stroke none -fill white -annotate +775+83 '0.0' -stroke '#000F' -strokewidth 3 -annotate +28+83 '5.0e-5' -stroke none -fill white -annotate +28+83 '5.0e-5' -depth 8 comp-test-image02.png
convert comp-test-in-3200x2000.png –font Arial.ttf -pointsize 40 -gravity northwest -fill black -draw 'rectangle 18,103,821,157' legend-big.png -geometry +20+105 -composite -fill black -draw 'rectangle 2375,103,3178,157' legend-big.png -geometry +2377+105 -composite -fill black -draw 'rectangle 18,1815,821,1869' legend-big.png -geometry +20+1817 -composite -fill black -draw 'rectangle 2375,1815,3178,1869' legend-big.png -geometry +2377+1817 -composite -stroke '#000F' -strokewidth 3 -annotate +13+155 '0.0' -stroke none -fill white -annotate +13+155 '0.0' -stroke '#000F' -strokewidth 3 -annotate +755+155 '25.0' -stroke none -fill white -annotate +755+155 '25.0' -pointsize 40 -gravity northeast -stroke '#000F' -strokewidth 3 -annotate +775+155 '0.0' -stroke none -fill white -annotate +775+155 '0.0' -stroke '#000F' -strokewidth 3 -annotate +20+155 '83.4' -stroke none -fill white -annotate +20+155 '83.4' -gravity southwest -stroke '#000F' -strokewidth 3 -annotate +13+83 '0.0' -stroke none -fill white -annotate +13+83 '0.0' -stroke '#000F' -strokewidth 3 -annotate +702+83 '5.0e-27' -stroke none -fill white -annotate +702+83 '5.0e-27' -gravity southeast -stroke '#000F' -strokewidth 3 -annotate +775+83 '0.0' -stroke none -fill white -annotate +775+83 '0.0' -stroke '#000F' -strokewidth 3 -annotate +28+83 '5.0e-5' -stroke none -fill white -annotate +28+83 '5.0e-5' -depth 8 comp-test-image02.png
convert comp-test-in-3200x2000.png –font Arial.ttf -pointsize 40 -gravity northwest -fill black -draw 'rectangle 18,103,821,157' legend-big.png -geometry +20+105 -composite -fill black -draw 'rectangle 2375,103,3178,157' legend-big.png -geometry +2377+105 -composite -fill black -draw 'rectangle 18,1815,821,1869' legend-big.png -geometry +20+1817 -composite -fill black -draw 'rectangle 2375,1815,3178,1869' legend-big.png -geometry +2377+1817 -composite -stroke '#000F' -strokewidth 3 -annotate +13+155 '0.0' -stroke none -fill white -annotate +13+155 '0.0' -stroke '#000F' -strokewidth 3 -annotate +755+155 '25.0' -stroke none -fill white -annotate +755+155 '25.0' -pointsize 40 -gravity northeast -stroke '#000F' -strokewidth 3 -annotate +775+155 '0.0' -stroke none -fill white -annotate +775+155 '0.0' -stroke '#000F' -strokewidth 3 -annotate +20+155 '83.4' -stroke none -fill white -annotate +20+155 '83.4' -gravity southwest -stroke '#000F' -strokewidth 3 -annotate +13+83 '0.0' -stroke none -fill white -annotate +13+83 '0.0' -stroke '#000F' -strokewidth 3 -annotate +702+83 '5.0e-27' -stroke none -fill white -annotate +702+83 '5.0e-27' -gravity southeast -stroke '#000F' -strokewidth 3 -annotate +775+83 '0.0' -stroke none -fill white -annotate +775+83 '0.0' -stroke '#000F' -strokewidth 3 -annotate +28+83 '5.0e-5' -stroke none -fill white -annotate +28+83 '5.0e-5' -depth 8 comp-test-image02.png
convert comp-test-in-3200x2000.png –font Arial.ttf -pointsize 40 -gravity northwest -fill black -draw 'rectangle 18,103,821,157' legend-big.png -geometry +20+105 -composite -fill black -draw 'rectangle 2375,103,3178,157' legend-big.png -geometry +2377+105 -composite -fill black -draw 'rectangle 18,1815,821,1869' legend-big.png -geometry +20+1817 -composite -fill black -draw 'rectangle 2375,1815,3178,1869' legend-big.png -geometry +2377+1817 -composite -stroke '#000F' -strokewidth 3 -annotate +13+155 '0.0' -stroke none -fill white -annotate +13+155 '0.0' -stroke '#000F' -strokewidth 3 -annotate +755+155 '25.0' -stroke none -fill white -annotate +755+155 '25.0' -pointsize 40 -gravity northeast -stroke '#000F' -strokewidth 3 -annotate +775+155 '0.0' -stroke none -fill white -annotate +775+155 '0.0' -stroke '#000F' -strokewidth 3 -annotate +20+155 '83.4' -stroke none -fill white -annotate +20+155 '83.4' -gravity southwest -stroke '#000F' -strokewidth 3 -annotate +13+83 '0.0' -stroke none -fill white -annotate +13+83 '0.0' -stroke '#000F' -strokewidth 3 -annotate +702+83 '5.0e-27' -stroke none -fill white -annotate +702+83 '5.0e-27' -gravity southeast -stroke '#000F' -strokewidth 3 -annotate +775+83 '0.0' -stroke none -fill white -annotate +775+83 '0.0' -stroke '#000F' -strokewidth 3 -annotate +28+83 '5.0e-5' -stroke none -fill white -annotate +28+83 '5.0e-5' -depth 8 comp-test-image02.png
convert comp-test-in-3200x2000.png –font Arial.ttf -pointsize 40 -gravity northwest -fill black -draw 'rectangle 18,103,821,157' legend-big.png -geometry +20+105 -composite -fill black -draw 'rectangle 2375,103,3178,157' legend-big.png -geometry +2377+105 -composite -fill black -draw 'rectangle 18,1815,821,1869' legend-big.png -geometry +20+1817 -composite -fill black -draw 'rectangle 2375,1815,3178,1869' legend-big.png -geometry +2377+1817 -composite -stroke '#000F' -strokewidth 3 -annotate +13+155 '0.0' -stroke none -fill white -annotate +13+155 '0.0' -stroke '#000F' -strokewidth 3 -annotate +755+155 '25.0' -stroke none -fill white -annotate +755+155 '25.0' -pointsize 40 -gravity northeast -stroke '#000F' -strokewidth 3 -annotate +775+155 '0.0' -stroke none -fill white -annotate +775+155 '0.0' -stroke '#000F' -strokewidth 3 -annotate +20+155 '83.4' -stroke none -fill white -annotate +20+155 '83.4' -gravity southwest -stroke '#000F' -strokewidth 3 -annotate +13+83 '0.0' -stroke none -fill white -annotate +13+83 '0.0' -stroke '#000F' -strokewidth 3 -annotate +702+83 '5.0e-27' -stroke none -fill white -annotate +702+83 '5.0e-27' -gravity southeast -stroke '#000F' -strokewidth 3 -annotate +775+83 '0.0' -stroke none -fill white -annotate +775+83 '0.0' -stroke '#000F' -strokewidth 3 -annotate +28+83 '5.0e-5' -stroke none -fill white -annotate +28+83 '5.0e-5' -depth 8 comp-test-image02.png
ATPESC 2017, July 30 – August 11, 2017 27
Annotation, compositing, scaling… • ImageMagick
– scale, fade
ATPESC 2017, July 30 – August 11, 2017 28
Movie Creation
• VisIt and ParaView can spit out a movie file (.avi, etc.) – can also spit out individual images
• Combine multiple segments of frames – Create a directory of symbolic links to all frames in order
• ffmpeg: Movie encoding – ffmpeg –sameq –i frame.%04d.png movie.mp4

ATPESC 2017, July 30 – August 11, 2017 29
VISUALIZATION FOR DEBUGGING

ATPESC 2017, July 30 – August 11, 2017 30
Visualization for Debugging
ATPESC 2017, July 30 – August 11, 2017 31
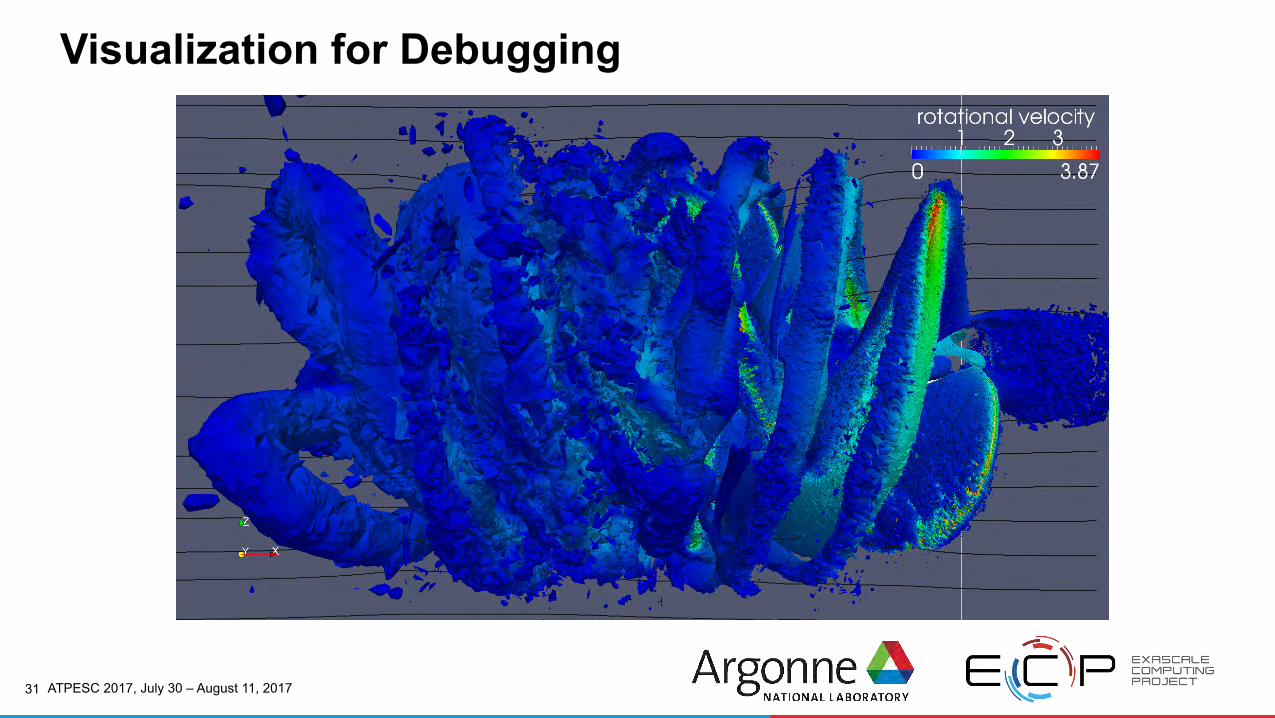
Visualization for Debugging

ATPESC 2017, July 30 – August 11, 2017 32
Visualization as Diagnostics: Color by Thread ID

ATPESC 2017, July 30 – August 11, 2017 33
IN-SITU VISUALIZATION AND ANALYSIS

ATPESC 2017, July 30 – August 11, 2017 34
Multiple in-situ infrastructures
LibSim

ATPESC 2017, July 30 – August 11, 2017 35
Can WE….
• Enable use of any in situ framework? • Develop analysis routines that are portable between codes? • Make it easy to use?
OUR APPROACH
• Data model – to pass data between Simulation & Analysis
• API – for instrumenting simulation and analysis codes

ATPESC 2017, July 30 – August 11, 2017 36
Data Model: VTK
• Used by ParaView/Catalyst and VisIt/Libsim • Supports common scientific dataset types • On going independent efforts to evolve for exascale • Supports using simulation memory directly (zero-copy) for
multiple memory layouts
http://www.vtk.org/
DATA MODEL
simulation analysis analysis analysis

ATPESC 2017, July 30 – August 11, 2017 37
Sensei: API: Components
bridge
data adaptor
analysisadaptor
simulation analysis

ATPESC 2017, July 30 – August 11, 2017 38
INSTRUMENTATION TASKS
FOR SIMULATION
• Write a Data Adaptor to map simulation data to VTK data model
• Write a Bridge to define API entry points for simulation
FOR ANALYSIS
• Write analysis adaptor that uses Data Adaptor API to access Data
• Transform data, if needed and invoke analysis

ATPESC 2017, July 30 – August 11, 2017 39
Adding A catalyst Python Script analysis
• 13 lines of CMake code changes • 18 lines of C++ code • In situ work can be specified via SENSEI XML
ATPESC 2017, July 30 – August 11, 2017 40
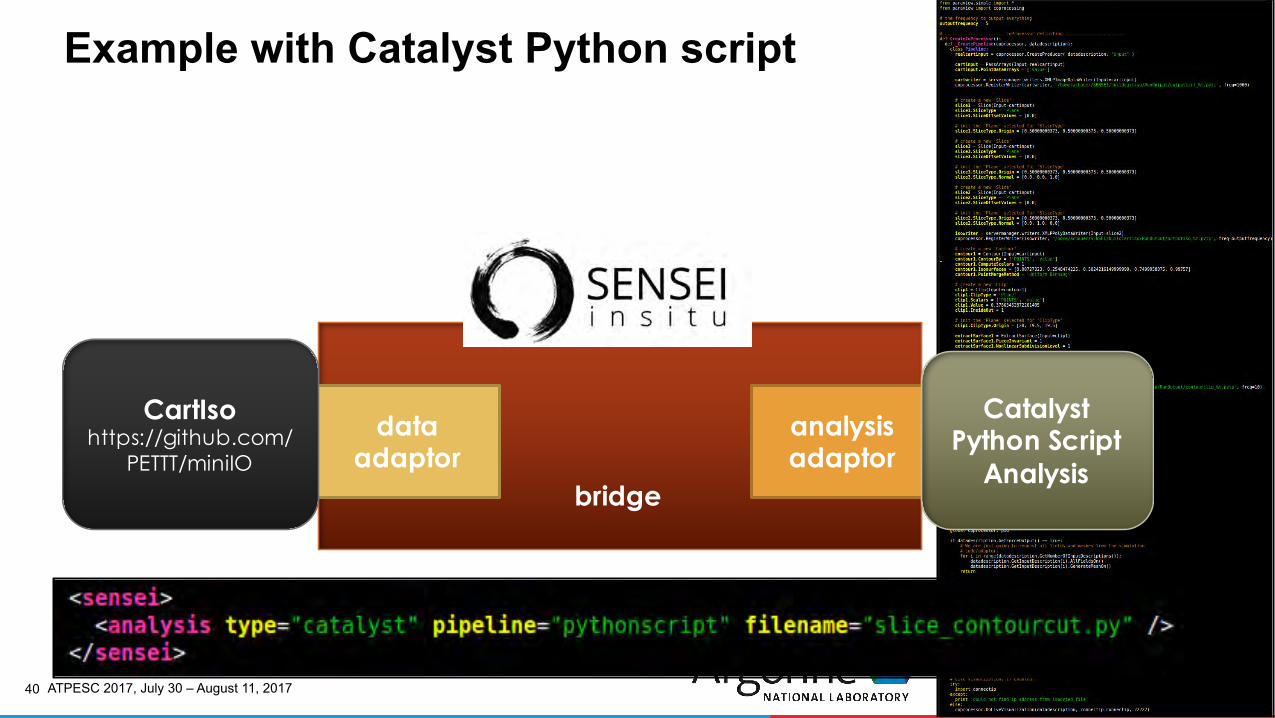
Example with Catalyst Python script
bridge
data adaptor
analysisadaptor
CartIsohttps://github.com/
PETTT/miniIO
Catalyst Python Script
Analysis

ATPESC 2017, July 30 – August 11, 2017 41
Catalyst Live through python script
bridgedata
adaptoranalysisadaptor
CartIsohttps://github.com/PETTT/miniIO
Catalyst Python Script
Analysis ParaViewServer

Pipeline Browser J_
bl builtin:
(Eopertiei] Information Information
� Statistics
Type: NA
Number of Cells: NA
Number of Points: NA
Memory: NA
� Data Arrays
Name !Data Type
� I
�
Bounds X range: NA
Y range: NA
Z ranqe: NA
• I ·;
-
I Data Ra
I � -
1�
D Time: �I o ____ �H��ffi_: D .. +X
'· . -X +Y -Y +Z -z (\ » �»
+90 �
camug checkstreamlines imageblanking makeverts


ATPESC 2017, July 30 – August 11, 2017 44
QUESTIONS?
Silvio Rizzi [email protected]
Joe Insley [email protected]
Mike Papka [email protected]