Embed Size (px)
Citation preview
Data & Analytics Investment Banking GroupMobility, Supply Chain, and Logistics TechnologyM AR K E T U P D AT E | J U N E 2 0 2 1

2
Representative Industry Subsectors Covered
Mobility, Supply Chain, and Logistics Technology—Market Update
Dealership Technology and Software
Aftermarket Repair / Parts Data and Marketplaces
Ground Transportation Fleet Management
Logistics and Supply Chain Technology
Mobility and Public Transportation Planning
Digital Freight Matching Platforms
Telematics and Connected Car
Maritime Fleet Management
Dear Clients and Friends,
Houlihan Lokey is pleased to present the Q2 ’21 edition of its Mobility, Supply Chain, and Logistics Technology Market Update. We have continued adapting to a recovering market and remain active in advising our clients as they mitigate M&A, financing, and other strategic initiatives. We have included industry insights, select recent transaction announcements, and a public markets overview to help you stay ahead in our dynamic and constantly evolving industry.
Macro-Level Themes and Industry Trends:
Companies at all stages in the mobility, supply chain, and logistics technology industry have historically been late adopters of technology and software solutions, but they are increasingly prioritizing capital investment and retooling operations to improve workflow efficiencies, drive digital transformation, and build out competencies to create competitive advantages.
However, despite historical softness in the level of technology adoption by incumbents, there continues to be technological innovation spurred by new startup activity across the landscape that continues to disrupt more established operating models and capabilities.
The collective mobility, supply chain, and logistics technology industry represents a massive market category with subsectors that are impacted differently depending on go -to-market strategies, end-market focus, distribution channels, and revenue models.
Market Activity:
M&A and financing activity across the sector demonstrated incredible resiliency throughout Q1 2021 despite COVID -19 and macro headwinds.
‒ ~$31.1 billion in Q1 2021 financing volume was ~182% higher than 2020 levels
‒ ~$39.1 billion in Q1 2021 M&A, putting the industry on track to far exceed the ~$106.3 billion in value achieved in 2020
Houlihan Lokey believes that M&A and financing activity across the mobility, supply chain, and logistics technology industry will continue unabated through the remainder of 2021, as technology adoption has accelerated and is anticipated to continue through the COVID-19 recovery and beyond.
We hope you enjoy this report and welcome the opportunity to connect or brainstorm on any current needs or sector topics. We look forward to staying in touch.
Regards,
Sources: Pitchbook.com, S&P Capital IQ.
Andrew AdamsGroup [email protected]+44 (0) 79 7384 5529
Tara Anand CarterManaging [email protected]+44 (0) 77 8712 5818
Shane [email protected]
Craig MuirManaging [email protected]
Kris HopkinsManaging [email protected]
Kapil [email protected]
Joe WatsonSenior Vice [email protected]
Tim MacholzSenior Vice [email protected]
Max SchrammVice [email protected]

Table of Contents
3
Page1. Houlihan Lokey Sector Expertise 42. Mobility, Supply Chain, and Logistics Technology Coverage 113. Appendix 19

Houlihan Lokey Sector Expertise
5
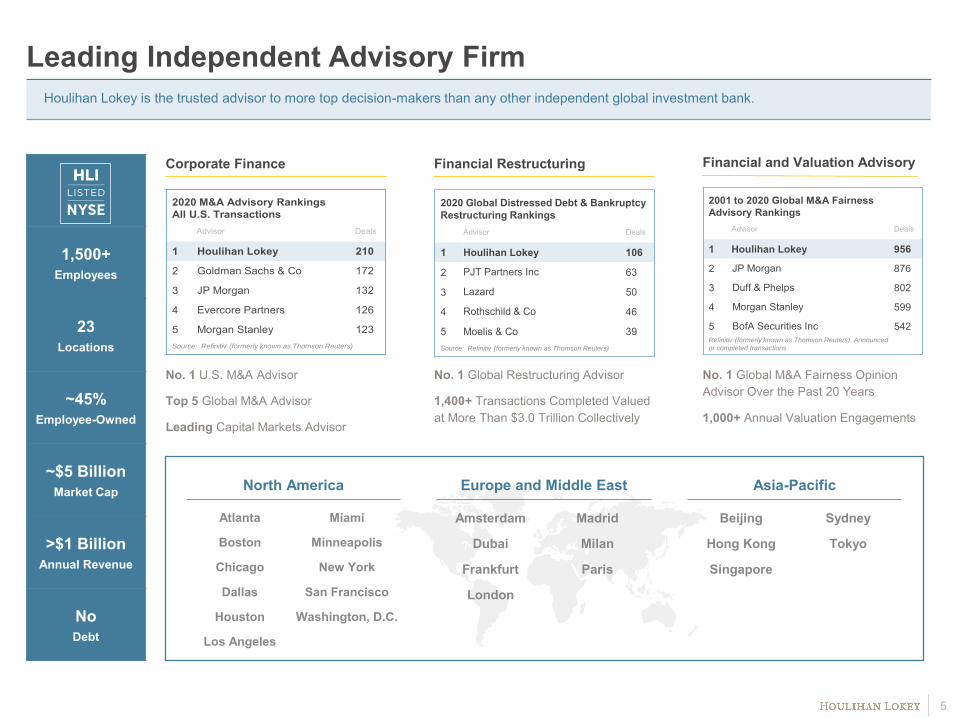
Leading Independent Advisory Firm
Corporate Finance
No. 1 U.S. M&A Advisor
Top 5 Global M&A Advisor
Leading Capital Markets Advisor
Financial and Valuation Advisory
No. 1 Global M&A Fairness Opinion Advisor Over the Past 20 Years
1,000+ Annual Valuation Engagements
No. 1 Global Restructuring Advisor
1,400+ Transactions Completed Valued at More Than $3.0 Trillion Collectively
Financial Restructuring
Houlihan Lokey is the trusted advisor to more top decision-makers than any other independent global investment bank.
1,500+Employees
23Locations
~45%Employee-Owned
~$5 BillionMarket Cap
>$1 BillionAnnual Revenue
NoDebt
North America
Atlanta
Boston
Chicago
Dallas
Houston
Los Angeles
Miami
Minneapolis
New York
San Francisco
Washington, D.C.
Asia-Pacific
Beijing
Hong Kong
Singapore
Sydney
Tokyo
Europe and Middle East
Amsterdam
Dubai
Frankfurt
London
Madrid
Milan
Paris
2020 M&A Advisory Rankings All U.S. Transactions
Advisor Deals
1 Houlihan Lokey 210
2 Goldman Sachs & Co 172
3 JP Morgan 132
4 Evercore Partners 126
5 Morgan Stanley 123Source: Refinitiv (formerly known as Thomson Reuters)
2001 to 2020 Global M&A Fairness Advisory Rankings
Advisor Deals
1 Houlihan Lokey 956
2 JP Morgan 876
3 Duff & Phelps 802
4 Morgan Stanley 599
5 BofA Securities Inc 542Refinitiv (formerly known as Thomson Reuters). Announced
or completed transactions.
2020 Global Distressed Debt & BankruptcyRestructuring Rankings
Advisor Deals
1 Houlihan Lokey 106
2 PJT Partners Inc 63
3 Lazard 50
4 Rothschild & Co 46
5 Moelis & Co 39Source: Refinitiv (formerly known as Thomson Reuters)

6
How Houlihan Lokey Can HelpOur firm is extremely well equipped to help our clients navigate uncertain times. We respond quickly to challenging situations and are constantly helping clients to analyze, structure, negotiate, and execute the best possible solutions from both strategic and financial perspectives.
Superior Work Product/ Technical Abilities
Creativity, Imagination, Tenacity, and Positivity
Deep, Industry-Specific Expertise
Senior-Level Commitment and
Dedication
Portfolio Valuation and Fund Advisory
Significant Experience With Financing Markets
Dominant in Special Situations and Restructuring
Corporate Finance
Transaction Opinions
Corporate Valuation Advisory Services
Transaction Advisory Services
Real Estate Valuation and Advisory
Dispute Resolution Consulting
Mergers and Acquisitions
Capital Markets
Private Funds Advisory
Board Advisory Services
We are widely recognized as a leading M&A advisor to the mid-cap and have long-standing relationships with capital providers, including commercial banks and other senior credit providers, insurance funds, asset managers, and mezzanine fund investors. Few other investment banks maintain the breadth of relationships and capital markets intelligence that we do.
Company Advisory
Creditor Advisory
We have the largest restructuring practice of any global investment bank. Since 1988, we have advised on more than 1,400 restructuring transactions (with aggregate debt claims in excess of $3.0 trillion). We served as an advisor in 12 of the largest 15 bankruptcies from 2000 to 2020.
Special Situations
Distressed M&A
Liability Management
Over nearly four decades, we have established ourselves as one of the largest financial and valuation advisory firms. Our transaction expertise and leadership in the field of valuation help inspire confidence in the financial executives, boards of directors, special committees, investors, and business owners we serve.
1
What We Offer
Financial Restructuring
2
Financial and Valuation Advisory
3
Why We Are Different
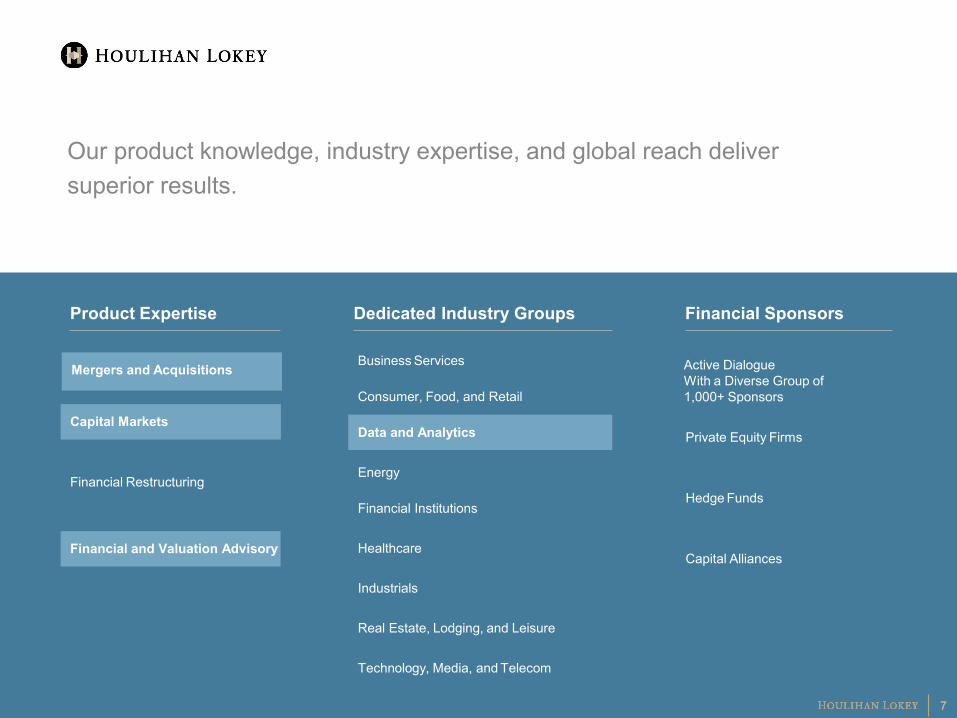
Our product knowledge, industry expertise, and global reach deliver superior results.
Financial SponsorsProduct Expertise
Mergers and Acquisitions
Capital Markets
Financial Restructuring
Financial and Valuation Advisory
Private Equity Firms
Hedge Funds
Capital Alliances
Active Dialogue With a Diverse Group of 1,000+ Sponsors
Dedicated Industry Groups
Consumer, Food, and Retail
Business Services
Energy
Healthcare
Industrials
Real Estate, Lodging, and Leisure
Technology, Media, and Telecom
Data and Analytics
7
Financial Institutions
7
Capital Markets

Best-in-Class Global Data and Analytics FranchiseAcross the data and analytics horizontal, we focus on nine primary verticals and have developed entrenched relationships with the most prominent strategics and financial sponsors.
Mobility, Supply Chain,
LogisticsFintech
Financial Information, Data,
and Analytics
Governance, Risk, and
Compliance Natural
Resources
Real Estate, Retail, and Facilities
B2B Information Services
Research, IP, and Legal
Education and Training
Ex
pe
rtis
e a
nd
Ca
pa
bilit
ies
Re
pre
se
nta
tiv
e R
ela
tio
ns
hip
s
Regtech, risk, and compliance
Fraud, AML, KYC, and sanctions
Enterprise and operational risk
EHS&S ESG CSR Certification
Financial data and analytics
Insurance data and analytics
Regtech, risk, and compliance
Buyside and sellside data and analytics
Wealth and alternatives data and analytics
Dealership technology and software
Fleet management and transportation logistics
Telematics and mobility risk management
Mobility and transportation planning
Aftermarkets parts and services marketplaces
Business data and analytics
Private company data and analytics
Macroeconomic research and forecasting
Marketing data, analytics, and software
B2B media and events
Pharma and healthcare
Education technology
K–12 Post-
secondary Professional
and continuing education
LMS CMS Workforce
Mortgage data, analytics, and software
Commercial and residential data and analytics
Construction and facilities
Retail analytics
Oil and gas Power,
renewables, and water
Agriculture and food
Weather
E-discovery Litigation
technology IP management/
research Document
management Contract
management Compliance
software Information
governance
Asset and wealth management
Banking and lending
Capital markets software
Exchanges and execution
Insurance Payments
8Note: Categories populated with illustrative companies, not exhaustive.
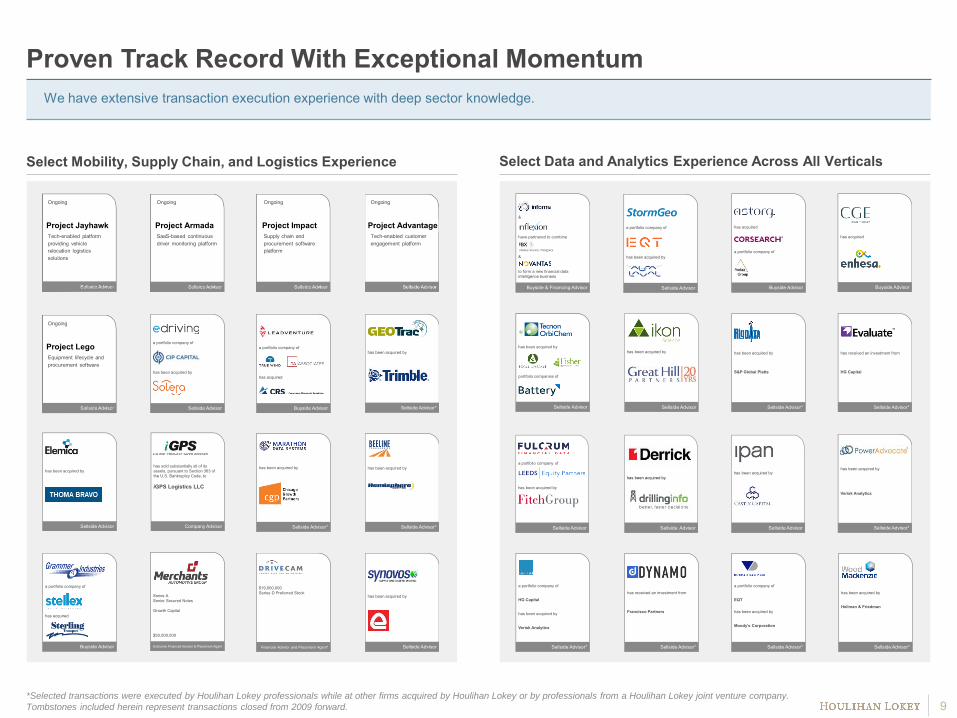
Proven Track Record With Exceptional Momentum
9
We have extensive transaction execution experience with deep sector knowledge.
Select Mobility, Supply Chain, and Logistics Experience Select Data and Analytics Experience Across All Verticals
*Selected transactions were executed by Houlihan Lokey professionals while at other firms acquired by Houlihan Lokey or by professionals from a Houlihan Lokey joint venture company.
Tombstones included herein represent transactions closed from 2009 forward.
Project ArmadaSaaS-based continuous driver monitoring platform
Ongoing
Project ImpactSupply chain and procurement software platform
Ongoing
Project AdvantageTech-enabled customer engagement platform
Ongoing
Project JayhawkTech-enabled platform providing vehicle relocation logistics solutions
Ongoing
Project LegoEquipment lifecycle and procurement software
Ongoing
has acquired
a portfolio company of
Buyside Advisor
&
have partnered to combine
&
to form a new financial data intelligence business
Buyside & Financing Advisor
has received an investment from
HG Capital
Sellside Advisor*
a portfolio company of
EQT
has been acquired by
Moody’s Corporation
Sellside Advisor*
has been acquired by
Verisk Analytics
Sellside Advisor*
has been acquired by
Hellman & Friedman
Sellside Advisor*
has received an investment from
Francisco Partners
Sellside Advisor*
a portfolio company of
HG Capital
has been acquired by
Verisk Analytics
Sellside Advisor*
has been acquired by
S&P Global Platts
Sellside Advisor*
has been acquired by
Sellside Advisor
a portfolio company of
has been acquired by
Sellside Advisor
has been acquired by
Sellside Advisor
has been acquired by
Sellside Advisor
has acquired
Buyside Advisor
has been acquired by
portfolio companies of
Sellside Advisor
a portfolio company of
has been acquired by
Sellside Advisor
a portfolio company of
has acquired
Buyside Advisor
has been acquired by
Sellside Advisor
a portfolio company of
has acquired
Buyside Advisor
has been acquired by
Sellside Advisor
$19,000,000Series D Preferred Stock
Financial Advisor and Placement Agent*
has been acquired by
Sellside Advisor*
Series A Senior Secured Notes
Growth Capital
$50,000,000
Exclusive Financial Advisor & Placement Agent
has been acquired by
Sellside Advisor*
has sold substantially all of its assets, pursuant to Section 363 of the U.S. Bankruptcy Code, to
iGPS Logistics LLC
Company Advisor
has been acquired by
Sellside Advisor*
a portfolio company of
has been acquired by
Sellside Advisor
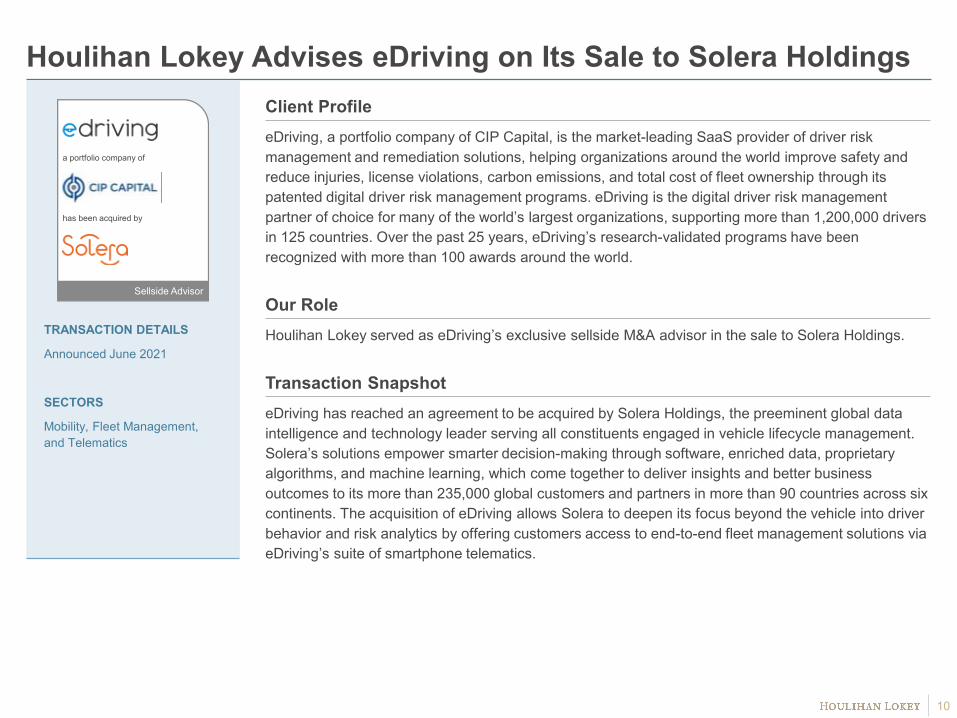
Client ProfileeDriving, a portfolio company of CIP Capital, is the market-leading SaaS provider of driver risk management and remediation solutions, helping organizations around the world improve safety and reduce injuries, license violations, carbon emissions, and total cost of fleet ownership through its patented digital driver risk management programs. eDriving is the digital driver risk management partner of choice for many of the world’s largest organizations, supporting more than 1,200,000 drivers in 125 countries. Over the past 25 years, eDriving’s research-validated programs have been recognized with more than 100 awards around the world.
Our RoleHoulihan Lokey served as eDriving’s exclusive sellside M&A advisor in the sale to Solera Holdings.
Transaction SnapshoteDriving has reached an agreement to be acquired by Solera Holdings, the preeminent global data intelligence and technology leader serving all constituents engaged in vehicle lifecycle management. Solera’s solutions empower smarter decision-making through software, enriched data, proprietary algorithms, and machine learning, which come together to deliver insights and better business outcomes to its more than 235,000 global customers and partners in more than 90 countries across six continents. The acquisition of eDriving allows Solera to deepen its focus beyond the vehicle into driver behavior and risk analytics by offering customers access to end-to-end fleet management solutions via eDriving’s suite of smartphone telematics.
10
Houlihan Lokey Advises eDriving on Its Sale to Solera Holdings
TRANSACTION DETAILS
Announced June 2021
SECTORS
Mobility, Fleet Management, and Telematics
a portfolio company of
has been acquired by
Sellside Advisor
Mobility, Supply Chain, and Logistics Technology Vertical Coverage

Mapping the Houlihan Lokey Mobility, Supply Chain, and Logistics Technology Landscape
Converging Business Models
Tech-Enabled Services • Information Services • Data and Analytics • Transactional • Subscription • SaaS
Note: Categories populated with illustrative companies, not exhaustive.
Digital Freight Matching Platforms
We have robust subsector coverage with transaction execution experience across emerging and disruptive technology categories within the ecosystem.
12
Aftermarket Repair /Parts
Data and Marketplaces
Maritime Fleet Management
Logistics and Supply Chain Technology
Mobility and Public
Transportation Planning
Ground Transportation
Fleet Management
Dealership Technology
and Software
Mobility, Telematics and Connected Car
Telematics and Connected Car

Key Drivers of Financing and M&A Activity Across the Landscape
13
Representative Transactions and Investments
Market Consolidation
• Verticalization: Expand end-market applicability by acquiring assets with deep vertical expertise.
• Accelerate Scale: Combining product portfolios and coresolutions is an efficient way for incumbents to scale quickly and reach new market segments.
Product and GeographicExpansion
• Add Complementary Offerings: Strengthen the existing product suite through the addition of inorganic add-ons.
• Add New Offerings: For some companies, it is easier to acquiretechnology rather than develop it internally.
Employing Data and Analytics to Drive Enhanced Capabilities
• Business Intelligence: Gain specialized expertise in analytics,telematics, and predictive modeling.
• Additional Data: Integrate incremental datasets to enhance existing data layers, or create new ones to drive diversification of capabilities.
Digital Channels Replacing Physical Channels
• Modernization: Category constituents that have operated their businesses on paper and legacy filing systems are investing in more advanced technology platforms.
• Talent Acquisition: New software development capabilities accompany the acquisition of technology startups.
(CDK International)
$1,552
$3,158
$896 $883
$1,384$1,599 $1,721 $1,687
$1,389
$1,963$2,298
$2,760
Q22018
Q32018
Q42018
Q12019
Q22019
Q32019
Q42019
Q12020
Q22020
Q32020
Q42020
Q12021
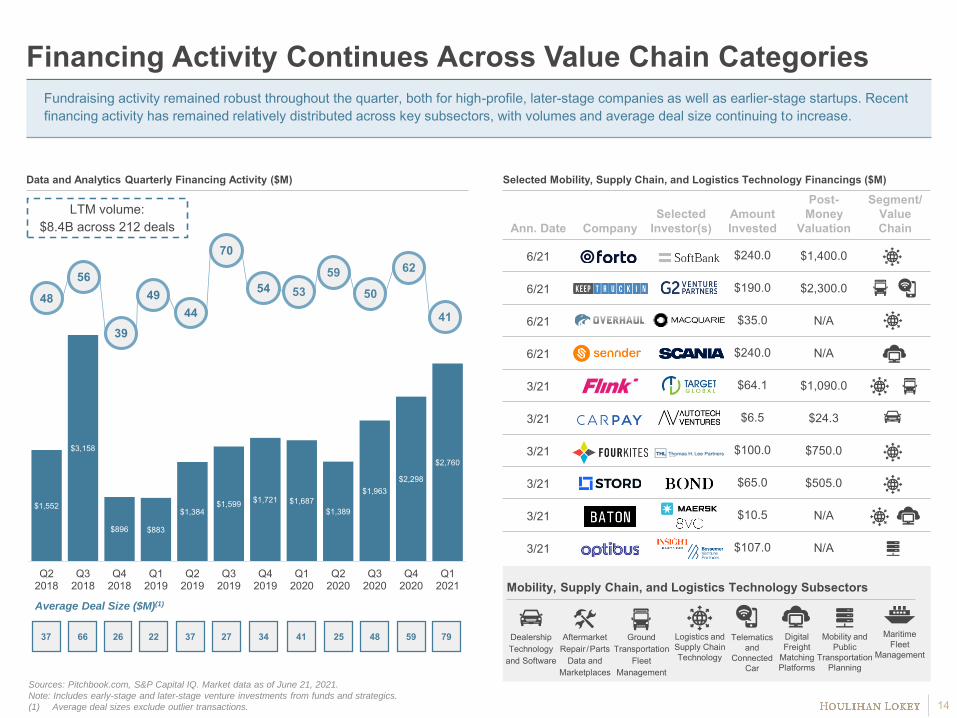
Ann. Date CompanySelected
Investor(s)Amount Invested
Post-Money
Valuation
Segment/ Value Chain
6/21 $240.0 $1,400.0
6/21 $190.0 $2,300.0
6/21 $35.0 N/A
6/21 $240.0 N/A
3/21 $64.1 $1,090.0
3/21 $6.5 $24.3
3/21 $100.0 $750.0
3/21 $65.0 $505.0
3/21 $10.5 N/A
3/21 $107.0 N/A
Fundraising activity remained robust throughout the quarter, both for high-profile, later-stage companies as well as earlier-stage startups. Recent financing activity has remained relatively distributed across key subsectors, with volumes and average deal size continuing to increase.
Selected Mobility, Supply Chain, and Logistics Technology Financings ($M)
Dealership Technology
and Software
Aftermarket Repair /Parts
Data and Marketplaces
Ground Transportation
Fleet Management
Logistics and Supply Chain Technology
Digital Freight
Matching Platforms
Data and Analytics Quarterly Financing Activity ($M)
79
Average Deal Size ($M)(1)
LTM volume: $8.4B across 212 deals
14
Mobility, Supply Chain, and Logistics Technology Subsectors
Financing Activity Continues Across Value Chain Categories
48 49
70
54 5359
50
62
44
56
39
37 66 26 22 37 27 34 41 25 48 59 Maritime Fleet
Management
Sources: Pitchbook.com, S&P Capital IQ. Market data as of June 21, 2021.
Note: Includes early-stage and later-stage venture investments from funds and strategics.
(1) Average deal sizes exclude outlier transactions.
Telematics and
Connected Car
Mobility and Public
Transportation Planning
41

$12,857
$16,977
$10,231
$6,451 $5,417 $5,382
$1,805
$5,328
$1,241
$10,020
$14,632
$1,924
Q22018
Q32018
Q42018
Q12019
Q22019
Q32019
Q42019
Q12020
Q22020
Q32020
Q42020
Q12021
Ann. Date Acquirer TargetTransaction Value ($M)
Segment/ Value Chain
6/21 $115.0
6/21 $275.0
6/21 $360.0
5/21 $1,700.0
5/21 $1,625.0
3/21 N/A
3/21 $100.0
3/21 $200.0
2/21 $102.0
11/20 $1,450.0
Strategic M&A activity sharply rebounded in 2H 2020, with several marquee transactions taking place in Q4. M&A activity across strategics and private equity continues at premium valuations for businesses offering best-of-breed technology and data analytics solutions, establishing favorable precedent benchmarks.
Selected Mobility, Supply Chain, and Logistics Technology M&A TransactionsData and Analytics Quarterly M&A Activity ($M)
LTM M&A volume: $82.5B across 73 deals
15
M&A Activity Continues Across the Ecosystem
Mobility, Supply Chain, and Logistics Technology Subsectors
LSEG’s $27.0B acquisition of
Refinitiv
$32,382
S&P Global’s$43.5B acquisition
of IHS Markit$58,112
ICE’s $11.5B acquisition of
Ellie Mae
$21,200
92357 514 245280 236 16164 124 563716254
Sources: Pitchbook.com, S&P Capital IQ. Market data as of June 21, 2021.
Note: Includes merger/acquisition of current subsidiaries.
(1) Average deal sizes exclude outlier transactions.
Dealership Technology
and Software
Aftermarket Repair /Parts
Data and Marketplaces
Ground Transportation
Fleet Management
Logistics and Supply Chain Technology
Digital Freight
Matching Platforms
Maritime Fleet
Management
Telematics and
Connected Car
Mobility and Public
Transportation Planning
Average Deal Size ($M)(1)
36
33
40
23 2328
35
10 16
2823 21

0
30
60
90
120
150
180
210
Jun-20 Jul-20 Aug-20 Sep-20 Oct-20 Nov-20 Dec-20 Jan-21 Feb-21 Mar-21 Apr-21 May-21 Jun-21
S&P 500 Telematics/GIS Fleet and Transportation Management Supply Chain and Logistics OEMs Automotive Technology/Information
LTM Share Price Performance
Consistent with trends across the broader market, key subsectors within the transportation, supply chain, and logistics technology category have sharply rebounded from the March 2020 trough and continue to trade at a premium to pre-COVID-19 levels.
Source: S&P Capital IQ.
Note: Growth and multiples shown are median values for comp group. Market data as of June 21, 2021.
Public Company Ecosystem Segmentation
16
Mixed Public Company Performance…
184.6
133.2133.6
158.4
124.6
136.4
84.6% 33.2%33.6% 24.6%58.4%LTM Share PricePerformance
Telematics/GISFleet and
Transportation Management
OEMsAutomotive Technology/ Information
Supply Chain and Logistics
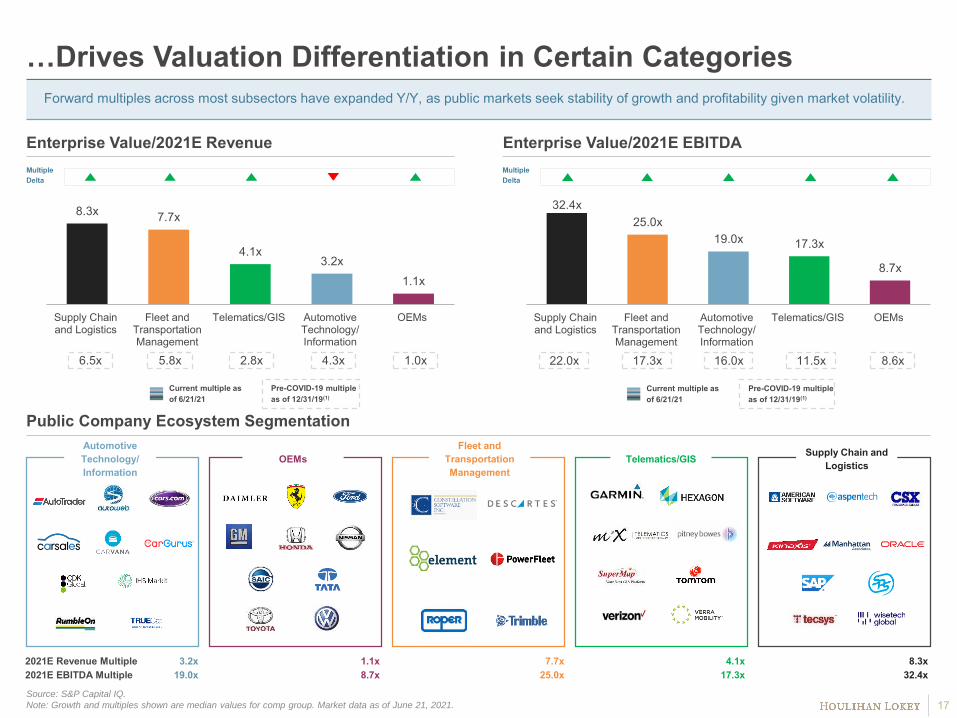
8.3x 7.7x
4.1x 3.2x
1.1x
Supply Chainand Logistics
Fleet andTransportationManagement
Telematics/GIS AutomotiveTechnology/Information
OEMs
3.2x2021E Revenue Multiple
Forward multiples across most subsectors have expanded Y/Y, as public markets seek stability of growth and profitability given market volatility.
Public Company Ecosystem Segmentation
17
…Drives Valuation Differentiation in Certain Categories
Enterprise Value/2021E Revenue Enterprise Value/2021E EBITDA
19.0x4.1x
17.3x7.7x
25.0x8.3x
32.4x1.1x8.7x2021E EBITDA Multiple
Pre-COVID-19 multiple as of 12/31/19(1)
Current multiple as of 6/21/21
6.5x
Multiple Delta
Multiple Delta
5.8x 4.3x2.8x 1.0x
Pre-COVID-19 multiple as of 12/31/19(1)
Current multiple as of 6/21/21
22.0x 17.3x 16.0x 8.6x11.5x
Source: S&P Capital IQ.
Note: Growth and multiples shown are median values for comp group. Market data as of June 21, 2021.
32.4x25.0x
19.0x 17.3x
8.7x
Supply Chainand Logistics
Fleet andTransportationManagement
AutomotiveTechnology/Information
Telematics/GIS OEMs
Telematics/GISFleet and
Transportation Management
OEMsAutomotive Technology/ Information
Supply Chain and Logistics

18
Markets continue to favor growth, but the combination of growth and profitability yields the highest valuations.
Valuation Is Correlated to Revenue Growth and EBITDA Margin
Rule of 40 vs. EV/2021E Revenue Rule of 40 vs. EV/2021E EBITDA
2021E EBITDA Margin vs. EV/2021E EBITDA 2021E–2022E Revenue Growth vs. EV/2021E Revenue
Source: S&P Capital IQ.
Note: Growth and multiples shown are median values for comp group. Market data as of June 21, 2021.
R² = 0.658
--
20x
40x
0% 20% 40% 60% 80%
R² = 0.7537
--
4x
8x
12x
16x
20x
0% 20% 40% 60% 80% 100% 120%
R² = 0.6261
--
20x
40x
0% 20% 40% 60% 80%
R² = 0.6346
--
4x
8x
12x
16x
20x
24x
0% 5% 10% 15% 20% 25%

Appendix

Selected Publicly Listed Comparables
20
Sources: S&P Capital IQ, company information.
Note: Trading multiples are based on share price, other market data, and broker consensus future earnings estimates from S&P Capital IQ as of June 21, 2021. All financials
calendarized to a December year-end.
Company Name Market Cap EV EV / Revenue EV / EBITDA EBITDA margin 2020E-22E CAGR
USDm USDm 2020 2021 2022 2020 2021 2022 2020 2021 2022 Revenue EBITDA
Auto Trader 8,445 8,430 20.9x 16.8x 14.6x 32.6x 24.0x 20.1x 64.2% 70.1% 72.4% 19.8% 27.3%AutoWeb 38 40 0.5x 0.5x 0.5x na 19.0x 9.1x nm 2.8% 5.2% 4.6% naCarGurus 2,869 2,763 5.0x 3.7x 3.2x 24.1x 15.5x 13.7x 20.8% 23.6% 23.2% 25.8% 32.9%Cars.com 954 1,442 2.6x 2.3x 2.2x 10.3x 7.7x 7.4x 25.6% 30.0% 30.0% 9.1% 18.0%Carsales.com 4,146 4,464 14.3x 13.0x 11.9x 27.8x 22.6x 20.5x 51.7% 57.6% 58.0% 10.0% 16.5%Carvana 23,946 26,368 4.7x 2.7x 2.0x na na nm nm nm 1.3% 52.7% naCDK 6,209 7,182 3.9x 4.2x 3.9x 10.9x 10.7x 10.0x 36.4% 39.0% 39.4% 0.4% 4.4%IHS Markit 43,941 49,258 11.4x 10.6x 10.0x 31.2x 24.2x 22.3x 36.6% 44.0% 44.9% 6.8% 18.3%RumbleOn 129 200 0.5x 0.3x 0.1x na 10.7x 1.9x nm 2.4% 6.8% 93.0% naTrueCar 528 289 1.0x 1.1x 1.0x 49.7x 23.9x 12.3x 2.1% 4.5% 8.0% 2.7% 101.2%
Mean 6.5x 5.5x 4.9x 26.6x 17.6x 13.0x 33.9% 30.5% 28.9% 22.5% 31.2%Median 4.3x 3.2x 2.7x 27.8x 19.0x 12.3x 36.4% 30.0% 26.6% 9.5% 18.3%
Garmin 27,286 25,419 6.1x 5.4x 5.0x 21.5x 19.9x 18.3x 28.2% 27.1% 27.4% 10.1% 8.6%Hexagon 37,649 40,138 9.0x 8.1x 7.6x 29.2x 21.9x 20.5x 30.7% 36.9% 37.1% 8.4% 19.2%MiX Telematics 317 280 2.1x 2.2x 2.0x 7.4x 8.8x 8.3x 28.6% 24.7% 24.1% 2.9% (5.5%)Pitney Bow es 1,527 3,487 1.0x 0.9x 0.9x 11.3x 9.1x 8.2x 8.7% 10.2% 10.8% 5.2% 17.4%SuperMap Softw are 1,762 1,648 6.6x 5.3x 4.2x 38.9x 27.2x 21.2x 17.0% 19.3% 19.8% 25.3% 35.3%TomTom 1,103 732 1.2x 1.1x 1.0x na 20.1x 17.1x nm 5.4% 6.0% 6.7% naVerizon 233,458 405,408 3.2x 3.0x 3.0x 8.4x 8.3x 8.1x 37.5% 36.4% 36.7% 3.2% 2.0%Verra Mobility 2,556 3,307 8.4x 6.7x 6.0x 21.6x 14.6x 11.9x 39.0% 46.0% 50.5% 18.1% 34.4%
Mean 4.7x 4.1x 3.7x 19.8x 16.2x 14.2x 27.1% 25.8% 26.6% 10.0% 15.9%Median 4.6x 4.1x 3.6x 21.5x 17.3x 14.5x 28.6% 25.9% 25.8% 7.5% 17.4%
Constellation Softw are 31,618 31,936 8.0x 6.4x 5.5x 37.2x 21.2x 19.1x 21.6% 30.1% 29.1% 20.5% 39.6%Descartes 5,578 5,453 15.7x 13.5x 12.1x 40.7x 32.9x 28.8x 38.6% 41.2% 41.9% 14.2% 19.0%Element Fleet Mgmt. 4,875 12,397 10.7x 15.6x 14.7x na na na na -- -- (14.5%) naPow erFleet 241 237 2.1x 1.8x 1.5x 53.3x 20.3x 9.0x 3.9% 9.0% 16.7% 18.0% 143.5%Roper 48,231 56,974 10.3x 8.9x 8.6x 29.2x 25.0x 23.4x 35.3% 35.6% 36.5% 9.8% 11.6%Trimble 19,816 21,043 6.7x 6.1x 5.2x 31.7x 25.3x 20.4x 21.0% 24.0% 25.6% 13.0% 24.7%
Mean 8.9x 8.7x 7.9x 38.4x 25.0x 20.1x 24.1% 23.3% 25.0% 10.1% 47.7%Median 9.2x 7.7x 7.1x 37.2x 25.0x 20.4x 21.6% 27.1% 27.3% 13.6% 24.7%
Auto
mot
ive
Tech
nolo
gy/In
form
atio
n
Tele
mat
ics/
GIS
Fl
eet a
nd
Tran
spor
tatio
n
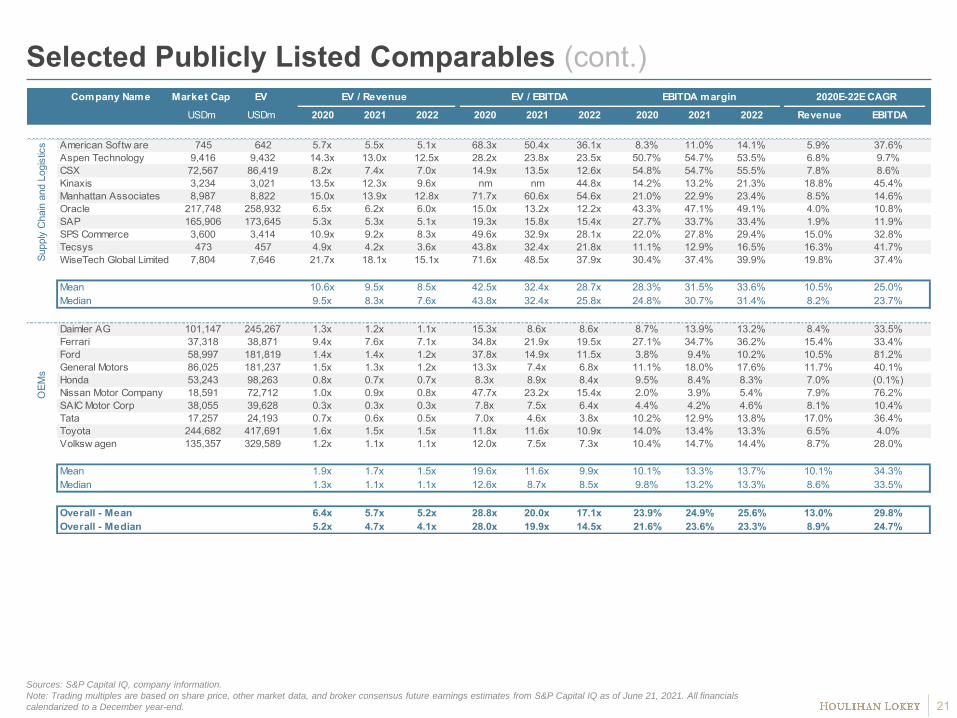
Selected Publicly Listed Comparables (cont.)
21
EV/EBITDAEV/Revenue 2020E–2022E CAGR
Sources: S&P Capital IQ, company information.
Note: Trading multiples are based on share price, other market data, and broker consensus future earnings estimates from S&P Capital IQ as of June 21, 2021. All financials
calendarized to a December year-end.
EV/Revenue EV/EBITDA EBITDA Margin 2020E–2022E CAGRCompany Name Market Cap EV EV / Revenue EV / EBITDA EBITDA margin 2020E-22E CAGR
USDm USDm 2020 2021 2022 2020 2021 2022 2020 2021 2022 Revenue EBITDA
American Softw are 745 642 5.7x 5.5x 5.1x 68.3x 50.4x 36.1x 8.3% 11.0% 14.1% 5.9% 37.6%Aspen Technology 9,416 9,432 14.3x 13.0x 12.5x 28.2x 23.8x 23.5x 50.7% 54.7% 53.5% 6.8% 9.7%CSX 72,567 86,419 8.2x 7.4x 7.0x 14.9x 13.5x 12.6x 54.8% 54.7% 55.5% 7.8% 8.6%Kinaxis 3,234 3,021 13.5x 12.3x 9.6x nm nm 44.8x 14.2% 13.2% 21.3% 18.8% 45.4%Manhattan Associates 8,987 8,822 15.0x 13.9x 12.8x 71.7x 60.6x 54.6x 21.0% 22.9% 23.4% 8.5% 14.6%Oracle 217,748 258,932 6.5x 6.2x 6.0x 15.0x 13.2x 12.2x 43.3% 47.1% 49.1% 4.0% 10.8%SAP 165,906 173,645 5.3x 5.3x 5.1x 19.3x 15.8x 15.4x 27.7% 33.7% 33.4% 1.9% 11.9%SPS Commerce 3,600 3,414 10.9x 9.2x 8.3x 49.6x 32.9x 28.1x 22.0% 27.8% 29.4% 15.0% 32.8%Tecsys 473 457 4.9x 4.2x 3.6x 43.8x 32.4x 21.8x 11.1% 12.9% 16.5% 16.3% 41.7%WiseTech Global Limited 7,804 7,646 21.7x 18.1x 15.1x 71.6x 48.5x 37.9x 30.4% 37.4% 39.9% 19.8% 37.4%
Mean 10.6x 9.5x 8.5x 42.5x 32.4x 28.7x 28.3% 31.5% 33.6% 10.5% 25.0%Median 9.5x 8.3x 7.6x 43.8x 32.4x 25.8x 24.8% 30.7% 31.4% 8.2% 23.7%
Daimler AG 101,147 245,267 1.3x 1.2x 1.1x 15.3x 8.6x 8.6x 8.7% 13.9% 13.2% 8.4% 33.5%Ferrari 37,318 38,871 9.4x 7.6x 7.1x 34.8x 21.9x 19.5x 27.1% 34.7% 36.2% 15.4% 33.4%Ford 58,997 181,819 1.4x 1.4x 1.2x 37.8x 14.9x 11.5x 3.8% 9.4% 10.2% 10.5% 81.2%General Motors 86,025 181,237 1.5x 1.3x 1.2x 13.3x 7.4x 6.8x 11.1% 18.0% 17.6% 11.7% 40.1%Honda 53,243 98,263 0.8x 0.7x 0.7x 8.3x 8.9x 8.4x 9.5% 8.4% 8.3% 7.0% (0.1%)Nissan Motor Company 18,591 72,712 1.0x 0.9x 0.8x 47.7x 23.2x 15.4x 2.0% 3.9% 5.4% 7.9% 76.2%SAIC Motor Corp 38,055 39,628 0.3x 0.3x 0.3x 7.8x 7.5x 6.4x 4.4% 4.2% 4.6% 8.1% 10.4%Tata 17,257 24,193 0.7x 0.6x 0.5x 7.0x 4.6x 3.8x 10.2% 12.9% 13.8% 17.0% 36.4%Toyota 244,682 417,691 1.6x 1.5x 1.5x 11.8x 11.6x 10.9x 14.0% 13.4% 13.3% 6.5% 4.0%Volksw agen 135,357 329,589 1.2x 1.1x 1.1x 12.0x 7.5x 7.3x 10.4% 14.7% 14.4% 8.7% 28.0%
Mean 1.9x 1.7x 1.5x 19.6x 11.6x 9.9x 10.1% 13.3% 13.7% 10.1% 34.3%Median 1.3x 1.1x 1.1x 12.6x 8.7x 8.5x 9.8% 13.2% 13.3% 8.6% 33.5%
Overall - Mean 6.4x 5.7x 5.2x 28.8x 20.0x 17.1x 23.9% 24.9% 25.6% 13.0% 29.8%Overall - Median 5.2x 4.7x 4.1x 28.0x 19.9x 14.5x 21.6% 23.6% 23.3% 8.9% 24.7%
Supp
ly C
hain
and
Log
istic
s O
EMs

22
Disclaimer© 2021 Houlihan Lokey. All rights reserved. This material may not be reproduced in any format by any means or redistributed without the prior written consent of Houlihan Lokey.
Houlihan Lokey is a trade name for Houlihan Lokey, Inc., and its subsidiaries and affiliates, which include those in (i) the United States: Houlihan Lokey Capital, Inc., an SEC-registered broker-dealer and member of FINRA (www.finra.org) and SIPC (www.sipc.org) (investment banking services); Houlihan Lokey Financial Advisors, Inc. (financial advisory services); HL Finance, LLC (syndicated leveraged finance platform); and Houlihan Lokey Real Estate Group, Inc. (real estate advisory services); (ii) Europe: Houlihan Lokey EMEA, LLP, and Houlihan Lokey (Corporate Finance) Limited, authorized and regulated by the U.K. Financial Conduct Authority; Houlihan Lokey (Europe) GmbH, authorized and regulated by the German Federal Financial Supervisory Authority (Bundesanstalt für Finanzdienstleistungsaufsicht); Houlihan Lokey GmbH; Houlihan Lokey S.p.A.; Houlihan Lokey (Netherlands) B.V.; Houlihan Lokey (España), S.A.; and Houlihan Lokey (Corporate Finance), S.A.; (iii) the United Arab Emirates, Dubai International Financial Centre (Dubai): Houlihan Lokey (MEA Financial Advisory) Limited, regulated by the Dubai Financial Services Authority for the provision of advising on financial products, arranging deals in investments, and arranging credit and advising on credit to professional clients only; (iv) Singapore: Houlihan Lokey (Singapore) Private Limited, an “exempt corporate finance adviser” able to provide exempt corporate finance advisory services to accredited investors only; (v) Hong Kong SAR: Houlihan Lokey (China) Limited, licensed in Hong Kong by the Securities and Futures Commission to conduct Type 1, 4, and 6 regulated activities to professional investors only; (vi) China: Houlihan Lokey Howard & Zukin Investment Consulting (Beijing) Co., Limited (financial advisory services); (vii) Japan: Houlihan Lokey K.K. (financial advisory services); and (viii) Australia: Houlihan Lokey (Australia) Pty Limited (ABN 74 601 825 227), a company incorporated in Australia and licensed by the Australian Securities and Investments Commission (AFSL number 474953) in respect of financial services provided to wholesale clients only. In the European Economic Area (EEA), Dubai, Singapore, Hong Kong, and Australia, this communication is directed to intended recipients, including actual or potential professional clients (EEA and Dubai), accredited investors (Singapore), professional investors (Hong Kong), and wholesale clients (Australia), respectively. Other persons, such as retail clients, are NOT the intended recipients of our communications or services and should not act upon this communication.
Houlihan Lokey gathers its data from sources it considers reliable; however, it does not guarantee the accuracy or completeness of the information provided within this presentation. The material presented reflects information known to the authors at the time this presentation was written, and this information is subject to change. Houlihan Lokey makes no representations or warranties, expressed or implied, regarding the accuracy of this material. The views expressed in this material accurately reflect the personal views of the authors regarding the subject securities and issuers and do not necessarily coincide with those of Houlihan Lokey. Officers, directors, and partners in the Houlihan Lokey group of companies may have positions in the securities of the companies discussed. This presentation does not constitute advice or a recommendation, offer, or solicitation with respect to the securities of any company discussed herein, is not intended to provide information upon which to base an investment decision, and should not be construed as such. Houlihan Lokey or its affiliates may from time to time provide investment banking or related services to these companies. Like all Houlihan Lokey employees, the authors of this presentation receive compensation that is affected by overall firm profitability.

23
CORPORATE FINANCE
FINANCIAL RESTRUCTURINGFINANCIAL AND VALUATION ADVISORY
HL.com