Embed Size (px)
Citation preview

U.S. DEPARTMENT OF COMMERCENATIONAL OCEANIC AND ATMOSPHERIC ADMINISTRATION
NATIONAL OCEAN SERVICE
Data Acquisition & Processing Report
Type of Survey
LOCALITY
Project No. O - -13
Registry No.
Time Frame 1 Ju 2013 - Ju 2013
State
General Locality
LIBRARY & ARCHIVES
DATE
2013
CHIEF OF PARTY
Pascagoula Harborand
Bayou Casotte
13USM01 Data Acquisition and Processing
Report
Date: 26 July 2013
Prepared By:Geoffrey Lawes
Ahmed Azab
Laura Casey
Kandice Gunning
Nicolas Waters
University of Southern Mississippi 13USM01 Data Acquisition and Processing Report
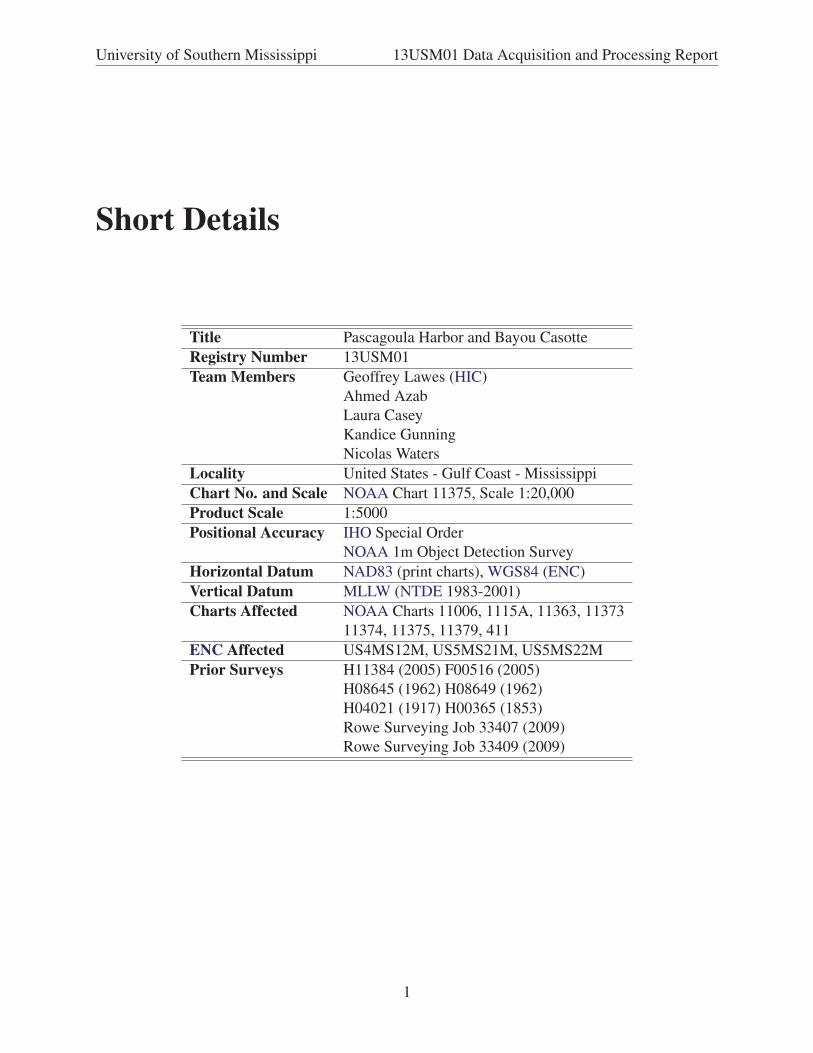
Short Details
Title Pascagoula Harbor and Bayou Casotte
Registry Number 13USM01
Team Members Geoffrey Lawes (HIC)
Ahmed Azab
Laura Casey
Kandice Gunning
Nicolas Waters
Locality United States - Gulf Coast - Mississippi
Chart No. and Scale NOAA Chart 11375, Scale 1:20,000
Product Scale 1:5000
Positional Accuracy IHO Special Order
NOAA 1m Object Detection Survey
Horizontal Datum NAD83 (print charts), WGS84 (ENC)
Vertical Datum MLLW (NTDE 1983-2001)
Charts Affected NOAA Charts 11006, 1115A, 11363, 11373
11374, 11375, 11379, 411
ENC Affected US4MS12M, US5MS21M, US5MS22M
Prior Surveys H11384 (2005) F00516 (2005)
H08645 (1962) H08649 (1962)
H04021 (1917) H00365 (1853)
Rowe Surveying Job 33407 (2009)
Rowe Surveying Job 33409 (2009)
1
University of Southern Mississippi 13USM01 Data Acquisition and Processing Report
Contents
Introduction 9
A Equipment 12A.1 Major Operational Systems . . . . . . . . . . . . . . . . . . . . . . . . . . . . . . 12
A.2 Survey Vessel . . . . . . . . . . . . . . . . . . . . . . . . . . . . . . . . . . . . . 12
A.3 Multibeam Echosounder . . . . . . . . . . . . . . . . . . . . . . . . . . . . . . . 14
A.4 Side Scan Sonar . . . . . . . . . . . . . . . . . . . . . . . . . . . . . . . . . . . . 15
A.5 Position, Heading and Motion Reference . . . . . . . . . . . . . . . . . . . . . . . 16
A.5.1 POSMV . . . . . . . . . . . . . . . . . . . . . . . . . . . . . . . . . . . . 16
A.5.2 TopCon GR3 . . . . . . . . . . . . . . . . . . . . . . . . . . . . . . . . . 17
A.6 Sound Velocity Measurement Systems . . . . . . . . . . . . . . . . . . . . . . . . 18
A.6.1 Odom Digibar Pro . . . . . . . . . . . . . . . . . . . . . . . . . . . . . . 18
A.6.2 Reson SVP . . . . . . . . . . . . . . . . . . . . . . . . . . . . . . . . . . 18
A.7 Geodetic and Tidal Equipment . . . . . . . . . . . . . . . . . . . . . . . . . . . . 19
A.8 Seabed Sampler . . . . . . . . . . . . . . . . . . . . . . . . . . . . . . . . . . . . 19
A.9 Acquisition and Processing Systems . . . . . . . . . . . . . . . . . . . . . . . . . 20
A.9.1 QINSy . . . . . . . . . . . . . . . . . . . . . . . . . . . . . . . . . . . . 20
A.9.2 Edgetech Discover . . . . . . . . . . . . . . . . . . . . . . . . . . . . . . 21
A.9.3 Caris HIPS . . . . . . . . . . . . . . . . . . . . . . . . . . . . . . . . . . 21
A.9.4 Chesapeake SonarWiz . . . . . . . . . . . . . . . . . . . . . . . . . . . . 21
B Quality Control 22B.1 Multibeam Echosounder . . . . . . . . . . . . . . . . . . . . . . . . . . . . . . . 22
B.1.1 Data Acquisition . . . . . . . . . . . . . . . . . . . . . . . . . . . . . . . 22
B.1.2 Data Consistency . . . . . . . . . . . . . . . . . . . . . . . . . . . . . . . 23
B.1.3 Data Processing . . . . . . . . . . . . . . . . . . . . . . . . . . . . . . . . 23
B.1.4 Coverage and Junctions . . . . . . . . . . . . . . . . . . . . . . . . . . . 29
B.1.5 SEP/GNSS Tide Validation . . . . . . . . . . . . . . . . . . . . . . . . . . 29
B.2 Side Scan Sonar . . . . . . . . . . . . . . . . . . . . . . . . . . . . . . . . . . . . 30
B.2.1 Data Acquisition and Confidence Checks . . . . . . . . . . . . . . . . . . 30
B.2.2 Imaging Processing . . . . . . . . . . . . . . . . . . . . . . . . . . . . . . 31
B.2.3 Review Process and Proof of Coverage . . . . . . . . . . . . . . . . . . . 31
B.2.4 Feature Selection . . . . . . . . . . . . . . . . . . . . . . . . . . . . . . . 31
B.2.5 Seabed Samples . . . . . . . . . . . . . . . . . . . . . . . . . . . . . . . 32
B.2.6 Seabed Texture . . . . . . . . . . . . . . . . . . . . . . . . . . . . . . . . 33
2

University of Southern Mississippi 13USM01 Data Acquisition and Processing Report
B.3 Aids to Navigation . . . . . . . . . . . . . . . . . . . . . . . . . . . . . . . . . . 33
C Corrections to Echo Soundings 35C.1 Caris HIPS Vessel File . . . . . . . . . . . . . . . . . . . . . . . . . . . . . . . . 35
C.1.1 Vessel Offsets . . . . . . . . . . . . . . . . . . . . . . . . . . . . . . . . . 35
C.1.2 Multibeam Calibration . . . . . . . . . . . . . . . . . . . . . . . . . . . . 37
C.2 Attitude and Position Data . . . . . . . . . . . . . . . . . . . . . . . . . . . . . . 38
C.3 Tide and Water Level Corrections . . . . . . . . . . . . . . . . . . . . . . . . . . 39
C.4 Sound Velocity Correction . . . . . . . . . . . . . . . . . . . . . . . . . . . . . . 39
C.5 TPU Calculation . . . . . . . . . . . . . . . . . . . . . . . . . . . . . . . . . . . 39
D Approval Sheet 41
Bibliography 42
Appendices 43
I Vessel Reports 44I.1 Caris HIPS Vessel Report . . . . . . . . . . . . . . . . . . . . . . . . . . . . . . . 45
I.2 Vessel Configuration Survey Data . . . . . . . . . . . . . . . . . . . . . . . . . . 52
II Data Processing Workflow Diagrams 54II.1 Caris HIPS Workflow . . . . . . . . . . . . . . . . . . . . . . . . . . . . . . . . . 55
II.2 SonarWiz Workflow . . . . . . . . . . . . . . . . . . . . . . . . . . . . . . . . . . 56
III Systems and Sensors 57III.1 Equipment Wiring . . . . . . . . . . . . . . . . . . . . . . . . . . . . . . . . . . . 58
III.2 MBES Coverage Calculation . . . . . . . . . . . . . . . . . . . . . . . . . . . . . 60
IV Sound Velocity Profiles 64
V SSS Contact Reports 74
3
University of Southern Mississippi 13USM01 Data Acquisition and Processing Report
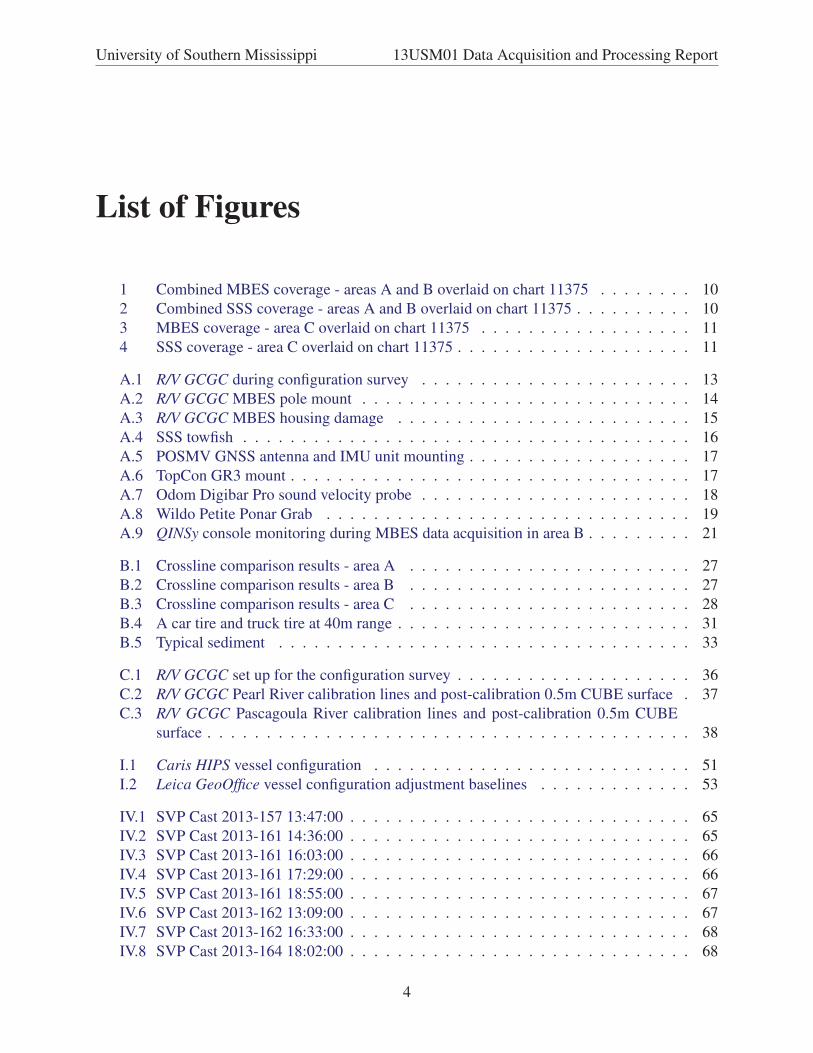
List of Figures
1 Combined MBES coverage - areas A and B overlaid on chart 11375 . . . . . . . . 10
2 Combined SSS coverage - areas A and B overlaid on chart 11375 . . . . . . . . . . 10
3 MBES coverage - area C overlaid on chart 11375 . . . . . . . . . . . . . . . . . . 11
4 SSS coverage - area C overlaid on chart 11375 . . . . . . . . . . . . . . . . . . . . 11
A.1 R/V GCGC during configuration survey . . . . . . . . . . . . . . . . . . . . . . . 13
A.2 R/V GCGC MBES pole mount . . . . . . . . . . . . . . . . . . . . . . . . . . . . 14
A.3 R/V GCGC MBES housing damage . . . . . . . . . . . . . . . . . . . . . . . . . 15
A.4 SSS towfish . . . . . . . . . . . . . . . . . . . . . . . . . . . . . . . . . . . . . . 16
A.5 POSMV GNSS antenna and IMU unit mounting . . . . . . . . . . . . . . . . . . . 17
A.6 TopCon GR3 mount . . . . . . . . . . . . . . . . . . . . . . . . . . . . . . . . . . 17
A.7 Odom Digibar Pro sound velocity probe . . . . . . . . . . . . . . . . . . . . . . . 18
A.8 Wildo Petite Ponar Grab . . . . . . . . . . . . . . . . . . . . . . . . . . . . . . . 19
A.9 QINSy console monitoring during MBES data acquisition in area B . . . . . . . . . 21
B.1 Crossline comparison results - area A . . . . . . . . . . . . . . . . . . . . . . . . 27
B.2 Crossline comparison results - area B . . . . . . . . . . . . . . . . . . . . . . . . 27
B.3 Crossline comparison results - area C . . . . . . . . . . . . . . . . . . . . . . . . 28
B.4 A car tire and truck tire at 40m range . . . . . . . . . . . . . . . . . . . . . . . . . 31
B.5 Typical sediment . . . . . . . . . . . . . . . . . . . . . . . . . . . . . . . . . . . 33
C.1 R/V GCGC set up for the configuration survey . . . . . . . . . . . . . . . . . . . . 36
C.2 R/V GCGC Pearl River calibration lines and post-calibration 0.5m CUBE surface . 37
C.3 R/V GCGC Pascagoula River calibration lines and post-calibration 0.5m CUBE
surface . . . . . . . . . . . . . . . . . . . . . . . . . . . . . . . . . . . . . . . . . 38
I.1 Caris HIPS vessel configuration . . . . . . . . . . . . . . . . . . . . . . . . . . . 51
I.2 Leica GeoOffice vessel configuration adjustment baselines . . . . . . . . . . . . . 53
IV.1 SVP Cast 2013-157 13:47:00 . . . . . . . . . . . . . . . . . . . . . . . . . . . . . 65
IV.2 SVP Cast 2013-161 14:36:00 . . . . . . . . . . . . . . . . . . . . . . . . . . . . . 65
IV.3 SVP Cast 2013-161 16:03:00 . . . . . . . . . . . . . . . . . . . . . . . . . . . . . 66
IV.4 SVP Cast 2013-161 17:29:00 . . . . . . . . . . . . . . . . . . . . . . . . . . . . . 66
IV.5 SVP Cast 2013-161 18:55:00 . . . . . . . . . . . . . . . . . . . . . . . . . . . . . 67
IV.6 SVP Cast 2013-162 13:09:00 . . . . . . . . . . . . . . . . . . . . . . . . . . . . . 67
IV.7 SVP Cast 2013-162 16:33:00 . . . . . . . . . . . . . . . . . . . . . . . . . . . . . 68
IV.8 SVP Cast 2013-164 18:02:00 . . . . . . . . . . . . . . . . . . . . . . . . . . . . . 68
4

University of Southern Mississippi 13USM01 Data Acquisition and Processing Report
IV.9 SVP Cast 2013-165 12:54:00 . . . . . . . . . . . . . . . . . . . . . . . . . . . . . 69
IV.10SVP Cast 2013-165 15:40:00 . . . . . . . . . . . . . . . . . . . . . . . . . . . . . 69
IV.11SVP Cast 2013-165 18:02:00 . . . . . . . . . . . . . . . . . . . . . . . . . . . . . 70
IV.12SVP Cast 2013-165 19:01:00 . . . . . . . . . . . . . . . . . . . . . . . . . . . . . 70
IV.13SVP Cast 2013-169 12:59:00 . . . . . . . . . . . . . . . . . . . . . . . . . . . . . 71
IV.14SVP Cast 2013-169 14:27:00 . . . . . . . . . . . . . . . . . . . . . . . . . . . . . 71
IV.15SVP Cast 2013-169 16:17:00 . . . . . . . . . . . . . . . . . . . . . . . . . . . . . 72
IV.16SVP Cast 2013-169 17:35:00 . . . . . . . . . . . . . . . . . . . . . . . . . . . . . 72
IV.17SVP Cast 2013-169 17:35:00 . . . . . . . . . . . . . . . . . . . . . . . . . . . . . 73
5

University of Southern Mississippi 13USM01 Data Acquisition and Processing Report
List of Tables
A.1 R/V GCGC equipment . . . . . . . . . . . . . . . . . . . . . . . . . . . . . . . . 12
A.2 Geodetic and tidal equipment . . . . . . . . . . . . . . . . . . . . . . . . . . . . . 19
A.3 Data processing software versions . . . . . . . . . . . . . . . . . . . . . . . . . . 20
B.1 MBES controller value ranges . . . . . . . . . . . . . . . . . . . . . . . . . . . . 22
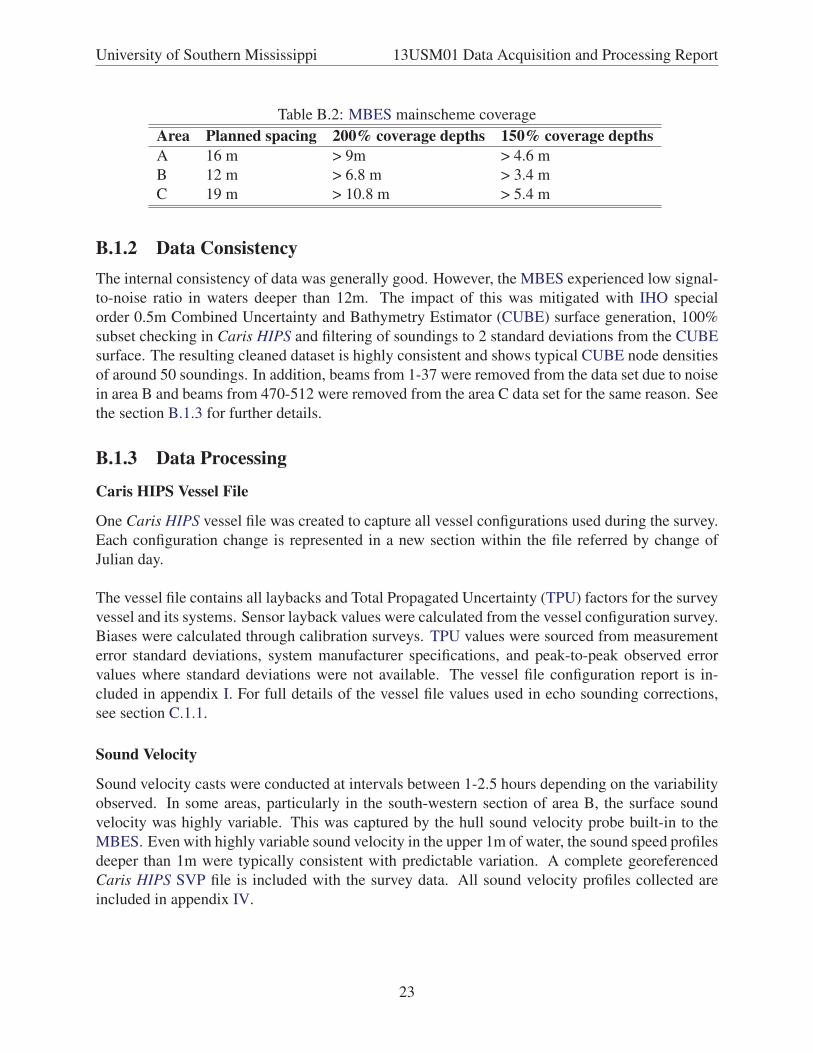
B.2 MBES mainscheme coverage . . . . . . . . . . . . . . . . . . . . . . . . . . . . . 23
B.3 Highest observed position standard deviations during MBES sounding . . . . . . . 24
B.4 Highest observed attitude standard deviations during MBES sounding . . . . . . . 24
B.5 Crossline comparison results . . . . . . . . . . . . . . . . . . . . . . . . . . . . . 26
B.6 Minimum vertical uncertainty values . . . . . . . . . . . . . . . . . . . . . . . . . 28
B.7 Caris HIPS surface QC results . . . . . . . . . . . . . . . . . . . . . . . . . . . . 29
B.8 SEP/GNSS tide validation . . . . . . . . . . . . . . . . . . . . . . . . . . . . . . 30
B.9 Seabed samples collected 19 June 2013 with S-57 encoding values . . . . . . . . . 32
B.10 Floating aids to navigation positioned on 17 June 2013 . . . . . . . . . . . . . . . 34
C.1 Vessel configuration (X=bow+, Y=starboard+, Z=down+) . . . . . . . . . . . . . . 36
C.2 Vessel calibration values . . . . . . . . . . . . . . . . . . . . . . . . . . . . . . . 38
C.3 SEP values and uncertainty at 95% confidence . . . . . . . . . . . . . . . . . . . . 39
C.4 Caris HIPS vessel file TPU entries . . . . . . . . . . . . . . . . . . . . . . . . . . 40
I.1 Relative benchmark positions . . . . . . . . . . . . . . . . . . . . . . . . . . . . . 52
I.2 Sensor/reference positions relative to center of rotation (RM) . . . . . . . . . . . . 52
6

University of Southern Mississippi 13USM01 Data Acquisition and Processing Report
Acronyms and Abbreviations
CORS Continuously Operating Reference Station
CSAR Caris Spatial ARchive
CUBE Combined Uncertainty and Bathymetry Estimator
ENC Electronic Navigation Chart
FST Fleet Survey Team
GCGC Gulf Coast Geospatial Consortium
GNSS Global Navigation Satellite System
GSF Generic Sensor Format
HIC Hydrographer-In-Charge
HIPS Hydrographic Information Processing System
HSD Hydrographic Survey Division
IHO International Hydrographic Organization
IMU Inertial Motion Unit
JSF JStar Sidescan Format
MBES Multi-Beam Echo-Sounder
MLLW Mean Lower Low Water
NAD83 North American Datum of 1983
NMEA National Marine Electronics Association
NOAA National Oceanic and Atmospheric Administration
NTDE National Tidal Datum Epoch
PPK Post Processed Kinematic
7
University of Southern Mississippi 13USM01 Data Acquisition and Processing Report
PPS Pulse Per-Second
POSMV Position and Orientation System for Marine Vehicles
QC Quality Control
SBET Smoothed Best Estimate of Trajectory
SEP Ellipsoid to Tidal Vertical Datum Separation
SSC John C. Stennis Space Center
SSS Side-Scan Sonar
SVP Sound Velocity Profiler
TPU Total Propagated Uncertainty
USACE United States Army Corps of Engineers
USM University of Southern Mississippi
UTC Coordinated Universal Time
WAAS Wide Area Augmentation System
WGS84 World Geodetic System of 1984
XTF eXtensible Triton Format
8
University of Southern Mississippi 13USM01 Data Acquisition and Processing Report
Introduction
The purpose of the survey was to provide National Oceanic and Atmospheric Administration
(NOAA) Hydrographic Survey Division (HSD) and the Jackson County Port Authority with a
high resolution Multi-Beam Echo-Sounder (MBES) data set for checking existing chart informa-
tion and historical data.
The survey area was divided into three sub-areas denoted A, B and C. Area A is within the harbor
limits of the Port of Pascagoula and is principally concerned with the United States Army Corps
of Engineers (USACE) maintained channel. Area B is also within the Port of Pascagoula limits
and lies between the Ingalls Shipyard south wharves and Singing River Island. Area C is within
the harbor limits of Bayou Casotte and again is principally concerned with the maintained channel.
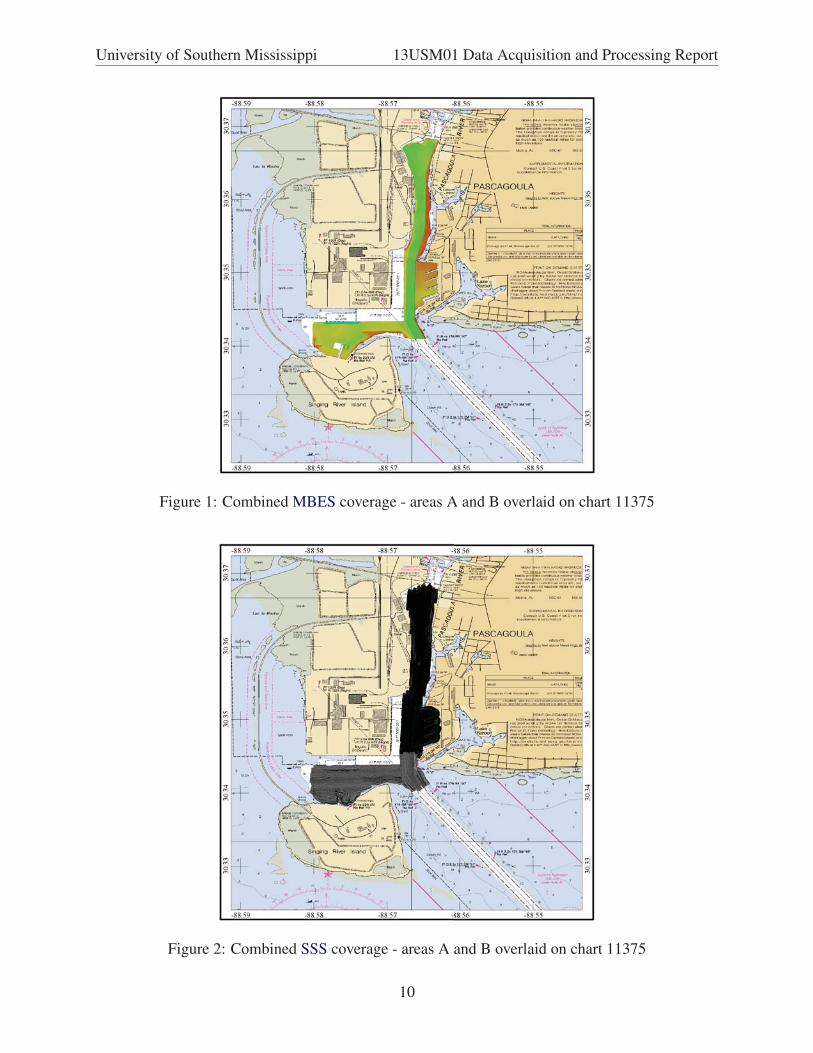
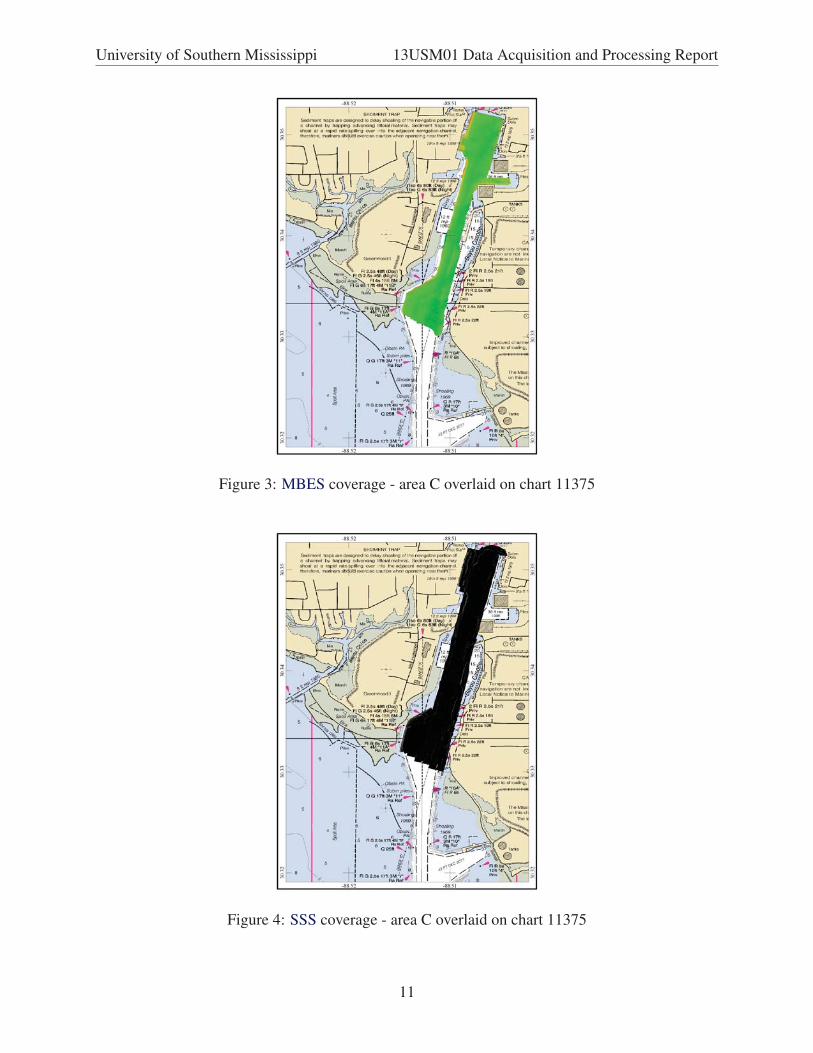
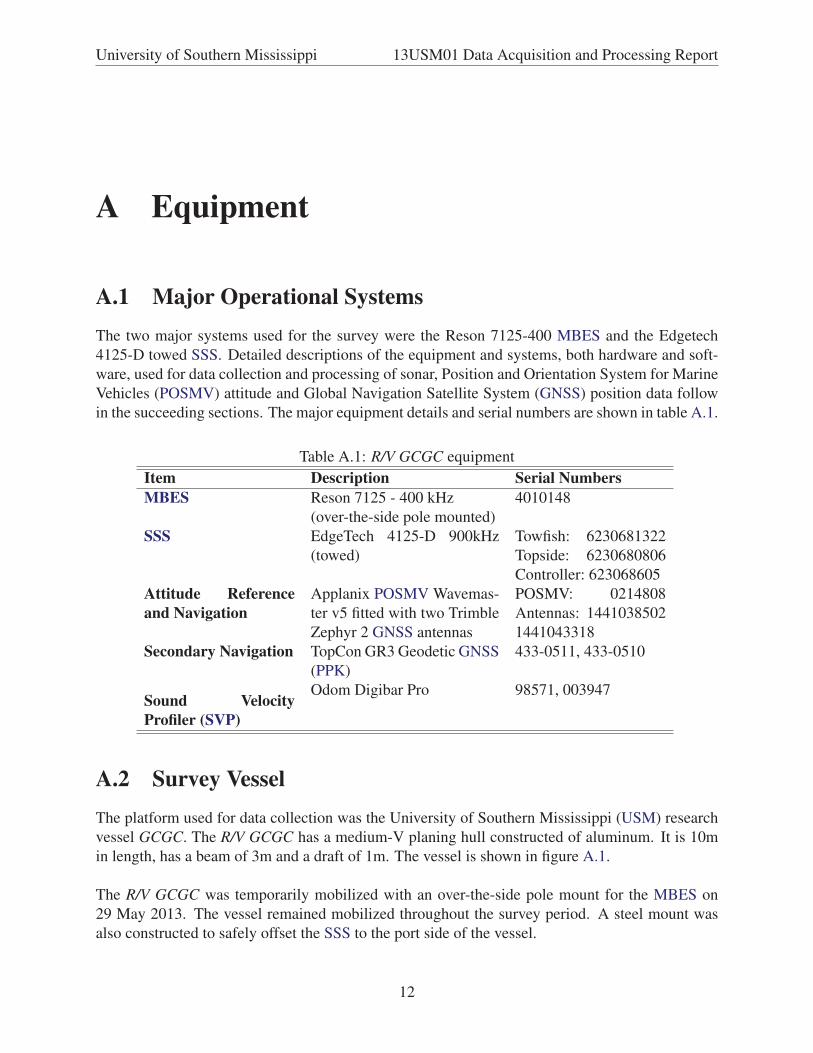
MBES coverage for both areas A and B are shown in figure 1. Side-Scan Sonar (SSS) cover-
age for areas A and B is shown in figure 2. MBES coverage for Area C is shown separately, in
figure 3 and SSS coverage for Area C is shown in figure 4. The final survey areas vary slightly
from the areas shown in the specification in order to alleviate the need for the survey vessel to
venture into inadequately charted areas with depths below 4m.
The survey was conducted to the NOAA 1m object detection survey and International Hydro-
graphic Organization (IHO) Special Order standards.
9
University of Southern Mississippi 13USM01 Data Acquisition and Processing Report
Figure 1: Combined MBES coverage - areas A and B overlaid on chart 11375
Figure 2: Combined SSS coverage - areas A and B overlaid on chart 11375
10
University of Southern Mississippi 13USM01 Data Acquisition and Processing Report
Figure 3: MBES coverage - area C overlaid on chart 11375
Figure 4: SSS coverage - area C overlaid on chart 11375
11
University of Southern Mississippi 13USM01 Data Acquisition and Processing Report
A Equipment
A.1 Major Operational SystemsThe two major systems used for the survey were the Reson 7125-400 MBES and the Edgetech
4125-D towed SSS. Detailed descriptions of the equipment and systems, both hardware and soft-
ware, used for data collection and processing of sonar, Position and Orientation System for Marine
Vehicles (POSMV) attitude and Global Navigation Satellite System (GNSS) position data follow
in the succeeding sections. The major equipment details and serial numbers are shown in table A.1.
Table A.1: R/V GCGC equipment
Item Description Serial NumbersMBES Reson 7125 - 400 kHz 4010148
(over-the-side pole mounted)
SSS EdgeTech 4125-D 900kHz
(towed)
Towfish: 6230681322
Topside: 6230680806
Controller: 623068605
Attitude Referenceand Navigation
Applanix POSMV Wavemas-
ter v5 fitted with two Trimble
Zephyr 2 GNSS antennas
POSMV: 0214808
Antennas: 1441038502
1441043318
Secondary Navigation TopCon GR3 Geodetic GNSS
(PPK)
433-0511, 433-0510
Sound VelocityProfiler (SVP)
Odom Digibar Pro 98571, 003947
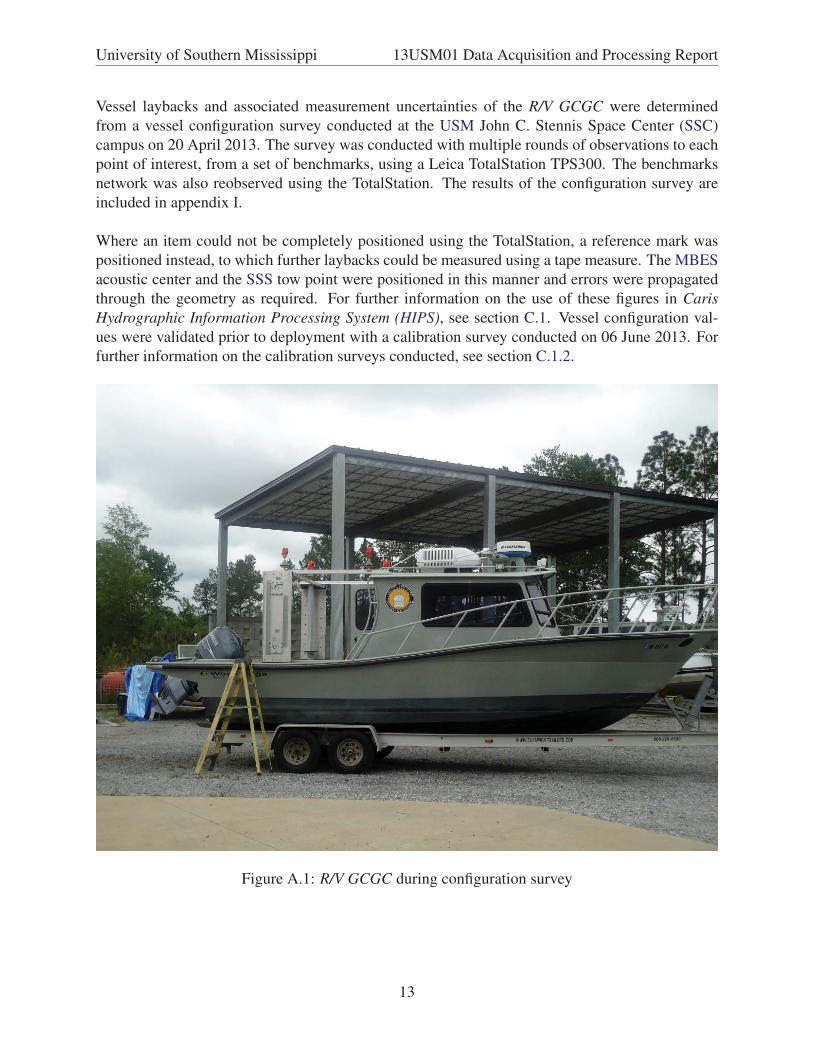
A.2 Survey VesselThe platform used for data collection was the University of Southern Mississippi (USM) research
vessel GCGC. The R/V GCGC has a medium-V planing hull constructed of aluminum. It is 10m
in length, has a beam of 3m and a draft of 1m. The vessel is shown in figure A.1.
The R/V GCGC was temporarily mobilized with an over-the-side pole mount for the MBES on
29 May 2013. The vessel remained mobilized throughout the survey period. A steel mount was
also constructed to safely offset the SSS to the port side of the vessel.
12
University of Southern Mississippi 13USM01 Data Acquisition and Processing Report
Vessel laybacks and associated measurement uncertainties of the R/V GCGC were determined
from a vessel configuration survey conducted at the USM John C. Stennis Space Center (SSC)
campus on 20 April 2013. The survey was conducted with multiple rounds of observations to each
point of interest, from a set of benchmarks, using a Leica TotalStation TPS300. The benchmarks
network was also reobserved using the TotalStation. The results of the configuration survey are
included in appendix I.
Where an item could not be completely positioned using the TotalStation, a reference mark was
positioned instead, to which further laybacks could be measured using a tape measure. The MBES
acoustic center and the SSS tow point were positioned in this manner and errors were propagated
through the geometry as required. For further information on the use of these figures in CarisHydrographic Information Processing System (HIPS), see section C.1. Vessel configuration val-
ues were validated prior to deployment with a calibration survey conducted on 06 June 2013. For
further information on the calibration surveys conducted, see section C.1.2.
Figure A.1: R/V GCGC during configuration survey
13
University of Southern Mississippi 13USM01 Data Acquisition and Processing Report
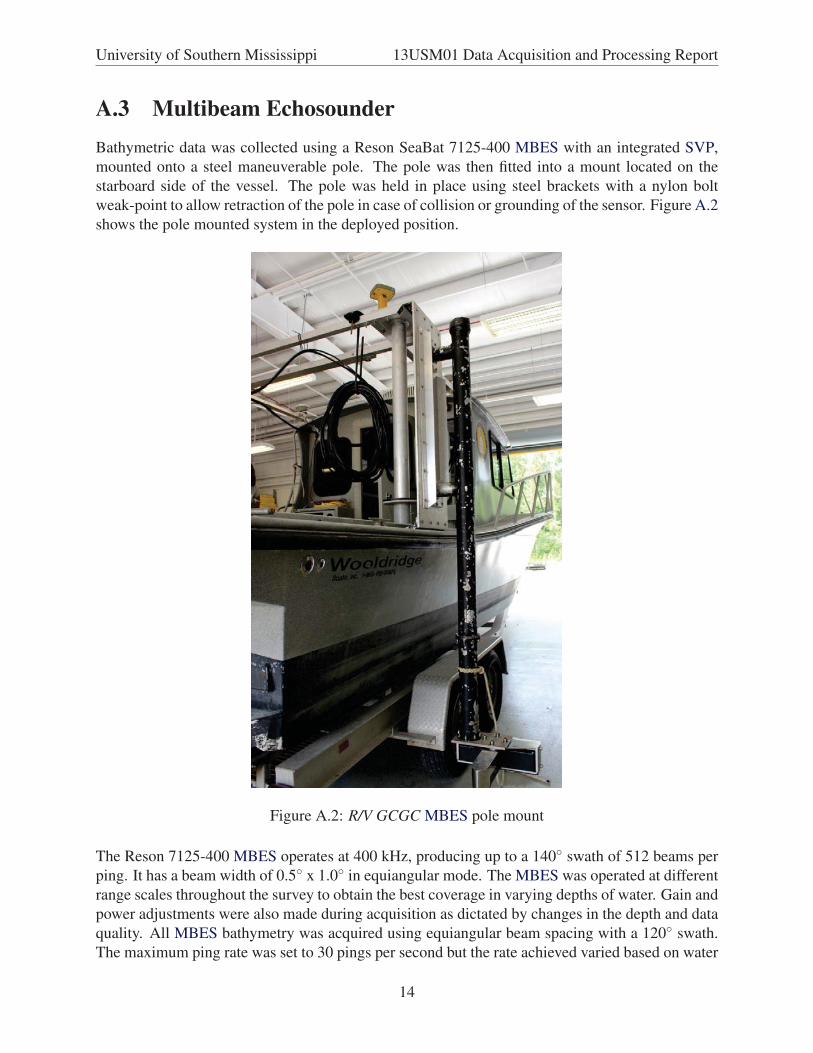
A.3 Multibeam EchosounderBathymetric data was collected using a Reson SeaBat 7125-400 MBES with an integrated SVP,
mounted onto a steel maneuverable pole. The pole was then fitted into a mount located on the
starboard side of the vessel. The pole was held in place using steel brackets with a nylon bolt
weak-point to allow retraction of the pole in case of collision or grounding of the sensor. Figure A.2
shows the pole mounted system in the deployed position.
Figure A.2: R/V GCGC MBES pole mount
The Reson 7125-400 MBES operates at 400 kHz, producing up to a 140◦ swath of 512 beams per
ping. It has a beam width of 0.5◦ x 1.0◦ in equiangular mode. The MBES was operated at different
range scales throughout the survey to obtain the best coverage in varying depths of water. Gain and
power adjustments were also made during acquisition as dictated by changes in the depth and data
quality. All MBES bathymetry was acquired using equiangular beam spacing with a 120◦ swath.
The maximum ping rate was set to 30 pings per second but the rate achieved varied based on water
14
University of Southern Mississippi 13USM01 Data Acquisition and Processing Report
depth. The actual ping rate achieved was generally 12-20 pings per second.
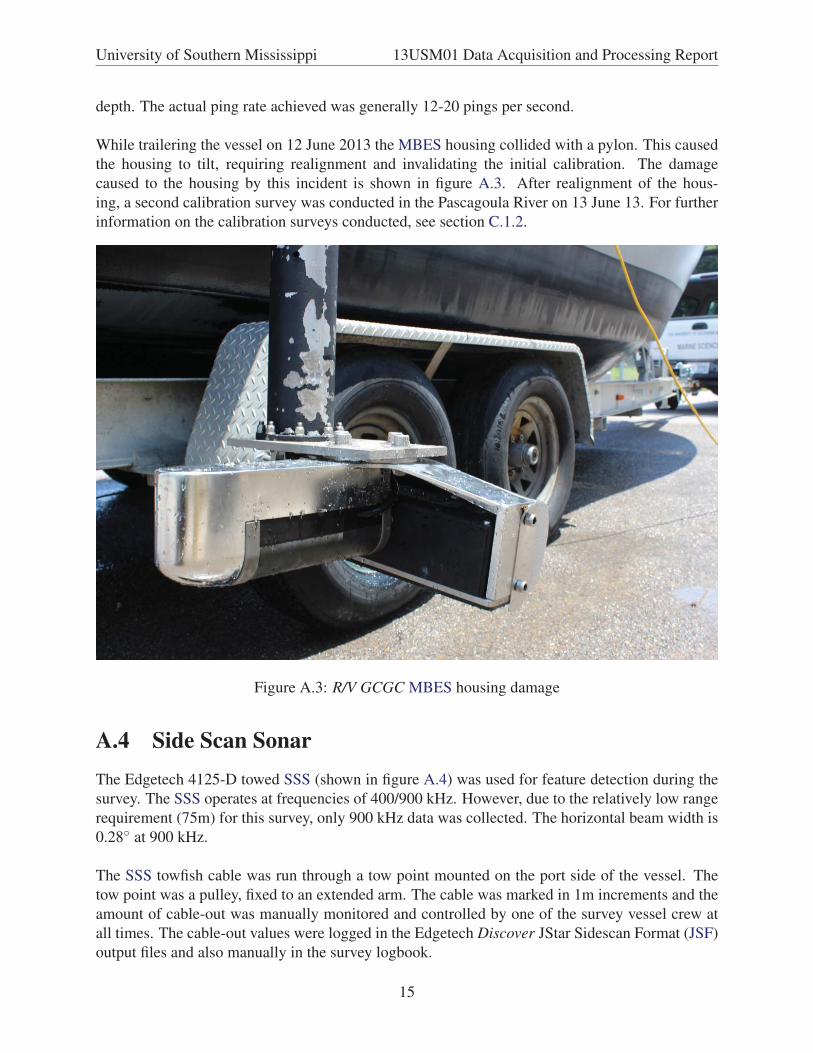
While trailering the vessel on 12 June 2013 the MBES housing collided with a pylon. This caused
the housing to tilt, requiring realignment and invalidating the initial calibration. The damage
caused to the housing by this incident is shown in figure A.3. After realignment of the hous-
ing, a second calibration survey was conducted in the Pascagoula River on 13 June 13. For further
information on the calibration surveys conducted, see section C.1.2.
Figure A.3: R/V GCGC MBES housing damage
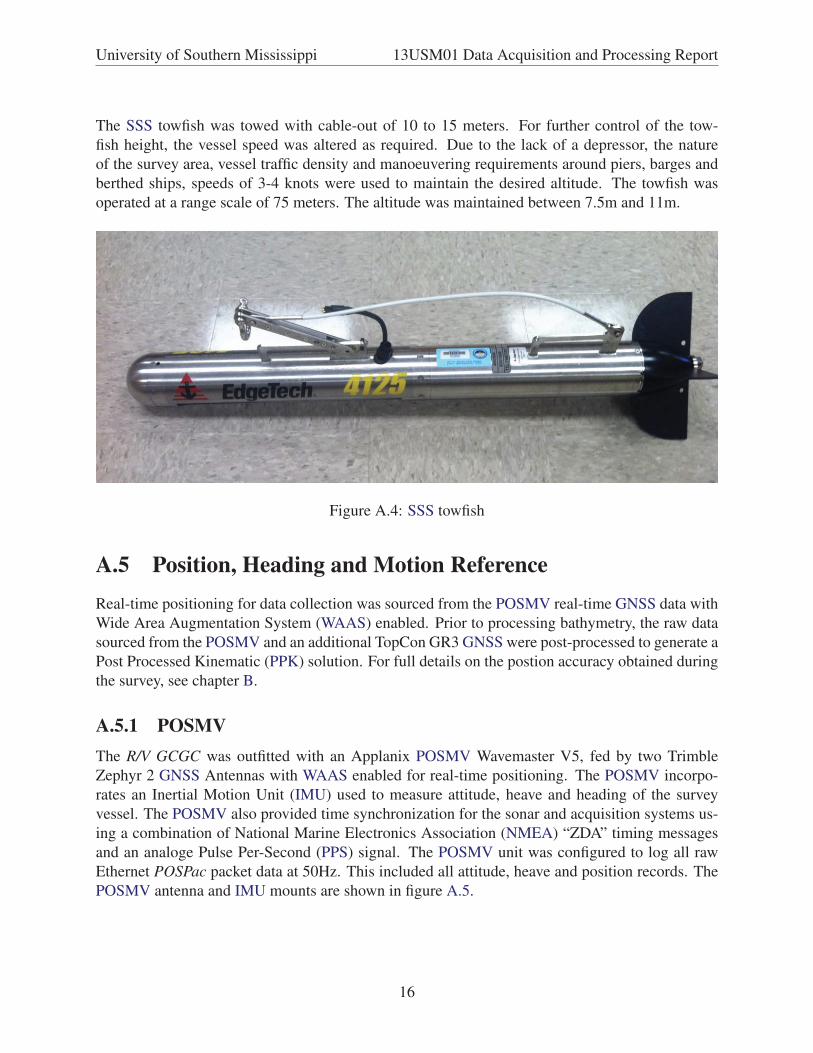
A.4 Side Scan SonarThe Edgetech 4125-D towed SSS (shown in figure A.4) was used for feature detection during the
survey. The SSS operates at frequencies of 400/900 kHz. However, due to the relatively low range
requirement (75m) for this survey, only 900 kHz data was collected. The horizontal beam width is
0.28◦ at 900 kHz.
The SSS towfish cable was run through a tow point mounted on the port side of the vessel. The
tow point was a pulley, fixed to an extended arm. The cable was marked in 1m increments and the
amount of cable-out was manually monitored and controlled by one of the survey vessel crew at
all times. The cable-out values were logged in the Edgetech Discover JStar Sidescan Format (JSF)
output files and also manually in the survey logbook.
15
University of Southern Mississippi 13USM01 Data Acquisition and Processing Report
The SSS towfish was towed with cable-out of 10 to 15 meters. For further control of the tow-
fish height, the vessel speed was altered as required. Due to the lack of a depressor, the nature
of the survey area, vessel traffic density and manoeuvering requirements around piers, barges and
berthed ships, speeds of 3-4 knots were used to maintain the desired altitude. The towfish was
operated at a range scale of 75 meters. The altitude was maintained between 7.5m and 11m.
Figure A.4: SSS towfish
A.5 Position, Heading and Motion ReferenceReal-time positioning for data collection was sourced from the POSMV real-time GNSS data with
Wide Area Augmentation System (WAAS) enabled. Prior to processing bathymetry, the raw data
sourced from the POSMV and an additional TopCon GR3 GNSS were post-processed to generate a
Post Processed Kinematic (PPK) solution. For full details on the postion accuracy obtained during
the survey, see chapter B.
A.5.1 POSMVThe R/V GCGC was outfitted with an Applanix POSMV Wavemaster V5, fed by two Trimble
Zephyr 2 GNSS Antennas with WAAS enabled for real-time positioning. The POSMV incorpo-
rates an Inertial Motion Unit (IMU) used to measure attitude, heave and heading of the survey
vessel. The POSMV also provided time synchronization for the sonar and acquisition systems us-
ing a combination of National Marine Electronics Association (NMEA) “ZDA” timing messages
and an analoge Pulse Per-Second (PPS) signal. The POSMV unit was configured to log all raw
Ethernet POSPac packet data at 50Hz. This included all attitude, heave and position records. The
POSMV antenna and IMU mounts are shown in figure A.5.
16

University of Southern Mississippi 13USM01 Data Acquisition and Processing Report
Figure A.5: POSMV GNSS antenna and IMU unit mounting
A.5.2 TopCon GR3A standalone TopCon GR3 geodetic GNSS receiver was fastened to the starboard-aft GNSS mount-
ing bolt. The TopCon was configured to log dual frequency raw data at 1 Hz. The TopCon GR3
mounting arrangement is shown in figure A.6
Figure A.6: TopCon GR3 mount
17

University of Southern Mississippi 13USM01 Data Acquisition and Processing Report
A.6 Sound Velocity Measurement Systems
A.6.1 Odom Digibar ProTwo Odom Digibar Pro SVPs were used to collect manual casts at intervals between 1-2.5 hours.
Intervals were selected on the basis of variability detected in previous casts and comparisons with
the hull sound velocity sensor in the multibeam sonar housing. Surface values from each cast were
frequently compared with the value shown by the hull sound velocity sensor. Using this com-
parison approach, sudden unexpected performance degredation was detected in the Odom Digibar
with serial number 98571 on 12 June 2013. Multibeam sounding operations were suspended until
a second Odom Digibar Pro was sourced through the US Navy Fleet Survey Team (FST). The
Digibar Pro system is shown in figure A.7.
Figure A.7: Odom Digibar Pro sound velocity probe
A.6.2 Reson SVPThe SVP built in to the MBES head was used to constantly track the sound velocity at the trans-
ducer face. This real-time sound velocity was used as the source for beam firing angle calcula-
tion and is stored within the raw eXtensible Triton Format (XTF) and processed Generic Sensor
Format (GSF) data.
18

University of Southern Mississippi 13USM01 Data Acquisition and Processing Report
A.7 Geodetic and Tidal EquipmentBenchmark leveling, geodetic observations and tidal observations were conducted using the equip-
ment detailed in table A.2.
Prior to each use, the Leica NA2002 level was checked for collimation error by multiple obser-
vations over 100m/10m baselines. The largest collimation error observed was 0.002m/100m.
The LevelTroll 700 tide gauge was user calibrated on 29 May 13 in a 1.5m test tank against a
graduated staff. The results of the calibration confirmed that the gauge measurement accuracy was
within the 0.001m requirement stipulated in NOAA Specifications and Deliverables [NOAA, 2013,
§4.2.2, p. 15].
For further information geodetic/tidal equipment, calibration and associated data processing, refer
to the Vertical and Horizontal Control Report.
Table A.2: Geodetic and tidal equipment
Item Description Serial NumbersTide Gauge In-Situ LevelTroll 700 134960
Optical Level Leica NA2002 283627
Geodetic GNSS TopCon GR3 433-0511
433-0510
A.8 Seabed SamplerA Wildco Petite Ponar Grab was used to collect and analyze seabed samples throughout the survey.
The grab sampler has a self-releasing pinch-pin which allows samples to be collected upon impact
with the seabed. The sampler was deployed through the SSS mount pully. GNSS time and position
were noted at the impact of the sampler. Samples were assessed real-time and discarded. The
sampler is shown in figure A.8.
Figure A.8: Wildo Petite Ponar Grab
19
University of Southern Mississippi 13USM01 Data Acquisition and Processing Report
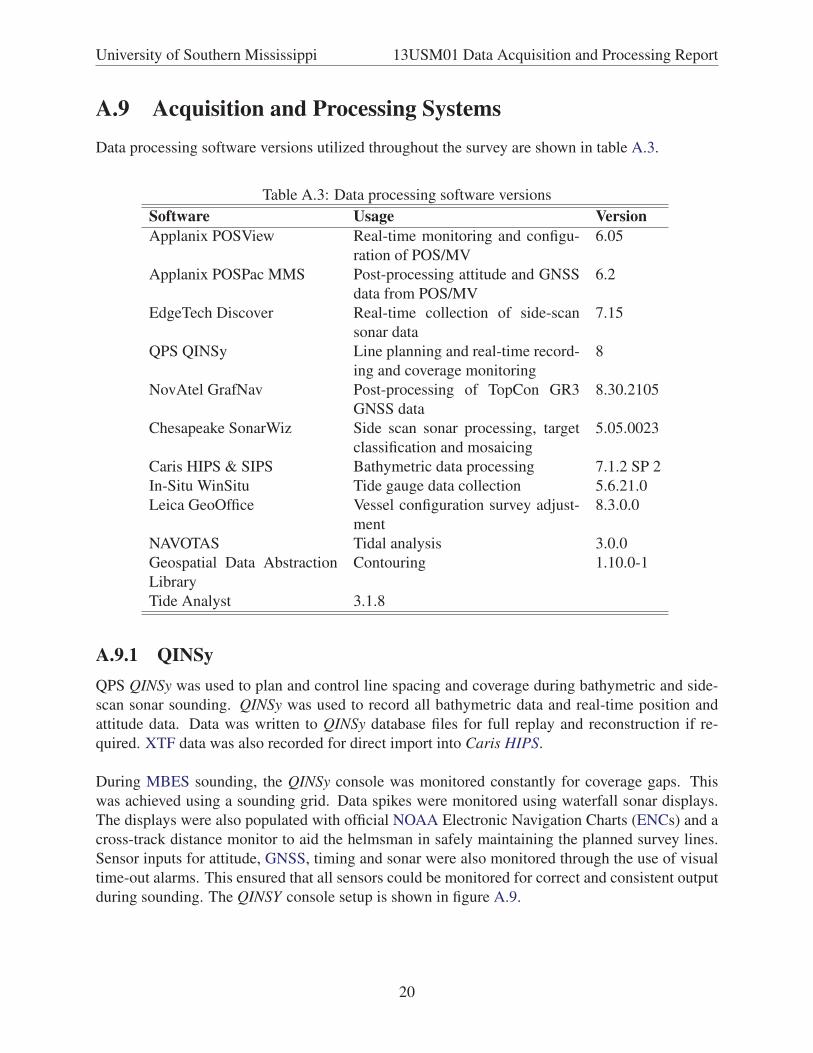
A.9 Acquisition and Processing SystemsData processing software versions utilized throughout the survey are shown in table A.3.
Table A.3: Data processing software versions
Software Usage VersionApplanix POSView Real-time monitoring and configu-
ration of POS/MV
6.05
Applanix POSPac MMS Post-processing attitude and GNSS
data from POS/MV
6.2
EdgeTech Discover Real-time collection of side-scan
sonar data
7.15
QPS QINSy Line planning and real-time record-
ing and coverage monitoring
8
NovAtel GrafNav Post-processing of TopCon GR3
GNSS data
8.30.2105
Chesapeake SonarWiz Side scan sonar processing, target
classification and mosaicing
5.05.0023
Caris HIPS & SIPS Bathymetric data processing 7.1.2 SP 2
In-Situ WinSitu Tide gauge data collection 5.6.21.0
Leica GeoOffice Vessel configuration survey adjust-
ment
8.3.0.0
NAVOTAS Tidal analysis 3.0.0
Geospatial Data Abstraction
Library
Contouring 1.10.0-1
Tide Analyst 3.1.8
A.9.1 QINSyQPS QINSy was used to plan and control line spacing and coverage during bathymetric and side-
scan sonar sounding. QINSy was used to record all bathymetric data and real-time position and
attitude data. Data was written to QINSy database files for full replay and reconstruction if re-
quired. XTF data was also recorded for direct import into Caris HIPS.
During MBES sounding, the QINSy console was monitored constantly for coverage gaps. This
was achieved using a sounding grid. Data spikes were monitored using waterfall sonar displays.
The displays were also populated with official NOAA Electronic Navigation Charts (ENCs) and a
cross-track distance monitor to aid the helmsman in safely maintaining the planned survey lines.
Sensor inputs for attitude, GNSS, timing and sonar were also monitored through the use of visual
time-out alarms. This ensured that all sensors could be monitored for correct and consistent output
during sounding. The QINSY console setup is shown in figure A.9.
20

University of Southern Mississippi 13USM01 Data Acquisition and Processing Report
Figure A.9: QINSy console monitoring during MBES data acquisition in area B
A.9.2 Edgetech DiscoverEdgetech Discover was used for acquisition of SSS data. It was configured to log 900 kHz data
in both Edgetech’s native JSF and also XTF format. SSS tow point laybacks and cable-out values
were applied in real-time using the hypotenuse calculation method:
Layback =√
Cable Out2 − (Depth+Height)2 +O f f set
The Discover acquisition software was running on a separate laptop computer with position and
timing information fed via the POSMV unit with WAAS enabled.
During SSS acquisition, the QINSy and Discover displays were monitored simultaneously. Line
planning and helmsman functions were provided by QINSy, whilst the data recording, towfish
control and coverage mapping functions were provided by Discover.
A.9.3 Caris HIPSBathymetric survey data was processed using CARIS HIPS. Processing methodology followed the
CARIS HIPS workflow for ellipsoid referenced surveys as outlined in the NOAA Field Procedures
Manual [NOAA, 2012]. The workflow is detailed in appendix II.1. Processing methodology and
results are described in more detail in chapter B.
A.9.4 Chesapeake SonarWizChesapeake SonarWiz was used for all SSS data processing. The JSF files recorded by Discoverwere imported and converted to SonarWiz native format for gain adjustment, navigation analysis,
layback checks, slant range correction, feature classification and mosaicing. Further information
on side scan data processing conducted with SonarWiz is included in section B.2.
21
University of Southern Mississippi 13USM01 Data Acquisition and Processing Report
B Quality Control
B.1 Multibeam Echosounder
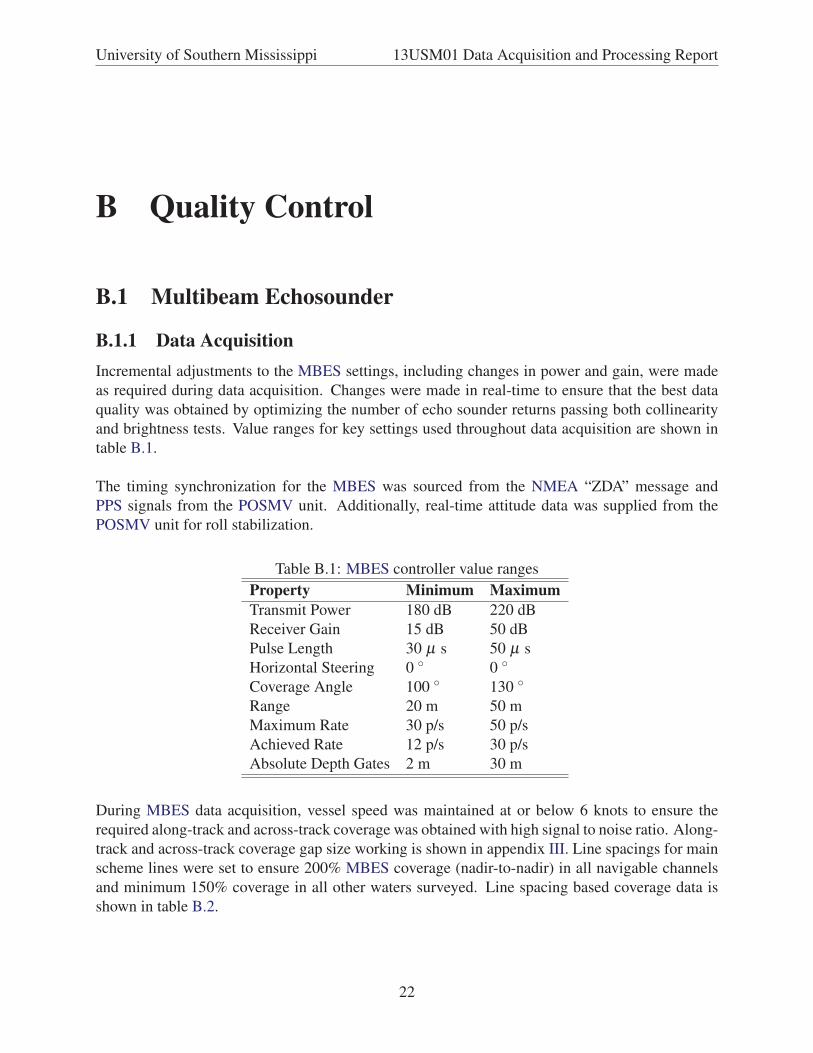
B.1.1 Data AcquisitionIncremental adjustments to the MBES settings, including changes in power and gain, were made
as required during data acquisition. Changes were made in real-time to ensure that the best data
quality was obtained by optimizing the number of echo sounder returns passing both collinearity
and brightness tests. Value ranges for key settings used throughout data acquisition are shown in
table B.1.
The timing synchronization for the MBES was sourced from the NMEA “ZDA” message and
PPS signals from the POSMV unit. Additionally, real-time attitude data was supplied from the
POSMV unit for roll stabilization.
Table B.1: MBES controller value ranges
Property Minimum MaximumTransmit Power 180 dB 220 dB
Receiver Gain 15 dB 50 dB
Pulse Length 30 μ s 50 μ s
Horizontal Steering 0 ◦ 0 ◦Coverage Angle 100 ◦ 130 ◦Range 20 m 50 m
Maximum Rate 30 p/s 50 p/s
Achieved Rate 12 p/s 30 p/s
Absolute Depth Gates 2 m 30 m
During MBES data acquisition, vessel speed was maintained at or below 6 knots to ensure the
required along-track and across-track coverage was obtained with high signal to noise ratio. Along-
track and across-track coverage gap size working is shown in appendix III. Line spacings for main
scheme lines were set to ensure 200% MBES coverage (nadir-to-nadir) in all navigable channels
and minimum 150% coverage in all other waters surveyed. Line spacing based coverage data is
shown in table B.2.
22
University of Southern Mississippi 13USM01 Data Acquisition and Processing Report
Table B.2: MBES mainscheme coverage
Area Planned spacing 200% coverage depths 150% coverage depthsA 16 m > 9m > 4.6 m
B 12 m > 6.8 m > 3.4 m
C 19 m > 10.8 m > 5.4 m
B.1.2 Data ConsistencyThe internal consistency of data was generally good. However, the MBES experienced low signal-
to-noise ratio in waters deeper than 12m. The impact of this was mitigated with IHO special
order 0.5m Combined Uncertainty and Bathymetry Estimator (CUBE) surface generation, 100%
subset checking in Caris HIPS and filtering of soundings to 2 standard deviations from the CUBE
surface. The resulting cleaned dataset is highly consistent and shows typical CUBE node densities
of around 50 soundings. In addition, beams from 1-37 were removed from the data set due to noise
in area B and beams from 470-512 were removed from the area C data set for the same reason. See
the section B.1.3 for further details.
B.1.3 Data Processing
Caris HIPS Vessel File
One Caris HIPS vessel file was created to capture all vessel configurations used during the survey.
Each configuration change is represented in a new section within the file referred by change of
Julian day.
The vessel file contains all laybacks and Total Propagated Uncertainty (TPU) factors for the survey
vessel and its systems. Sensor layback values were calculated from the vessel configuration survey.
Biases were calculated through calibration surveys. TPU values were sourced from measurement
error standard deviations, system manufacturer specifications, and peak-to-peak observed error
values where standard deviations were not available. The vessel file configuration report is in-
cluded in appendix I. For full details of the vessel file values used in echo sounding corrections,
see section C.1.1.
Sound Velocity
Sound velocity casts were conducted at intervals between 1-2.5 hours depending on the variability
observed. In some areas, particularly in the south-western section of area B, the surface sound
velocity was highly variable. This was captured by the hull sound velocity probe built-in to the
MBES. Even with highly variable sound velocity in the upper 1m of water, the sound speed profiles
deeper than 1m were typically consistent with predictable variation. A complete georeferenced
Caris HIPS SVP file is included with the survey data. All sound velocity profiles collected are
included in appendix IV.
23
University of Southern Mississippi 13USM01 Data Acquisition and Processing Report
Navigation and Attitude
Some changes in GNSS constellation geometry and solution quality near large ships, oil rigs and
onshore structures resulted in some short term vertical reference shifts. These shifts were readily
identified in the CUBE surface. In most cases, the shifts were rectified by switching between nav-
igation sources or rejecting the erroneous data. Due to the presence of several vertical shifts in the
POSMV Smoothed Best Estimate of Trajectory (SBET) data for area A, all navigation data in area
A was sourced from the TopCon GR3 GNSS receiver 1Hz data, post-processed (PPK) in GrafNavand augmented with 50Hz SBET attitude-only data processed with POSPac.
The TopCon GNSS and POSMV GNSS data were processed against the Gulf Coast Geospatial
Consortium (GCGC) Gautier Continuously Operating Reference Station (CORS) station 10 (des-
ignation “MSGA”) [GCGC, 2013]. This is a 1Hz reference station. PPK navigation data were con-
sistently resolved to fixed integer ambiguity (quality 1) with rare short periods of floating ambiguity
solutions (quality 2). All standard deviations remained at or below 0.11m. All navigation coor-
dinates were generated using the North American Datum of 1983 (NAD83) (2011/PA11/MA11)
epoch 2010.0 datum. Data was exported from GrafNav into a text file and imported to replace the
real-time navigation in Caris HIPS using the Generic Data Parser tool. Data was exported from
POSPac in SBET format and imported using the Load Attitude/Navigation tool.
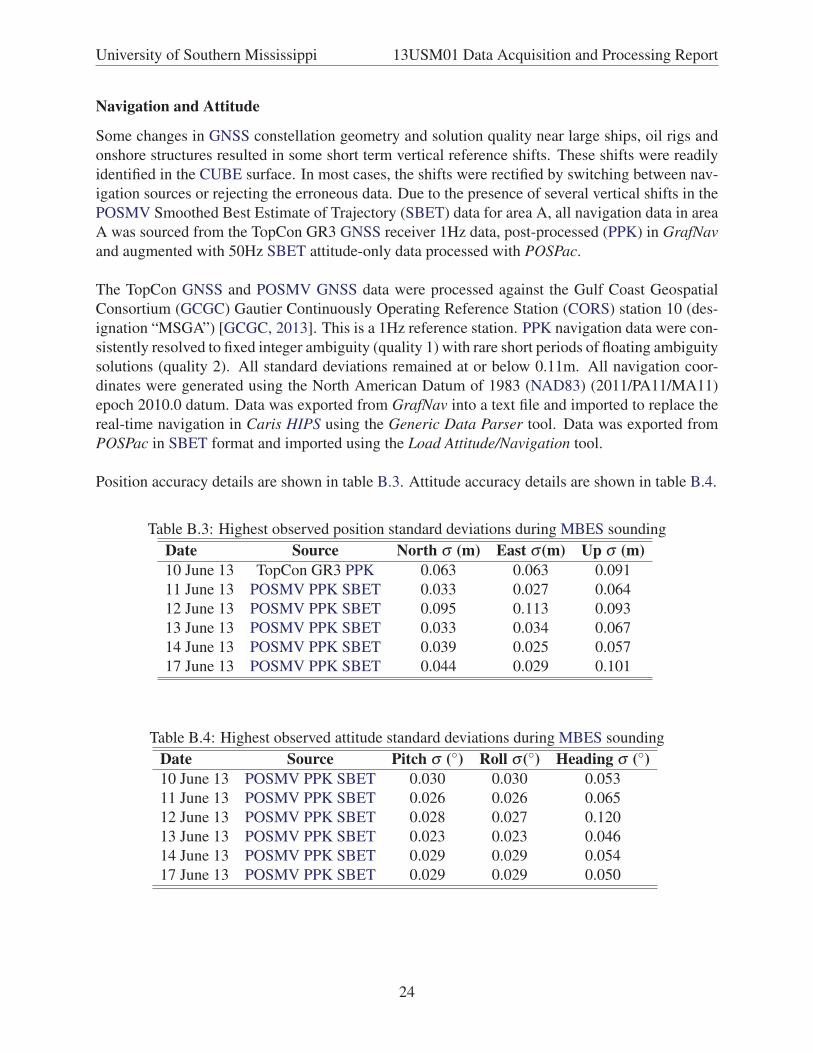
Position accuracy details are shown in table B.3. Attitude accuracy details are shown in table B.4.
Table B.3: Highest observed position standard deviations during MBES sounding
Date Source North σ (m) East σ (m) Up σ (m)10 June 13 TopCon GR3 PPK 0.063 0.063 0.091
11 June 13 POSMV PPK SBET 0.033 0.027 0.064
12 June 13 POSMV PPK SBET 0.095 0.113 0.093
13 June 13 POSMV PPK SBET 0.033 0.034 0.067
14 June 13 POSMV PPK SBET 0.039 0.025 0.057
17 June 13 POSMV PPK SBET 0.044 0.029 0.101
Table B.4: Highest observed attitude standard deviations during MBES sounding
Date Source Pitch σ (◦) Roll σ (◦) Heading σ (◦)10 June 13 POSMV PPK SBET 0.030 0.030 0.053
11 June 13 POSMV PPK SBET 0.026 0.026 0.065
12 June 13 POSMV PPK SBET 0.028 0.027 0.120
13 June 13 POSMV PPK SBET 0.023 0.023 0.046
14 June 13 POSMV PPK SBET 0.029 0.029 0.054
17 June 13 POSMV PPK SBET 0.029 0.029 0.050
24
University of Southern Mississippi 13USM01 Data Acquisition and Processing Report
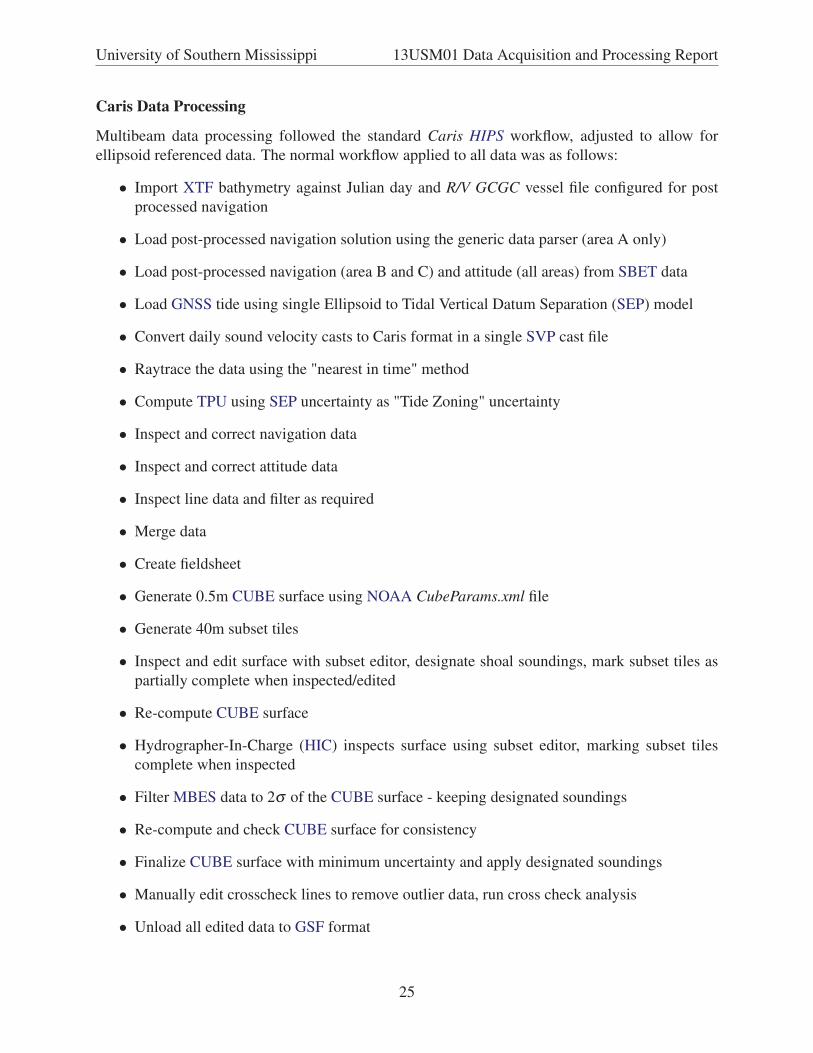
Caris Data Processing
Multibeam data processing followed the standard Caris HIPS workflow, adjusted to allow for
ellipsoid referenced data. The normal workflow applied to all data was as follows:
• Import XTF bathymetry against Julian day and R/V GCGC vessel file configured for post
processed navigation
• Load post-processed navigation solution using the generic data parser (area A only)
• Load post-processed navigation (area B and C) and attitude (all areas) from SBET data
• Load GNSS tide using single Ellipsoid to Tidal Vertical Datum Separation (SEP) model
• Convert daily sound velocity casts to Caris format in a single SVP cast file
• Raytrace the data using the "nearest in time" method
• Compute TPU using SEP uncertainty as "Tide Zoning" uncertainty
• Inspect and correct navigation data
• Inspect and correct attitude data
• Inspect line data and filter as required
• Merge data
• Create fieldsheet
• Generate 0.5m CUBE surface using NOAA CubeParams.xml file
• Generate 40m subset tiles
• Inspect and edit surface with subset editor, designate shoal soundings, mark subset tiles as
partially complete when inspected/edited
• Re-compute CUBE surface
• Hydrographer-In-Charge (HIC) inspects surface using subset editor, marking subset tiles
complete when inspected
• Filter MBES data to 2σ of the CUBE surface - keeping designated soundings
• Re-compute and check CUBE surface for consistency
• Finalize CUBE surface with minimum uncertainty and apply designated soundings
• Manually edit crosscheck lines to remove outlier data, run cross check analysis
• Unload all edited data to GSF format
25

University of Southern Mississippi 13USM01 Data Acquisition and Processing Report
Three preliminary CUBE surfaces were generated from the corrected soundings. One surface was
generated for each of the three survey areas. All CUBE surfaces were generated at 0.5m reso-
lution, using IHO special order conditions and CUBE parameters embedded in the NOAA Field
Procedures Manual [NOAA, 2012].
All preliminary CUBE surfaces were 100% inspected using the Caris HIPS subset editor. 40m
subset tiles were used to track inspection status. All significant bathymetric features identified
were inspected to determine the shoalest sounding over the feature. Shoal soundings were flagged
as designated to prevent filtering and to ensure inclusion in the finalized surface.
After the CUBE surface had been 100% inspected and all identified features had been flagged,
the entire sounding set was filtered to remove unflagged soundings with distances greater than 2σfrom the CUBE surface. This filtering was performed to remove water column noise from the
sounding set. CUBE surfaces were then recalculated to ensure that the filtering had not adversely
affected any part of the surface.
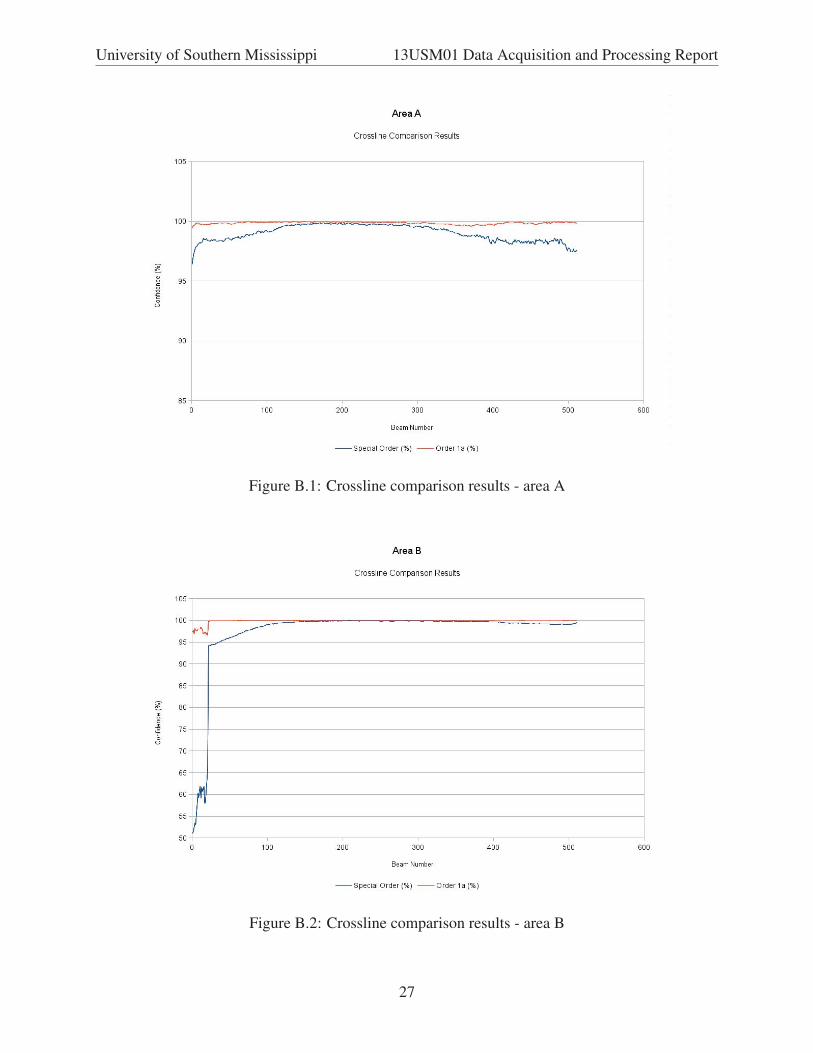
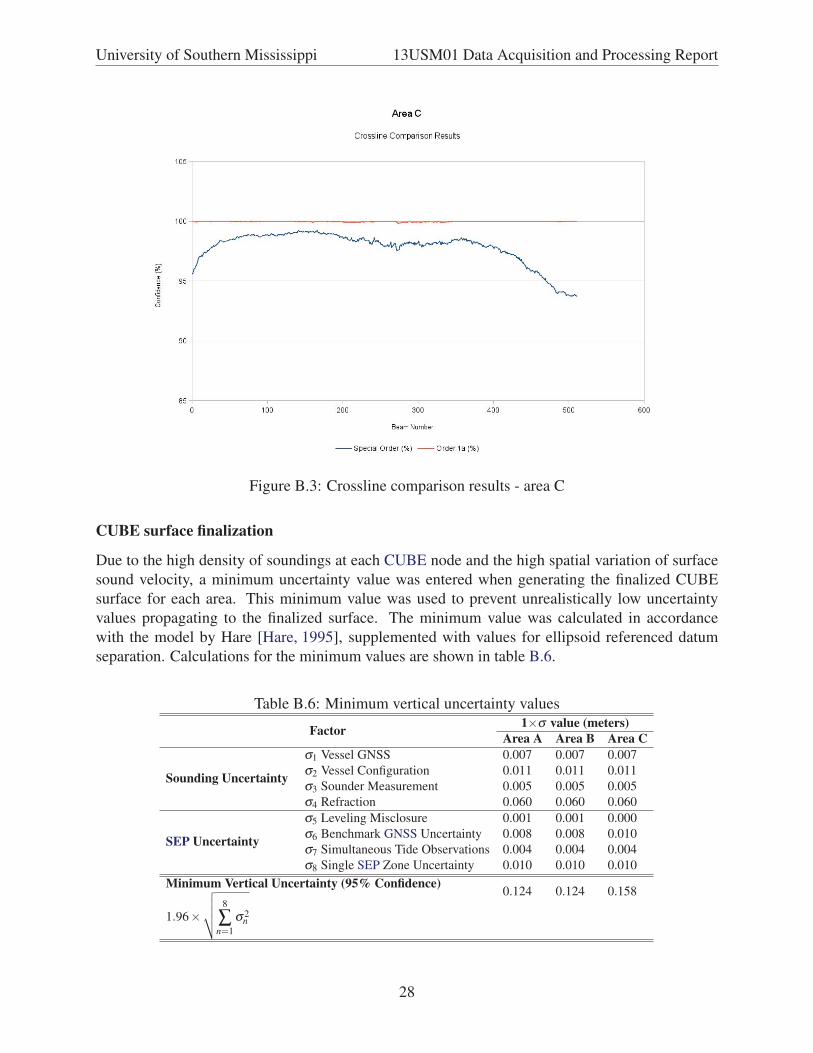
Crossline Comparisons
Crosslines were run perpendicular to main scheme survey lines with a spacing of 15 times the
main line spacing (as recommended by the IHO [IHO, 2008]). Crossline comparisons were con-
ducted using the Caris HIPS Quality Control (QC) Report tool. Each finalized CUBE surface was
assessed independently. The crossline sounding data was grouped by beam number (1-512 in in-
crements of 1). Any beams showing performance below the IHO special order 95% confidence
interval were excluded from the CUBE surface using a beam reject filter. The surface was then
rebuilt and the coverage reassessed.
For area B, beams from 1-37 were excluded from the surface. For area C, beams from 470-512
were exluded from the surface. Subsequently, all crossline comparisons meet the requirements of
Special Order. IHO Order 1a was met without any requirement for beam rejection. For a sum-
mary of results see table B.5. Results are also shown graphically for area A (figure B.1), area B
(figure B.2) and area C (figure B.3) separately.
Table B.5: Crossline comparison results
Area No. Beams No. Beams Order 1a Special Order Highest Mean Difference (m)Order 1a Special Order Met? Met? (Included beams only)
A 512 (100%) 512 (100%) Yes Yes 0.128
B 512 (100%) 475 (93%) Yes Yes (after filtering) 0.033
C 512 (100%) 469 (92%) Yes Yes (after filtering) 0.012
26
University of Southern Mississippi 13USM01 Data Acquisition and Processing Report
Figure B.1: Crossline comparison results - area A
Figure B.2: Crossline comparison results - area B
27
University of Southern Mississippi 13USM01 Data Acquisition and Processing Report
Figure B.3: Crossline comparison results - area C
CUBE surface finalization
Due to the high density of soundings at each CUBE node and the high spatial variation of surface
sound velocity, a minimum uncertainty value was entered when generating the finalized CUBE
surface for each area. This minimum value was used to prevent unrealistically low uncertainty
values propagating to the finalized surface. The minimum value was calculated in accordance
with the model by Hare [Hare, 1995], supplemented with values for ellipsoid referenced datum
separation. Calculations for the minimum values are shown in table B.6.
Table B.6: Minimum vertical uncertainty values
Factor 1×σ value (meters)Area A Area B Area C
Sounding Uncertainty
σ1 Vessel GNSS 0.007 0.007 0.007
σ2 Vessel Configuration 0.011 0.011 0.011
σ3 Sounder Measurement 0.005 0.005 0.005
σ4 Refraction 0.060 0.060 0.060
SEP Uncertainty
σ5 Leveling Misclosure 0.001 0.001 0.000
σ6 Benchmark GNSS Uncertainty 0.008 0.008 0.010
σ7 Simultaneous Tide Observations 0.004 0.004 0.004
σ8 Single SEP Zone Uncertainty 0.010 0.010 0.010
Minimum Vertical Uncertainty (95% Confidence)0.124 0.124 0.158
1.96×√√√√ 8
∑n=1
σ2n
28

University of Southern Mississippi 13USM01 Data Acquisition and Processing Report
B.1.4 Coverage and JunctionsAll CUBE nodes in the finalized surfaces (except those with designated soundings) exhibit uncer-
tainty values equal to those shown in table B.6. This suggests that the TPU values calculated by
Caris HIPS for each node in the preliminary CUBE surfaces were unrealistically low. Therefore,
the values shown in table B.6 were accepted and retained in the finalized surfaces. They are also
supported by the crossline comparison results in section B.1.3.
Although the initial survey requirement was for IHO order 1a, the uncertainty values for all three
surfaces meet the requirements for IHO Special Order [IHO, 2008]. The Caris HIPS surface QC
reports also support this conclusion and are detailed in table B.7.
Table B.7: Caris HIPS surface QC resultsSurface Area_A_Main_50cm_SO_Final.csar Area_B_Main_50cm_Final.csar Area_C_Main_50cm_Final.csar
Holiday search radius 1 1 1
Holiday minimum nodes 7 7 7
Holiday layer created Yes Yes Yes
Error values from Uncertainty Uncertainty Uncertainty
Number of Nodes Processed 2851339 2014717 9092679
Number of Nodes Populated 2851194 (99.99%) 2014533 (99.9%) 9092545 (100.0%)
Number of Holidays Detected 17 24 3
Nodes within IHO Special Order 100% 100% 100.0%
Residual Mean (m) -0.138 -0.139 -0.111
The Caris HIPS surface QC results in table B.7 indicate the existence of some holidays greater than
two nodes in CUBE surfaces of all three areas. 17 holiday nodes exist in area A, 24 in area B and
3 in area C. These holiday areas are stored as holiday layers in the Caris Spatial ARchive (CSAR)
files submitted with this survey.
Despite the small holidays in the MBES data, Over 280% SSS coverage was also achieved through-
out all survey areas. All features identified in SSS data have been fully investigated using MBES to
establish the least depth. No SSS holidays exist within the bathymetry area and no MBES holidays
exist over the tops of significant features. Consequently, the NOAA object detection standard has
been met for the area surveyed.
One junction exists within the survey area. This is the junction between areas A and B. In this
area, the two finalized CUBE surfaces are in agreement. The mean vertical difference between the
two finalized CUBE surfaces is 0m with a standard deviation of 0.07m. Horizontal positioning
differences are within one node (less than 0.5m). As areas A and B were processed with different
navigation sources from different days, this junction area serves to validate the navigation solutions
against one another and also to validate the GNSS tide approach.
B.1.5 SEP/GNSS Tide ValidationIn order to formally validate the use of GNSS tide data, the crosslines for each area were re-
processed with verified traditional tide data from the NOAA tide stations at the NOAA Lab,
Pascagoula and Dock E, Bayou Casotte. 0.5m CUBE surfaces were then calculated from the
29

University of Southern Mississippi 13USM01 Data Acquisition and Processing Report
traditional tide crosslines and differenced with the finalized CUBE surfaces for each area. Separa-
tions between the traditional tide and GNSS tide surfaces are shown in table B.8. The values are
within the 95% confidence interval for each surface. This suggests that the final SEP values used
were valid and that survey data has been appropriately reduced to the tidal datum, Mean Lower
Low Water (MLLW) National Tidal Datum Epoch (NTDE) 1983-2001, using ellipsoid referenced
positioning.
Table B.8: SEP/GNSS tide validationArea NOAA Station NOAA tide vs GNSS tide σ (m)
mean surface difference (m)Area A NOAA Lab (8741533) 0.04 0.11
Area B NOAA Lab (8741533) 0.11 0.06
Area C Dock E (8741041) -0.02 0.08
B.2 Side Scan Sonar
B.2.1 Data Acquisition and Confidence ChecksSSS data acquisition occured after each area had been assessed with MBES. The SSS was towed
with fixed cable out of 10 to 15 meters depending on area. Further control of the SSS towfish
height was obtained by altering vessel speed as required. The range scale used for all SSS data
collection was 75 meters. The towfish altitude was maintained between 7 to 11 meters above the
sea floor. The line spacing was 40 meters, which resulted in a survey coverage of 288% coverage,
with 187% overlap.
One major deviation from the specifications was made during the course of the survey. This was
the selection of the 75m range scale, instead of the planned 50m range scale. Due to the lack of a
depressor wing on the towfish, minimum achievable altitudes were higher than planned - approxi-
mately 7.5m - 10m. Consequently, the range scale was adjusted to 75m. Line spacing was kept to
40m and the vessel speed was reduced to approximately 3-4kt. Confidence checks confirmed the
theoretical 1m object detection capability at the adjusted range scale:
Max Speed(ms−1) =Target Size(m)×PRF(s−1)
3=
1m×(
1502ms−1
75m×2
)
3= 3.34ms−1 ≈ 6.5knots
The towed side scan sonar performance was checked on an opportunity basis on multiple occasions
throughout each period of use. Checks were conducted using man-made objects including tyres and
pylons with less than 0.5m diameter, at or near the full 75m range scale used. All confidence checks
demonstrated that the sonar was capable of resolving objects smaller than the 1m requirement at
the edge of the range scale. Significantly better resoluton than the 1m requirement was obtained at
ranges exceeding 40m (200% coverage envelope). This enabled detection and also classification
of features well below the required size. An example is shown in figure B.4
30

University of Southern Mississippi 13USM01 Data Acquisition and Processing Report
Figure B.4: A car tire and a truck tire at 40m range - high resolution of SSS enables small object
(<1m) classification rather than just detection within the 200% coverage envelope
B.2.2 Imaging ProcessingThe SSS data was reviewed constantly during collection. Significant features, water column dis-
turbances and surface effects were manually logged and recorded in the JSF data.
The JSF lines were imported to SonarWiz using time variable gain set to 60 dB in the JSF specific
options. 80% of cable-out layback was applied based on feature position matching on reciprocal
lines. Altitude tracking was checked prior to slant range correction. User gain control was adjusted
for all survey lines in order to generate three consistent mosaics, one for each of the three different
survey areas. All lines were 100% examined using the SonarWiz digitizer tool. Feature identifi-
cation and capture was performed on each line. As the survey areas consisted of approach routes
and channels, detected features less than 1m in any dimension were also indentified as significant.
Features were classified and reports were generated using the SonarWiz automated reporting tools.
All feature reports are included in appendix V
B.2.3 Review Process and Proof of CoverageThe clarity and intensity of the SSS data were reviewed throughout the collection period and tow-
fish paramaters were adjusted as required. Coverage was monitored in real-time using the Dis-cover coverage mapping tool to ensure that no data gaps occurred. The line data and mosaics
were independently processed and checked by different team members to ensure that features were
adequately classified and that coverage gaps did not occur.
B.2.4 Feature SelectionThe intended feature detection size limit was 1m in any dimension. However, the side scan sonar
often produced higher resolution data, enabling smaller contacts to be classified. Any contact
31

University of Southern Mississippi 13USM01 Data Acquisition and Processing Report
showing a significant shadow or reflection at or below 1m in any dimension was digitized and
included in the feature report. Feature selection complied with the requirements stipulated in the
NOAA Specifications and Deliverables [NOAA, 2013, §6.1.3.2].
All features, were digitized with at least an image, a position and a shadow length measurement
in order to obtain an estimate of the feature height. Horizontal dimensions were also captured and
where possible, features were type classified.
B.2.5 Seabed SamplesSeabed sampling was completed on 19 June 2013. The Petite Ponar Grab was used to sample
the top 5-10cm of seabed sediment in several locations distributed throughout each area. The
locations sampled were selected by assessing possible texture boundaries from return intensity
variation observed in the gain corrected SSS mosaics. The full list of samples is shown in table B.9.
Figure B.5 shows a typical sample of the sediment common throughout the area.
Table B.9: Seabed samples collected 19 June 2013 with S-57 encoding values
Time (UTC) Latitude Longitude NATSUR NATQUA COLOUR1546 30◦ 19’58.135"N 88◦ 30’41.491"W Clay (2) Stiff (7) Grey (7)
1555 30◦ 19 56.592"N 88◦ 30’42.198"W Clay, Silt (2,3) Sticky, Fine (5,1) Grey, Grey (7,7)
1603 30◦ 20 01.759"N 88◦ 30’45.022"W Silt (3) Fine (1) Grey (7)
1611 30◦ 20’16.015"N 88◦ 30’36.409"W Silt (3) Fine (1) Grey (7)
1621 30◦ 20 58.481"N 88◦ 30’27.109"W Silt (3) Fine (1) Grey (7)
1654 30◦ 20’22.511"N 88◦ 34’42.107"W Silt (3) Fine (1) Grey (7)
1701 30◦ 20’23.870"N 88◦ 34’32.278"W Silt (3) Fine (1) Grey (7)
1707 30◦ 20’34.408"N 88◦ 34’22.150"W Silt (3) Fine (1) Grey (7)
1715 30◦ 20’35.752"N 88◦ 34’00.576"W Silt (3) Fine (1) Grey (7)
1721 30◦ 20’54.328"N 88◦ 33’55.827"W Silt (3) Fine (1) Grey (7)
1728 30◦ 21’29.543"N 88◦ 33’52.965"W Silt (3) Fine (1) Grey (7)
1733 30◦ 21’53.892"N 88◦ 33’54.499"W Silt (3) Fine (1) Grey (7)
32

University of Southern Mississippi 13USM01 Data Acquisition and Processing Report
Figure B.5: Typical sediment
B.2.6 Seabed TextureBeam averaged backscatter data was generated from the MBES XTF packets. However, this data
was low quality due to significant water column noise. Consequently, processed SSS mosaics
were used in place of MBES backscatter to infer seabed texture distribution. The general intensity
variation across all mosaics was minimal, suggesting little variation in seabed texture across the
survey area. The only observed variation occured at the southern end of area C where a naturally
deeper part of the maintained channel contained sticky clay sediment in addition to the fine silt
found elsewhere. Seabed sample data is recorded in the S57 Final Feature File submitted with this
dataset.
B.3 Aids to NavigationWhile many aids to navigation existed in the vicinity of the survey area, only those accessible by
boat could be investigated due to security requirements and construction at the shore sites. Two
ranges were investigated for their bearing accuracy. These were Bayou Casotte Range “C” and
Pascagoula River Range “C” and both were correct. Five floating navigational aids were also
positioned using PPK GNSS data sourced from the TopCon GR3 (see table B.10). As all survey
activities were conducted during daylight hours, light characteristics were not assessed. Several
33

University of Southern Mississippi 13USM01 Data Acquisition and Processing Report
floating navigation aids were found to be off station and one floating aid had not yet been charted.
However, none of the off station navigation aids were displaced to the degree that they could not
serve their purpose.
Table B.10: Floating aids to navigation positioned on 17 June 2013Timestamp and Area Name Feature No. Verified Charted Distance off Bearing fromImagery Position Position station (m) station (◦)1557.32 B Pascagoula Navy 8230 30◦ 20’ 31.30434"N 30◦ 20’ 31.574"N 7 146
Channel Buoy No. 1 88◦ 34 25.42717"W 88◦ 34’ 25.252"W
1604.38 B Lighted Buoy 8215 30◦ 20’ 31.38903"N 30◦ 20’ 31.684"N 7 164
No. 51 88◦ 34’ 05.23274"W 88◦ 34’ 25.546"W
1610.43 A Uncharted Red - 30◦ 20’ 53.99064"N - - -
can buoy 88◦ 33’ 53.10713"W
1615.25 A Spoil Bank Day 8165 30◦ 21’ 05.56792"N 30◦ 21’ 05.976"N 12 149
Bn No. 2 88◦ 33’ 57.90609"W 88◦ 33’ 58.248"W
1621.09 A Spoil Bank Day 8150 30◦ 21’ 19.40770"N 30◦ 21’ 19.728"N 37 263
Bn No. 4 88◦ 33’ 52.94808"W 88◦ 33’ 51.660"W
34
University of Southern Mississippi 13USM01 Data Acquisition and Processing Report
C Corrections to Echo Soundings
C.1 Caris HIPS Vessel FileA single Caris HIPS vessel file was generated for use over the entire survey period. This file con-
tained separate date-stamped sections to account for changes to navigation source and calibration
parameters. The source data for the vessel laybacks was a vessel configuration survey described
in section C.1.1. Calibration parameters were generated from calibration surveys as described in
section C.1.2. TPU parameters were sourced from manufacturer specifications, and propagation of
observed measurement uncertainties.
C.1.1 Vessel Offsets
Vessel Configuration Parameters and Laybacks
On 20 April 2013, a vessel configuration survey for the R/V GCGC was conducted using a Leica
TPS300 TotalStation, standard Leica prisms and Leica reflective tapes. The 2013 USM Hydro-
graphic Class used a pre-installed set of benchmarks at the USM Center for Marine Science. The
R/V GCGC was oriented in the network of benchmarks to maximize the visibility of a number of
prisms installed on the vessel equipment mounting points. Using the TotalStation, the horizon-
tal distance, horizontal angles and vertical angles between each benchmark, and each prism were
measured. The GNSS and IMU sensor positions were all observed from multiple stations. Ad-
ditional reference marks were also observed to aid in positioning other devices. All benchmarks
were also observed from each other to aid in network adjustment. The set up is shown in figure C.1.
The measurements were least-squares adjusted in 3-dimensions using Lieca GeoOffice. The coor-
dinate system was then rotated and translated from the survey local reference frame to the vessel
reference frame. Uncertainty values calculated during adjustment were retained for use in calcu-
lating the Caris HIPS vessel configuration file TPU entries.
The position of the SSS tow point and MBES acoustic center were measured with a tape measure,
relative to marks positioned with the TotalStation. The uncertanty associated with the TotalStation
measurement was propagated through the geometry along with the increased uncertainty associ-
ated with tape-measurement. For this reason, uncertainty values for these sensor positions were an
order of magnitude higher than that of the marks positioned by TotalStation alone.
Full results of the calibration survey are included in appendix I.2.
35

University of Southern Mississippi 13USM01 Data Acquisition and Processing Report
Figure C.1: R/V GCGC set up for the configuration survey
Principle Systems
The principle system positions and associated uncertainties derived from the vessel configuration
file are shown in table C.1.
Table C.1: Vessel configuration (X=bow+, Y=starboard+, Z=down+)
Sensor X (m) Y (m) Z (m) σX (m) σY (m) σZ (m)POSMV IMU 0.6152 0.7014 -0.1623 0.0028 0.0013 0.0021
POSMV GNSS 1 -0.2823 -0.9265 -2.0712 0.0037 0.0017 0.0028
POSMV GNSS 2 -0.2947 0.9099 -2.0889 0.0028 0.0013 0.0021
TopCon GR3 GNSS -1.6647 0.9079 -2.0872 0.0030 0.0013 0.0022
MBES -1.6673 1.6343 0.8893 0.0278 0.0137 0.0111
SSS Towpoint -2.01 -1.430 -1.580 0.0300 0.0300 0.0300
The layback values were entered into the POSMV unit so as to ensure real-time translation of
heave, pitch, roll and azimuth data to the vessel center of rotation. Laybacks were also entered
into QINSy to ensure accurate display of vessel position during real-time collection, and to ensure
inclusion of layback values in the output XTF data. Finally, the laybacks were combined with the
36
University of Southern Mississippi 13USM01 Data Acquisition and Processing Report
manufacturer uncertainty and empirical uncertainty values and entered into the Caris HIPS vessel
file. The vessel report is included in appendix I.
C.1.2 Multibeam Calibration
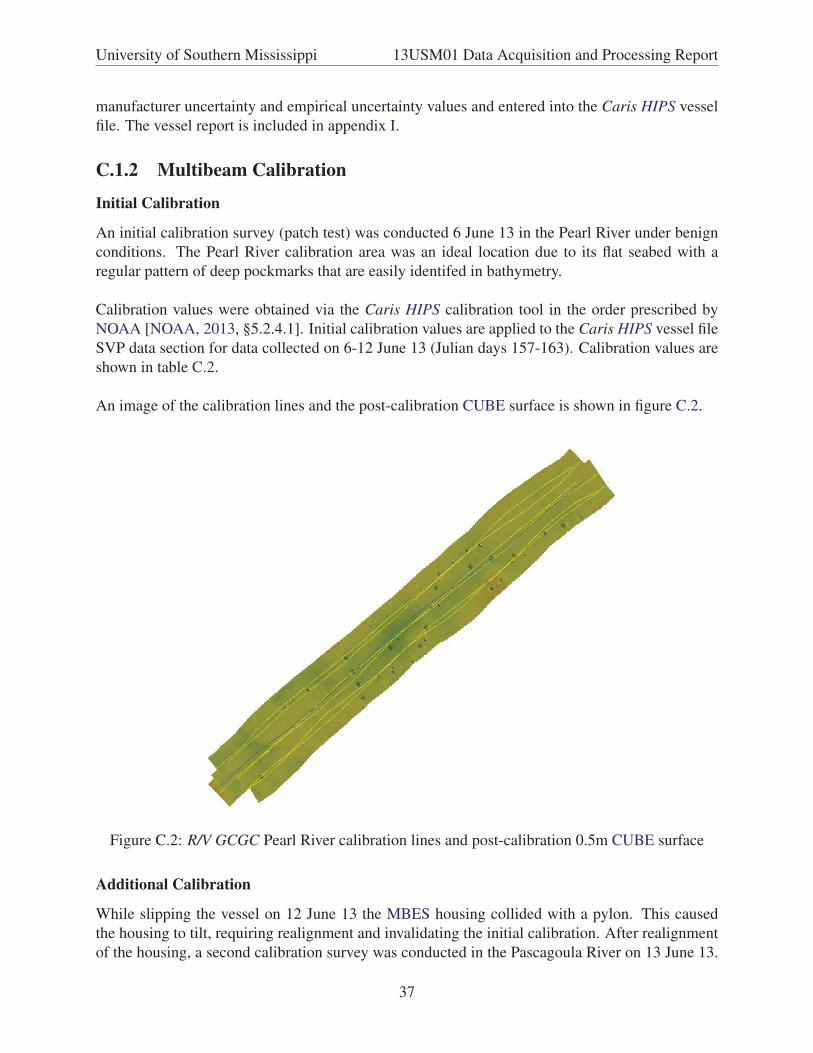
Initial Calibration
An initial calibration survey (patch test) was conducted 6 June 13 in the Pearl River under benign
conditions. The Pearl River calibration area was an ideal location due to its flat seabed with a
regular pattern of deep pockmarks that are easily identifed in bathymetry.
Calibration values were obtained via the Caris HIPS calibration tool in the order prescribed by
NOAA [NOAA, 2013, §5.2.4.1]. Initial calibration values are applied to the Caris HIPS vessel file
SVP data section for data collected on 6-12 June 13 (Julian days 157-163). Calibration values are
shown in table C.2.
An image of the calibration lines and the post-calibration CUBE surface is shown in figure C.2.
Figure C.2: R/V GCGC Pearl River calibration lines and post-calibration 0.5m CUBE surface
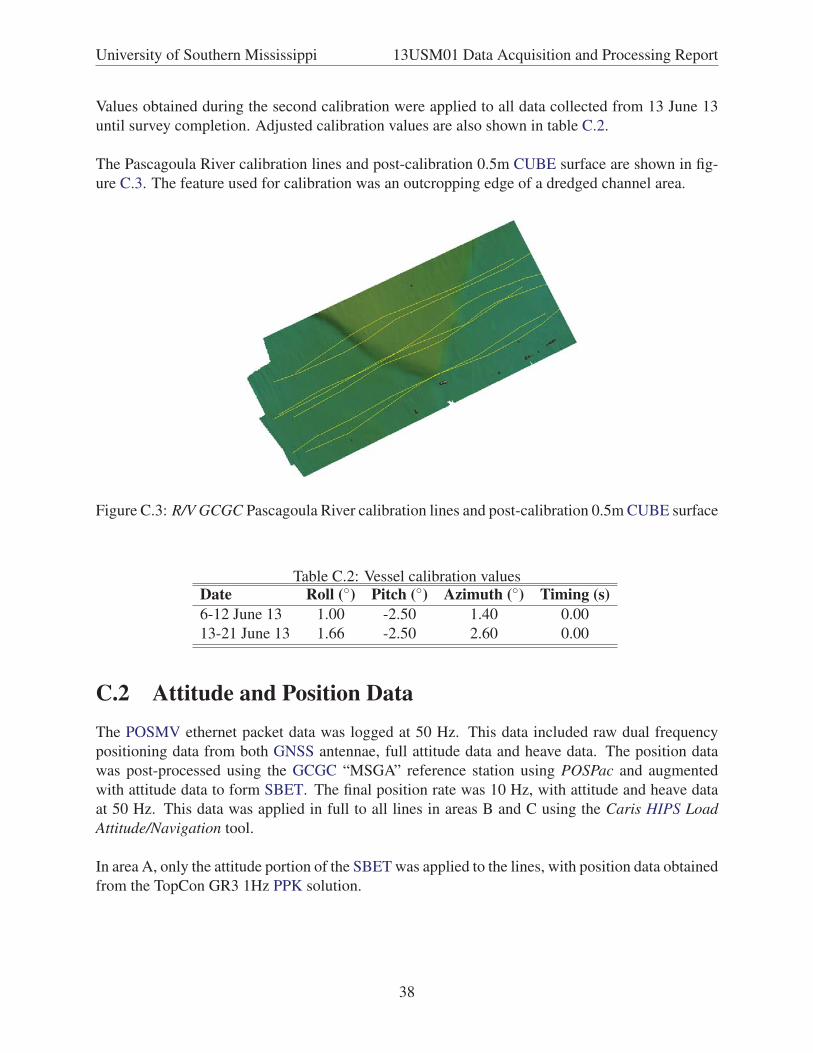
Additional Calibration
While slipping the vessel on 12 June 13 the MBES housing collided with a pylon. This caused
the housing to tilt, requiring realignment and invalidating the initial calibration. After realignment
of the housing, a second calibration survey was conducted in the Pascagoula River on 13 June 13.
37
University of Southern Mississippi 13USM01 Data Acquisition and Processing Report
Values obtained during the second calibration were applied to all data collected from 13 June 13
until survey completion. Adjusted calibration values are also shown in table C.2.
The Pascagoula River calibration lines and post-calibration 0.5m CUBE surface are shown in fig-
ure C.3. The feature used for calibration was an outcropping edge of a dredged channel area.
Figure C.3: R/V GCGC Pascagoula River calibration lines and post-calibration 0.5m CUBE surface
Table C.2: Vessel calibration valuesDate Roll (◦) Pitch (◦) Azimuth (◦) Timing (s)6-12 June 13 1.00 -2.50 1.40 0.00
13-21 June 13 1.66 -2.50 2.60 0.00
C.2 Attitude and Position DataThe POSMV ethernet packet data was logged at 50 Hz. This data included raw dual frequency
positioning data from both GNSS antennae, full attitude data and heave data. The position data
was post-processed using the GCGC “MSGA” reference station using POSPac and augmented
with attitude data to form SBET. The final position rate was 10 Hz, with attitude and heave data
at 50 Hz. This data was applied in full to all lines in areas B and C using the Caris HIPS LoadAttitude/Navigation tool.
In area A, only the attitude portion of the SBET was applied to the lines, with position data obtained
from the TopCon GR3 1Hz PPK solution.
38

University of Southern Mississippi 13USM01 Data Acquisition and Processing Report
C.3 Tide and Water Level CorrectionsTidal correction of soundings was achieved by using a zoned single SEP model with two discrete
zones. In each zone, the SEP between the NAD83 (CORS 2011/MA11/PA11) epoch 2010.0 ellip-
soid and the MLLW (NTDE 1983-2001) datum reference, at each controlling NOAA tide station
location, was established. This was achieved through geodetic GNSS observations, leveling of
benchmarks and simultaneous tide gauge-staff observations.
A zoned single SEP value approach was chosen as tidal analysis in NAVOTAS indicated less than
1cm range difference and less than 10 minutes phase difference across each zone - significantly
below than the normal NOAA single tide zone limit. For further details, see the Vertical and Hori-
zontal Control Report.
SEP values and uncertainties used are shown in table C.3.
Table C.3: SEP values and uncertainty at 95% confidence
Area SEP (m) Uncertainty (95%) (m)A and B -28.1819 0.0268
C -28.1543 0.0294
These SEP values were entered when using the Caris HIPS Compute GNSS Tide tool as the vertical
separation value to reduce soundings to the tidal datum. GNSS tide was then applied during the
Merge process.
C.4 Sound Velocity CorrectionSound velocity casts conducted during sounding operations were compiled into a single CarisHIPS SVP file. Each cast was accompanied by its collection time, date and position. Every sound-
ing was raytraced through same SVP dataset, using the nearest in time technique. This method
was chosen due to the small survey area sizes and limited geographic distribution of casts.
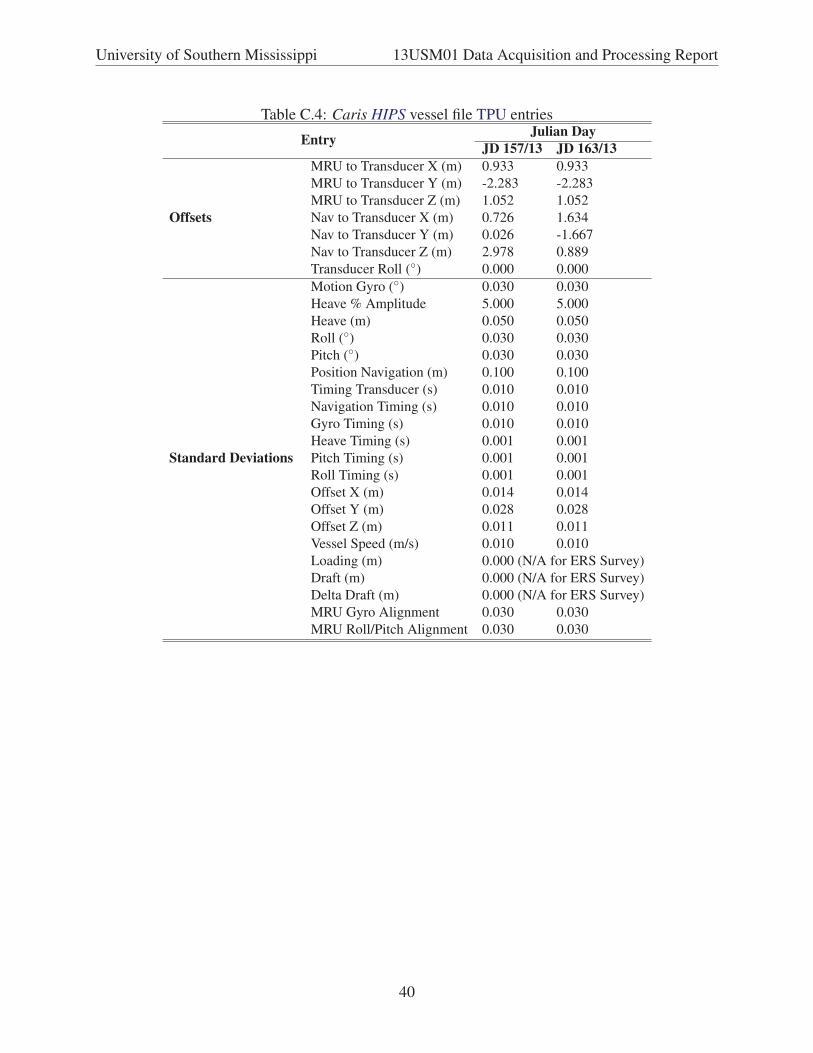
C.5 TPU CalculationManufacturer quoted accuracy values were input into the Caris HIPS Vessel File at 1×σ , in con-
junction with measurement uncertainty values derived from the vessel configuration survey also
at 1σ . Uncertainty values 1σ derived from GNSS tide values (see table C.3) was included in the
Caris HIPS TPU calculation tool as “Zoning” uncertainty. This is in accordance with the method
stipulated in the NOAA Field Procedures Manual [NOAA, 2012, §4.2.3.8]. TPU values used in
the Caris HIPS vessel file are shown in table C.4. These values reflect the change in TPU values
due to switching navigation source from the TopCon GR3 PPK to the POSMV PPK/SBET data.
39
University of Southern Mississippi 13USM01 Data Acquisition and Processing Report
Table C.4: Caris HIPS vessel file TPU entries
Entry Julian DayJD 157/13 JD 163/13
Offsets
MRU to Transducer X (m) 0.933 0.933
MRU to Transducer Y (m) -2.283 -2.283
MRU to Transducer Z (m) 1.052 1.052
Nav to Transducer X (m) 0.726 1.634
Nav to Transducer Y (m) 0.026 -1.667
Nav to Transducer Z (m) 2.978 0.889
Transducer Roll (◦) 0.000 0.000
Standard Deviations
Motion Gyro (◦) 0.030 0.030
Heave % Amplitude 5.000 5.000
Heave (m) 0.050 0.050
Roll (◦) 0.030 0.030
Pitch (◦) 0.030 0.030
Position Navigation (m) 0.100 0.100
Timing Transducer (s) 0.010 0.010
Navigation Timing (s) 0.010 0.010
Gyro Timing (s) 0.010 0.010
Heave Timing (s) 0.001 0.001
Pitch Timing (s) 0.001 0.001
Roll Timing (s) 0.001 0.001
Offset X (m) 0.014 0.014
Offset Y (m) 0.028 0.028
Offset Z (m) 0.011 0.011
Vessel Speed (m/s) 0.010 0.010
Loading (m) 0.000 (N/A for ERS Survey)
Draft (m) 0.000 (N/A for ERS Survey)
Delta Draft (m) 0.000 (N/A for ERS Survey)
MRU Gyro Alignment 0.030 0.030
MRU Roll/Pitch Alignment 0.030 0.030
40

University of Southern Mississippi 13USM01 Data Acquisition and Processing Report
D Approval Sheet
PLACEHOLDER - INTENTIONALLY LEFT BLANK
41

University of Southern Mississippi 13USM01 Data Acquisition and Processing Report
Bibliography
[GCGC, 2013] Gulf Coast Geospatial Center/University of Southern Mississippi (2013), GCGCReal Time Network, NAD 83(2011) epoch 2010.00, retrieved from: http://vrsnet.gcgcusm.org/
[Hare, 1995] Hare, R. (1995), “Depth and position error budgets for multibeam echosounding”,
International Hydrographic Review, Monaco, 72(1), March, pp. 33
[IHO, 2005] International Hydrographic Organization (2005), IHO Manual on Hydrography, Pub-
lication C-13, 1st Edition, May 2005, corrected to February 2011, International Hydrographic
Bureau, Monaco.
[IHO, 2008] International Hydrographic Organization (2008), IHO Standards for HydrographicSurveys, 5th Edition, February, International Hydrographic Bureau, Monaco.
[NOAA, 2012] National Oceanic and Atmospheric Administration (2012), NOAA OCS Field Pro-cedures Manual, April, US Department of Commerce.
[NOAA, 2013] National Oceanic and Atmospheric Administration (2013), Coast Pilot 5, chapter
7, pp. 308-314.
[NOAA, 2013] National Oceanic and Atmospheric Administration (2013), NOS HydrographicSpecifications and Deliverables, April, US Department of Commerce.
42

University of Southern Mississippi 13USM01 Data Acquisition and Processing Report
Appendices
43

University of Southern Mississippi 13USM01 Data Acquisition and Processing Appendices
I Vessel Reports
University of Southern Mississippi 13USM01 Data Acquisition and Processing Appendices
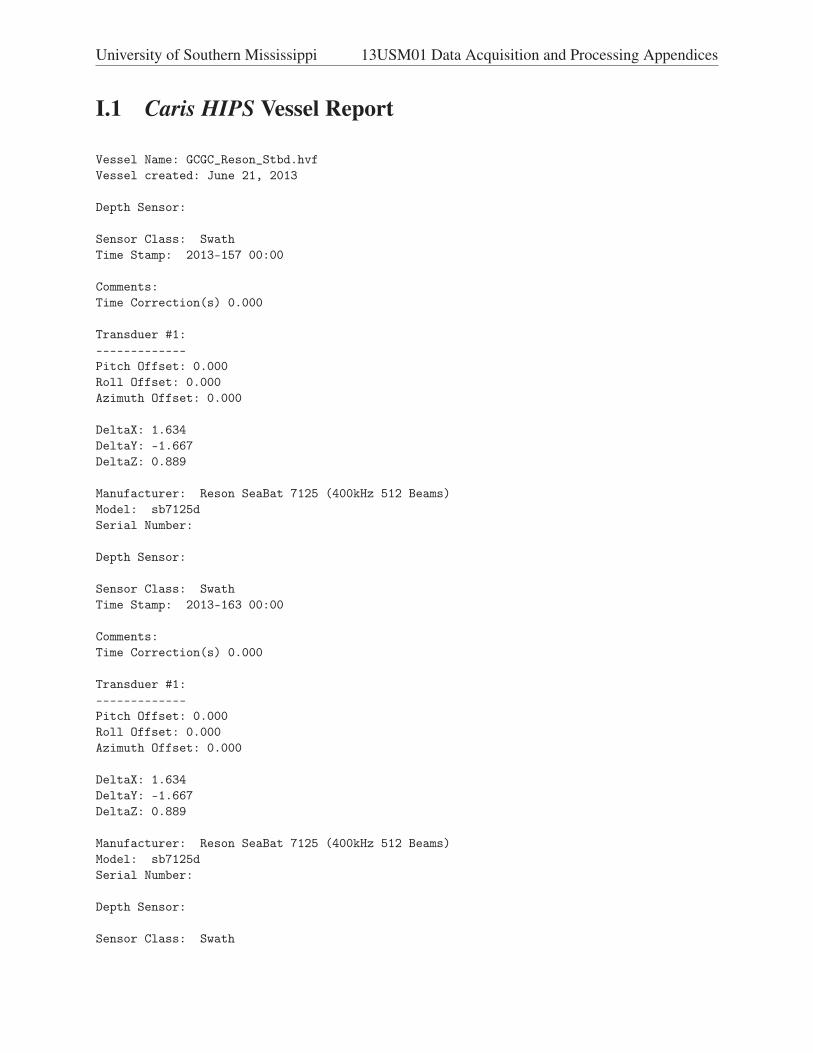
I.1 Caris HIPS Vessel Report
Vessel Name: GCGC_Reson_Stbd.hvf
Vessel created: June 21, 2013
Depth Sensor:
Sensor Class: Swath
Time Stamp: 2013-157 00:00
Comments:
Time Correction(s) 0.000
Transduer #1:
-------------
Pitch Offset: 0.000
Roll Offset: 0.000
Azimuth Offset: 0.000
DeltaX: 1.634
DeltaY: -1.667
DeltaZ: 0.889
Manufacturer: Reson SeaBat 7125 (400kHz 512 Beams)
Model: sb7125d
Serial Number:
Depth Sensor:
Sensor Class: Swath
Time Stamp: 2013-163 00:00
Comments:
Time Correction(s) 0.000
Transduer #1:
-------------
Pitch Offset: 0.000
Roll Offset: 0.000
Azimuth Offset: 0.000
DeltaX: 1.634
DeltaY: -1.667
DeltaZ: 0.889
Manufacturer: Reson SeaBat 7125 (400kHz 512 Beams)
Model: sb7125d
Serial Number:
Depth Sensor:
Sensor Class: Swath

University of Southern Mississippi 13USM01 Data Acquisition and Processing Appendices
Time Stamp: 2013-164 00:00
Comments: Reson Remount
Time Correction(s) 0.000
Transduer #1:
-------------
Pitch Offset: 0.000
Roll Offset: 0.000
Azimuth Offset: 0.000
DeltaX: 1.634
DeltaY: -1.667
DeltaZ: 0.889
Manufacturer: Reson SeaBat 7125 (400kHz 512 Beams)
Model: sb7125d
Serial Number:
_________________________________________________________
Navigation Sensor:
Time Stamp: 2013-157 00:00
Comments: TopCon GNSS
Time Correction(s) 0.000
DeltaX: 0.908
DeltaY: -1.665
DeltaZ: -2.087
Manufacturer: TopCon
Model: GR3
Serial Number: (null)
Time Stamp: 2013-163 00:00
Comments: POSMV SBET
Time Correction(s) 0.000
DeltaX: 0.000
DeltaY: 0.000
DeltaZ: 0.000
Manufacturer: POSMV
Model: v5 Wavemaster
Serial Number:
_________________________________________________________
Gyro Sensor:
Time Stamp: 2013-157 00:00
Comments: (null)
Time Correction(s) 0.000

University of Southern Mississippi 13USM01 Data Acquisition and Processing Appendices
_________________________________________________________
Heave Sensor:
Time Stamp: 2013-157 00:00
Comments: (null)
Apply No
Time Correction(s) 0.000
DeltaX: 0.000
DeltaY: 0.000
DeltaZ: 0.000
Offset: 0.000
Manufacturer: (null)
Model: (null)
Serial Number: (null)
_________________________________________________________
Pitch Sensor:
Time Stamp: 2013-157 00:00
Comments: (null)
Apply No
Time Correction(s) 0.000
Pitch offset: 0.000
Manufacturer: (null)
Model: (null)
Serial Number: (null)
_________________________________________________________
Roll Sensor:
Time Stamp: 2013-157 00:00
Comments: (null)
Apply Yes
Time Correction(s) 0.000
Roll offset: 0.000
Manufacturer: (null)
Model: (null)
Serial Number: (null)
_________________________________________________________
TPU
Time Stamp: 2013-157 00:00
Comments:
Offsets

University of Southern Mississippi 13USM01 Data Acquisition and Processing Appendices
Motion sensing unit to the transducer 1
X Head 1 0.933
Y Head 1 -2.283
Z Head 1 1.052
Motion sensing unit to the transducer 2
X Head 2 0.000
Y Head 2 0.000
Z Head 2 0.000
Navigation antenna to the transducer 1
X Head 1 0.726
Y Head 1 0.026
Z Head 1 2.978
Navigation antenna to the transducer 2
X Head 2 0.000
Y Head 2 0.000
Z Head 2 0.000
Roll offset of transducer number 1 0.000
Roll offset of transducer number 2 0.000
Heave Error: 0.050 or 5.000’’ of heave amplitude.
Measurement errors: 0.014
Motion sensing unit alignment errors
Gyro:0.030 Pitch:0.030 Roll:0.030
Gyro measurement error: 0.030
Roll measurement error: 0.030
Pitch measurement error: 0.030
Navigation measurement error: 0.100
Transducer timing error: 0.010
Navigation timing error: 0.010
Gyro timing error: 0.010
Heave timing error: 0.001
PitchTimingStdDev: 0.001
Roll timing error: 0.001
Sound Velocity speed measurement error: 0.000
Surface sound speed measurement error: 0.000
Tide measurement error: 0.000
Tide zoning error: 0.000
Speed over ground measurement error: 0.010
Dynamic loading measurement error: 0.000
Static draft measurement error: 0.000
Delta draft measurement error: 0.000
StDev Comment: (null)
Time Stamp: 2013-163 00:00
Comments:
Offsets
Motion sensing unit to the transducer 1
X Head 1 0.933
Y Head 1 -2.283
Z Head 1 1.052
Motion sensing unit to the transducer 2

University of Southern Mississippi 13USM01 Data Acquisition and Processing Appendices
X Head 2 0.000
Y Head 2 0.000
Z Head 2 0.000
Navigation antenna to the transducer 1
X Head 1 1.634
Y Head 1 -1.667
Z Head 1 0.889
Navigation antenna to the transducer 2
X Head 2 0.000
Y Head 2 0.000
Z Head 2 0.000
Roll offset of transducer number 1 0.000
Roll offset of transducer number 2 0.000
Heave Error: 0.050 or 5.000’’ of heave amplitude.
Measurement errors: 0.014
Motion sensing unit alignment errors
Gyro:0.030 Pitch:0.030 Roll:0.030
Gyro measurement error: 0.030
Roll measurement error: 0.030
Pitch measurement error: 0.030
Navigation measurement error: 0.100
Transducer timing error: 0.010
Navigation timing error: 0.010
Gyro timing error: 0.010
Heave timing error: 0.001
PitchTimingStdDev: 0.001
Roll timing error: 0.001
Sound Velocity speed measurement error: 0.000
Surface sound speed measurement error: 0.000
Tide measurement error: 0.000
Tide zoning error: 0.000
Speed over ground measurement error: 0.010
Dynamic loading measurement error: 0.000
Static draft measurement error: 0.000
Delta draft measurement error: 0.000
StDev Comment: (null)
_________________________________________________________
Svp Sensor:
Time Stamp: 2013-157 00:00
Comments: TopCon GNSS
Time Correction(s) 0.000
Svp #1:
-------------
Pitch Offset: -2.500
Roll Offset: 1.000
Azimuth Offset: 2.600
DeltaX: 1.634
DeltaY: -1.667
University of Southern Mississippi 13USM01 Data Acquisition and Processing Appendices
DeltaZ: 0.889
SVP #2:
-------------
Pitch Offset: 0.000
Roll Offset: 0.000
Azimuth Offset: 0.000
DeltaX: 0.000
DeltaY: 0.000
DeltaZ: 0.000
Time Stamp: 2013-163 00:00
Comments: Change to POSMV
Time Correction(s) 0.000
Svp #1:
-------------
Pitch Offset: -2.500
Roll Offset: 1.000
Azimuth Offset: 2.600
DeltaX: 1.634
DeltaY: -1.667
DeltaZ: 0.889
SVP #2:
-------------
Pitch Offset: 0.000
Roll Offset: 0.000
Azimuth Offset: 0.000
DeltaX: 0.000
DeltaY: 0.000
DeltaZ: 0.000
Time Stamp: 2013-164 00:00
Comments: Reson Remount
Time Correction(s) 0.000
Svp #1:
-------------
Pitch Offset: -2.500
Roll Offset: 1.660
Azimuth Offset: 1.400
DeltaX: 1.634
DeltaY: -1.667
DeltaZ: 0.889

University of Southern Mississippi 13USM01 Data Acquisition and Processing Appendices
SVP #2:
-------------
Pitch Offset: 0.000
Roll Offset: 0.000
Azimuth Offset: 0.000
DeltaX: 0.000
DeltaY: 0.000
DeltaZ: 0.000
_________________________________________________________
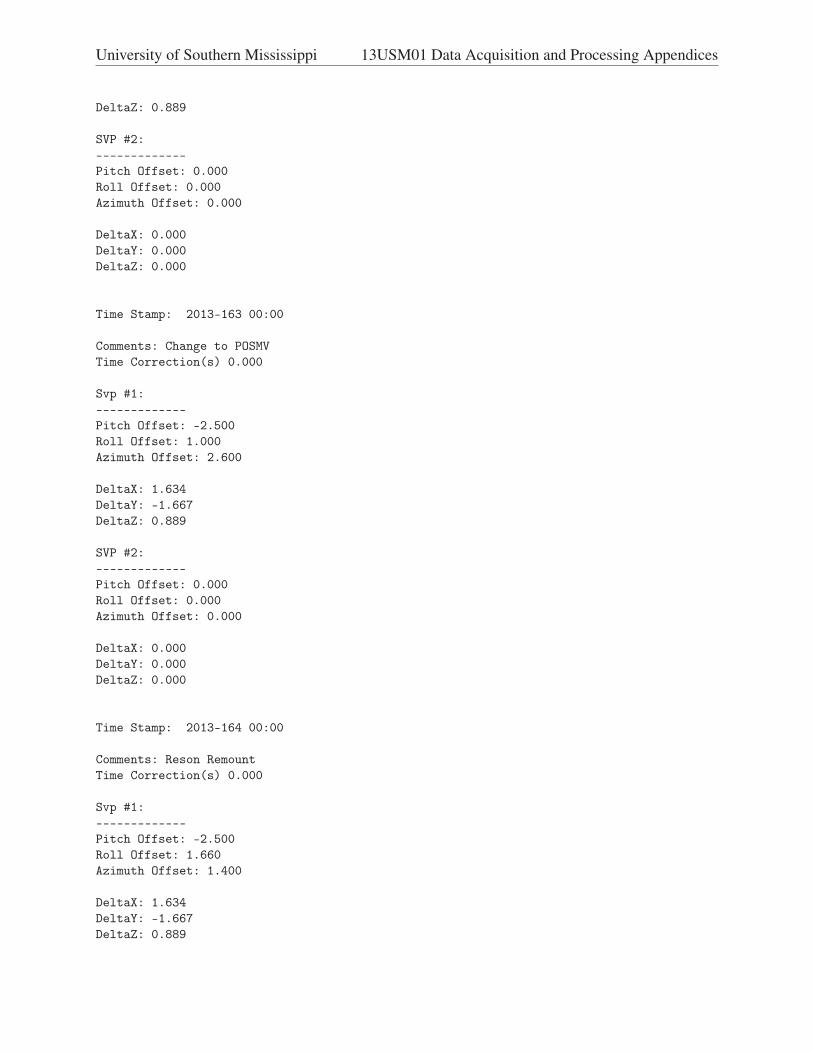
Figure I.1: Caris HIPS vessel configuration

University of Southern Mississippi 13USM01 Data Acquisition and Processing Appendices
I.2 Vessel Configuration Survey DataThe benchmark positions, relative to benchmark A, used in the vessel configuration survey are
shown in table I.1
Table I.1: Relative benchmark positions
Point X (m) Y (m) Z (m)A 0.000 0.000 0.000
B 10.356 -2.607 -0.376
C 22.210 -2.920 -0.289
D 27.407 6.397 -0.274
E 20.596 17.525 -0.298
F 15.703 23.538 -0.340
G -0.004 26.679 0.109
H -5.642 13.919 0.067
Positions for relevant sensors and reference points obtained through adjustment in Leica GeoOf-fice are shown in table I.2. An image of the adjusted points and baselines is shown in figure I.2
(NOTE: All distances are in meters and defined in the vessel coordinate system: Y is the centerline
and positive forward, X is athwart ships and positive to starboard, Z is the yaw axis and positive
upwards.)
Table I.2: Sensor/reference positions relative to center of rotation (RM)
Point ID X (m) Y (m) Z (m) σX (m) σY (m) σZ (m)RM 0.0000 0.0000 0.0000 0.000000 0.000000 0.000000
BP -0.4367 4.7189 1.0137 0.001820 0.003678 0.002800
BS 0.4305 4.7280 1.0230 0.001248 0.002928 0.002100
CLA 0.0000 0.0000 1.9150 0.002835 0.006091 0.004600
CLF 0.0000 2.4917 1.7792 0.001633 0.003607 0.002600
IMU 0.7014 0.6152 0.1623 0.001283 0.002834 0.002100
PAGPS -0.9087 -1.6591 2.0711 0.001458 0.003221 0.002400
PFGPS -0.9265 -0.2823 2.0712 0.001691 0.003736 0.002800
PMB -1.2530 -1.6775 0.7781 0.003137 0.007273 0.005400
PMT -1.2530 -1.6663 1.6892 0.003137 0.007273 0.005500
SAGPS 0.9079 -1.6647 2.0872 0.001341 0.002963 0.002200
SFGPS 0.9099 -0.2947 2.0889 0.001283 0.002834 0.002100
SMB 1.2719 -1.6743 0.7962 0.002612 0.006114 0.004600
SMT 1.2647 -1.6602 1.7102 0.002612 0.006114 0.004600
SP -1.1857 -3.7572 0.3929 0.003137 0.007273 0.005500
SS 1.2055 -3.7709 0.4118 0.002694 0.006465 0.004800
PT -1.4590 -1.6719 -0.7488 0.007245 0.024875 0.014106
ST 1.6343 -1.6673 -0.8893 0.013671 0.027819 0.011095
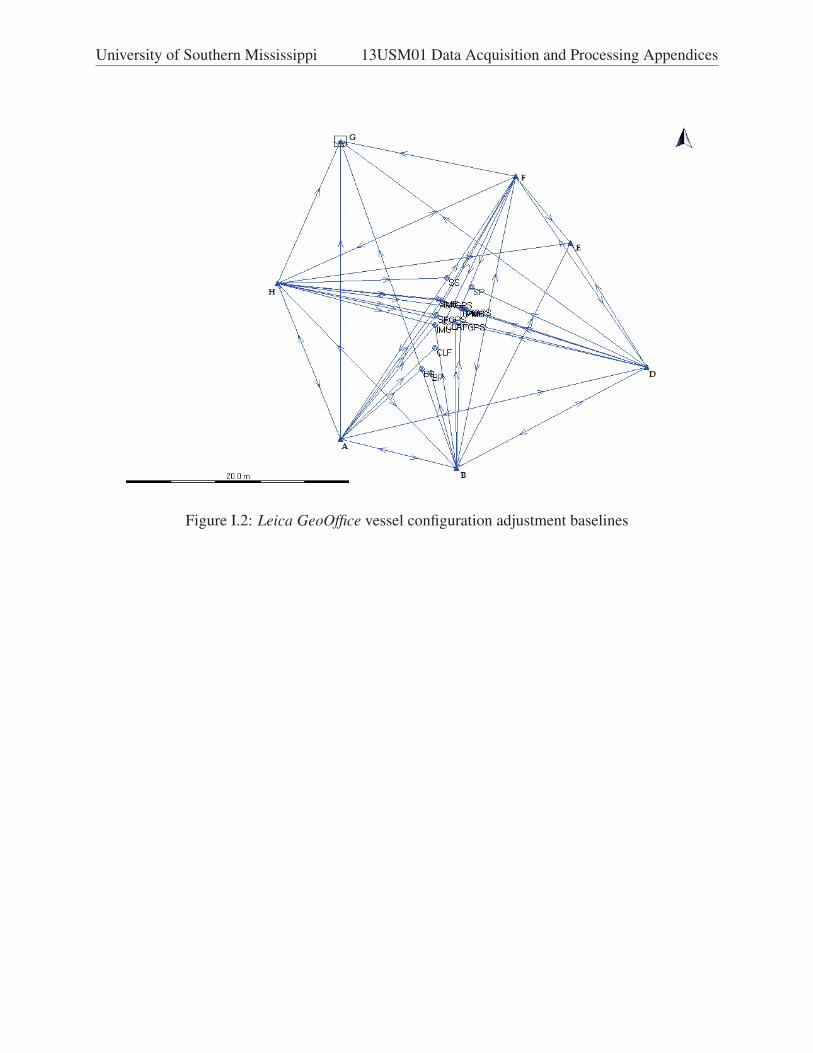
University of Southern Mississippi 13USM01 Data Acquisition and Processing Appendices
Figure I.2: Leica GeoOffice vessel configuration adjustment baselines

University of Southern Mississippi 13USM01 Data Acquisition and Processing Appendices
II Data Processing Workflow Diagrams
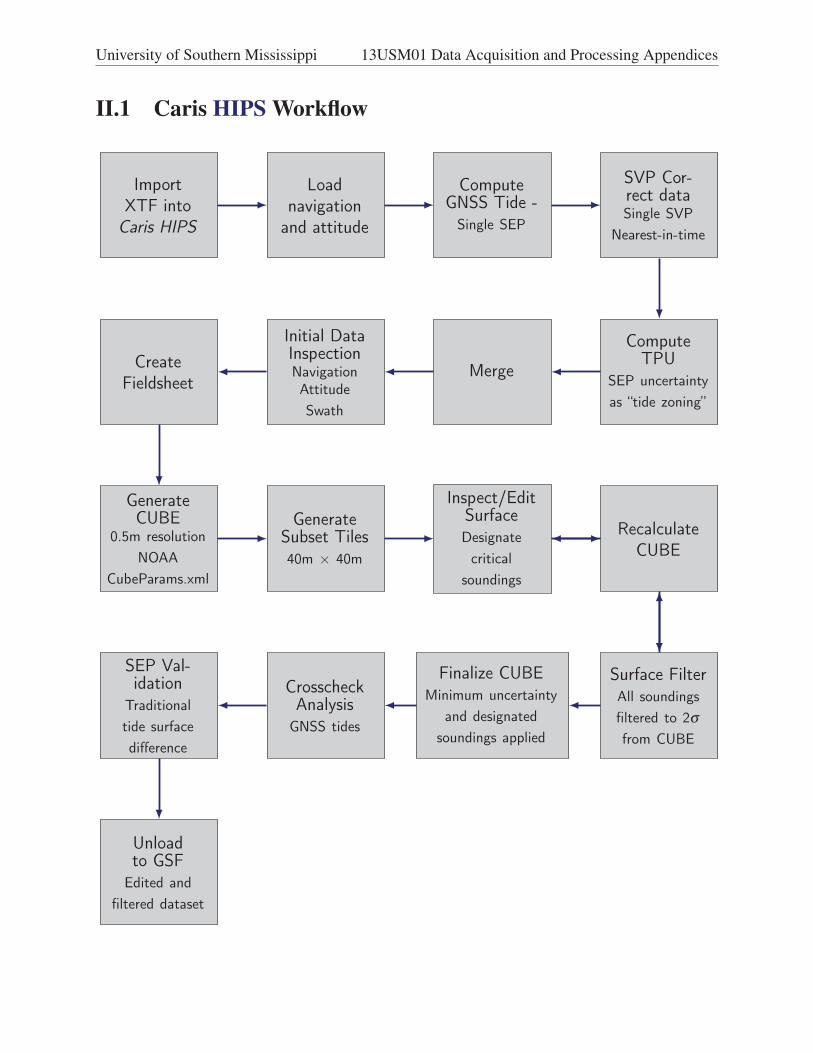
University of Southern Mississippi 13USM01 Data Acquisition and Processing Appendices
II.1 Caris HIPS Workflow
ImportXTF into
Caris HIPS
Loadnavigation
and attitude
ComputeGNSS Tide -
Single SEP
SVP Cor-rect dataSingle SVP
Nearest-in-time
ComputeTPU
SEP uncertaintyas “tide zoning”
Merge
Initial DataInspectionNavigationAttitudeSwath
CreateFieldsheet
GenerateCUBE
0.5m resolutionNOAA
CubeParams.xml
GenerateSubset Tiles40m × 40m
Inspect/EditSurfaceDesignatecritical
soundings
RecalculateCUBE
Surface FilterAll soundingsfiltered to 2σfrom CUBE
Finalize CUBEMinimum uncertainty
and designatedsoundings applied
CrosscheckAnalysis
GNSS tides
SEP Val-idation
Traditionaltide surfacedifference
Unloadto GSF
Edited andfiltered dataset
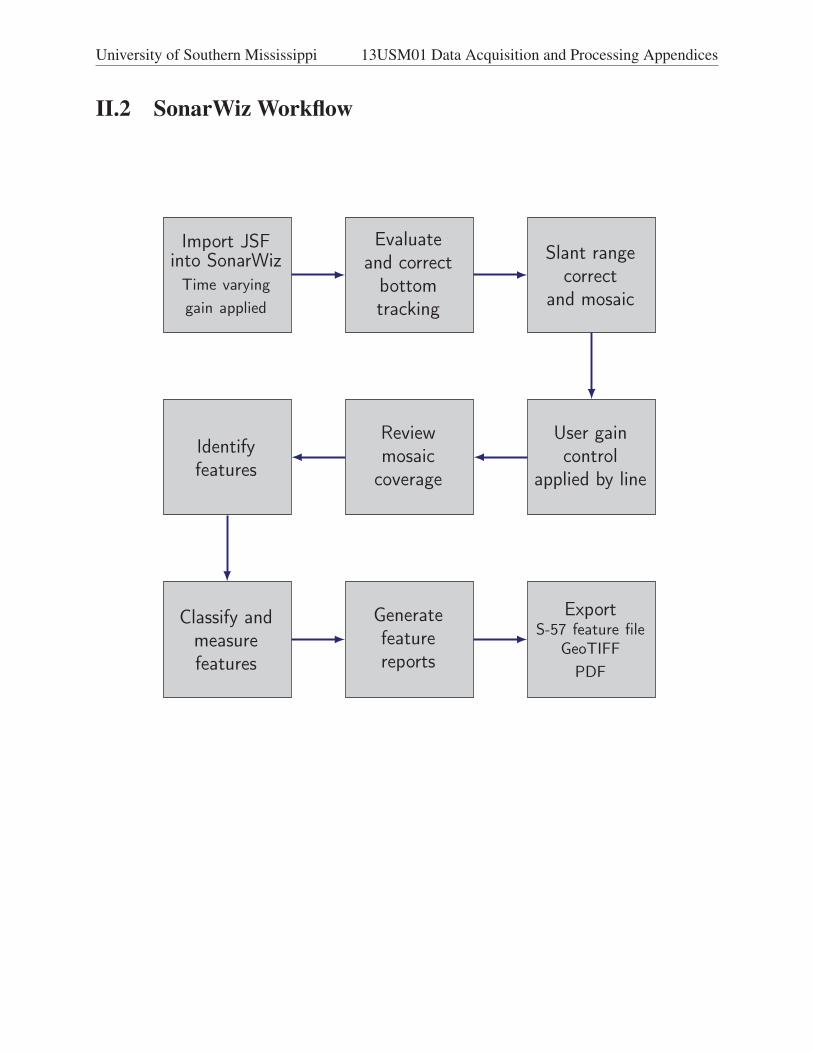
University of Southern Mississippi 13USM01 Data Acquisition and Processing Appendices
II.2 SonarWiz Workflow
Import JSFinto SonarWiz
Time varyinggain applied
Evaluateand correct
bottomtracking
Slant rangecorrect
and mosaic
User gaincontrol
applied by line
Reviewmosaic
coverage
Identifyfeatures
Classify andmeasurefeatures
Generatefeaturereports
ExportS-57 feature file
GeoTIFFPDF

University of Southern Mississippi 13USM01 Data Acquisition and Processing Appendices
III Systems and Sensors

University of Southern Mississippi 13USM01 Data Acquisition and Processing Appendices
III.1 Equipment Wiring
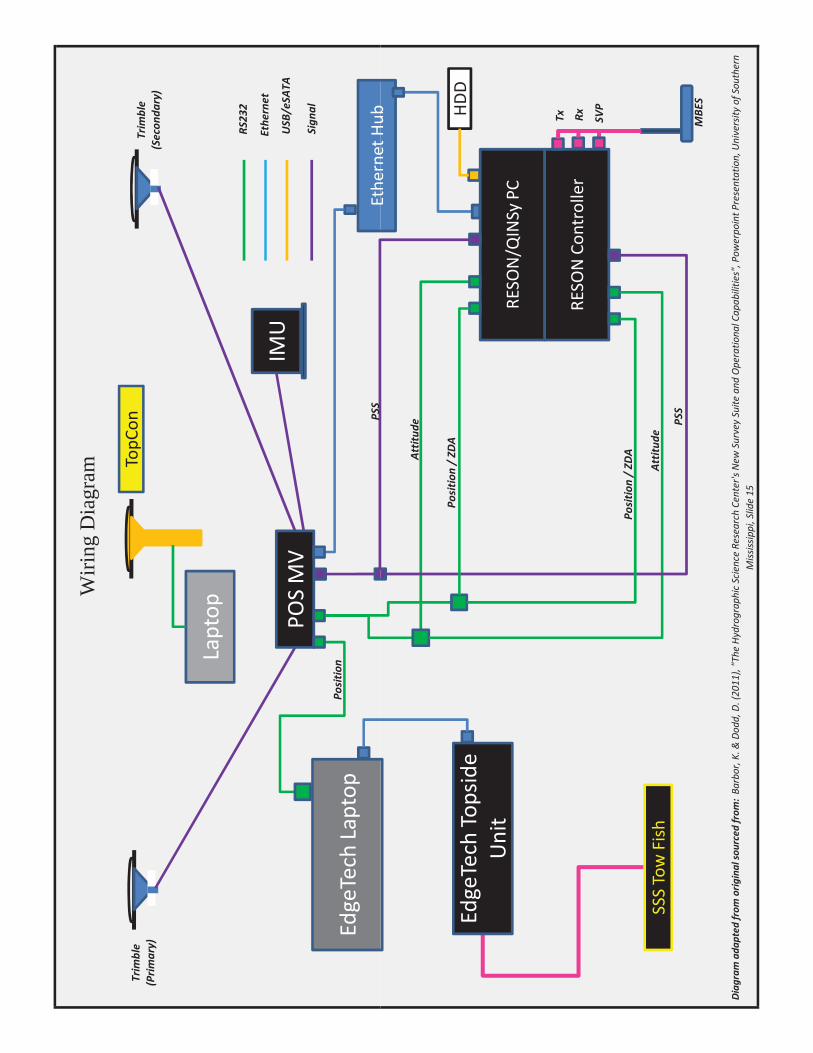
Wiri
ng D
iagr
am
Trim
ble
(Secon
dary)
Trim
ble
(Prim
ary)
RS232
Sign
al
TopC
on
Ethe
rnet
USB
/eSA
TAIM
U
Laptop
Ethe
rnet
Hub
POSMV
EdgeTech
Laptop
PSS
Positio
n
Diag
ram
adap
tedfrom
originalsourcedfrom
:Ba
rbor,K.&
Dodd
,D.(2011),"The
HydrographicScienceRe
search
Center'sNe
wSurvey
Suite
andOperatio
nalCap
abilitie
s",Pow
erpointP
resentation,Un
iversityof
Southern
Mississippi,Slide15
Ethe
rnet
Hub
RESO
NCo
ntroller
RESO
N/Q
INSy
PC
EdgeTech
Topside
Unit
HDD
MBE
S
SSSTowFish
PSS
Attitud
e
Attitud
e
Positio
n/ZD
A
Positio
n/ZD
A
Tx Rx SVP

University of Southern Mississippi 13USM01 Data Acquisition and Processing Appendices
III.2 MBES Coverage Calculation

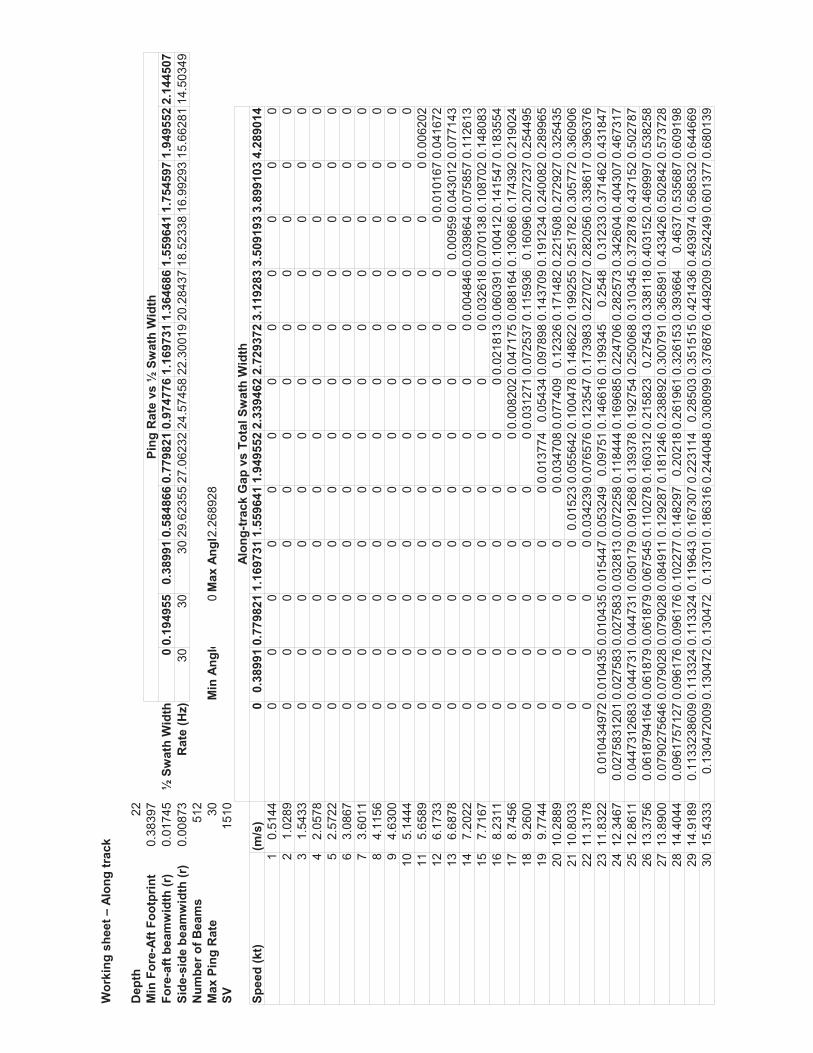
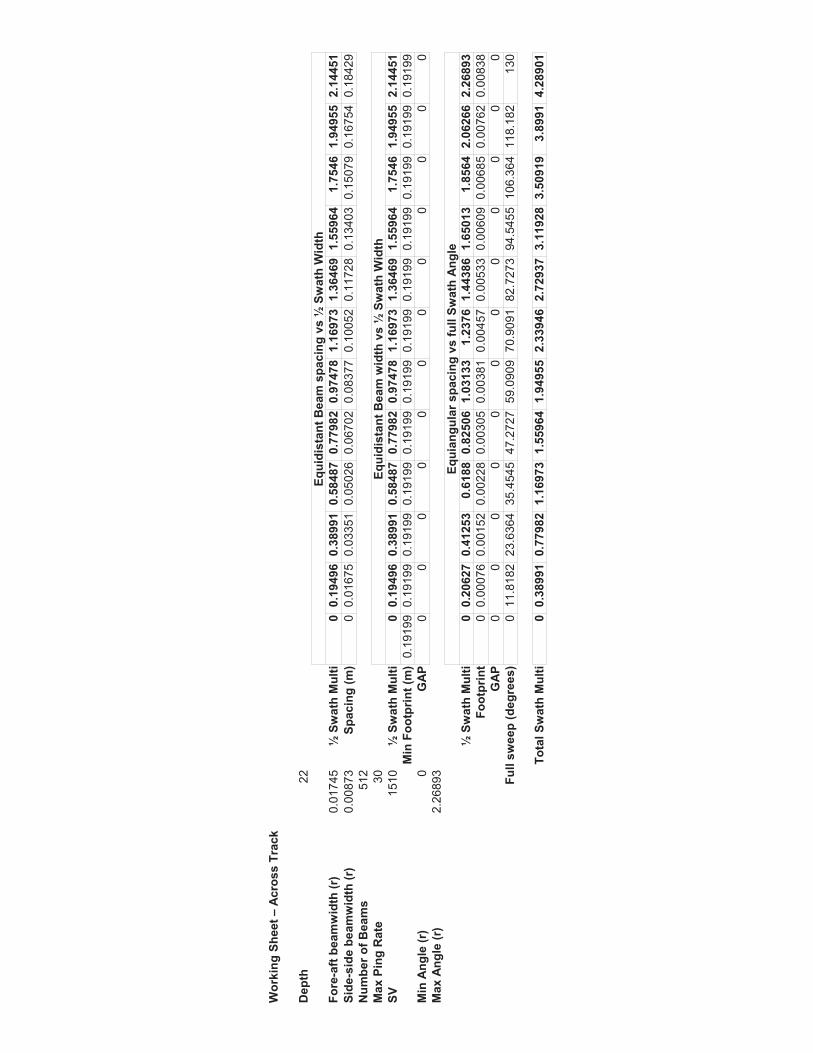

University of Southern Mississippi 13USM01 Data Acquisition and Processing Appendices
IV Sound Velocity Profiles

University of Southern Mississippi 13USM01 Data Acquisition and Processing Appendices
Figure IV.1: SVP Cast 2013-157 13:47:00 30◦21’09"N 089◦37’47"W
Figure IV.2: SVP Cast 2013-161 14:36:00 30◦22’03"N 088◦33’50"W
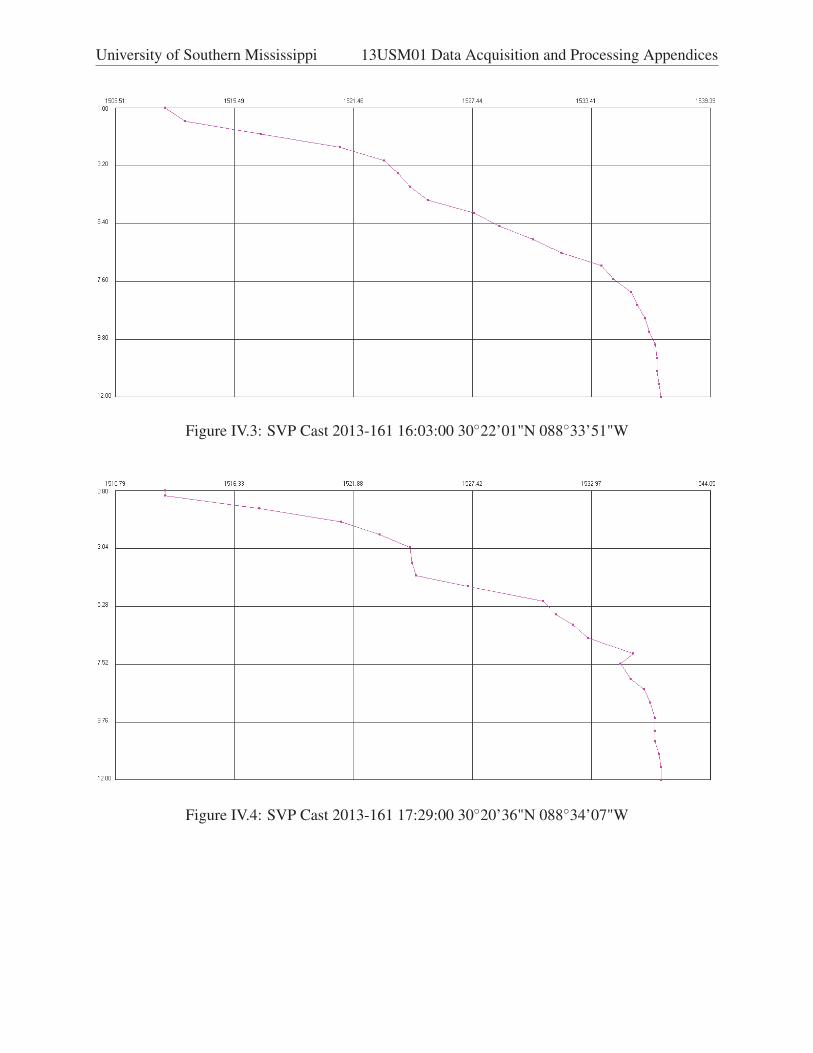
University of Southern Mississippi 13USM01 Data Acquisition and Processing Appendices
Figure IV.3: SVP Cast 2013-161 16:03:00 30◦22’01"N 088◦33’51"W
Figure IV.4: SVP Cast 2013-161 17:29:00 30◦20’36"N 088◦34’07"W
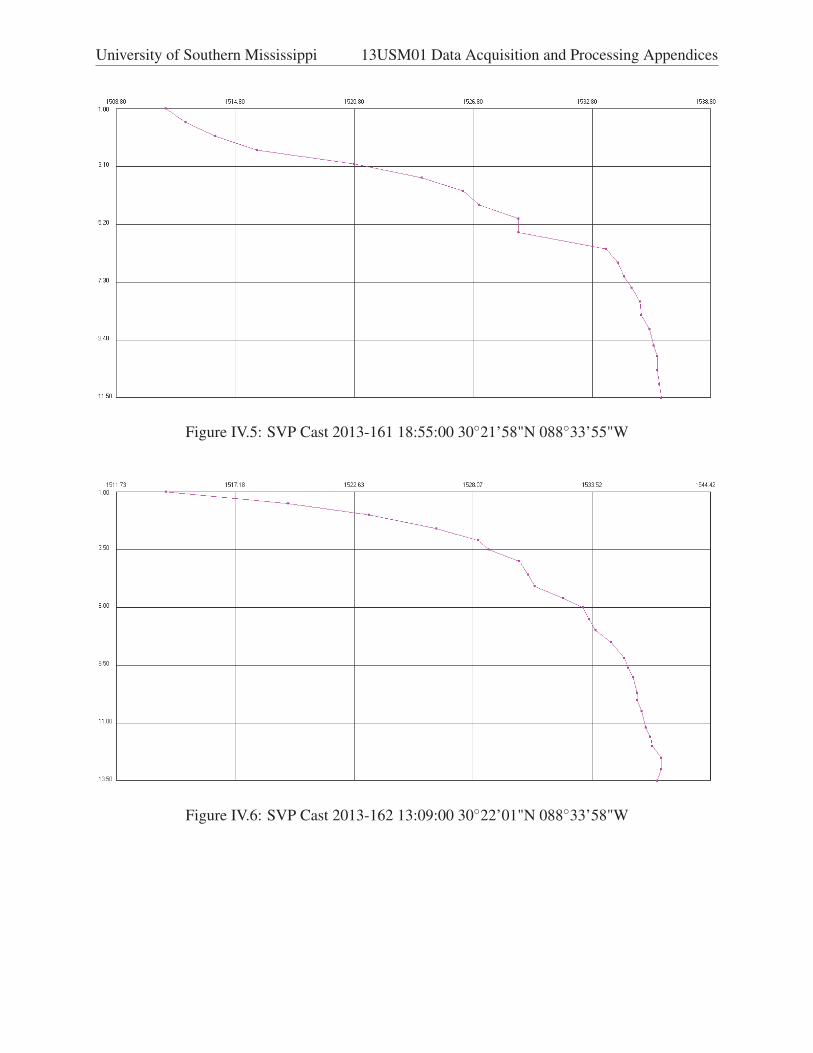
University of Southern Mississippi 13USM01 Data Acquisition and Processing Appendices
Figure IV.5: SVP Cast 2013-161 18:55:00 30◦21’58"N 088◦33’55"W
Figure IV.6: SVP Cast 2013-162 13:09:00 30◦22’01"N 088◦33’58"W
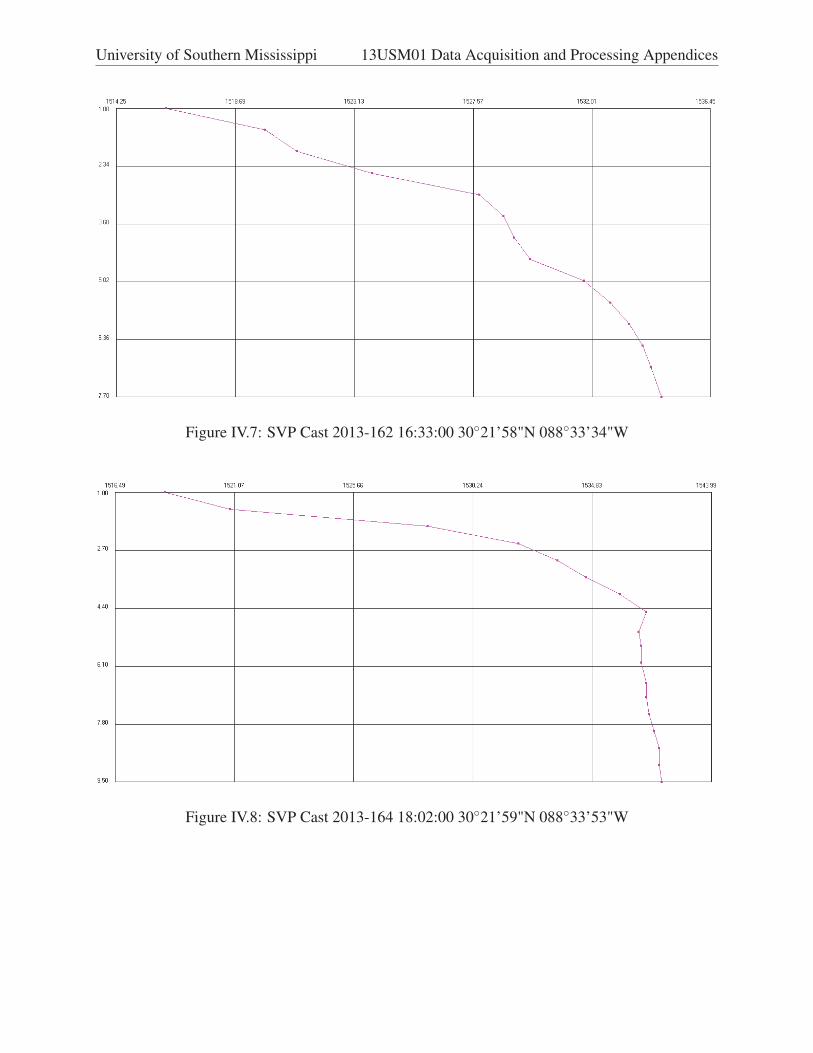
University of Southern Mississippi 13USM01 Data Acquisition and Processing Appendices
Figure IV.7: SVP Cast 2013-162 16:33:00 30◦21’58"N 088◦33’34"W
Figure IV.8: SVP Cast 2013-164 18:02:00 30◦21’59"N 088◦33’53"W
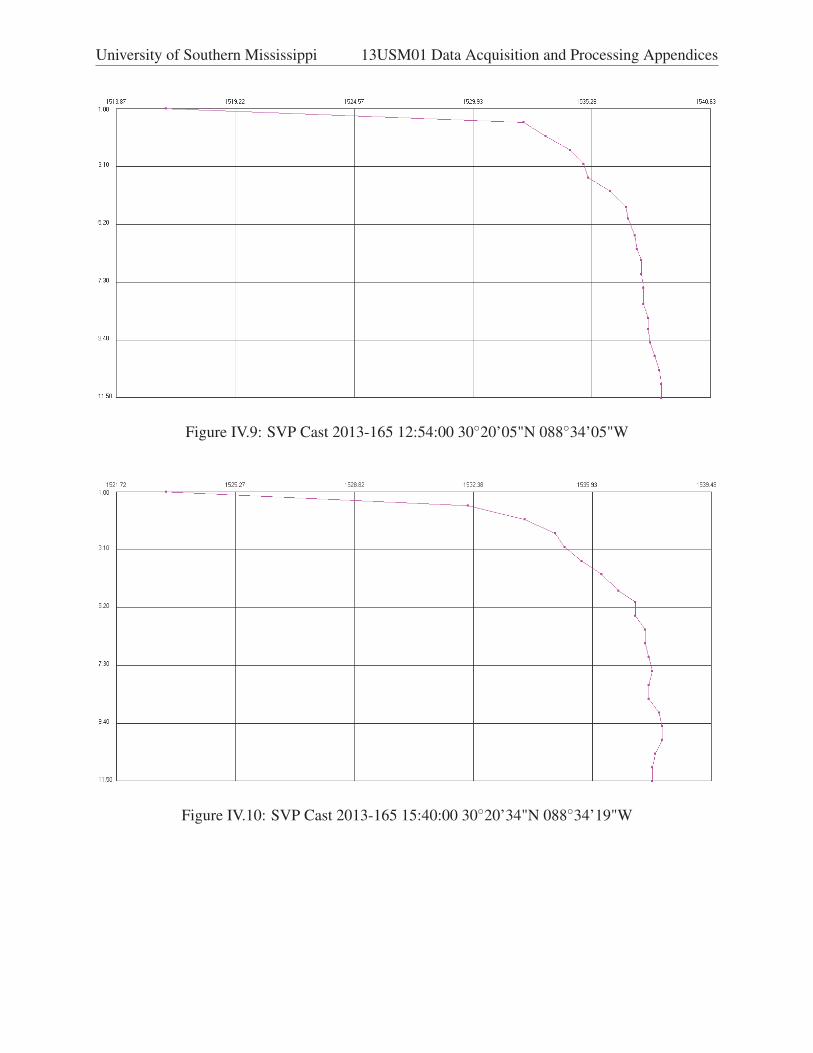
University of Southern Mississippi 13USM01 Data Acquisition and Processing Appendices
Figure IV.9: SVP Cast 2013-165 12:54:00 30◦20’05"N 088◦34’05"W
Figure IV.10: SVP Cast 2013-165 15:40:00 30◦20’34"N 088◦34’19"W
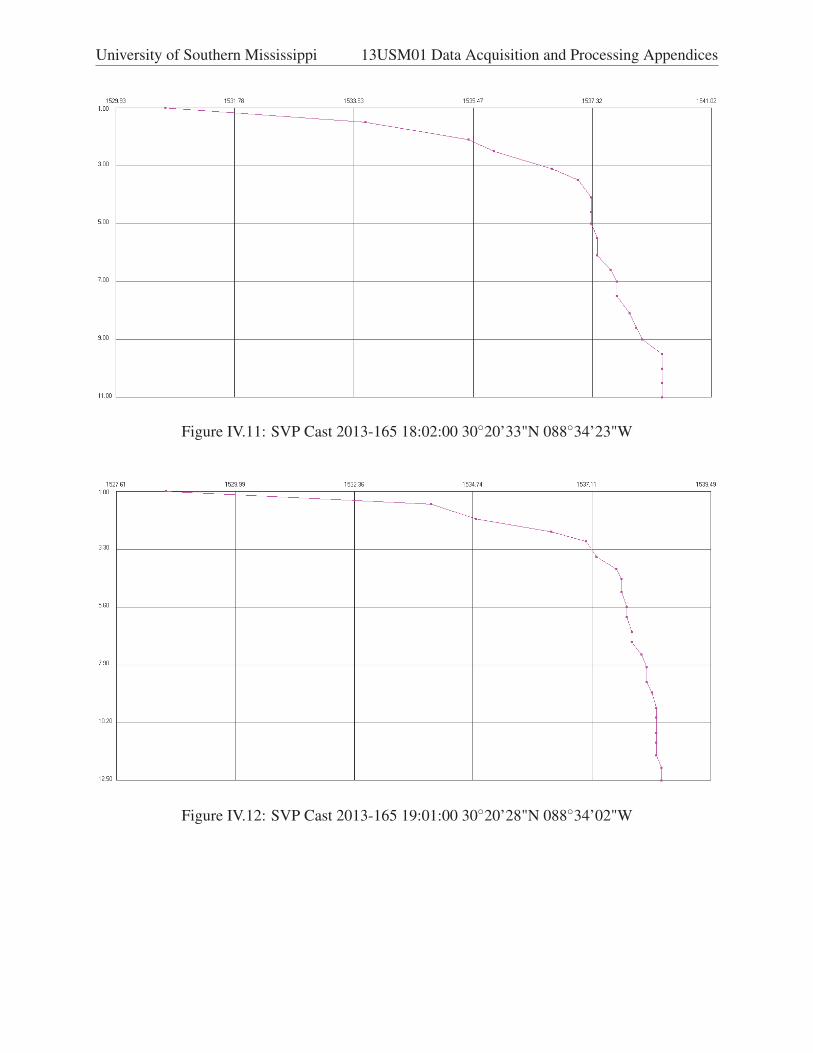
University of Southern Mississippi 13USM01 Data Acquisition and Processing Appendices
Figure IV.11: SVP Cast 2013-165 18:02:00 30◦20’33"N 088◦34’23"W
Figure IV.12: SVP Cast 2013-165 19:01:00 30◦20’28"N 088◦34’02"W
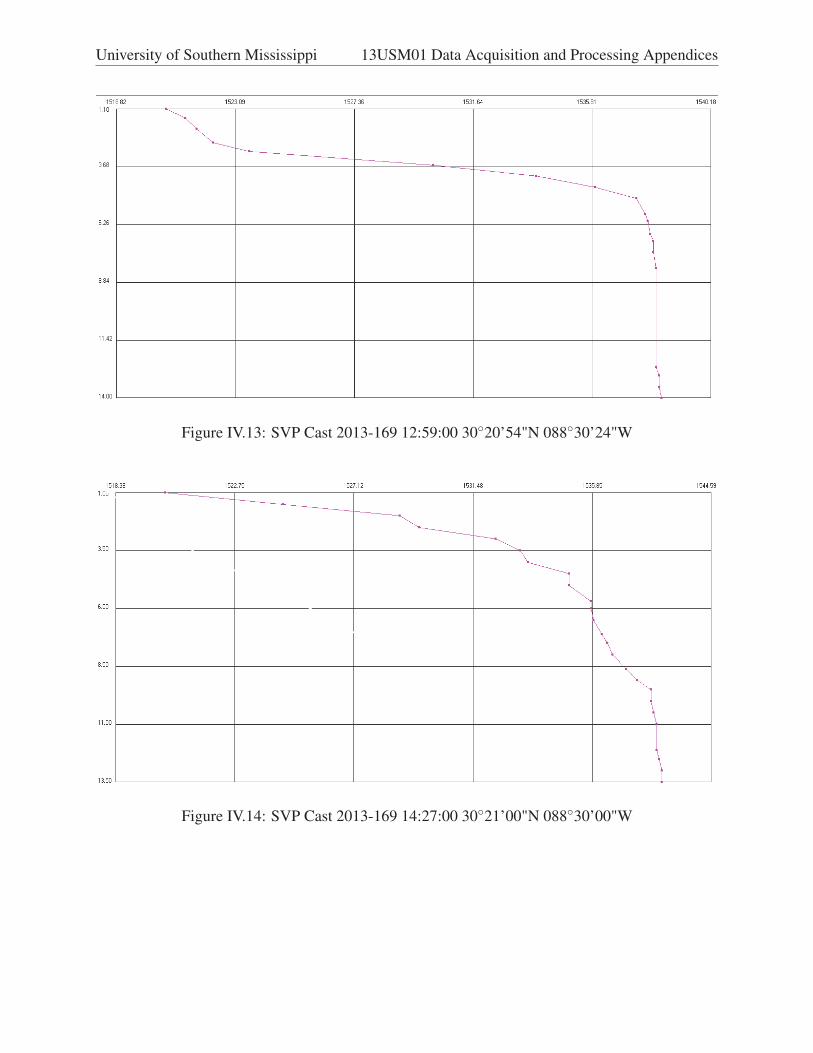
University of Southern Mississippi 13USM01 Data Acquisition and Processing Appendices
Figure IV.13: SVP Cast 2013-169 12:59:00 30◦20’54"N 088◦30’24"W
Figure IV.14: SVP Cast 2013-169 14:27:00 30◦21’00"N 088◦30’00"W
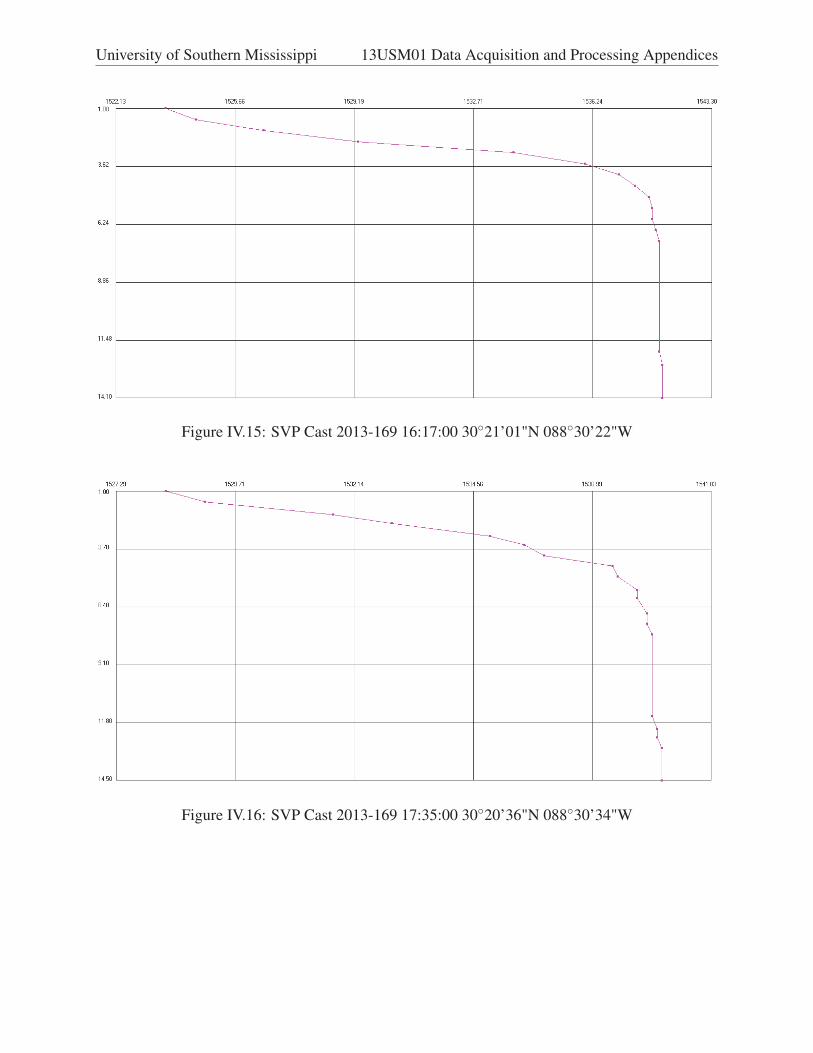
University of Southern Mississippi 13USM01 Data Acquisition and Processing Appendices
Figure IV.15: SVP Cast 2013-169 16:17:00 30◦21’01"N 088◦30’22"W
Figure IV.16: SVP Cast 2013-169 17:35:00 30◦20’36"N 088◦30’34"W

University of Southern Mississippi 13USM01 Data Acquisition and Processing Appendices
Figure IV.17: SVP Cast 2013-169 17:35:00 30◦20’36"N 088◦30’34"W

University of Southern Mississippi 13USM01 Data Acquisition and Processing Appendices
V SSS Contact Reports
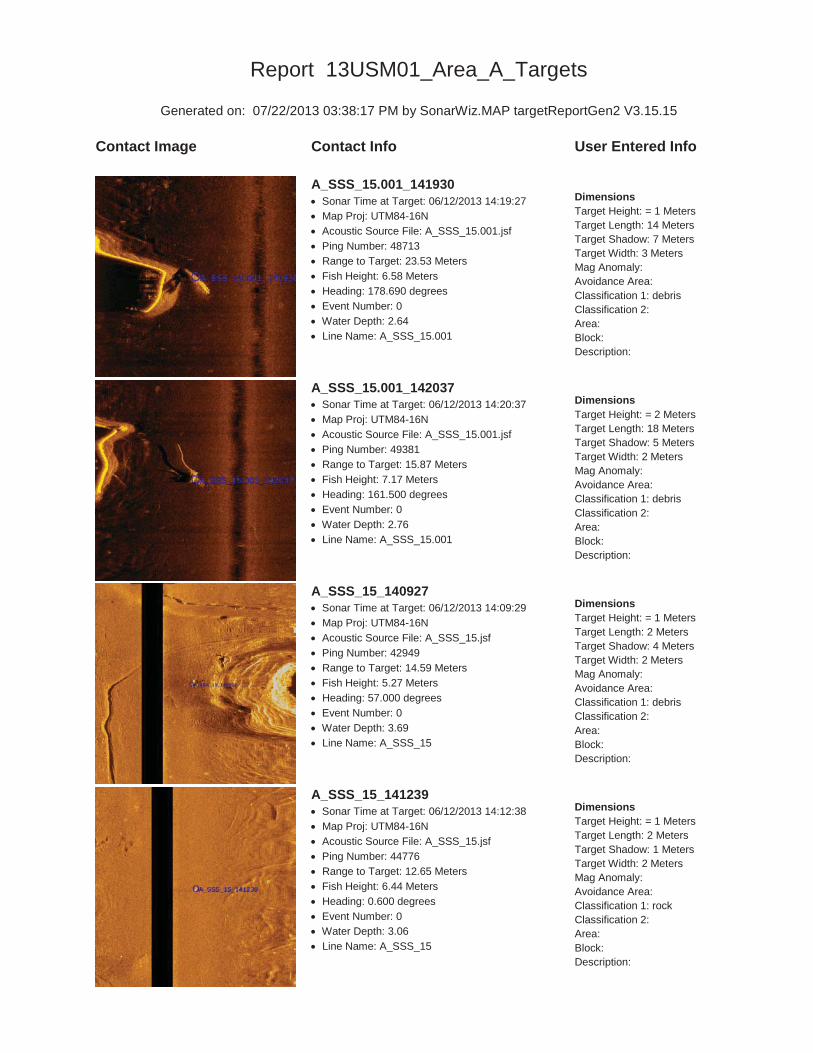
Report 13USM01_Area_A_Targets
Generated on: 07/22/2013 03:38:17 PM by SonarWiz.MAP targetReportGen2 V3.15.15
Contact Image Contact Info User Entered Info
A_SSS_15.001_141930Sonar Time at Target: 06/12/2013 14:19:27Map Proj: UTM84-16NAcoustic Source File: A_SSS_15.001.jsfPing Number: 48713Range to Target: 23.53 MetersFish Height: 6.58 MetersHeading: 178.690 degreesEvent Number: 0Water Depth: 2.64Line Name: A_SSS_15.001
DimensionsTarget Height: = 1 MetersTarget Length: 14 MetersTarget Shadow: 7 MetersTarget Width: 3 MetersMag Anomaly: Avoidance Area: Classification 1: debrisClassification 2: Area: Block: Description:
A_SSS_15.001_142037Sonar Time at Target: 06/12/2013 14:20:37Map Proj: UTM84-16NAcoustic Source File: A_SSS_15.001.jsfPing Number: 49381Range to Target: 15.87 MetersFish Height: 7.17 MetersHeading: 161.500 degreesEvent Number: 0Water Depth: 2.76Line Name: A_SSS_15.001
DimensionsTarget Height: = 2 MetersTarget Length: 18 MetersTarget Shadow: 5 MetersTarget Width: 2 MetersMag Anomaly: Avoidance Area: Classification 1: debrisClassification 2: Area: Block: Description:
A_SSS_15_140927Sonar Time at Target: 06/12/2013 14:09:29Map Proj: UTM84-16NAcoustic Source File: A_SSS_15.jsfPing Number: 42949Range to Target: 14.59 MetersFish Height: 5.27 MetersHeading: 57.000 degreesEvent Number: 0Water Depth: 3.69Line Name: A_SSS_15
DimensionsTarget Height: = 1 MetersTarget Length: 2 MetersTarget Shadow: 4 MetersTarget Width: 2 MetersMag Anomaly: Avoidance Area: Classification 1: debrisClassification 2: Area: Block: Description:
A_SSS_15_141239Sonar Time at Target: 06/12/2013 14:12:38Map Proj: UTM84-16NAcoustic Source File: A_SSS_15.jsfPing Number: 44776Range to Target: 12.65 MetersFish Height: 6.44 MetersHeading: 0.600 degreesEvent Number: 0Water Depth: 3.06Line Name: A_SSS_15
DimensionsTarget Height: = 1 MetersTarget Length: 2 MetersTarget Shadow: 1 MetersTarget Width: 2 MetersMag Anomaly: Avoidance Area: Classification 1: rockClassification 2: Area: Block: Description:
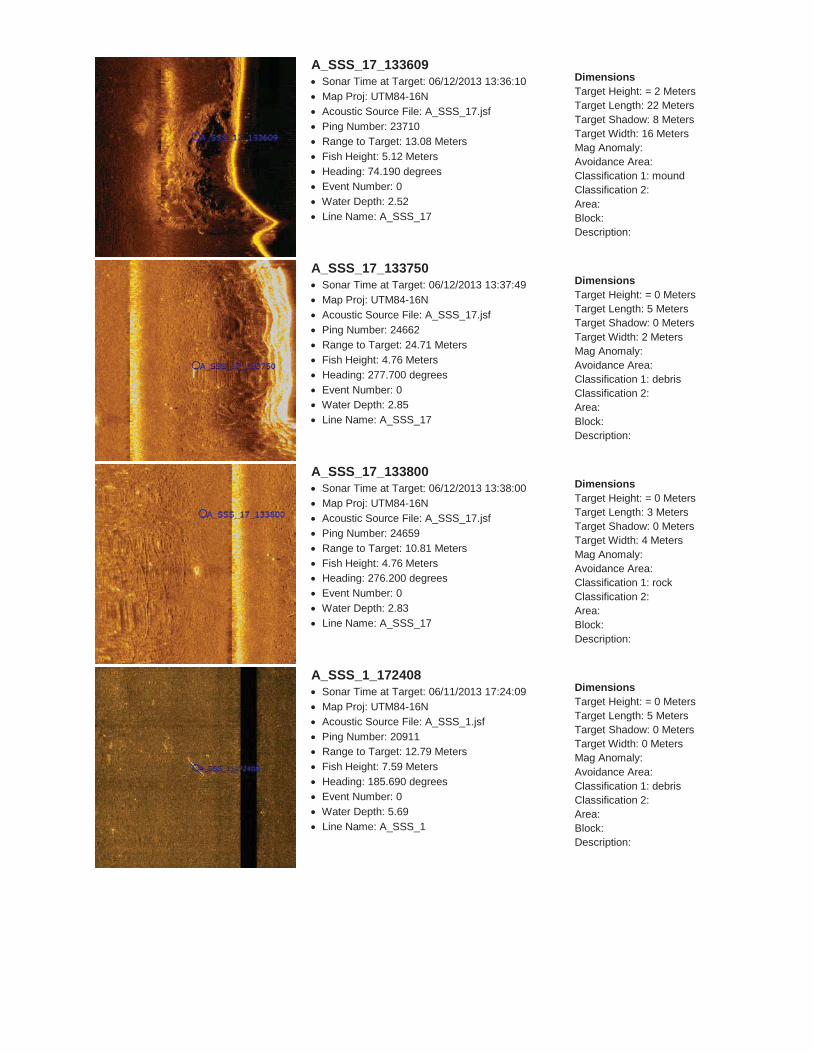
A_SSS_17_133609Sonar Time at Target: 06/12/2013 13:36:10Map Proj: UTM84-16NAcoustic Source File: A_SSS_17.jsfPing Number: 23710Range to Target: 13.08 MetersFish Height: 5.12 MetersHeading: 74.190 degreesEvent Number: 0Water Depth: 2.52Line Name: A_SSS_17
DimensionsTarget Height: = 2 MetersTarget Length: 22 MetersTarget Shadow: 8 MetersTarget Width: 16 MetersMag Anomaly: Avoidance Area: Classification 1: moundClassification 2: Area: Block: Description:
A_SSS_17_133750Sonar Time at Target: 06/12/2013 13:37:49Map Proj: UTM84-16NAcoustic Source File: A_SSS_17.jsfPing Number: 24662Range to Target: 24.71 MetersFish Height: 4.76 MetersHeading: 277.700 degreesEvent Number: 0Water Depth: 2.85Line Name: A_SSS_17
DimensionsTarget Height: = 0 MetersTarget Length: 5 MetersTarget Shadow: 0 MetersTarget Width: 2 MetersMag Anomaly: Avoidance Area: Classification 1: debrisClassification 2: Area: Block: Description:
A_SSS_17_133800Sonar Time at Target: 06/12/2013 13:38:00Map Proj: UTM84-16NAcoustic Source File: A_SSS_17.jsfPing Number: 24659Range to Target: 10.81 MetersFish Height: 4.76 MetersHeading: 276.200 degreesEvent Number: 0Water Depth: 2.83Line Name: A_SSS_17
DimensionsTarget Height: = 0 MetersTarget Length: 3 MetersTarget Shadow: 0 MetersTarget Width: 4 MetersMag Anomaly: Avoidance Area: Classification 1: rockClassification 2: Area: Block: Description:
A_SSS_1_172408Sonar Time at Target: 06/11/2013 17:24:09Map Proj: UTM84-16NAcoustic Source File: A_SSS_1.jsfPing Number: 20911Range to Target: 12.79 MetersFish Height: 7.59 MetersHeading: 185.690 degreesEvent Number: 0Water Depth: 5.69Line Name: A_SSS_1
DimensionsTarget Height: = 0 MetersTarget Length: 5 MetersTarget Shadow: 0 MetersTarget Width: 0 MetersMag Anomaly: Avoidance Area: Classification 1: debrisClassification 2: Area: Block: Description:
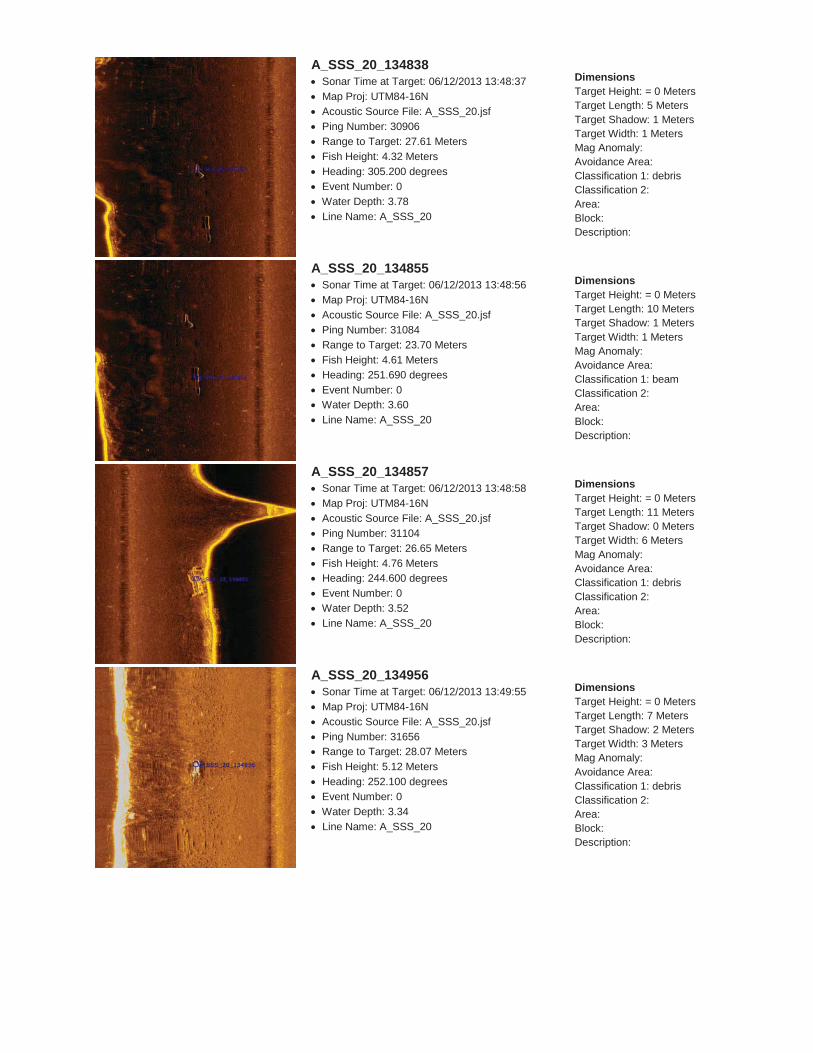
A_SSS_20_134838Sonar Time at Target: 06/12/2013 13:48:37Map Proj: UTM84-16NAcoustic Source File: A_SSS_20.jsfPing Number: 30906Range to Target: 27.61 MetersFish Height: 4.32 MetersHeading: 305.200 degreesEvent Number: 0Water Depth: 3.78Line Name: A_SSS_20
DimensionsTarget Height: = 0 MetersTarget Length: 5 MetersTarget Shadow: 1 MetersTarget Width: 1 MetersMag Anomaly: Avoidance Area: Classification 1: debrisClassification 2: Area: Block: Description:
A_SSS_20_134855Sonar Time at Target: 06/12/2013 13:48:56Map Proj: UTM84-16NAcoustic Source File: A_SSS_20.jsfPing Number: 31084Range to Target: 23.70 MetersFish Height: 4.61 MetersHeading: 251.690 degreesEvent Number: 0Water Depth: 3.60Line Name: A_SSS_20
DimensionsTarget Height: = 0 MetersTarget Length: 10 MetersTarget Shadow: 1 MetersTarget Width: 1 MetersMag Anomaly: Avoidance Area: Classification 1: beamClassification 2: Area: Block: Description:
A_SSS_20_134857Sonar Time at Target: 06/12/2013 13:48:58Map Proj: UTM84-16NAcoustic Source File: A_SSS_20.jsfPing Number: 31104Range to Target: 26.65 MetersFish Height: 4.76 MetersHeading: 244.600 degreesEvent Number: 0Water Depth: 3.52Line Name: A_SSS_20
DimensionsTarget Height: = 0 MetersTarget Length: 11 MetersTarget Shadow: 0 MetersTarget Width: 6 MetersMag Anomaly: Avoidance Area: Classification 1: debrisClassification 2: Area: Block: Description:
A_SSS_20_134956Sonar Time at Target: 06/12/2013 13:49:55Map Proj: UTM84-16NAcoustic Source File: A_SSS_20.jsfPing Number: 31656Range to Target: 28.07 MetersFish Height: 5.12 MetersHeading: 252.100 degreesEvent Number: 0Water Depth: 3.34Line Name: A_SSS_20
DimensionsTarget Height: = 0 MetersTarget Length: 7 MetersTarget Shadow: 2 MetersTarget Width: 3 MetersMag Anomaly: Avoidance Area: Classification 1: debrisClassification 2: Area: Block: Description:
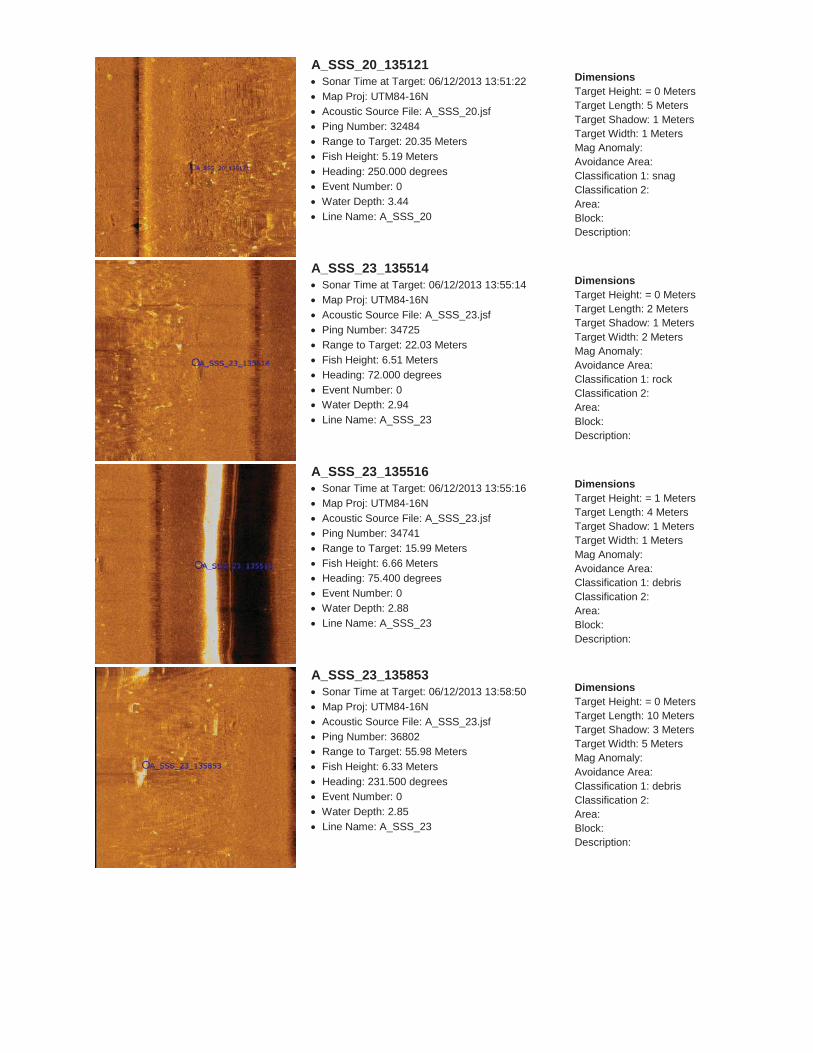
A_SSS_20_135121Sonar Time at Target: 06/12/2013 13:51:22Map Proj: UTM84-16NAcoustic Source File: A_SSS_20.jsfPing Number: 32484Range to Target: 20.35 MetersFish Height: 5.19 MetersHeading: 250.000 degreesEvent Number: 0Water Depth: 3.44Line Name: A_SSS_20
DimensionsTarget Height: = 0 MetersTarget Length: 5 MetersTarget Shadow: 1 MetersTarget Width: 1 MetersMag Anomaly: Avoidance Area: Classification 1: snagClassification 2: Area: Block: Description:
A_SSS_23_135514Sonar Time at Target: 06/12/2013 13:55:14Map Proj: UTM84-16NAcoustic Source File: A_SSS_23.jsfPing Number: 34725Range to Target: 22.03 MetersFish Height: 6.51 MetersHeading: 72.000 degreesEvent Number: 0Water Depth: 2.94Line Name: A_SSS_23
DimensionsTarget Height: = 0 MetersTarget Length: 2 MetersTarget Shadow: 1 MetersTarget Width: 2 MetersMag Anomaly: Avoidance Area: Classification 1: rockClassification 2: Area: Block: Description:
A_SSS_23_135516Sonar Time at Target: 06/12/2013 13:55:16Map Proj: UTM84-16NAcoustic Source File: A_SSS_23.jsfPing Number: 34741Range to Target: 15.99 MetersFish Height: 6.66 MetersHeading: 75.400 degreesEvent Number: 0Water Depth: 2.88Line Name: A_SSS_23
DimensionsTarget Height: = 1 MetersTarget Length: 4 MetersTarget Shadow: 1 MetersTarget Width: 1 MetersMag Anomaly: Avoidance Area: Classification 1: debrisClassification 2: Area: Block: Description:
A_SSS_23_135853Sonar Time at Target: 06/12/2013 13:58:50Map Proj: UTM84-16NAcoustic Source File: A_SSS_23.jsfPing Number: 36802Range to Target: 55.98 MetersFish Height: 6.33 MetersHeading: 231.500 degreesEvent Number: 0Water Depth: 2.85Line Name: A_SSS_23
DimensionsTarget Height: = 0 MetersTarget Length: 10 MetersTarget Shadow: 3 MetersTarget Width: 5 MetersMag Anomaly: Avoidance Area: Classification 1: debrisClassification 2: Area: Block: Description:
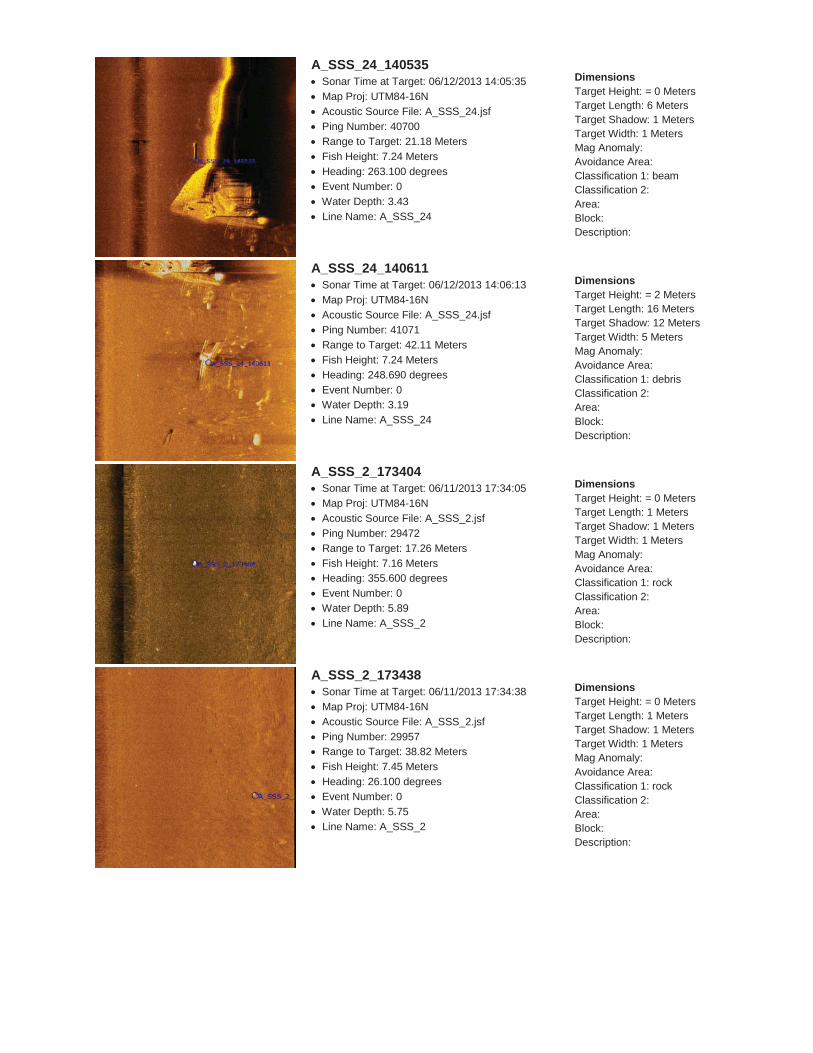
A_SSS_24_140535Sonar Time at Target: 06/12/2013 14:05:35Map Proj: UTM84-16NAcoustic Source File: A_SSS_24.jsfPing Number: 40700Range to Target: 21.18 MetersFish Height: 7.24 MetersHeading: 263.100 degreesEvent Number: 0Water Depth: 3.43Line Name: A_SSS_24
DimensionsTarget Height: = 0 MetersTarget Length: 6 MetersTarget Shadow: 1 MetersTarget Width: 1 MetersMag Anomaly: Avoidance Area: Classification 1: beamClassification 2: Area: Block: Description:
A_SSS_24_140611Sonar Time at Target: 06/12/2013 14:06:13Map Proj: UTM84-16NAcoustic Source File: A_SSS_24.jsfPing Number: 41071Range to Target: 42.11 MetersFish Height: 7.24 MetersHeading: 248.690 degreesEvent Number: 0Water Depth: 3.19Line Name: A_SSS_24
DimensionsTarget Height: = 2 MetersTarget Length: 16 MetersTarget Shadow: 12 MetersTarget Width: 5 MetersMag Anomaly: Avoidance Area: Classification 1: debrisClassification 2: Area: Block: Description:
A_SSS_2_173404Sonar Time at Target: 06/11/2013 17:34:05Map Proj: UTM84-16NAcoustic Source File: A_SSS_2.jsfPing Number: 29472Range to Target: 17.26 MetersFish Height: 7.16 MetersHeading: 355.600 degreesEvent Number: 0Water Depth: 5.89Line Name: A_SSS_2
DimensionsTarget Height: = 0 MetersTarget Length: 1 MetersTarget Shadow: 1 MetersTarget Width: 1 MetersMag Anomaly: Avoidance Area: Classification 1: rockClassification 2: Area: Block: Description:
A_SSS_2_173438Sonar Time at Target: 06/11/2013 17:34:38Map Proj: UTM84-16NAcoustic Source File: A_SSS_2.jsfPing Number: 29957Range to Target: 38.82 MetersFish Height: 7.45 MetersHeading: 26.100 degreesEvent Number: 0Water Depth: 5.75Line Name: A_SSS_2
DimensionsTarget Height: = 0 MetersTarget Length: 1 MetersTarget Shadow: 1 MetersTarget Width: 1 MetersMag Anomaly: Avoidance Area: Classification 1: rockClassification 2: Area: Block: Description:
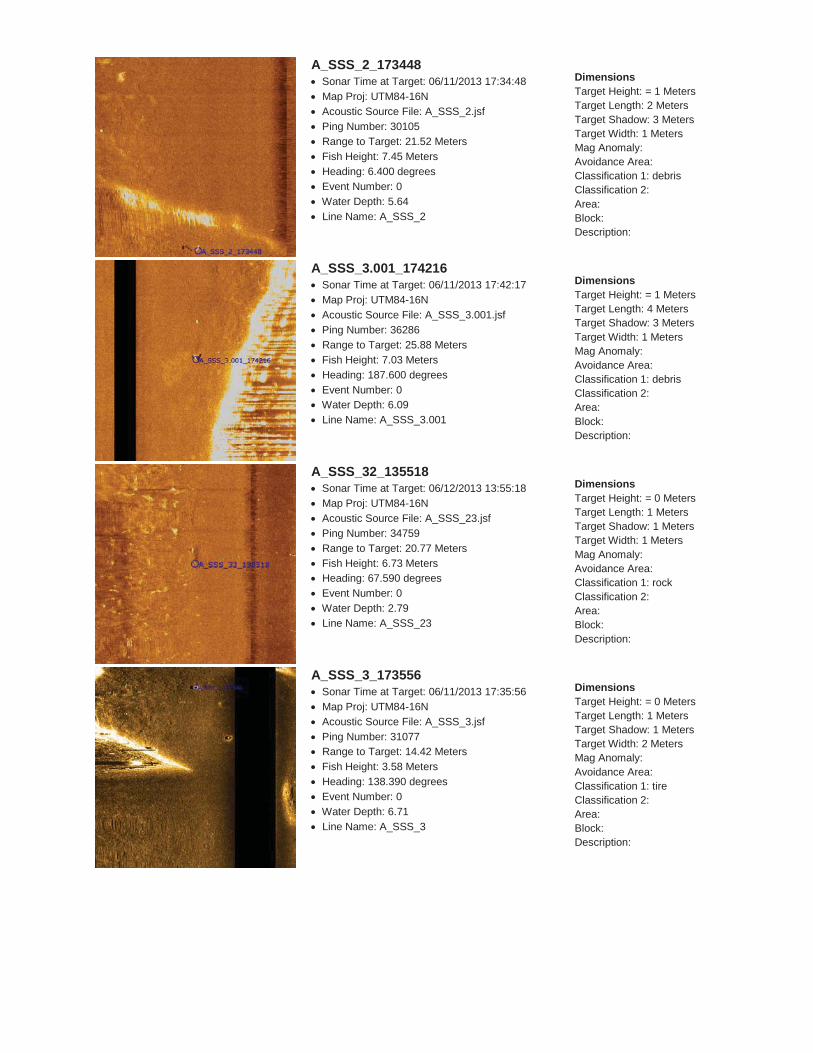
A_SSS_2_173448Sonar Time at Target: 06/11/2013 17:34:48Map Proj: UTM84-16NAcoustic Source File: A_SSS_2.jsfPing Number: 30105Range to Target: 21.52 MetersFish Height: 7.45 MetersHeading: 6.400 degreesEvent Number: 0Water Depth: 5.64Line Name: A_SSS_2
DimensionsTarget Height: = 1 MetersTarget Length: 2 MetersTarget Shadow: 3 MetersTarget Width: 1 MetersMag Anomaly: Avoidance Area: Classification 1: debrisClassification 2: Area: Block: Description:
A_SSS_3.001_174216Sonar Time at Target: 06/11/2013 17:42:17Map Proj: UTM84-16NAcoustic Source File: A_SSS_3.001.jsfPing Number: 36286Range to Target: 25.88 MetersFish Height: 7.03 MetersHeading: 187.600 degreesEvent Number: 0Water Depth: 6.09Line Name: A_SSS_3.001
DimensionsTarget Height: = 1 MetersTarget Length: 4 MetersTarget Shadow: 3 MetersTarget Width: 1 MetersMag Anomaly: Avoidance Area: Classification 1: debrisClassification 2: Area: Block: Description:
A_SSS_32_135518Sonar Time at Target: 06/12/2013 13:55:18Map Proj: UTM84-16NAcoustic Source File: A_SSS_23.jsfPing Number: 34759Range to Target: 20.77 MetersFish Height: 6.73 MetersHeading: 67.590 degreesEvent Number: 0Water Depth: 2.79Line Name: A_SSS_23
DimensionsTarget Height: = 0 MetersTarget Length: 1 MetersTarget Shadow: 1 MetersTarget Width: 1 MetersMag Anomaly: Avoidance Area: Classification 1: rockClassification 2: Area: Block: Description:
A_SSS_3_173556Sonar Time at Target: 06/11/2013 17:35:56Map Proj: UTM84-16NAcoustic Source File: A_SSS_3.jsfPing Number: 31077Range to Target: 14.42 MetersFish Height: 3.58 MetersHeading: 138.390 degreesEvent Number: 0Water Depth: 6.71Line Name: A_SSS_3
DimensionsTarget Height: = 0 MetersTarget Length: 1 MetersTarget Shadow: 1 MetersTarget Width: 2 MetersMag Anomaly: Avoidance Area: Classification 1: tireClassification 2: Area: Block: Description:
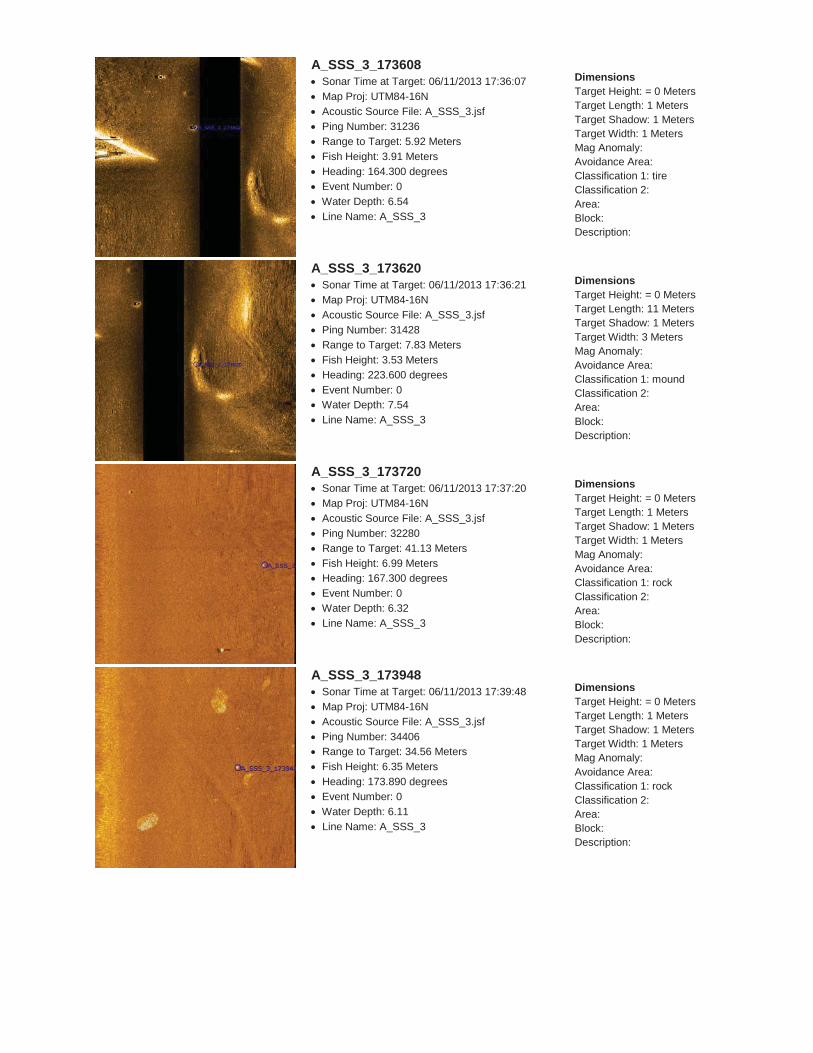
A_SSS_3_173608Sonar Time at Target: 06/11/2013 17:36:07Map Proj: UTM84-16NAcoustic Source File: A_SSS_3.jsfPing Number: 31236Range to Target: 5.92 MetersFish Height: 3.91 MetersHeading: 164.300 degreesEvent Number: 0Water Depth: 6.54Line Name: A_SSS_3
DimensionsTarget Height: = 0 MetersTarget Length: 1 MetersTarget Shadow: 1 MetersTarget Width: 1 MetersMag Anomaly: Avoidance Area: Classification 1: tireClassification 2: Area: Block: Description:
A_SSS_3_173620Sonar Time at Target: 06/11/2013 17:36:21Map Proj: UTM84-16NAcoustic Source File: A_SSS_3.jsfPing Number: 31428Range to Target: 7.83 MetersFish Height: 3.53 MetersHeading: 223.600 degreesEvent Number: 0Water Depth: 7.54Line Name: A_SSS_3
DimensionsTarget Height: = 0 MetersTarget Length: 11 MetersTarget Shadow: 1 MetersTarget Width: 3 MetersMag Anomaly: Avoidance Area: Classification 1: moundClassification 2: Area: Block: Description:
A_SSS_3_173720Sonar Time at Target: 06/11/2013 17:37:20Map Proj: UTM84-16NAcoustic Source File: A_SSS_3.jsfPing Number: 32280Range to Target: 41.13 MetersFish Height: 6.99 MetersHeading: 167.300 degreesEvent Number: 0Water Depth: 6.32Line Name: A_SSS_3
DimensionsTarget Height: = 0 MetersTarget Length: 1 MetersTarget Shadow: 1 MetersTarget Width: 1 MetersMag Anomaly: Avoidance Area: Classification 1: rockClassification 2: Area: Block: Description:
A_SSS_3_173948Sonar Time at Target: 06/11/2013 17:39:48Map Proj: UTM84-16NAcoustic Source File: A_SSS_3.jsfPing Number: 34406Range to Target: 34.56 MetersFish Height: 6.35 MetersHeading: 173.890 degreesEvent Number: 0Water Depth: 6.11Line Name: A_SSS_3
DimensionsTarget Height: = 0 MetersTarget Length: 1 MetersTarget Shadow: 1 MetersTarget Width: 1 MetersMag Anomaly: Avoidance Area: Classification 1: rockClassification 2: Area: Block: Description:
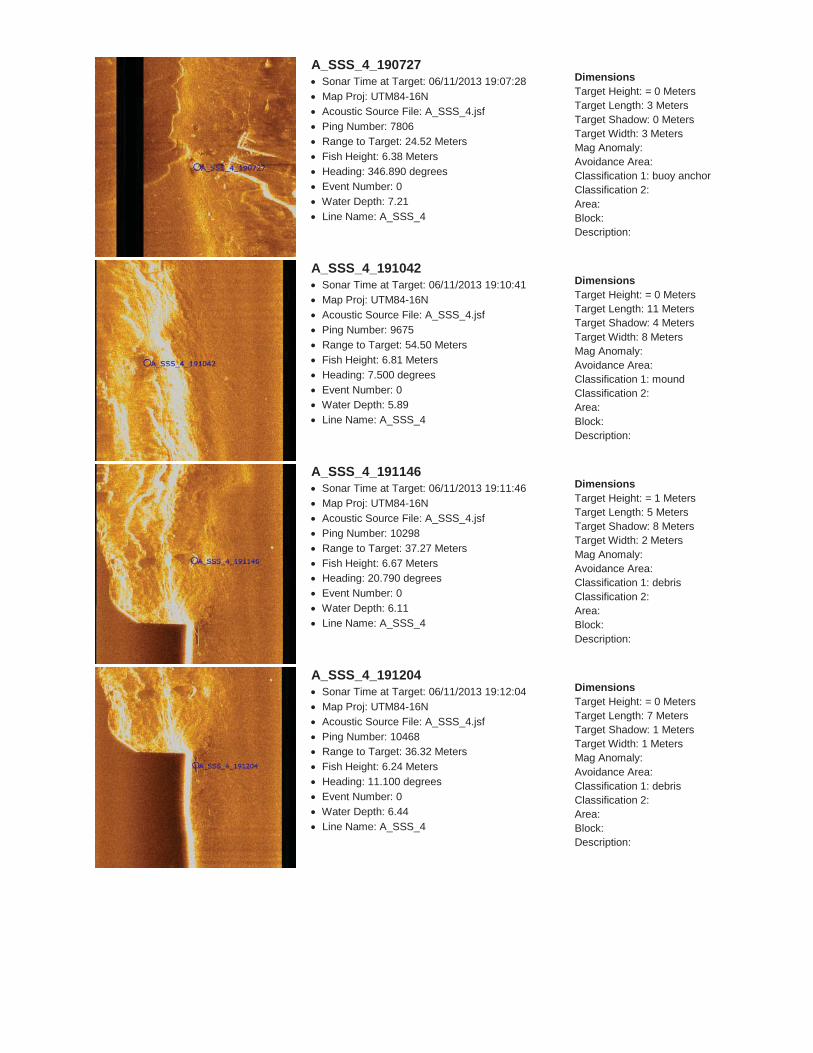
A_SSS_4_190727Sonar Time at Target: 06/11/2013 19:07:28Map Proj: UTM84-16NAcoustic Source File: A_SSS_4.jsfPing Number: 7806Range to Target: 24.52 MetersFish Height: 6.38 MetersHeading: 346.890 degreesEvent Number: 0Water Depth: 7.21Line Name: A_SSS_4
DimensionsTarget Height: = 0 MetersTarget Length: 3 MetersTarget Shadow: 0 MetersTarget Width: 3 MetersMag Anomaly: Avoidance Area: Classification 1: buoy anchorClassification 2: Area: Block: Description:
A_SSS_4_191042Sonar Time at Target: 06/11/2013 19:10:41Map Proj: UTM84-16NAcoustic Source File: A_SSS_4.jsfPing Number: 9675Range to Target: 54.50 MetersFish Height: 6.81 MetersHeading: 7.500 degreesEvent Number: 0Water Depth: 5.89Line Name: A_SSS_4
DimensionsTarget Height: = 0 MetersTarget Length: 11 MetersTarget Shadow: 4 MetersTarget Width: 8 MetersMag Anomaly: Avoidance Area: Classification 1: moundClassification 2: Area: Block: Description:
A_SSS_4_191146Sonar Time at Target: 06/11/2013 19:11:46Map Proj: UTM84-16NAcoustic Source File: A_SSS_4.jsfPing Number: 10298Range to Target: 37.27 MetersFish Height: 6.67 MetersHeading: 20.790 degreesEvent Number: 0Water Depth: 6.11Line Name: A_SSS_4
DimensionsTarget Height: = 1 MetersTarget Length: 5 MetersTarget Shadow: 8 MetersTarget Width: 2 MetersMag Anomaly: Avoidance Area: Classification 1: debrisClassification 2: Area: Block: Description:
A_SSS_4_191204Sonar Time at Target: 06/11/2013 19:12:04Map Proj: UTM84-16NAcoustic Source File: A_SSS_4.jsfPing Number: 10468Range to Target: 36.32 MetersFish Height: 6.24 MetersHeading: 11.100 degreesEvent Number: 0Water Depth: 6.44Line Name: A_SSS_4
DimensionsTarget Height: = 0 MetersTarget Length: 7 MetersTarget Shadow: 1 MetersTarget Width: 1 MetersMag Anomaly: Avoidance Area: Classification 1: debrisClassification 2: Area: Block: Description:
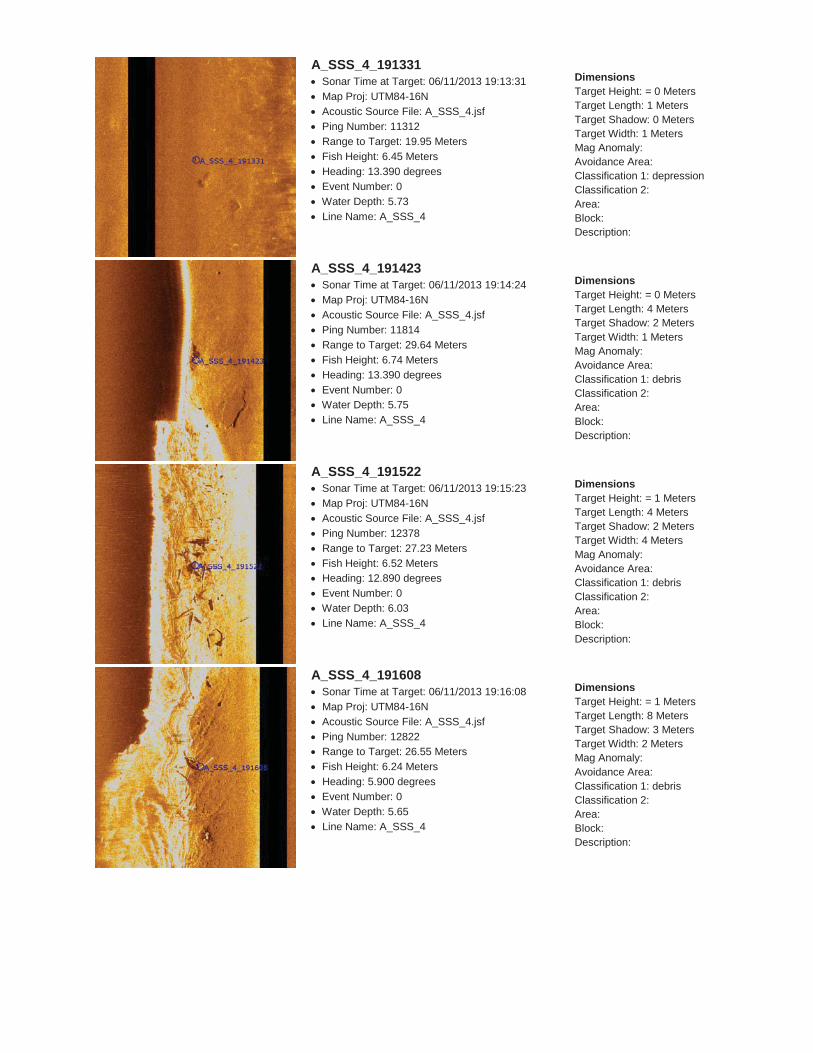
A_SSS_4_191331Sonar Time at Target: 06/11/2013 19:13:31Map Proj: UTM84-16NAcoustic Source File: A_SSS_4.jsfPing Number: 11312Range to Target: 19.95 MetersFish Height: 6.45 MetersHeading: 13.390 degreesEvent Number: 0Water Depth: 5.73Line Name: A_SSS_4
DimensionsTarget Height: = 0 MetersTarget Length: 1 MetersTarget Shadow: 0 MetersTarget Width: 1 MetersMag Anomaly: Avoidance Area: Classification 1: depressionClassification 2: Area: Block: Description:
A_SSS_4_191423Sonar Time at Target: 06/11/2013 19:14:24Map Proj: UTM84-16NAcoustic Source File: A_SSS_4.jsfPing Number: 11814Range to Target: 29.64 MetersFish Height: 6.74 MetersHeading: 13.390 degreesEvent Number: 0Water Depth: 5.75Line Name: A_SSS_4
DimensionsTarget Height: = 0 MetersTarget Length: 4 MetersTarget Shadow: 2 MetersTarget Width: 1 MetersMag Anomaly: Avoidance Area: Classification 1: debrisClassification 2: Area: Block: Description:
A_SSS_4_191522Sonar Time at Target: 06/11/2013 19:15:23Map Proj: UTM84-16NAcoustic Source File: A_SSS_4.jsfPing Number: 12378Range to Target: 27.23 MetersFish Height: 6.52 MetersHeading: 12.890 degreesEvent Number: 0Water Depth: 6.03Line Name: A_SSS_4
DimensionsTarget Height: = 1 MetersTarget Length: 4 MetersTarget Shadow: 2 MetersTarget Width: 4 MetersMag Anomaly: Avoidance Area: Classification 1: debrisClassification 2: Area: Block: Description:
A_SSS_4_191608Sonar Time at Target: 06/11/2013 19:16:08Map Proj: UTM84-16NAcoustic Source File: A_SSS_4.jsfPing Number: 12822Range to Target: 26.55 MetersFish Height: 6.24 MetersHeading: 5.900 degreesEvent Number: 0Water Depth: 5.65Line Name: A_SSS_4
DimensionsTarget Height: = 1 MetersTarget Length: 8 MetersTarget Shadow: 3 MetersTarget Width: 2 MetersMag Anomaly: Avoidance Area: Classification 1: debrisClassification 2: Area: Block: Description:
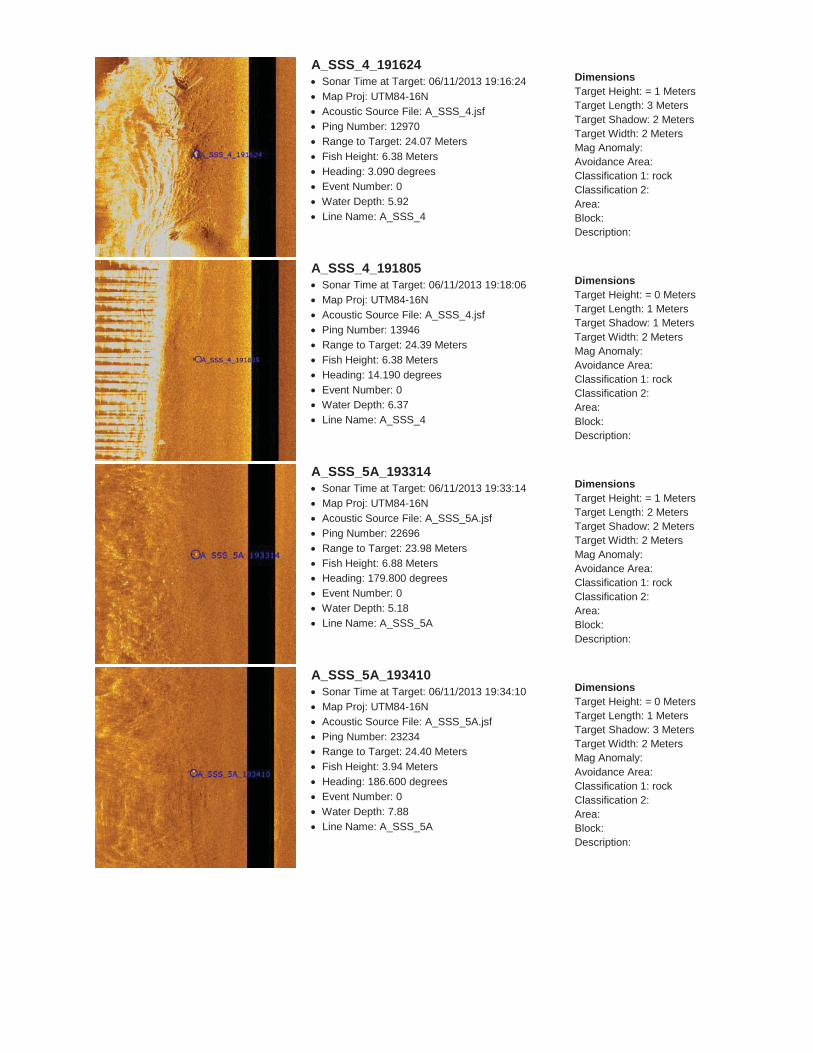
A_SSS_4_191624Sonar Time at Target: 06/11/2013 19:16:24Map Proj: UTM84-16NAcoustic Source File: A_SSS_4.jsfPing Number: 12970Range to Target: 24.07 MetersFish Height: 6.38 MetersHeading: 3.090 degreesEvent Number: 0Water Depth: 5.92Line Name: A_SSS_4
DimensionsTarget Height: = 1 MetersTarget Length: 3 MetersTarget Shadow: 2 MetersTarget Width: 2 MetersMag Anomaly: Avoidance Area: Classification 1: rockClassification 2: Area: Block: Description:
A_SSS_4_191805Sonar Time at Target: 06/11/2013 19:18:06Map Proj: UTM84-16NAcoustic Source File: A_SSS_4.jsfPing Number: 13946Range to Target: 24.39 MetersFish Height: 6.38 MetersHeading: 14.190 degreesEvent Number: 0Water Depth: 6.37Line Name: A_SSS_4
DimensionsTarget Height: = 0 MetersTarget Length: 1 MetersTarget Shadow: 1 MetersTarget Width: 2 MetersMag Anomaly: Avoidance Area: Classification 1: rockClassification 2: Area: Block: Description:
A_SSS_5A_193314Sonar Time at Target: 06/11/2013 19:33:14Map Proj: UTM84-16NAcoustic Source File: A_SSS_5A.jsfPing Number: 22696Range to Target: 23.98 MetersFish Height: 6.88 MetersHeading: 179.800 degreesEvent Number: 0Water Depth: 5.18Line Name: A_SSS_5A
DimensionsTarget Height: = 1 MetersTarget Length: 2 MetersTarget Shadow: 2 MetersTarget Width: 2 MetersMag Anomaly: Avoidance Area: Classification 1: rockClassification 2: Area: Block: Description:
A_SSS_5A_193410Sonar Time at Target: 06/11/2013 19:34:10Map Proj: UTM84-16NAcoustic Source File: A_SSS_5A.jsfPing Number: 23234Range to Target: 24.40 MetersFish Height: 3.94 MetersHeading: 186.600 degreesEvent Number: 0Water Depth: 7.88Line Name: A_SSS_5A
DimensionsTarget Height: = 0 MetersTarget Length: 1 MetersTarget Shadow: 3 MetersTarget Width: 2 MetersMag Anomaly: Avoidance Area: Classification 1: rockClassification 2: Area: Block: Description:
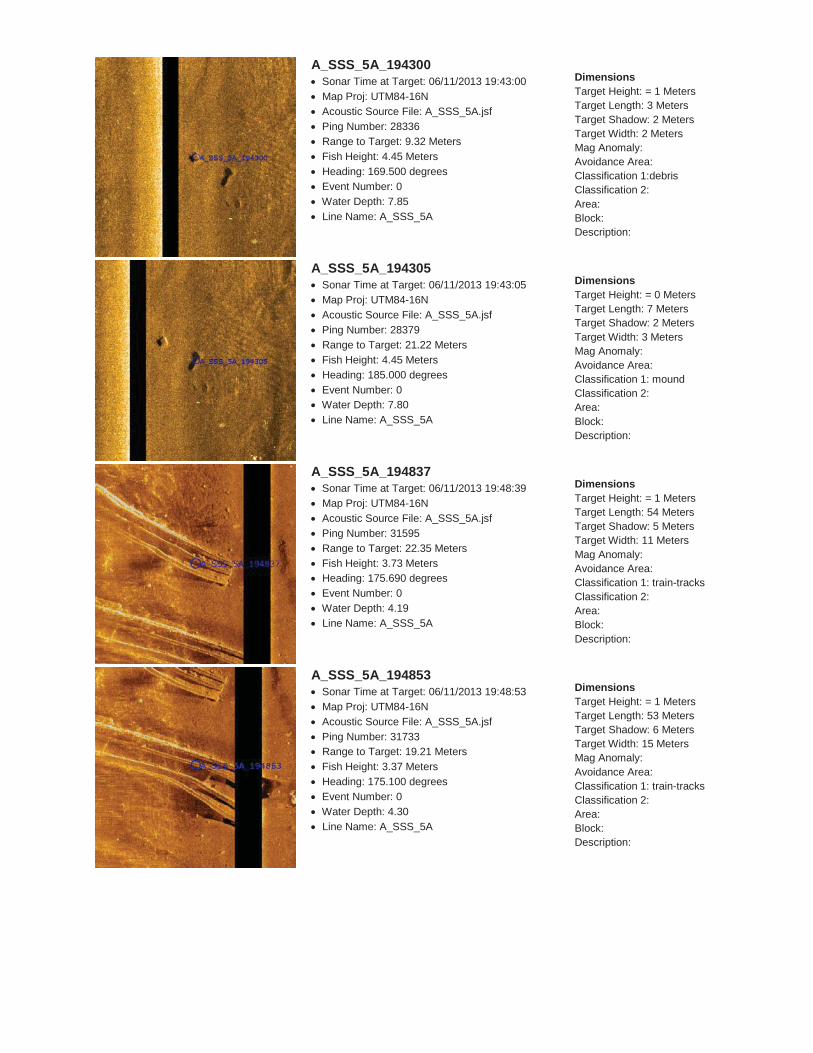
A_SSS_5A_194300Sonar Time at Target: 06/11/2013 19:43:00Map Proj: UTM84-16NAcoustic Source File: A_SSS_5A.jsfPing Number: 28336Range to Target: 9.32 MetersFish Height: 4.45 MetersHeading: 169.500 degreesEvent Number: 0Water Depth: 7.85Line Name: A_SSS_5A
DimensionsTarget Height: = 1 MetersTarget Length: 3 MetersTarget Shadow: 2 MetersTarget Width: 2 MetersMag Anomaly: Avoidance Area: Classification 1:debrisClassification 2: Area: Block: Description:
A_SSS_5A_194305Sonar Time at Target: 06/11/2013 19:43:05Map Proj: UTM84-16NAcoustic Source File: A_SSS_5A.jsfPing Number: 28379Range to Target: 21.22 MetersFish Height: 4.45 MetersHeading: 185.000 degreesEvent Number: 0Water Depth: 7.80Line Name: A_SSS_5A
DimensionsTarget Height: = 0 MetersTarget Length: 7 MetersTarget Shadow: 2 MetersTarget Width: 3 MetersMag Anomaly: Avoidance Area: Classification 1: moundClassification 2: Area: Block: Description:
A_SSS_5A_194837Sonar Time at Target: 06/11/2013 19:48:39Map Proj: UTM84-16NAcoustic Source File: A_SSS_5A.jsfPing Number: 31595Range to Target: 22.35 MetersFish Height: 3.73 MetersHeading: 175.690 degreesEvent Number: 0Water Depth: 4.19Line Name: A_SSS_5A
DimensionsTarget Height: = 1 MetersTarget Length: 54 MetersTarget Shadow: 5 MetersTarget Width: 11 MetersMag Anomaly: Avoidance Area: Classification 1: train-tracksClassification 2: Area: Block: Description:
A_SSS_5A_194853Sonar Time at Target: 06/11/2013 19:48:53Map Proj: UTM84-16NAcoustic Source File: A_SSS_5A.jsfPing Number: 31733Range to Target: 19.21 MetersFish Height: 3.37 MetersHeading: 175.100 degreesEvent Number: 0Water Depth: 4.30Line Name: A_SSS_5A
DimensionsTarget Height: = 1 MetersTarget Length: 53 MetersTarget Shadow: 6 MetersTarget Width: 15 MetersMag Anomaly: Avoidance Area: Classification 1: train-tracksClassification 2: Area: Block: Description:
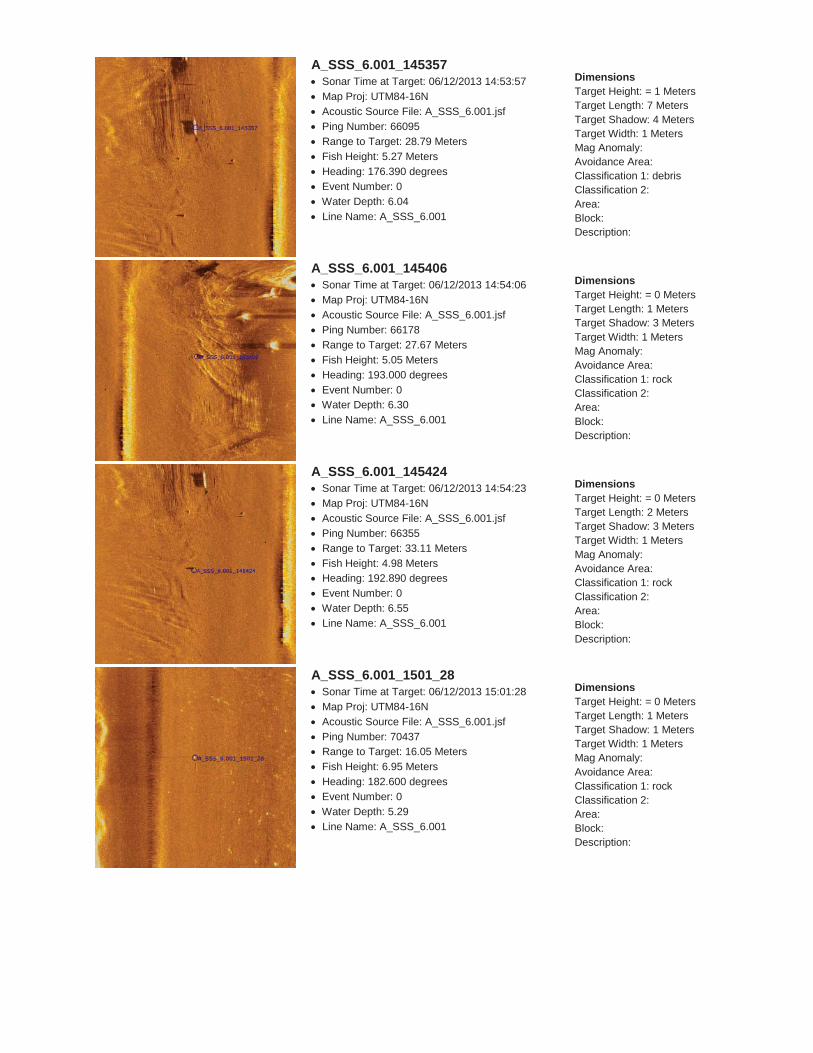
A_SSS_6.001_145357Sonar Time at Target: 06/12/2013 14:53:57Map Proj: UTM84-16NAcoustic Source File: A_SSS_6.001.jsfPing Number: 66095Range to Target: 28.79 MetersFish Height: 5.27 MetersHeading: 176.390 degreesEvent Number: 0Water Depth: 6.04Line Name: A_SSS_6.001
DimensionsTarget Height: = 1 MetersTarget Length: 7 MetersTarget Shadow: 4 MetersTarget Width: 1 MetersMag Anomaly: Avoidance Area: Classification 1: debrisClassification 2: Area: Block: Description:
A_SSS_6.001_145406Sonar Time at Target: 06/12/2013 14:54:06Map Proj: UTM84-16NAcoustic Source File: A_SSS_6.001.jsfPing Number: 66178Range to Target: 27.67 MetersFish Height: 5.05 MetersHeading: 193.000 degreesEvent Number: 0Water Depth: 6.30Line Name: A_SSS_6.001
DimensionsTarget Height: = 0 MetersTarget Length: 1 MetersTarget Shadow: 3 MetersTarget Width: 1 MetersMag Anomaly: Avoidance Area: Classification 1: rockClassification 2: Area: Block: Description:
A_SSS_6.001_145424Sonar Time at Target: 06/12/2013 14:54:23Map Proj: UTM84-16NAcoustic Source File: A_SSS_6.001.jsfPing Number: 66355Range to Target: 33.11 MetersFish Height: 4.98 MetersHeading: 192.890 degreesEvent Number: 0Water Depth: 6.55Line Name: A_SSS_6.001
DimensionsTarget Height: = 0 MetersTarget Length: 2 MetersTarget Shadow: 3 MetersTarget Width: 1 MetersMag Anomaly: Avoidance Area: Classification 1: rockClassification 2: Area: Block: Description:
A_SSS_6.001_1501_28Sonar Time at Target: 06/12/2013 15:01:28Map Proj: UTM84-16NAcoustic Source File: A_SSS_6.001.jsfPing Number: 70437Range to Target: 16.05 MetersFish Height: 6.95 MetersHeading: 182.600 degreesEvent Number: 0Water Depth: 5.29Line Name: A_SSS_6.001
DimensionsTarget Height: = 0 MetersTarget Length: 1 MetersTarget Shadow: 1 MetersTarget Width: 1 MetersMag Anomaly: Avoidance Area: Classification 1: rockClassification 2: Area:Block: Description:
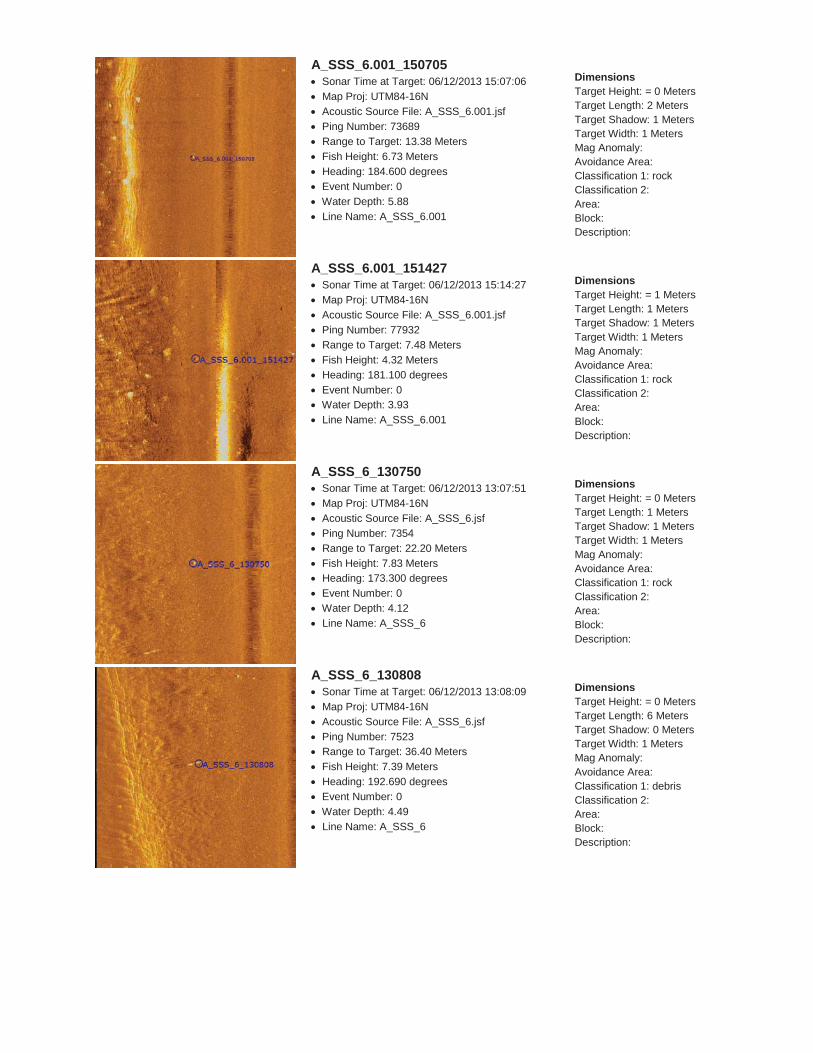
A_SSS_6.001_150705Sonar Time at Target: 06/12/2013 15:07:06Map Proj: UTM84-16NAcoustic Source File: A_SSS_6.001.jsfPing Number: 73689Range to Target: 13.38 MetersFish Height: 6.73 MetersHeading: 184.600 degreesEvent Number: 0Water Depth: 5.88Line Name: A_SSS_6.001
DimensionsTarget Height: = 0 MetersTarget Length: 2 MetersTarget Shadow: 1 MetersTarget Width: 1 MetersMag Anomaly: Avoidance Area: Classification 1: rockClassification 2: Area: Block: Description:
A_SSS_6.001_151427Sonar Time at Target: 06/12/2013 15:14:27Map Proj: UTM84-16NAcoustic Source File: A_SSS_6.001.jsfPing Number: 77932Range to Target: 7.48 MetersFish Height: 4.32 MetersHeading: 181.100 degreesEvent Number: 0Water Depth: 3.93Line Name: A_SSS_6.001
DimensionsTarget Height: = 1 MetersTarget Length: 1 MetersTarget Shadow: 1 MetersTarget Width: 1 MetersMag Anomaly: Avoidance Area: Classification 1: rockClassification 2: Area: Block: Description:
A_SSS_6_130750Sonar Time at Target: 06/12/2013 13:07:51Map Proj: UTM84-16NAcoustic Source File: A_SSS_6.jsfPing Number: 7354Range to Target: 22.20 MetersFish Height: 7.83 MetersHeading: 173.300 degreesEvent Number: 0Water Depth: 4.12Line Name: A_SSS_6
DimensionsTarget Height: = 0 MetersTarget Length: 1 MetersTarget Shadow: 1 MetersTarget Width: 1 MetersMag Anomaly: Avoidance Area: Classification 1: rockClassification 2: Area: Block: Description:
A_SSS_6_130808Sonar Time at Target: 06/12/2013 13:08:09Map Proj: UTM84-16NAcoustic Source File: A_SSS_6.jsfPing Number: 7523Range to Target: 36.40 MetersFish Height: 7.39 MetersHeading: 192.690 degreesEvent Number: 0Water Depth: 4.49Line Name: A_SSS_6
DimensionsTarget Height: = 0 MetersTarget Length: 6 MetersTarget Shadow: 0 MetersTarget Width: 1 MetersMag Anomaly: Avoidance Area: Classification 1: debrisClassification 2: Area: Block: Description:
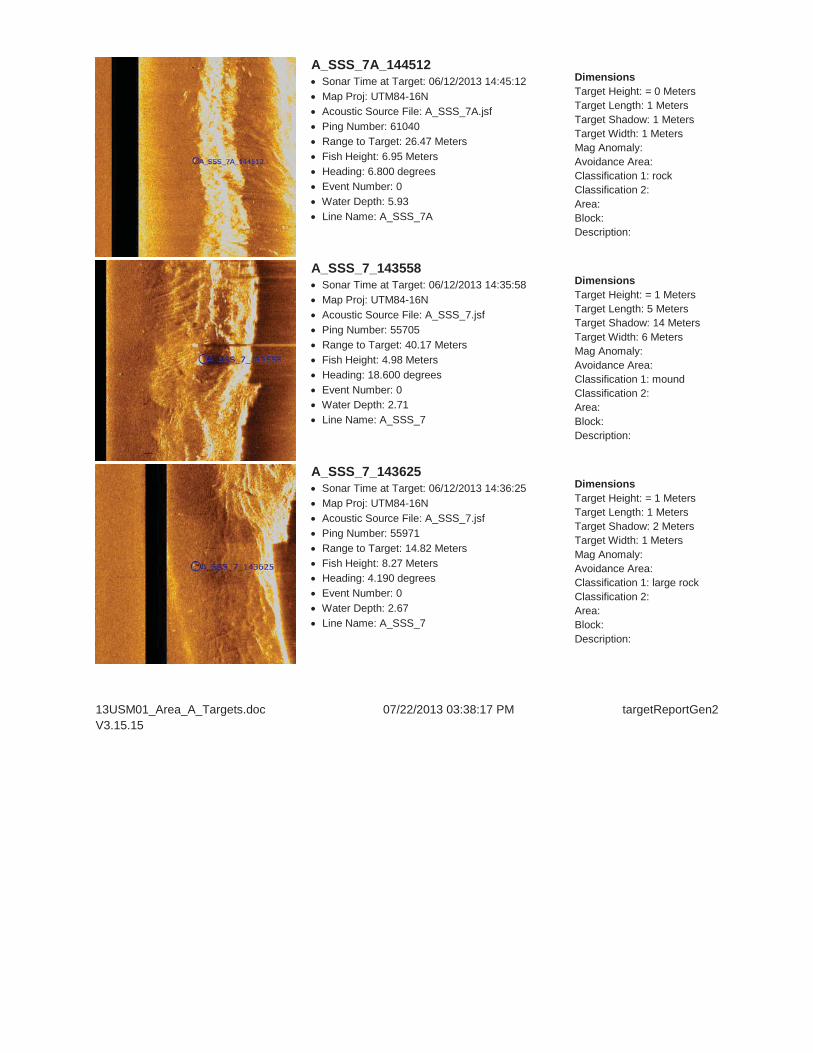
A_SSS_7A_144512Sonar Time at Target: 06/12/2013 14:45:12Map Proj: UTM84-16NAcoustic Source File: A_SSS_7A.jsfPing Number: 61040Range to Target: 26.47 MetersFish Height: 6.95 MetersHeading: 6.800 degreesEvent Number: 0Water Depth: 5.93Line Name: A_SSS_7A
DimensionsTarget Height: = 0 MetersTarget Length: 1 MetersTarget Shadow: 1 MetersTarget Width: 1 MetersMag Anomaly: Avoidance Area: Classification 1: rockClassification 2: Area: Block: Description:
A_SSS_7_143558Sonar Time at Target: 06/12/2013 14:35:58Map Proj: UTM84-16NAcoustic Source File: A_SSS_7.jsfPing Number: 55705Range to Target: 40.17 MetersFish Height: 4.98 MetersHeading: 18.600 degreesEvent Number: 0Water Depth: 2.71Line Name: A_SSS_7
DimensionsTarget Height: = 1 MetersTarget Length: 5 MetersTarget Shadow: 14 MetersTarget Width: 6 MetersMag Anomaly: Avoidance Area: Classification 1: moundClassification 2: Area: Block: Description:
A_SSS_7_143625Sonar Time at Target: 06/12/2013 14:36:25Map Proj: UTM84-16NAcoustic Source File: A_SSS_7.jsfPing Number: 55971Range to Target: 14.82 MetersFish Height: 8.27 MetersHeading: 4.190 degreesEvent Number: 0Water Depth: 2.67Line Name: A_SSS_7
DimensionsTarget Height: = 1 MetersTarget Length: 1 MetersTarget Shadow: 2 MetersTarget Width: 1 MetersMag Anomaly: Avoidance Area: Classification 1: large rockClassification 2: Area: Block: Description:
13USM01_Area_A_Targets.doc 07/22/2013 03:38:17 PM targetReportGen2 V3.15.15

Report 13USM01_Area_B_Targets
Generated on: 07/22/2013 01:18:40 PM by SonarWiz.MAP targetReportGen2 V3.15.15
Contact Image Contact Info User Entered Info
B_SSS_11_151239Sonar Time at Target: 06/17/2013 15:12:26Map Proj: UTM84-16NAcoustic Source File: B_SSS_11.jsfPing Number: 62803Range to Target: 20.92 MetersFish Height: 5.93 MetersHeading: 269.390 degreesEvent Number: 0Water Depth: 6.01Line Name: B_SSS_11
DimensionsTarget Height: = 0 MetersTarget Length: 2 MetersTarget Shadow: 1 MetersTarget Width: 1 MetersMag Anomaly: Avoidance Area: Classification 1: rockClassification 2: Area: Block: Description:
B_SSS_14_154506Sonar Time at Target: 06/17/2013 15:45:06Map Proj: UTM84-16NAcoustic Source File: B_SSS_14.jsfPing Number: 81677Range to Target: 4.83 MetersFish Height: 6.80 MetersHeading: 127.400 degreesEvent Number: 0Water Depth: 2.90Line Name: B_SSS_14
DimensionsTarget Height: = 1 MetersTarget Length: 5 MetersTarget Shadow: 2 MetersTarget Width: 4 MetersMag Anomaly: Avoidance Area: Classification 1: rockClassification 2: Area: Block: Description:
13USM01_Area_B_Targets.doc 07/22/2013 01:18:40 PM targetReportGen2 V3.15.15

Report 13USM01_Area_C_Targets
Generated on: 07/22/2013 01:15:17 PM by SonarWiz.MAP targetReportGen2 V3.15.15
Contact Image Contact Info User Entered Info
C_SSS_3_B_143703Sonar Time at Target: 06/19/2013 14:37:04Map Proj: UTM84-16NAcoustic Source File: C_SSS_3_B.jsfPing Number: 45617Range to Target: 32.73 MetersFish Height: 5.63 MetersHeading: 182.100 degreesEvent Number: 0Water Depth: 7.67Line Name: C_SSS_3_B
DimensionsTarget Height: = 2 MetersTarget Length: 55 MetersTarget Shadow: 14 MetersTarget Width: 48 MetersMag Anomaly: Avoidance Area: Classification 1: moundClassification 2: Area: Block: Description:
C_SSS_3_B_143533Sonar Time at Target: 06/19/2013 14:35:34Map Proj: UTM84-16NAcoustic Source File: C_SSS_3_B.jsfPing Number: 44749Range to Target: 35.37 MetersFish Height: 5.85 MetersHeading: 192.890 degreesEvent Number: 0Water Depth: 7.40Line Name: C_SSS_3_B
DimensionsTarget Height: = 0 MetersTarget Length: 5 MetersTarget Shadow: 2 MetersTarget Width: 1 MetersMag Anomaly: Avoidance Area: Classification 1: debrisClassification 2: Area: Block: Description:
C_SSS_3_B_143540Sonar Time at Target: 06/19/2013 14:35:40Map Proj: UTM84-16NAcoustic Source File: C_SSS_3_B.jsfPing Number: 44806Range to Target: 18.00 MetersFish Height: 6.15 MetersHeading: 194.500 degreesEvent Number: 0Water Depth: 7.02Line Name: C_SSS_3_B
DimensionsTarget Height: = 0 MetersTarget Length: 6 MetersTarget Shadow: 0 MetersTarget Width: 0 MetersMag Anomaly: Avoidance Area: Classification 1: debrisClassification 2: Area: Block: Description:
C_SSS_3_B_143407Sonar Time at Target: 06/19/2013 14:34:08Map Proj: UTM84-16NAcoustic Source File: C_SSS_3_B.jsfPing Number: 43920Range to Target: 38.20 MetersFish Height: 7.46 MetersHeading: 184.390 degreesEvent Number: 0Water Depth: 5.39Line Name: C_SSS_3_B
DimensionsTarget Height: = 1 MetersTarget Length: 20 MetersTarget Shadow: 9 MetersTarget Width: 11 MetersMag Anomaly: Avoidance Area: Classification 1: moundClassification 2: Area: Block: Description:
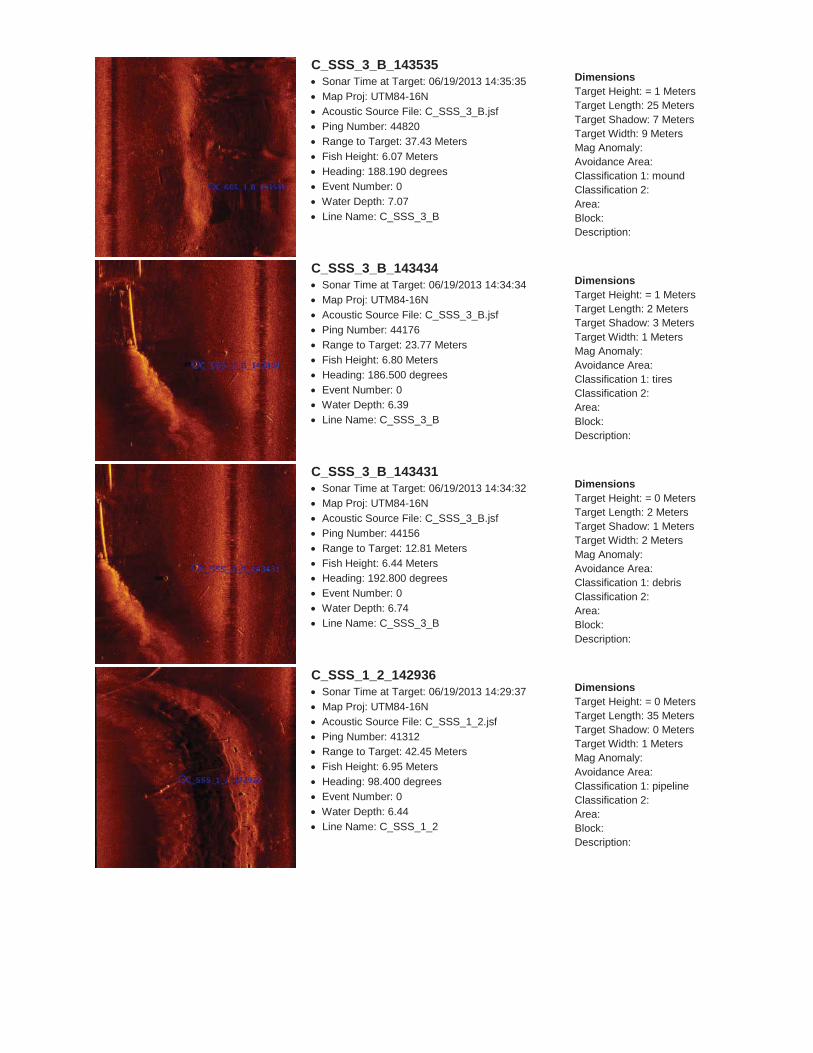
C_SSS_3_B_143535Sonar Time at Target: 06/19/2013 14:35:35Map Proj: UTM84-16NAcoustic Source File: C_SSS_3_B.jsfPing Number: 44820Range to Target: 37.43 MetersFish Height: 6.07 MetersHeading: 188.190 degreesEvent Number: 0Water Depth: 7.07Line Name: C_SSS_3_B
DimensionsTarget Height: = 1 MetersTarget Length: 25 MetersTarget Shadow: 7 MetersTarget Width: 9 MetersMag Anomaly: Avoidance Area: Classification 1: moundClassification 2: Area: Block: Description:
C_SSS_3_B_143434Sonar Time at Target: 06/19/2013 14:34:34Map Proj: UTM84-16NAcoustic Source File: C_SSS_3_B.jsfPing Number: 44176Range to Target: 23.77 MetersFish Height: 6.80 MetersHeading: 186.500 degreesEvent Number: 0Water Depth: 6.39Line Name: C_SSS_3_B
DimensionsTarget Height: = 1 MetersTarget Length: 2 MetersTarget Shadow: 3 MetersTarget Width: 1 MetersMag Anomaly: Avoidance Area: Classification 1: tiresClassification 2: Area: Block: Description:
C_SSS_3_B_143431Sonar Time at Target: 06/19/2013 14:34:32Map Proj: UTM84-16NAcoustic Source File: C_SSS_3_B.jsfPing Number: 44156Range to Target: 12.81 MetersFish Height: 6.44 MetersHeading: 192.800 degreesEvent Number: 0Water Depth: 6.74Line Name: C_SSS_3_B
DimensionsTarget Height: = 0 MetersTarget Length: 2 MetersTarget Shadow: 1 MetersTarget Width: 2 MetersMag Anomaly: Avoidance Area: Classification 1: debrisClassification 2: Area: Block: Description:
C_SSS_1_2_142936Sonar Time at Target: 06/19/2013 14:29:37Map Proj: UTM84-16NAcoustic Source File: C_SSS_1_2.jsfPing Number: 41312Range to Target: 42.45 MetersFish Height: 6.95 MetersHeading: 98.400 degreesEvent Number: 0Water Depth: 6.44Line Name: C_SSS_1_2
DimensionsTarget Height: = 0 MetersTarget Length: 35 MetersTarget Shadow: 0 MetersTarget Width: 1 MetersMag Anomaly: Avoidance Area: Classification 1: pipelineClassification 2: Area: Block: Description:
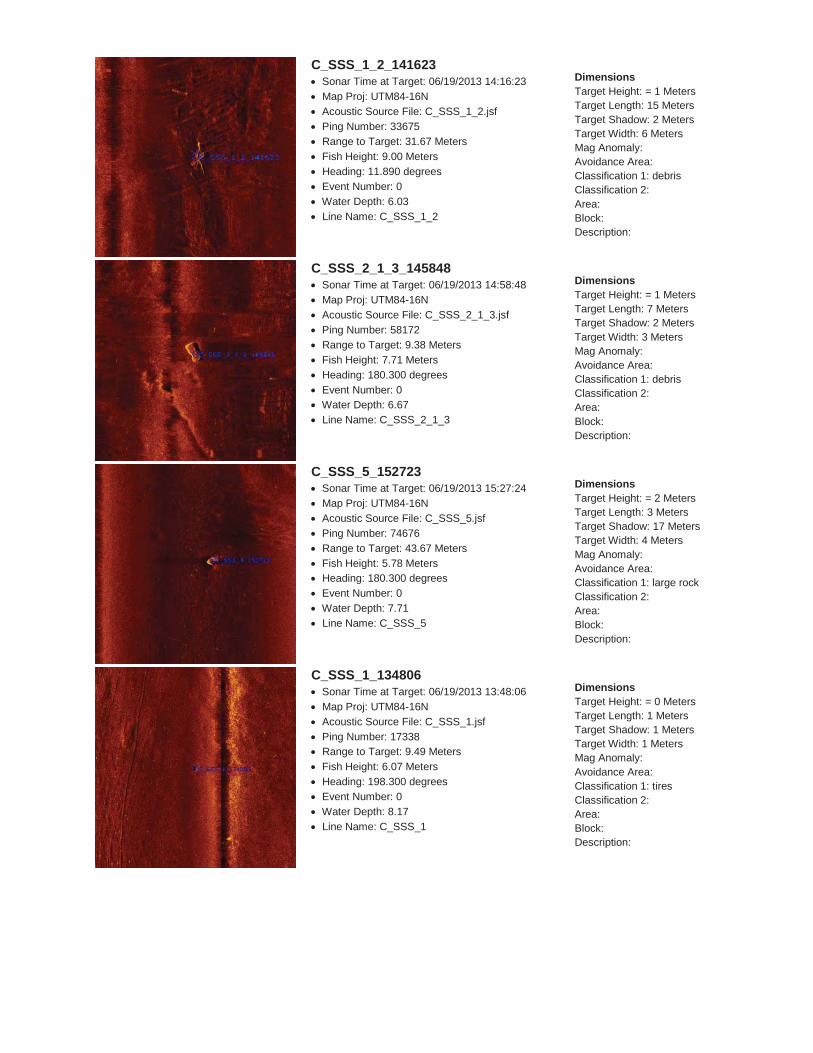
C_SSS_1_2_141623Sonar Time at Target: 06/19/2013 14:16:23Map Proj: UTM84-16NAcoustic Source File: C_SSS_1_2.jsfPing Number: 33675Range to Target: 31.67 MetersFish Height: 9.00 MetersHeading: 11.890 degreesEvent Number: 0Water Depth: 6.03Line Name: C_SSS_1_2
DimensionsTarget Height: = 1 MetersTarget Length: 15 MetersTarget Shadow: 2 MetersTarget Width: 6 MetersMag Anomaly: Avoidance Area: Classification 1: debrisClassification 2: Area: Block: Description:
C_SSS_2_1_3_145848Sonar Time at Target: 06/19/2013 14:58:48Map Proj: UTM84-16NAcoustic Source File: C_SSS_2_1_3.jsfPing Number: 58172Range to Target: 9.38 MetersFish Height: 7.71 MetersHeading: 180.300 degreesEvent Number: 0Water Depth: 6.67Line Name: C_SSS_2_1_3
DimensionsTarget Height: = 1 MetersTarget Length: 7 MetersTarget Shadow: 2 MetersTarget Width: 3 MetersMag Anomaly: Avoidance Area: Classification 1: debrisClassification 2: Area: Block: Description:
C_SSS_5_152723Sonar Time at Target: 06/19/2013 15:27:24Map Proj: UTM84-16NAcoustic Source File: C_SSS_5.jsfPing Number: 74676Range to Target: 43.67 MetersFish Height: 5.78 MetersHeading: 180.300 degreesEvent Number: 0Water Depth: 7.71Line Name: C_SSS_5
DimensionsTarget Height: = 2 MetersTarget Length: 3 MetersTarget Shadow: 17 MetersTarget Width: 4 MetersMag Anomaly: Avoidance Area: Classification 1: large rockClassification 2: Area: Block: Description:
C_SSS_1_134806Sonar Time at Target: 06/19/2013 13:48:06Map Proj: UTM84-16NAcoustic Source File: C_SSS_1.jsfPing Number: 17338Range to Target: 9.49 MetersFish Height: 6.07 MetersHeading: 198.300 degreesEvent Number: 0Water Depth: 8.17Line Name: C_SSS_1
DimensionsTarget Height: = 0 MetersTarget Length: 1 MetersTarget Shadow: 1 MetersTarget Width: 1 MetersMag Anomaly: Avoidance Area: Classification 1: tiresClassification 2: Area: Block: Description:

C_SSS_1_2_142928Sonar Time at Target: 06/19/2013 14:29:28Map Proj: UTM84-16NAcoustic Source File: C_SSS_1_2.jsfPing Number: 41231Range to Target: 26.35 MetersFish Height: 6.80 MetersHeading: 88.400 degreesEvent Number: 0Water Depth: 6.60Line Name: C_SSS_1_2
DimensionsTarget Height: = 4 MetersTarget Length: 2 MetersTarget Shadow: 40 MetersTarget Width: 1 MetersMag Anomaly: Avoidance Area: Classification 1: buoy anchorClassification 2: Area: Block: Description:
C_SSS_1_134640Sonar Time at Target: 06/19/2013 13:46:42Map Proj: UTM84-16NAcoustic Source File: C_SSS_1.jsfPing Number: 16473Range to Target: 29.21 MetersFish Height: 6.15 MetersHeading: 208.800 degreesEvent Number: 0Water Depth: 8.20Line Name: C_SSS_1
DimensionsTarget Height: = 0 MetersTarget Length: 4 MetersTarget Shadow: 0 MetersTarget Width: 3 MetersMag Anomaly: Avoidance Area: Classification 1: debrisClassification 2: Area: Block: Description:
C_SSS_5_152907Sonar Time at Target: 06/19/2013 15:29:07Map Proj: UTM84-16NAcoustic Source File: C_SSS_5.jsfPing Number: 75682Range to Target: 42.01 MetersFish Height: 6.00 MetersHeading: 190.600 degreesEvent Number: 0Water Depth: 7.85Line Name: C_SSS_5
DimensionsTarget Height: = 0 MetersTarget Length: 6 MetersTarget Shadow: 2 MetersTarget Width: 2 MetersMag Anomaly: Avoidance Area: Classification 1: rockClassification 2: Area: Block: Description:
13USM01_Area_C_Targets.doc 07/22/2013 01:15:17 PM targetReportGen2 V3.15.15