Embed Size (px)
Citation preview
Data Acquisition: Aliasing
Mark Colton ME 363
Spring 2011
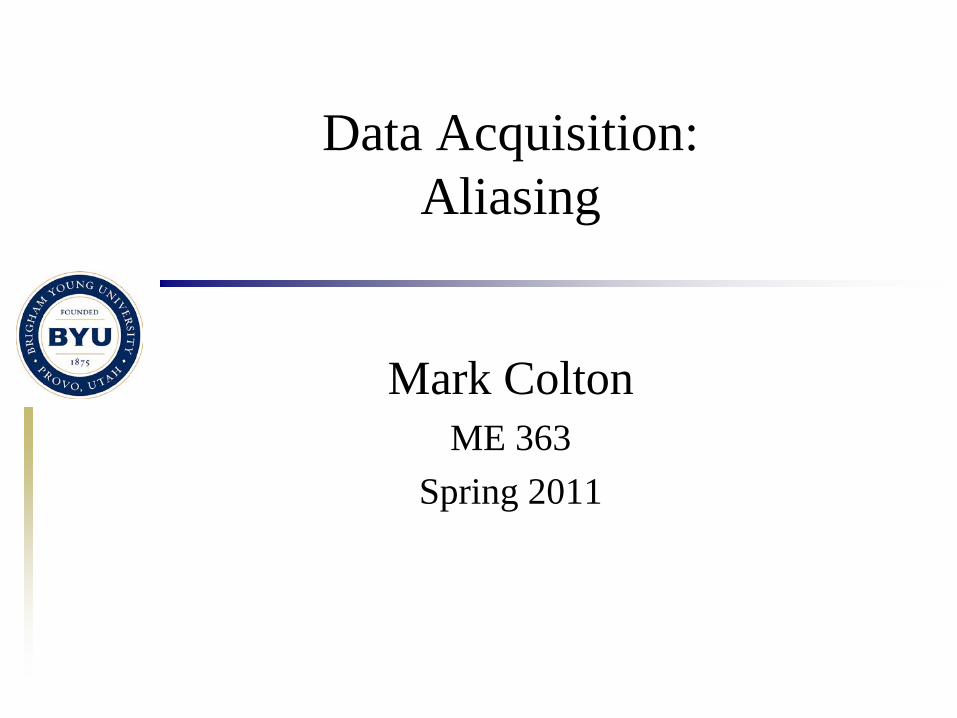
Old Movies
Old Movies
What do these clips have in common? – The wheels appear to move backwards – The wheels appear to be moving too slowly – “Wagon wheel effect” – “Aliasing”
Why does this happen? – Sampling – (Bad selection of sampling rate)
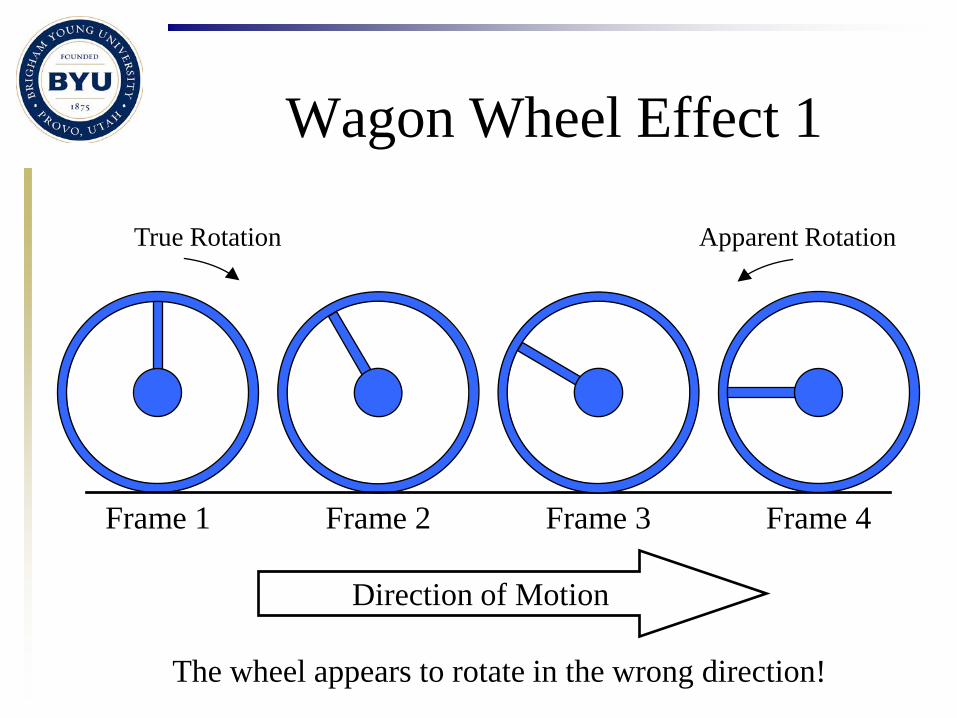
Wagon Wheel Effect 1
Direction of Motion
True Rotation
Frame 1 Frame 2 Frame 3 Frame 4
Apparent Rotation
The wheel appears to rotate in the wrong direction!
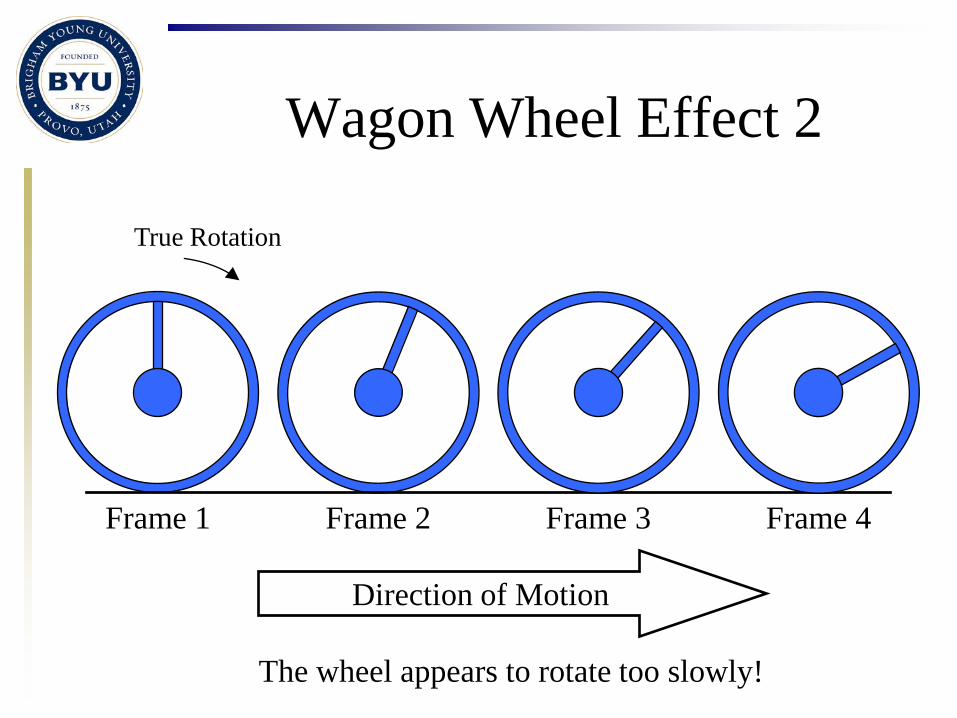
Wagon Wheel Effect 2
Direction of Motion
True Rotation
Frame 1 Frame 2 Frame 3 Frame 4
The wheel appears to rotate too slowly!

Another Movie
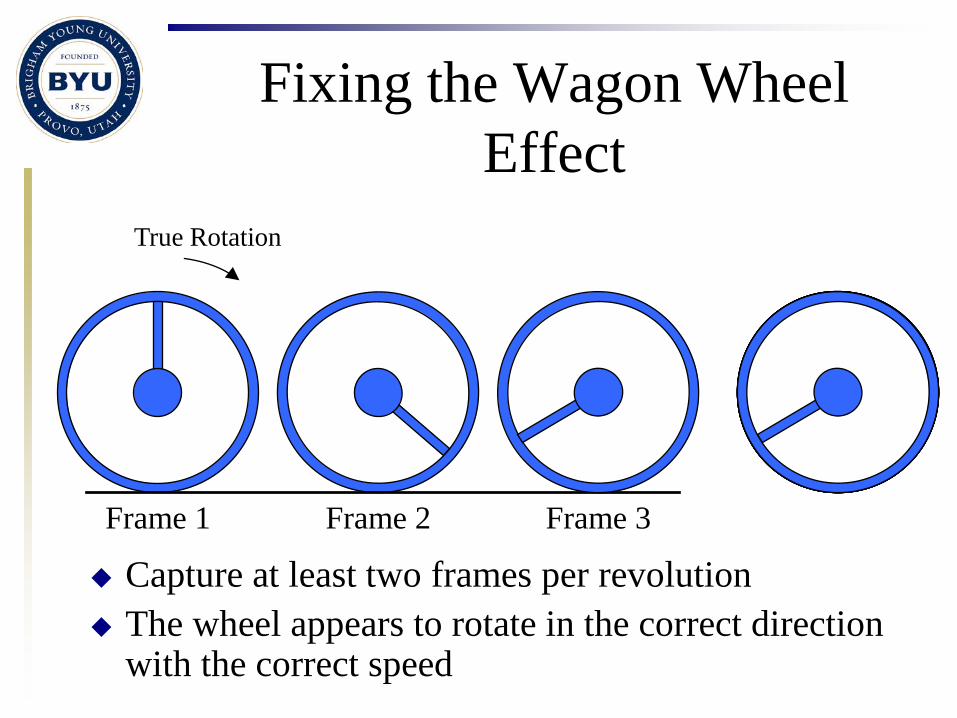
Fixing the Wagon Wheel Effect
Capture at least two frames per revolution The wheel appears to rotate in the correct direction
with the correct speed
True Rotation
Frame 1 Frame 2 Frame 3
Aliasing
In instrumentation (and other fields) the wagon wheel effect is called “aliasing”
Definition: Appearance of false frequency components in a signal due to sampling
Remedy: Sample faster (we’ll see how fast)
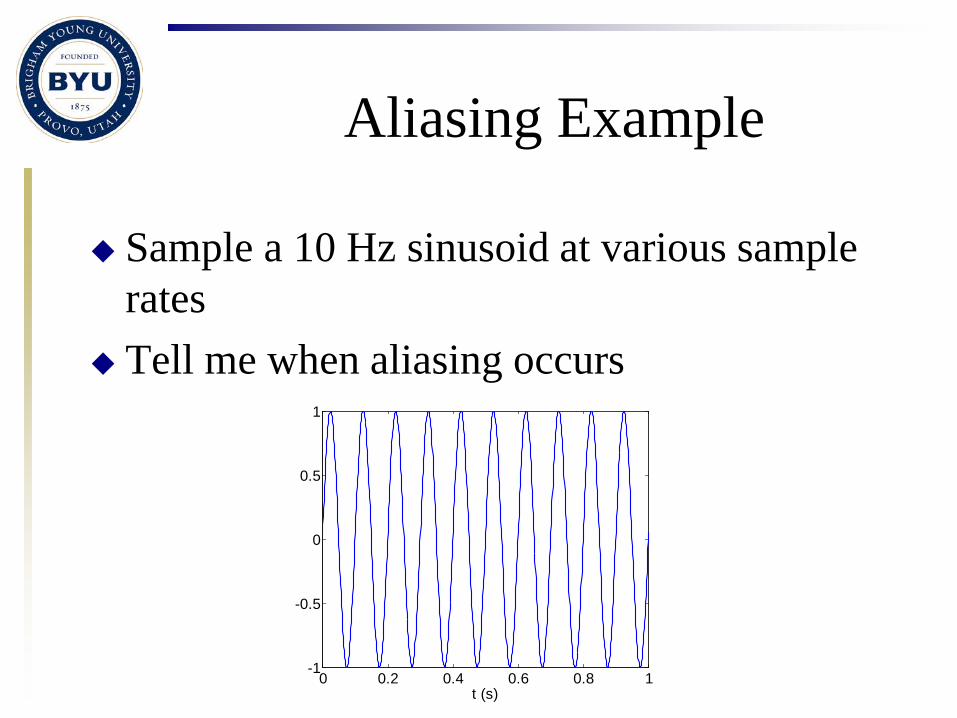
Aliasing Example
Sample a 10 Hz sinusoid at various sample rates
Tell me when aliasing occurs
0 0.2 0.4 0.6 0.8 1-1
-0.5
0
0.5
1
t (s)
Aliasing Example
0 0.2 0.4 0.6 0.8 1-1
-0.5
0
0.5
1
t (s)
fs = 50.00fm
0 0.2 0.4 0.6 0.8 1-1
-0.5
0
0.5
1
t (s)
fs = 20.00fm
0 0.2 0.4 0.6 0.8 1-1
-0.5
0
0.5
1
t (s)
fs = 10.00fm
0 0.2 0.4 0.6 0.8 1-1
-0.5
0
0.5
1
t (s)
fs = 5.00fm
0 0.2 0.4 0.6 0.8 1-1
-0.5
0
0.5
1
t (s)
fs = 2.00fm
0 0.2 0.4 0.6 0.8 1-1
-0.5
0
0.5
1
t (s)
fs = 1.50fm
0 0.2 0.4 0.6 0.8 1-1
-0.5
0
0.5
1
t (s)
fs = 1.20fm
0 0.2 0.4 0.6 0.8 1-1
-0.5
0
0.5
1
t (s)
fs = 1.05fm
0 0.2 0.4 0.6 0.8 1-1
-0.5
0
0.5
1
t (s)
fs = 1.00fm
0 0.2 0.4 0.6 0.8 1-1
-0.5
0
0.5
1
t (s)
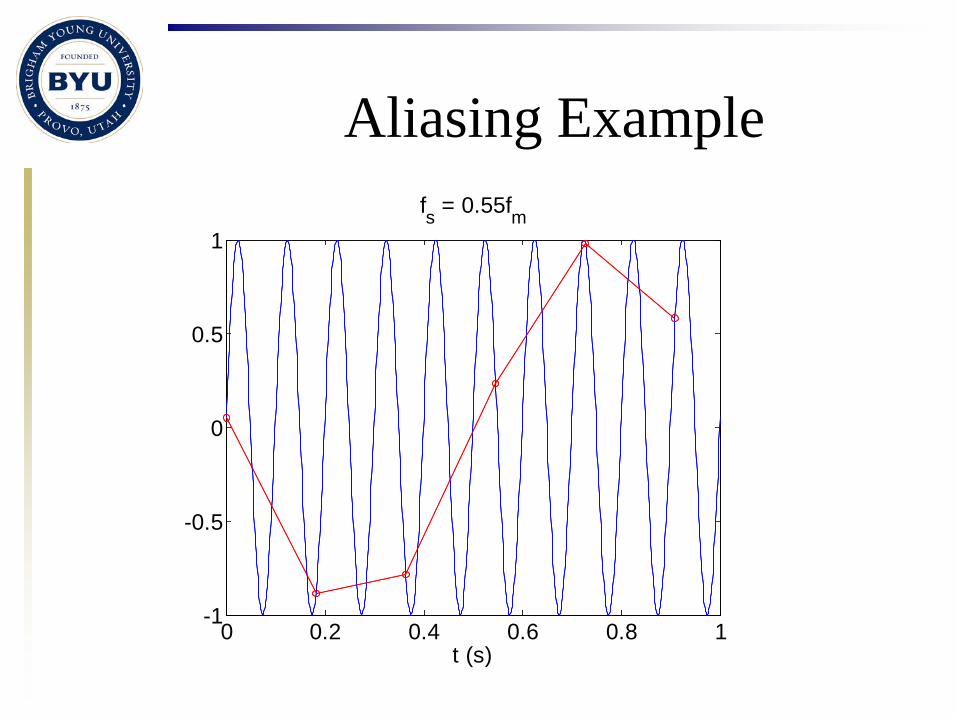
fs = 0.55fm
Alias Frequencies
The false frequencies that appear in sampled signals are called “alias frequencies”
Once aliasing has occurred, there is no way to get back the original signal
Can we predict alias frequencies? – Yes, if we know:
• The frequency content of the measured signal • The sampling rate
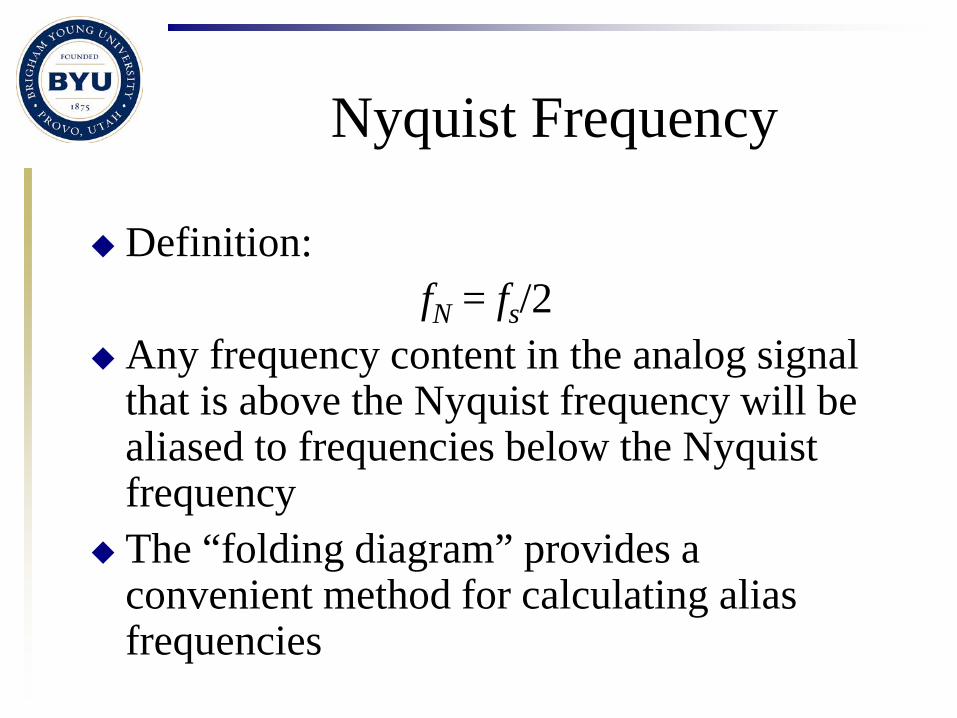
Nyquist Frequency
Definition: fN = fs/2
Any frequency content in the analog signal that is above the Nyquist frequency will be aliased to frequencies below the Nyquist frequency
The “folding diagram” provides a convenient method for calculating alias frequencies
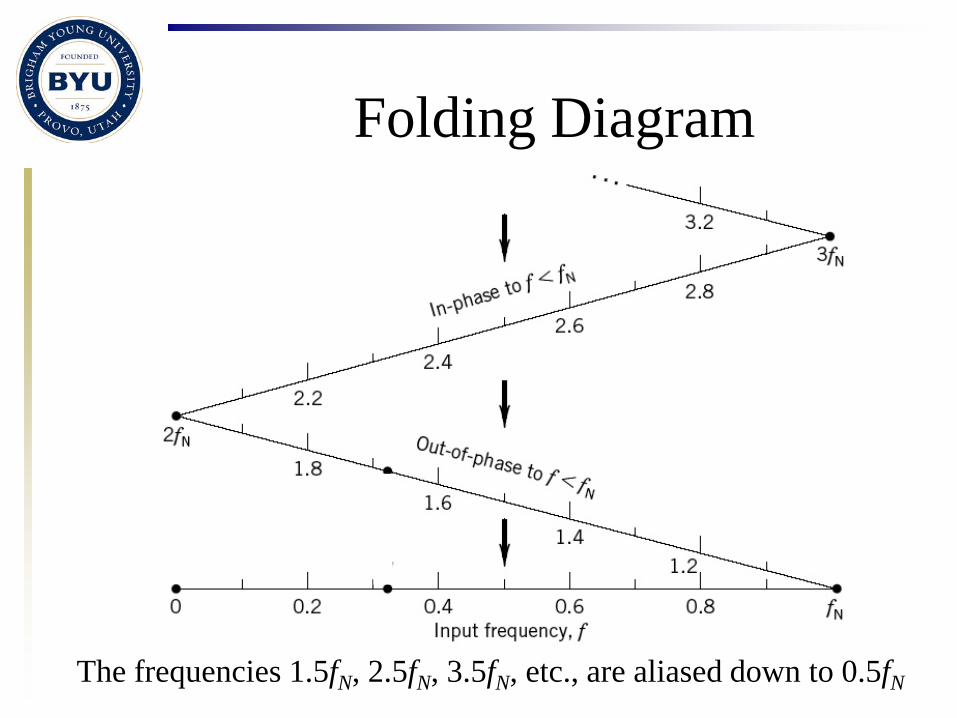
Folding Diagram
The frequencies 1.5fN, 2.5fN, 3.5fN, etc., are aliased down to 0.5fN
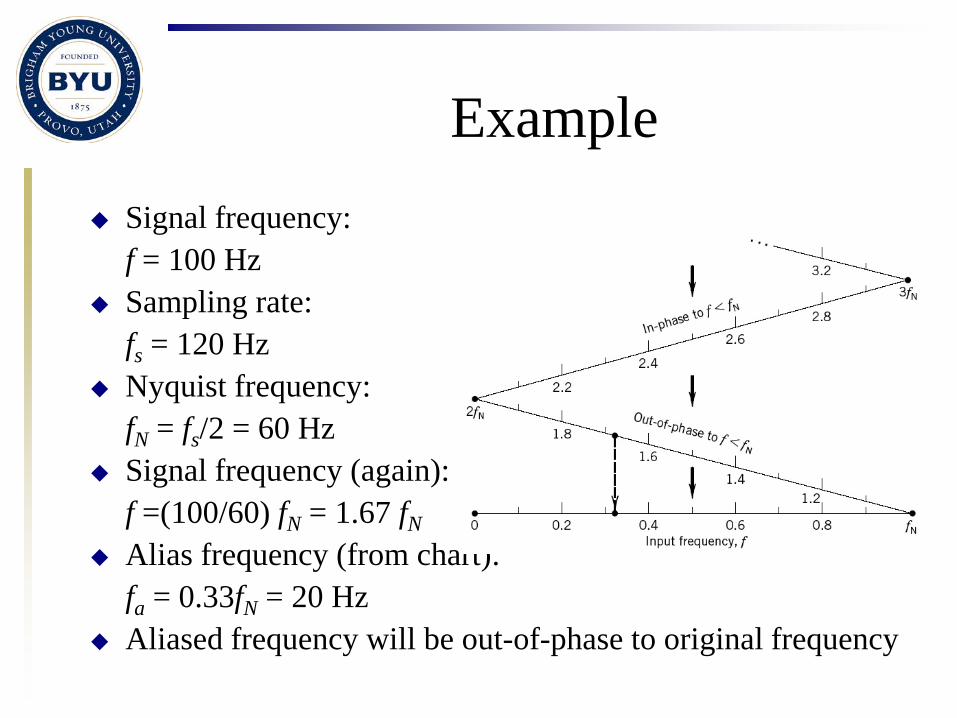
Example Signal frequency: f = 100 Hz Sampling rate: fs = 120 Hz Nyquist frequency: fN = fs/2 = 60 Hz Signal frequency (again): f =(100/60) fN = 1.67 fN Alias frequency (from chart): fa = 0.33fN = 20 Hz Aliased frequency will be out-of-phase to original frequency
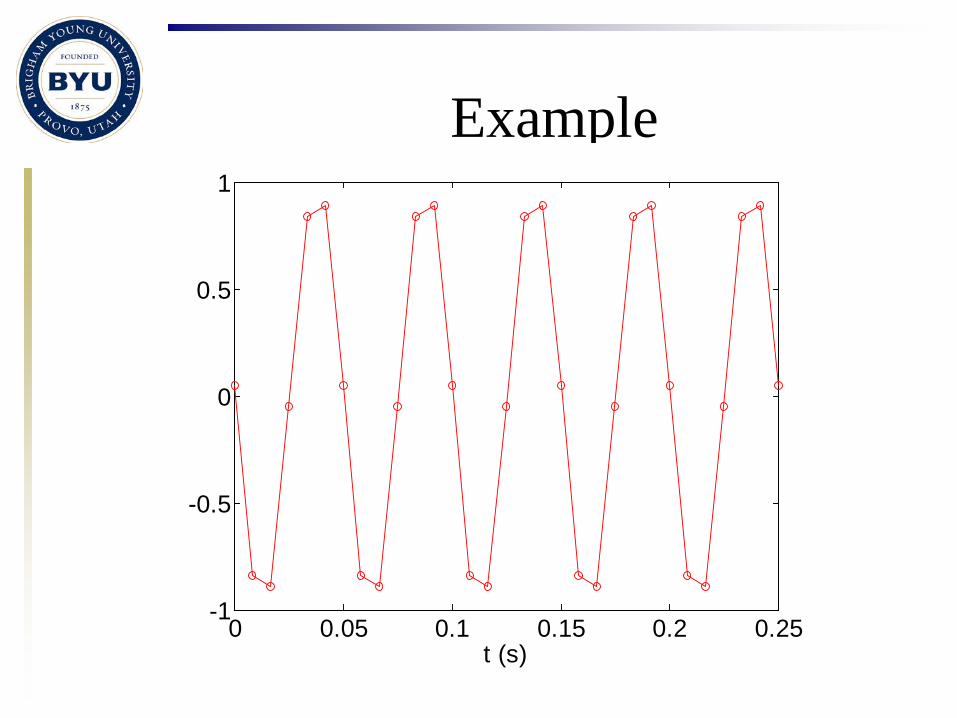
Example
0 0.05 0.1 0.15 0.2 0.25-1
-0.5
0
0.5
1
t (s)0 0.05 0.1 0.15 0.2 0.25
-1
-0.5
0
0.5
1
t (s)0 0.05 0.1 0.15 0.2 0.25
-1
-0.5
0
0.5
1
t (s)0 0.05 0.1 0.15 0.2 0.25
-1
-0.5
0
0.5
1
t (s)
Summary
Problem: Aliasing occurs when the frequency content of the signal exceeds the Nyquist frequency
Solution: Select your sampling rate to be at least twice the highest frequency in the signal of interest
(This is what we already stated in the sampling theorem)
Another Problem
We showed that, if we don’t sample fast enough, our signal of interest will not be represented correctly
There is another problem due to aliasing, and it has to do with noise
Example
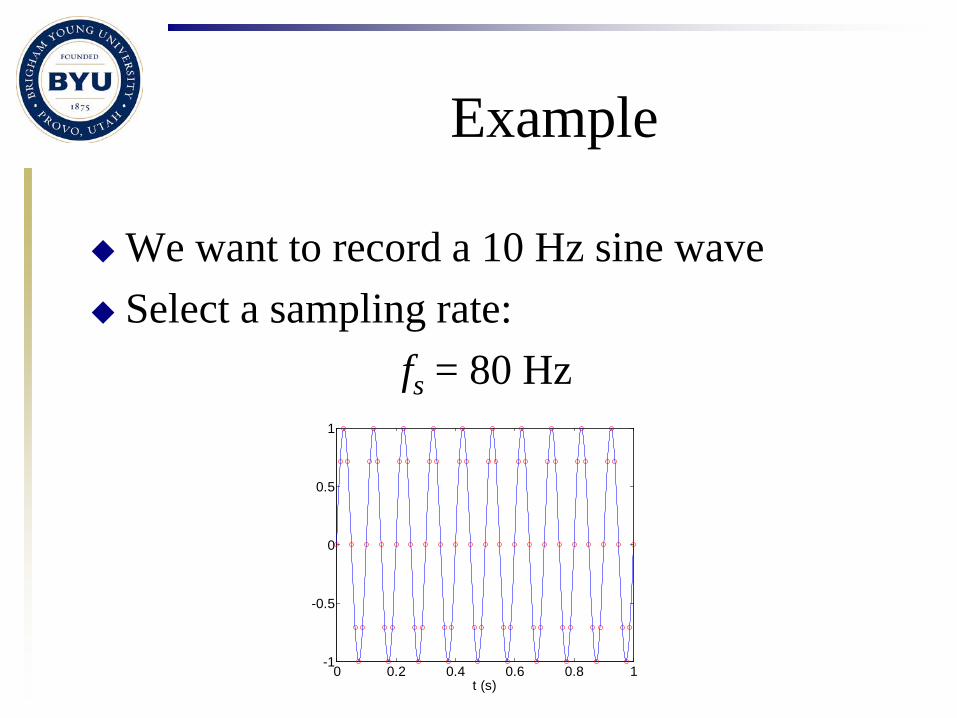
We want to record a 10 Hz sine wave Select a sampling rate:
fs = 80 Hz
0 0.2 0.4 0.6 0.8 1-1
-0.5
0
0.5
1
t (s)0 0.2 0.4 0.6 0.8 1
-1
-0.5
0
0.5
1
t (s)
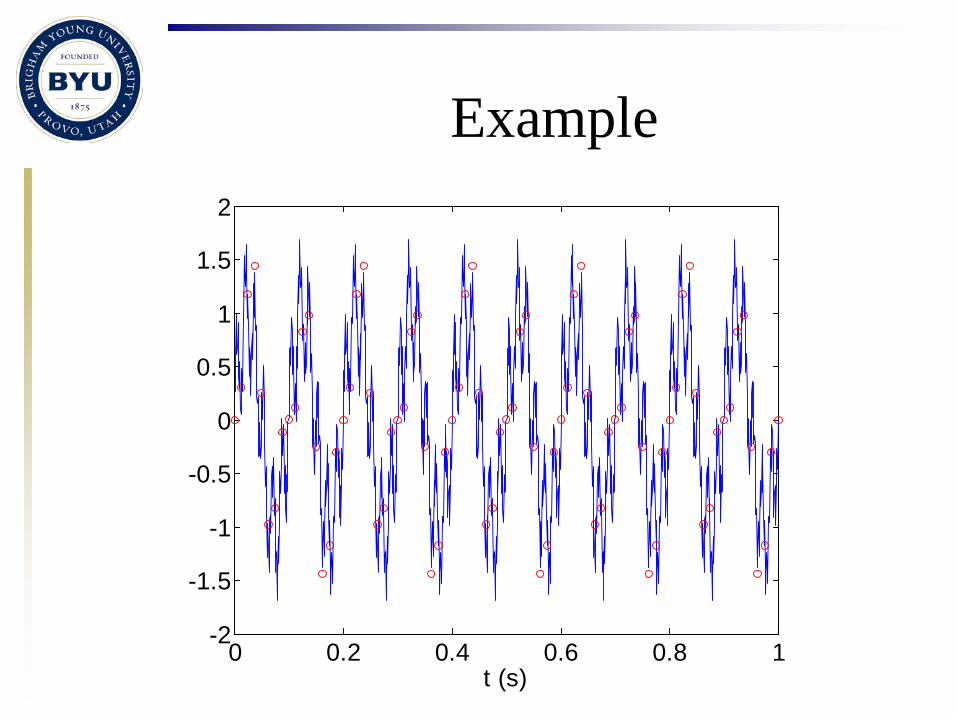
Example
Let’s see what happens if there is noise in the signal
Assume the measuring process adds 60 Hz and 325 Hz noise
What’s the problem with this? Both of these noise components are at frequencies
above the Nyquist frequency of fN = fs/2 = 40 Hz The noise will be aliased into the frequency range
below the Nyquist frequency
Example
0 0.2 0.4 0.6 0.8 1-2
-1.5
-1
-0.5
0
0.5
1
1.5
2
t (s)0 0.2 0.4 0.6 0.8 1
-2
-1.5
-1
-0.5
0
0.5
1
1.5
2
t (s)
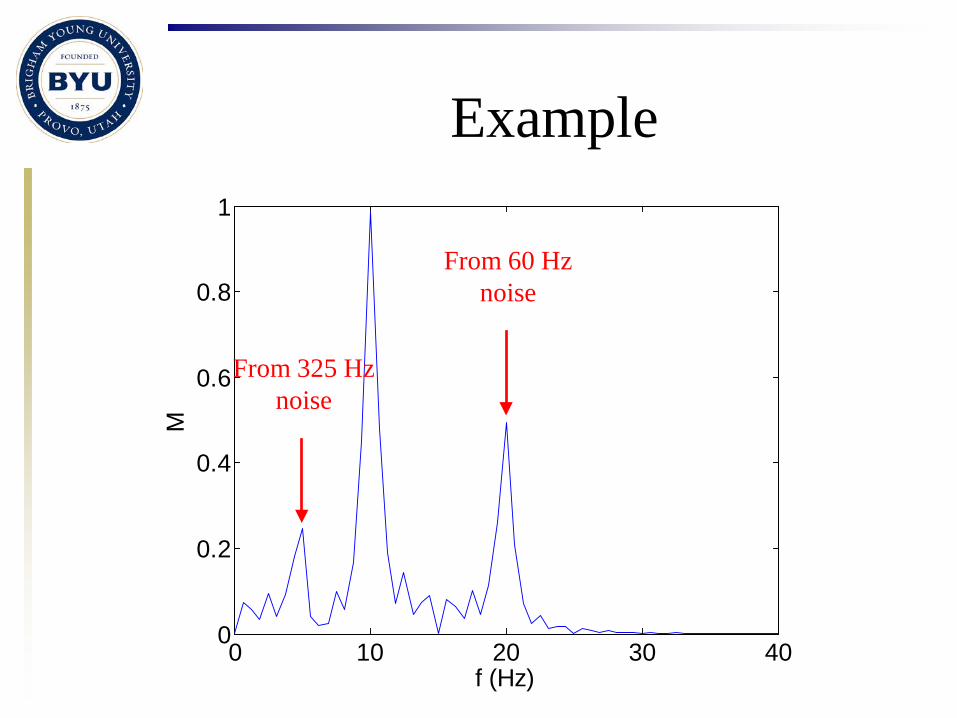
Example
0 10 20 30 400
0.2
0.4
0.6
0.8
1
f (Hz)
M
0 10 20 30 400
0.2
0.4
0.6
0.8
1
f (Hz)
M
From 60 Hz noise
From 325 Hz noise
Aliasing of Noise
Problem: Noise at higher frequencies is aliased into our frequency range of interest
Solution: Filter signal before sampling “Anti-aliasing filter”
Cutoff frequency should be no higher than the Nyquist frequency