Embed Size (px)
Citation preview
Data Access and Data WarehousingData Access and Data Warehousing
Michael F. GoodchildUniversity of California
Santa Barbara
OutlineOutline
GeolibrariesContrasting world viewsObject-oriented designSharing information
The digital libraryThe digital library
The digital catalog– author, title, subject– ca 1985
106 books in a major research library106 text characters per book1012 total storage requirement– ca 1992– preWeb
The digital map libraryThe digital map library
106 maps and images108 bytes per map or image1014 bytes totalGeographic location as the primary key– the geolibrary
A physical geolibrary is infeasible– one-dimensional, discrete author/title/subject– multidimensional, continuous location
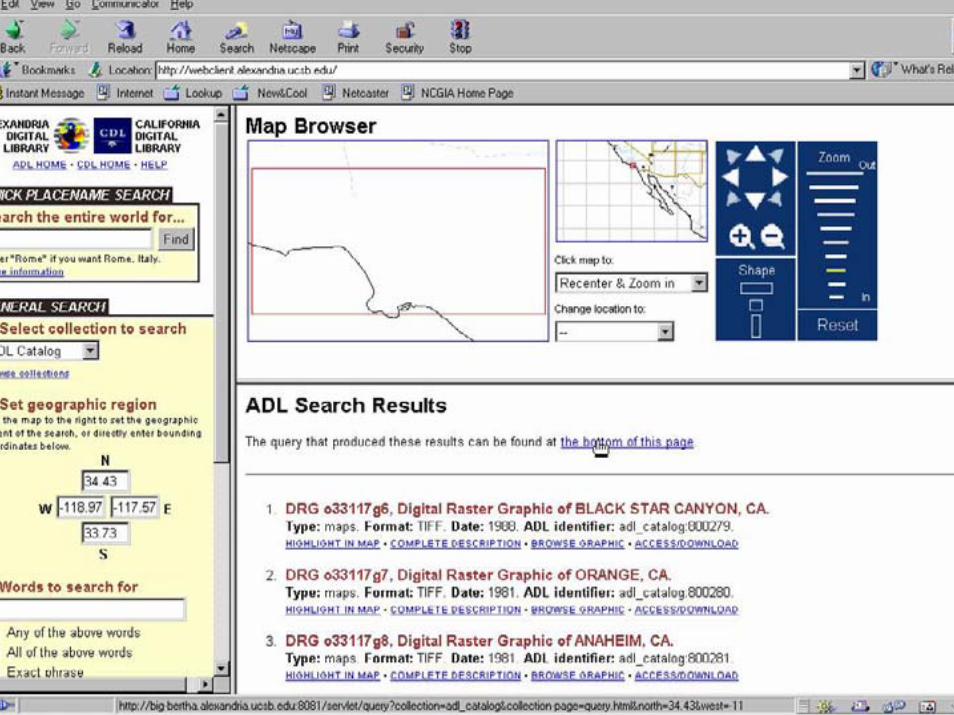
The Alexandria Digital LibraryThe Alexandria Digital Library
107 items, 1013 bytesThree ways of specifying location– pointing to a map– latitude and longitude– gazetteer
The library paradigm– putting data in the user’s hands– a gatekeeper
Beyond maps and images– information with a geographic footprint
Instances of geolibrariesInstances of geolibraries
www.alexandria.ucsb.eduNational Geospatial Data Clearinghouse– www.fgdc.gov
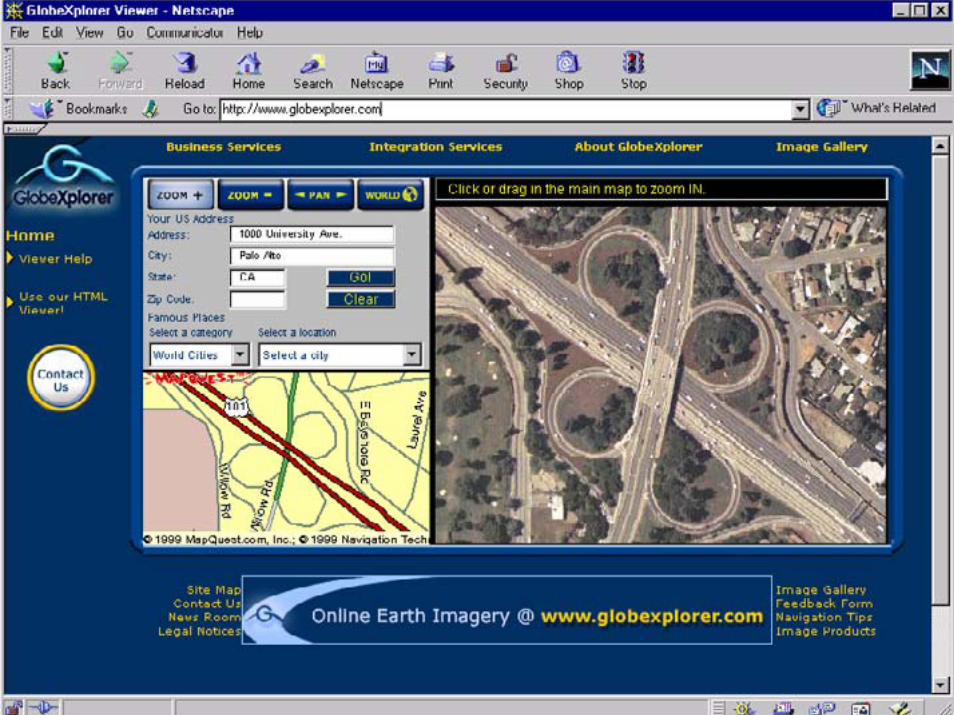
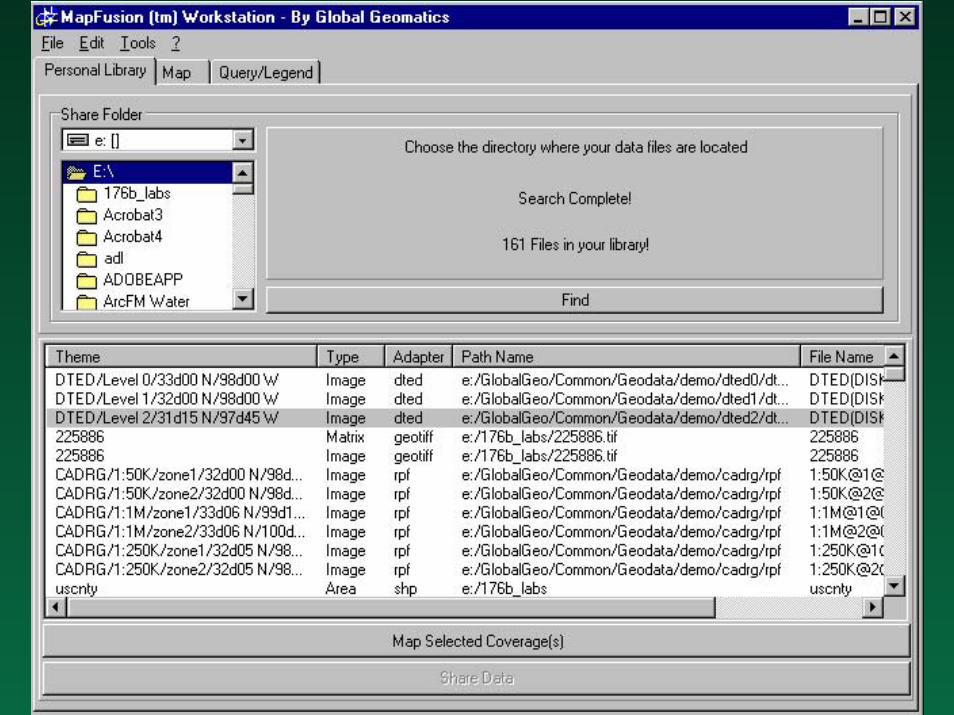
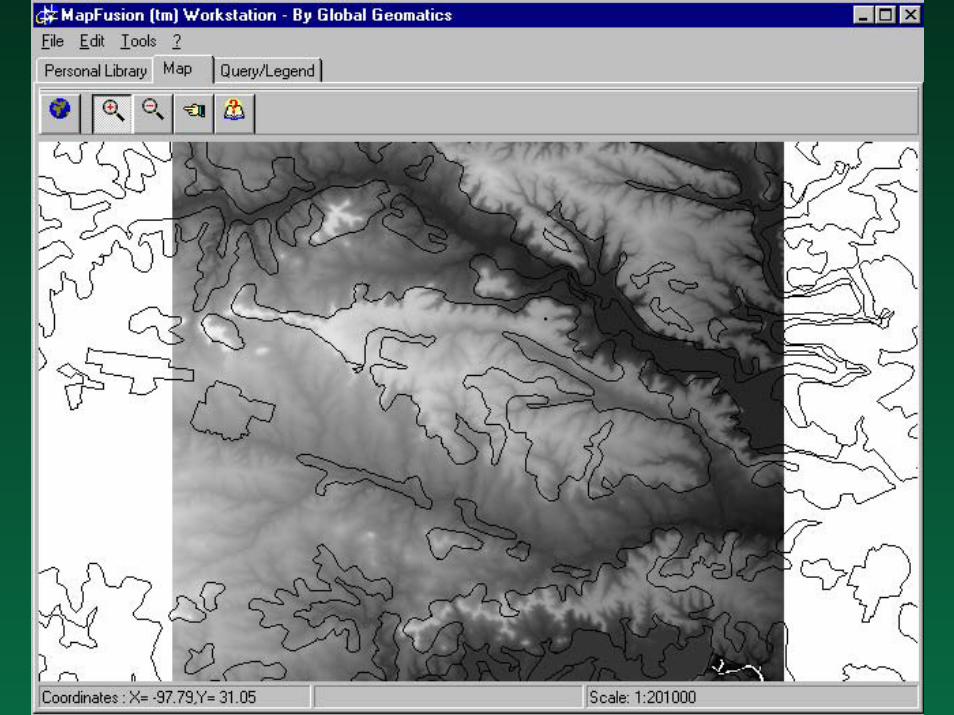
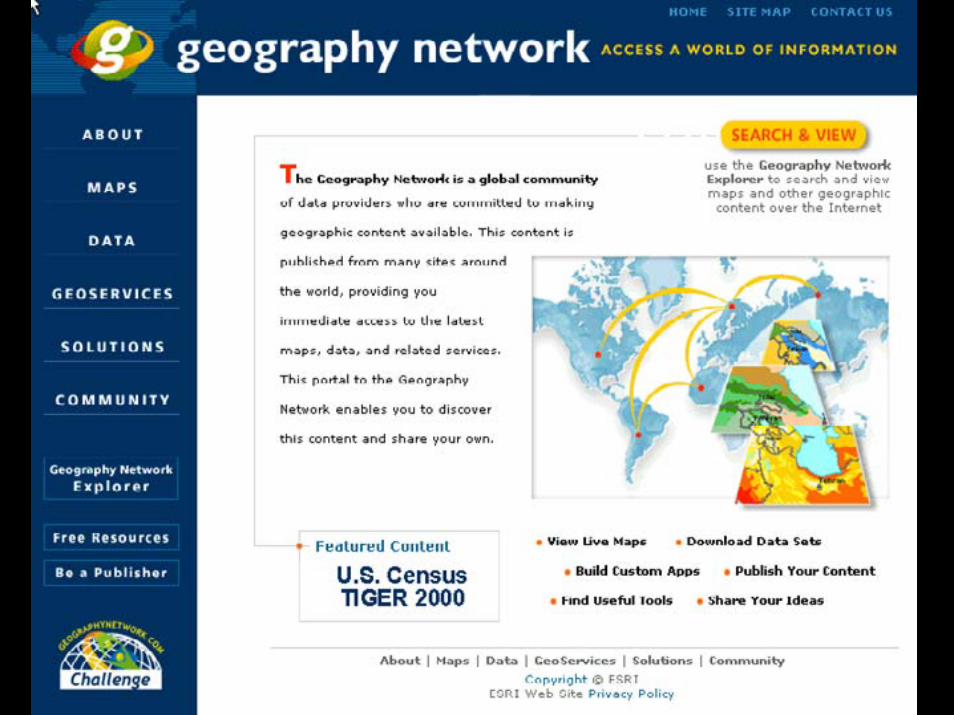
www.geographynetwork.com
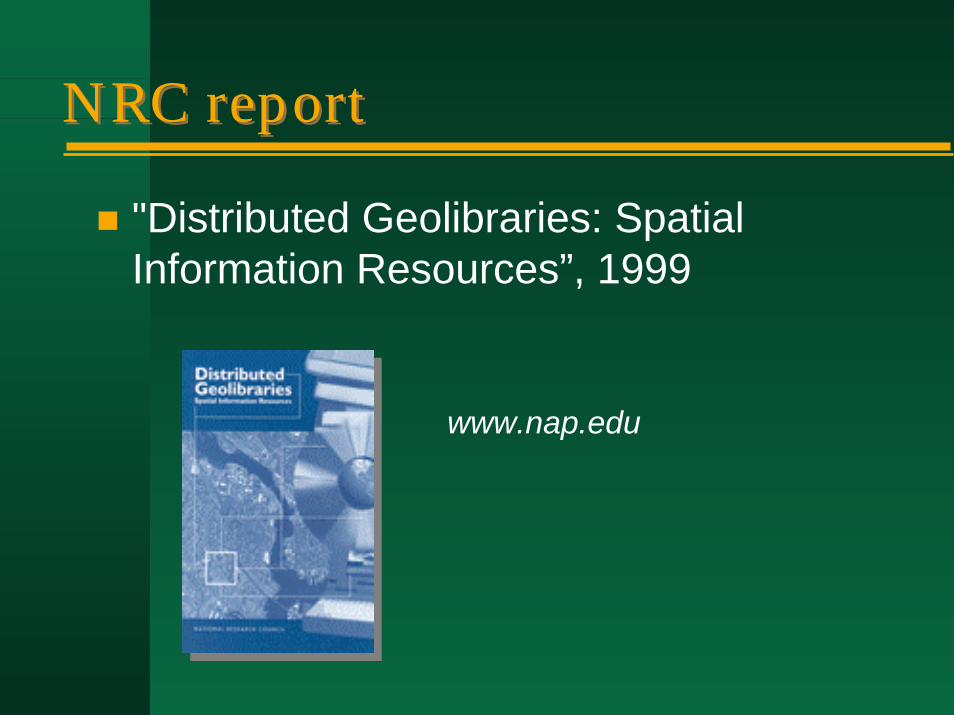
NRC reportNRC report
"Distributed Geolibraries: Spatial Information Resources”, 1999
www.nap.edu
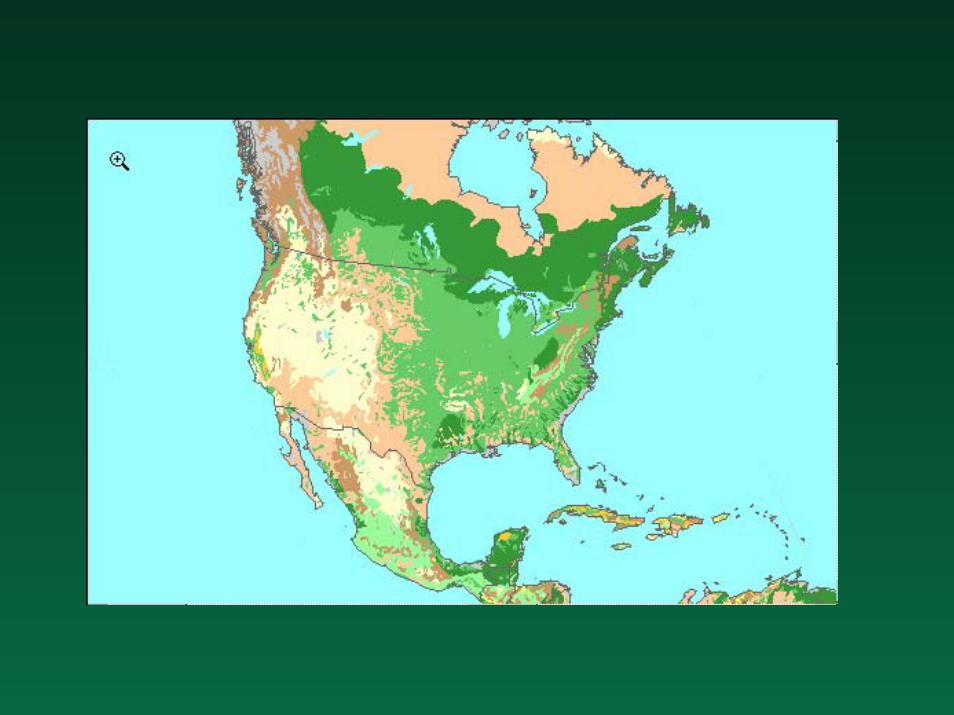
“Imagine, for example, a young child going to a Digital Earth exhibit at a local museum. After donning a head-mounted display, she sees Earth as it appears from space. Using a data glove, she zooms in, using higher and higher levels of resolution, to see continents, then regions, countries, cities, and finally individual houses, trees, and other natural and man-made objects. Having found an area of the planet she is interested in exploring, she takes the equivalent of a ‘magic carpet ride’ through a 3-D visualization of the terrain.”
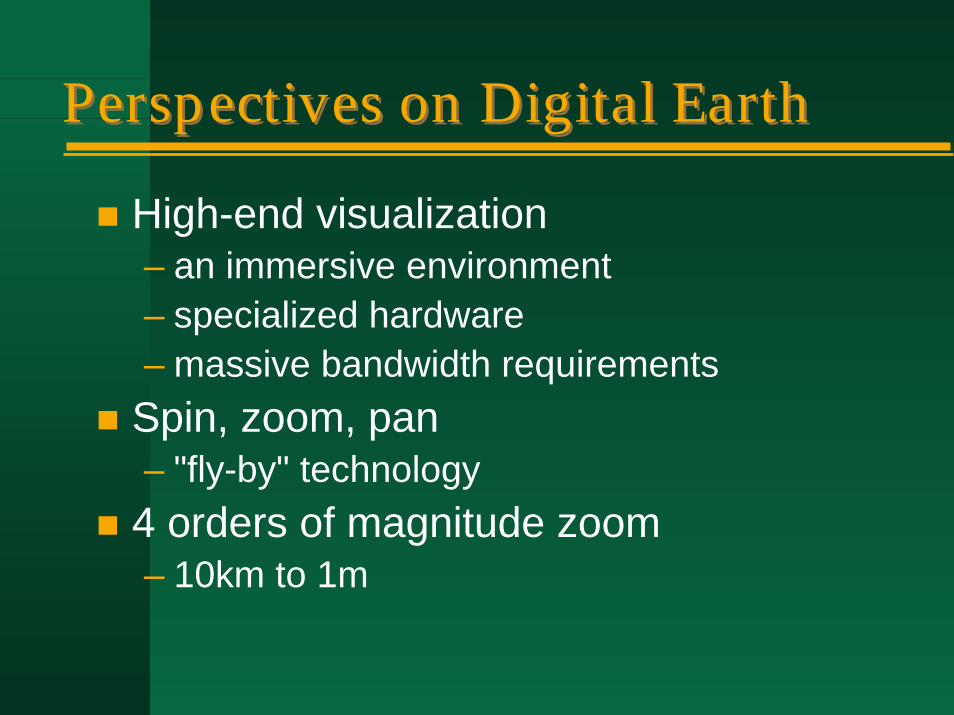
Perspectives on Digital EarthPerspectives on Digital Earth
High-end visualization – an immersive environment– specialized hardware– massive bandwidth requirements
Spin, zoom, pan– "fly-by" technology
4 orders of magnitude zoom– 10km to 1m

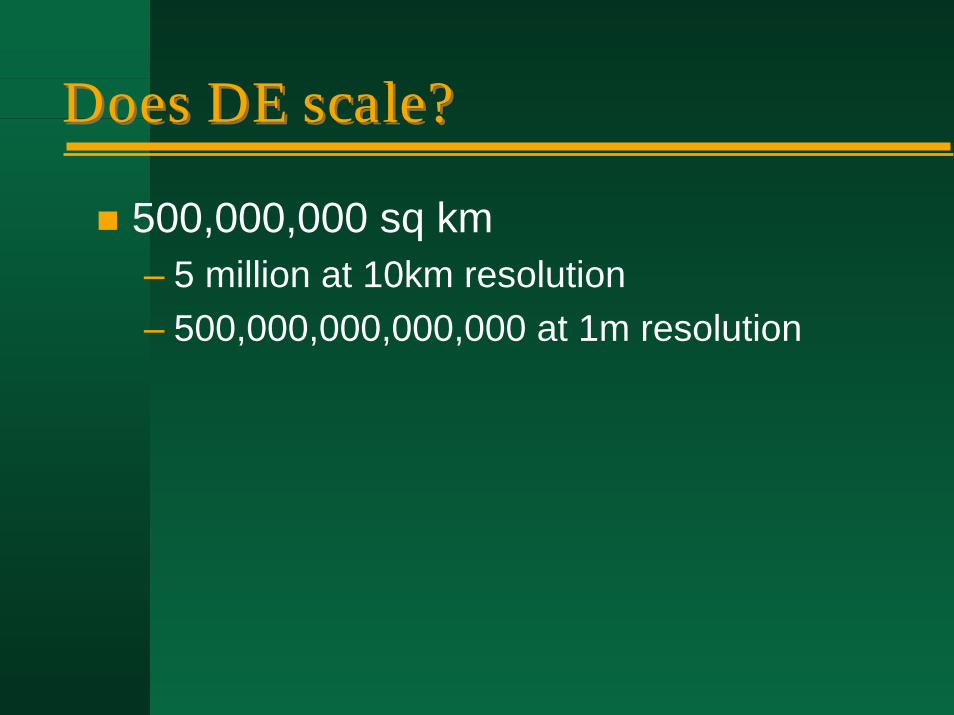
Does DE scale?Does DE scale?
500,000,000 sq km– 5 million at 10km resolution– 500,000,000,000,000 at 1m resolution
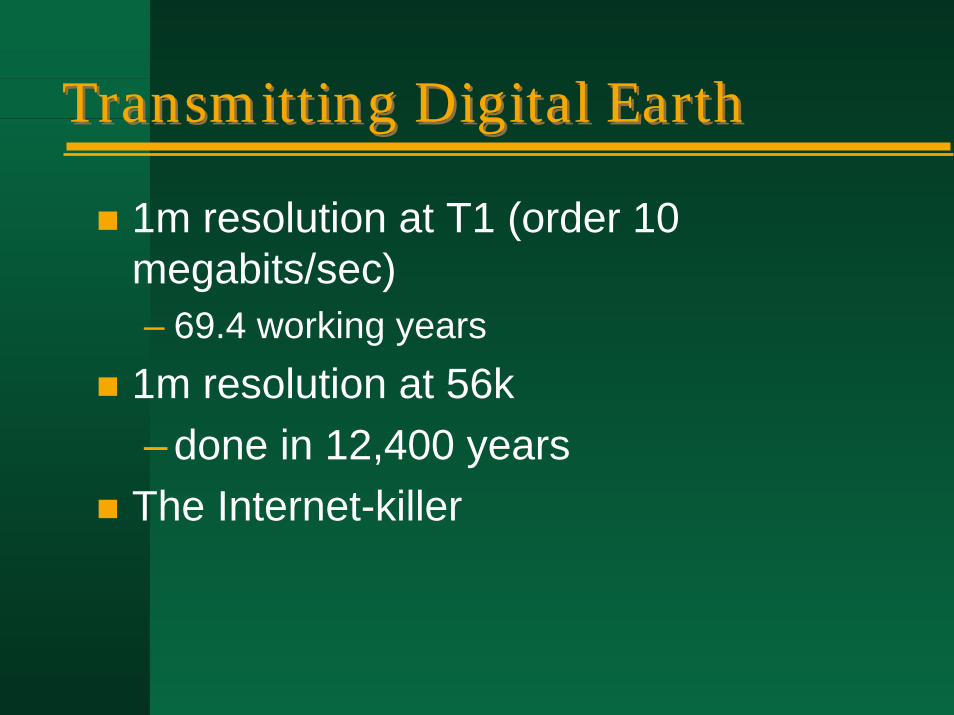
Transmitting Digital EarthTransmitting Digital Earth
1m resolution at T1 (order 10 megabits/sec)– 69.4 working years
1m resolution at 56k– done in 12,400 years
The Internet-killer
What resolution do we really need?What resolution do we really need?
Whole Earth at 10km– California at 1km– Santa Barbara County at 100m
L/S (extent divided by resolution)– order 103 or 104
– ratio for computer screen– ratio for human retina
The Internet can support DEThe Internet can support DE
1 refresh per second, 1 megapel images (L/S=103)– T1 rates without compression– 10+ refreshes per second with
compression– sufficient for zoom, pan, flyby
Research challenges forgeolibrariesResearch challenges forgeolibraries
Defining footprints– fuzzy, vernacular
Access for the child of ten– scale
Search over a distributed archive– search engines– object-level metadata (OLM)– collection-level metadata (CLM)
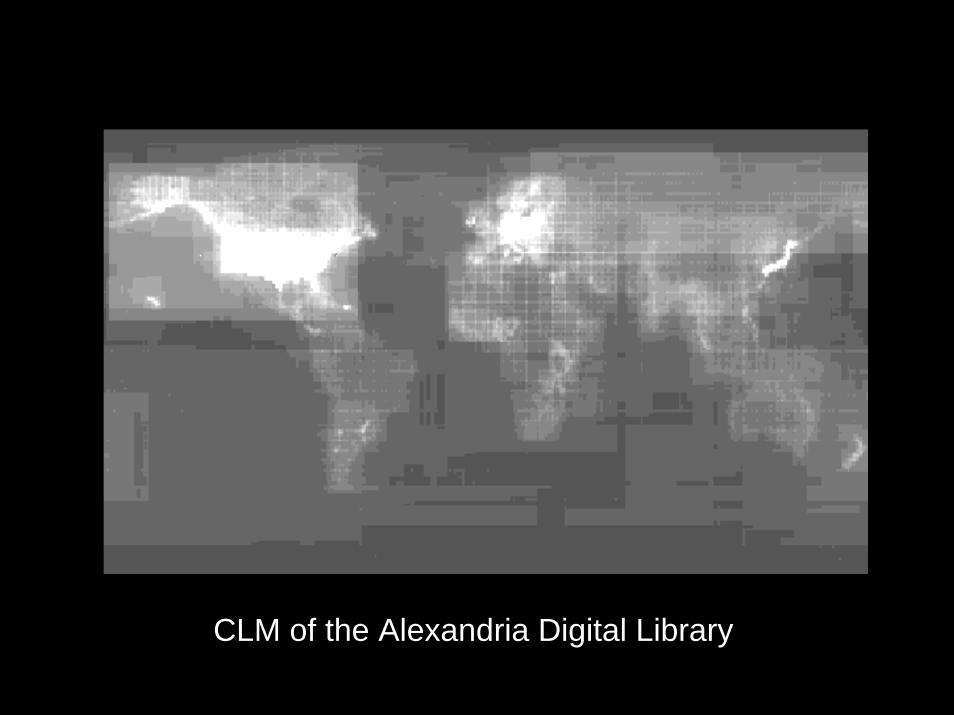
CLM of the Alexandria Digital Library
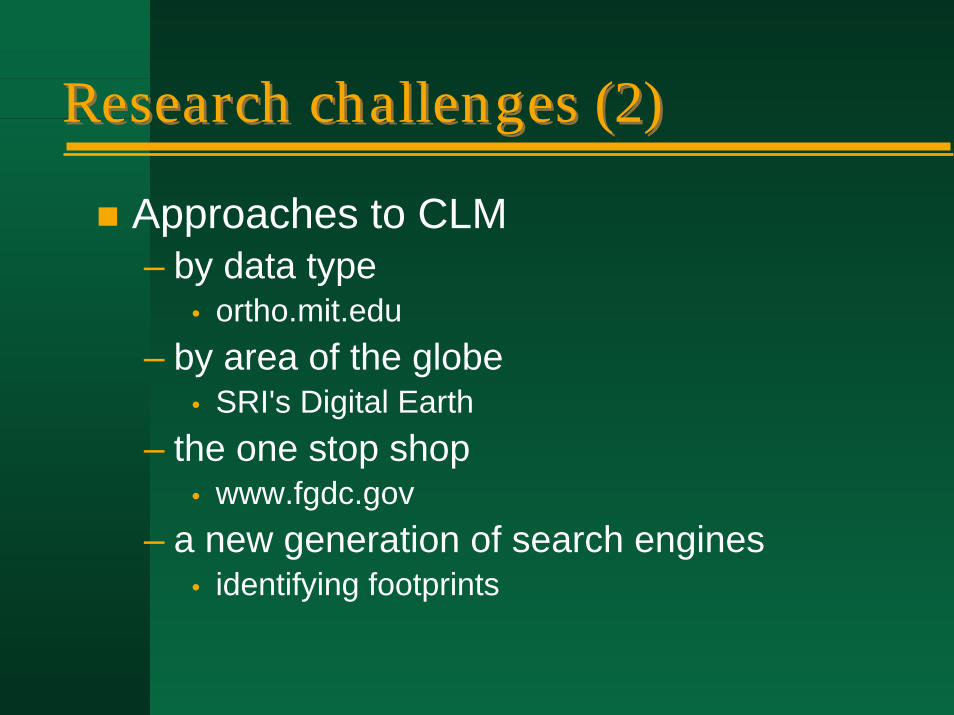
Research challenges (2)Research challenges (2)
Approaches to CLM– by data type
• ortho.mit.edu– by area of the globe
• SRI's Digital Earth– the one stop shop
• www.fgdc.gov– a new generation of search engines
• identifying footprints
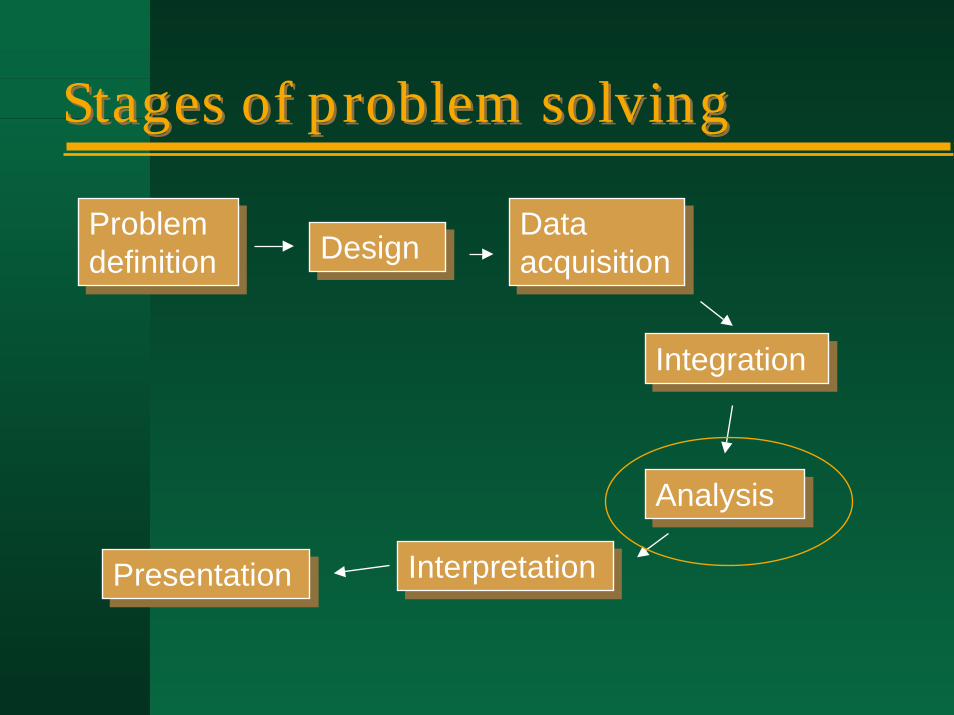
Stages of problem solvingStages of problem solving
Problem definitionProblem definition
Data acquisitionData acquisitionDesignDesign
IntegrationIntegration
AnalysisAnalysis
InterpretationInterpretationPresentationPresentation
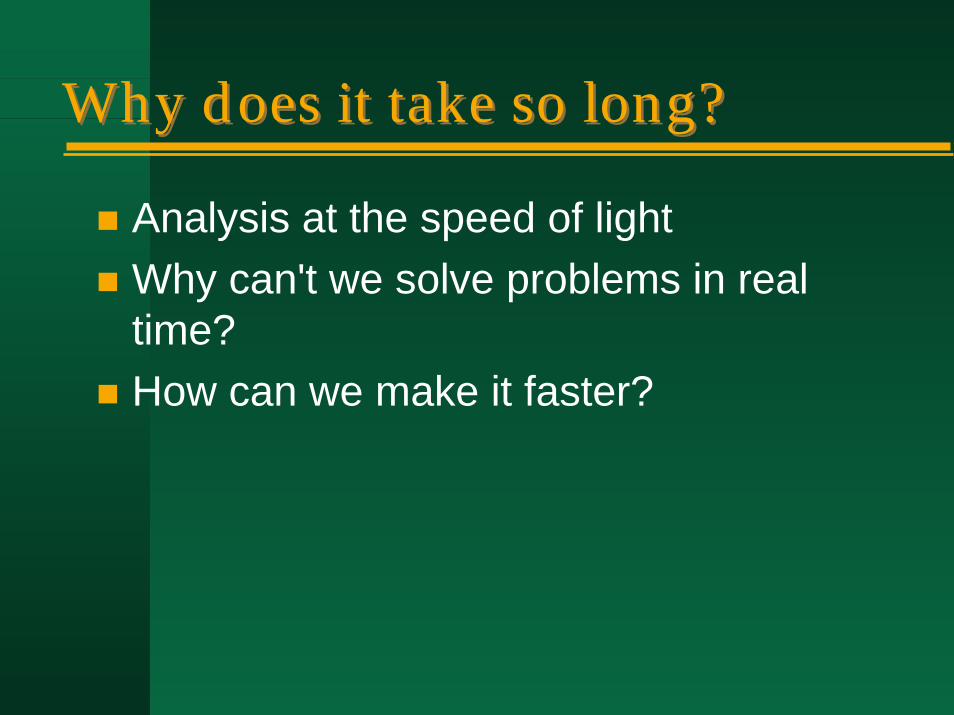
Why does it take so long?Why does it take so long?
Analysis at the speed of lightWhy can't we solve problems in real time?How can we make it faster?

Objectives of interoperabilityObjectives of interoperability
Using technology to overcome differences– rather than imposing uniformity– enabling rather than intrusive– specifications not standards
Bridging information communitiesSpeeding and easing access to data
Major forces in spatial data interoperabilityMajor forces in spatial data interoperability
National Spatial Data Infrastructure– Federal Geographic Data Committee
Open GIS Consortium– industry, government, academic
National, regional, and international standards organizations
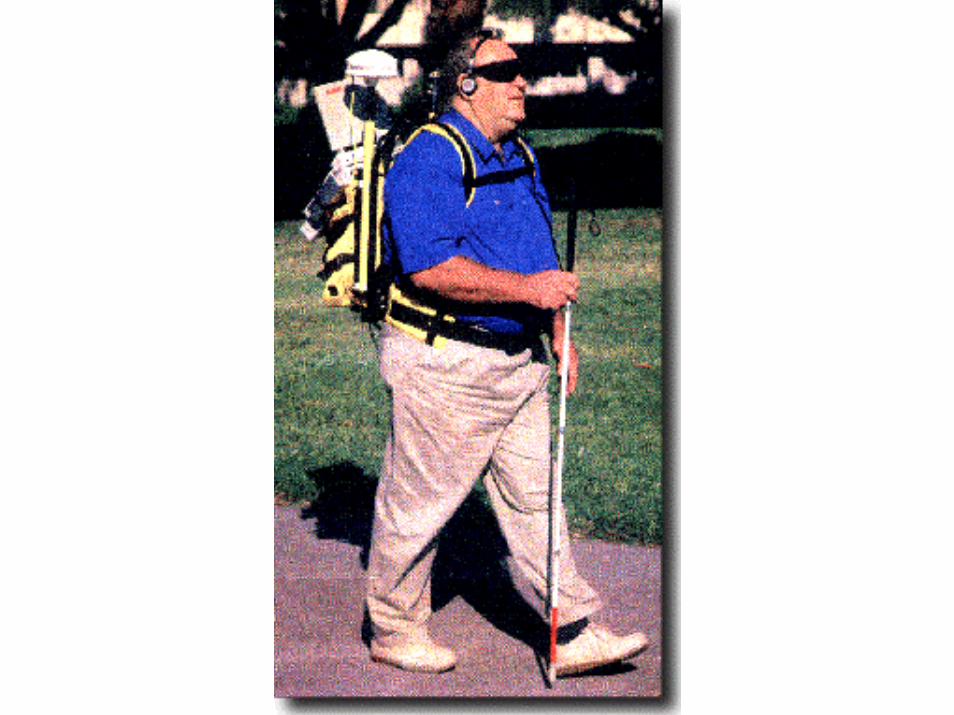
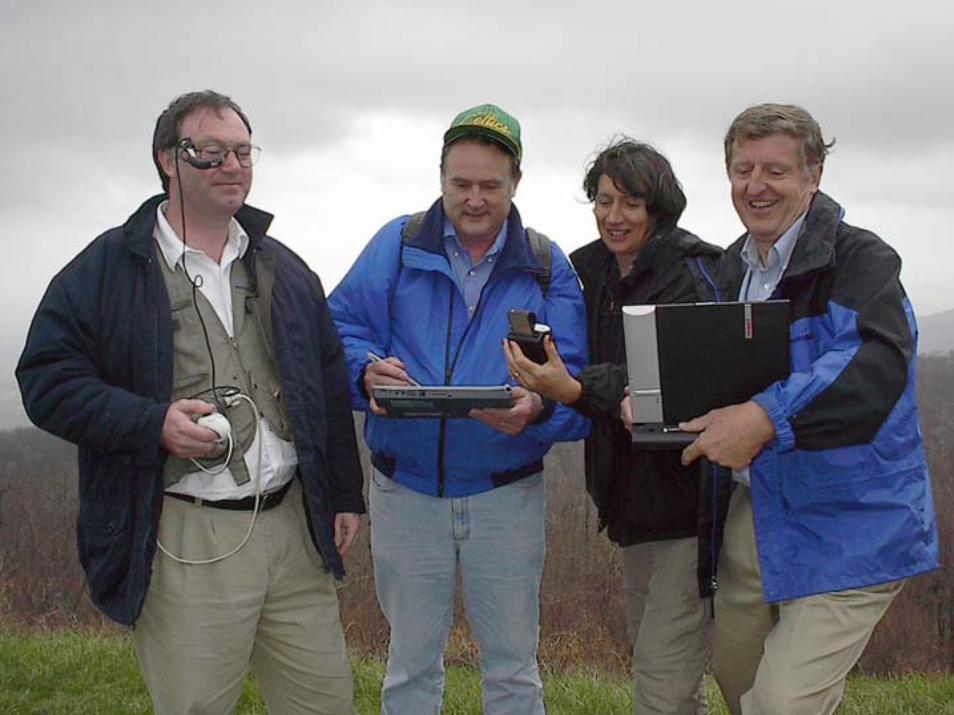
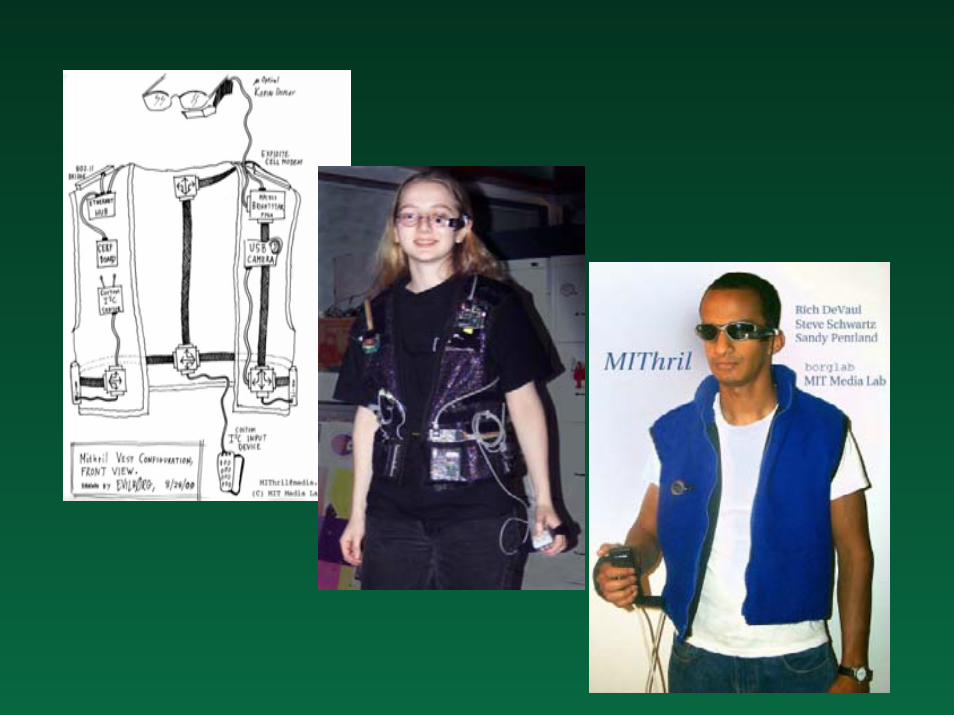
GIS in the fieldGIS in the field
Mobile, traveling with the userUbiquitous, operating anywhereAugmenting the senses with information from digital representations– of the past– of what is beyond the senses– of the future
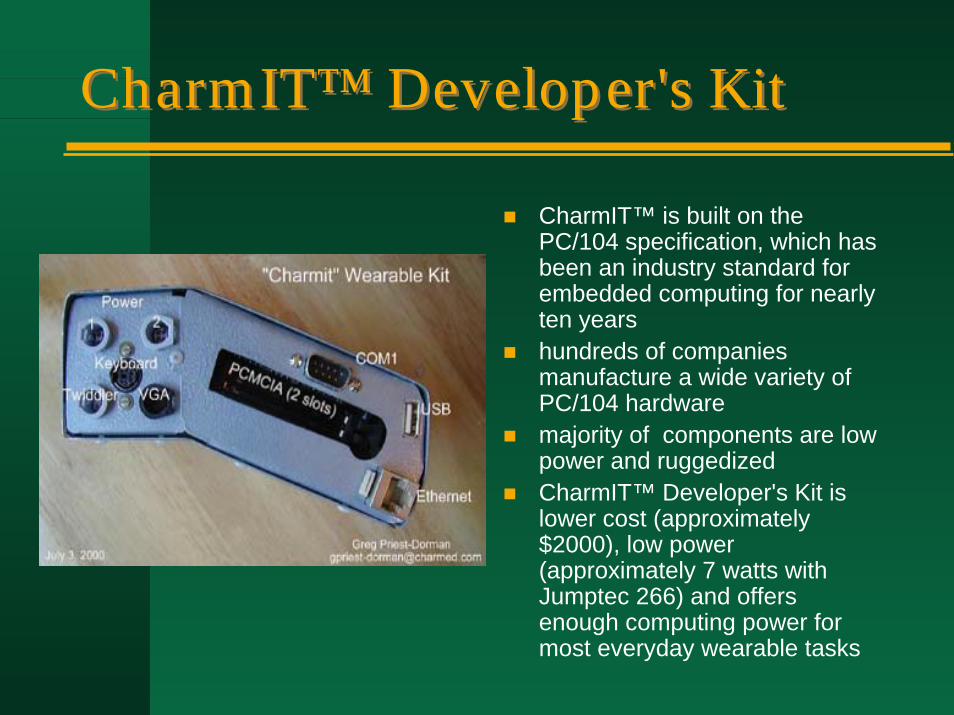
CharmIT™ Developer's KitCharmIT™ Developer's Kit
CharmIT™ is built on the PC/104 specification, which has been an industry standard for embedded computing for nearly ten yearshundreds of companies manufacture a wide variety of PC/104 hardwaremajority of components are low power and ruggedizedCharmIT™ Developer's Kit is lower cost (approximately $2000), low power (approximately 7 watts with Jumptec 266) and offers enough computing power for most everyday wearable tasks
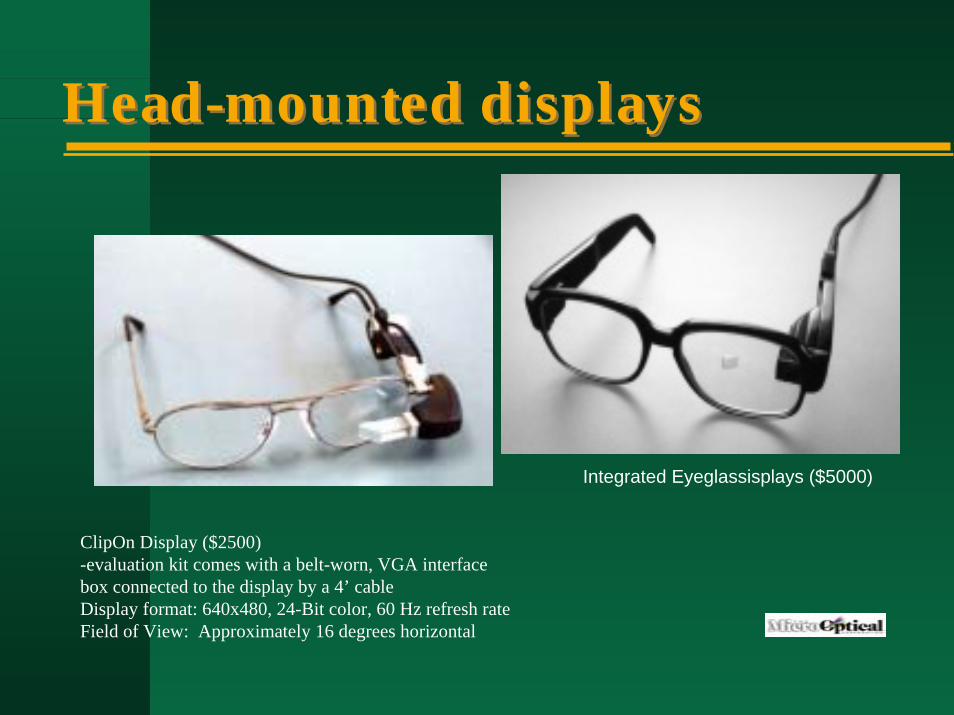
Head-mounted displaysHead-mounted displays
Integrated Eyeglassisplays ($5000)
ClipOn Display ($2500)-evaluation kit comes with a belt-worn, VGA interfacebox connected to the display by a 4’ cableDisplay format: 640x480, 24-Bit color, 60 Hz refresh rate Field of View: Approximately 16 degrees horizontal
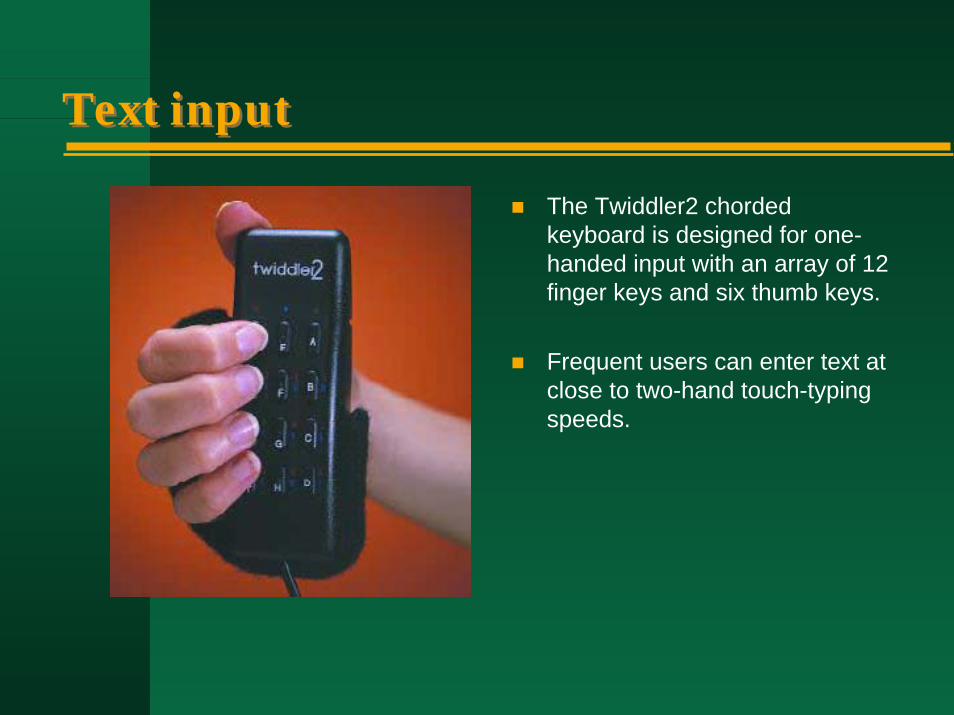
Text inputText input
The Twiddler2 chorded keyboard is designed for one-handed input with an array of 12 finger keys and six thumb keys.
Frequent users can enter text at close to two-hand touch-typing speeds.
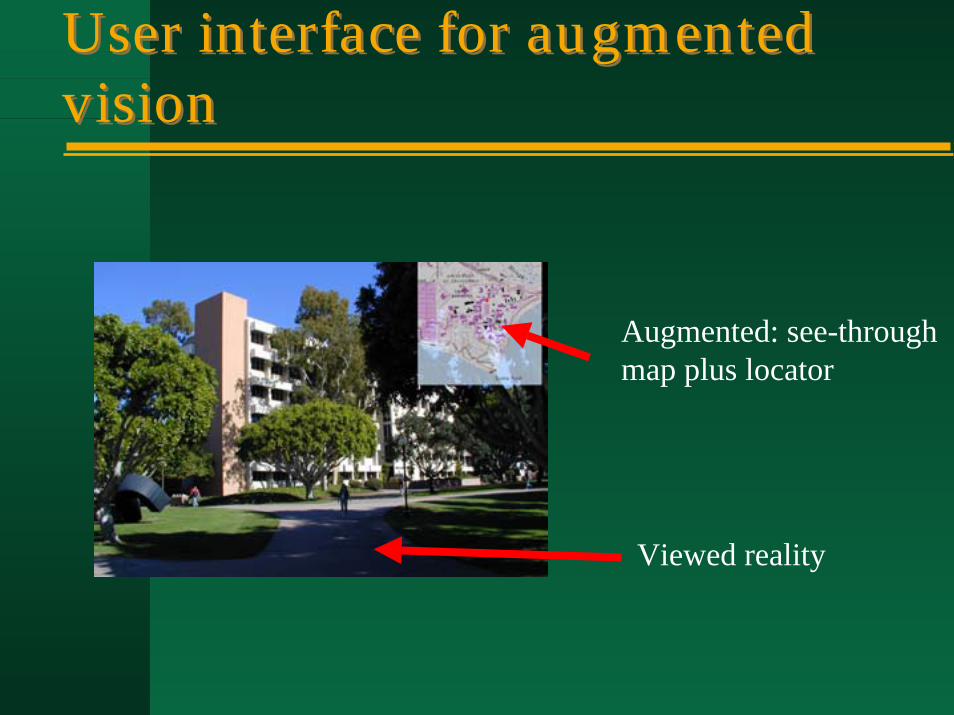
User interface for augmented visionUser interface for augmented vision
Augmented: see-throughmap plus locator
Viewed reality
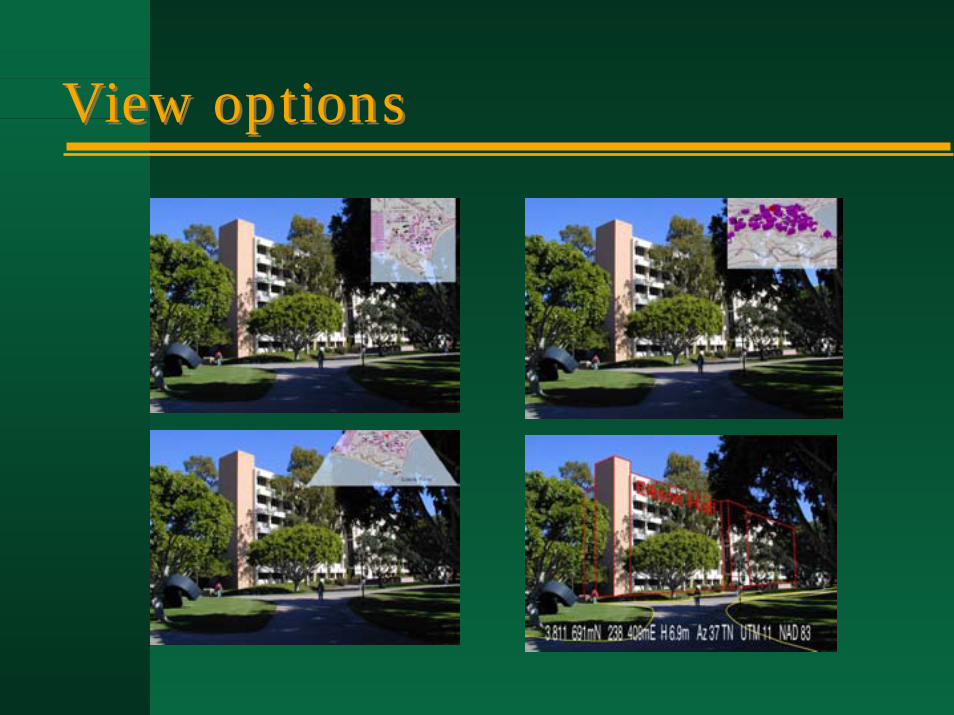
View optionsView options
Field-work applicationsField-work applications
Finding oneself in the field– recovering past sample locations
Accessing previously collected data– the previous census
Analyzing data continuously– progressive formation of geographic
knowledge

Location as attributeLocation as attribute
The data table– Census summary table– county-level health statistics
What value is location as an explanatory variable?Linking the table to a boundary file– enabling maps of summary data
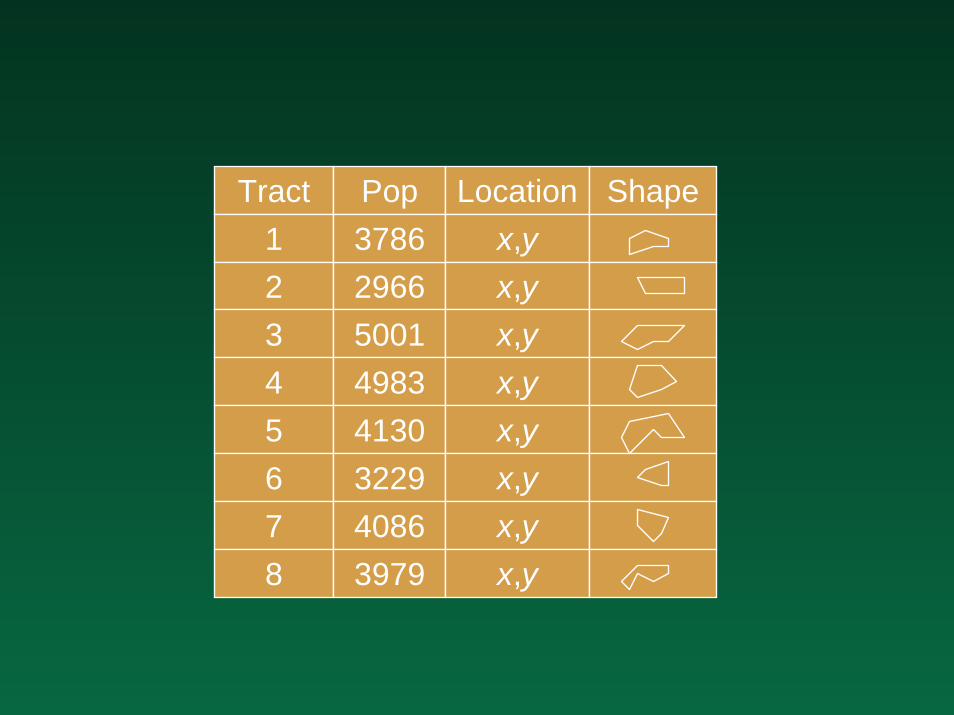
Tract12345678
Pop
2966500149834130322940863979
3786Location
x,yx,yx,yx,yx,yx,yx,yx,y
Shape
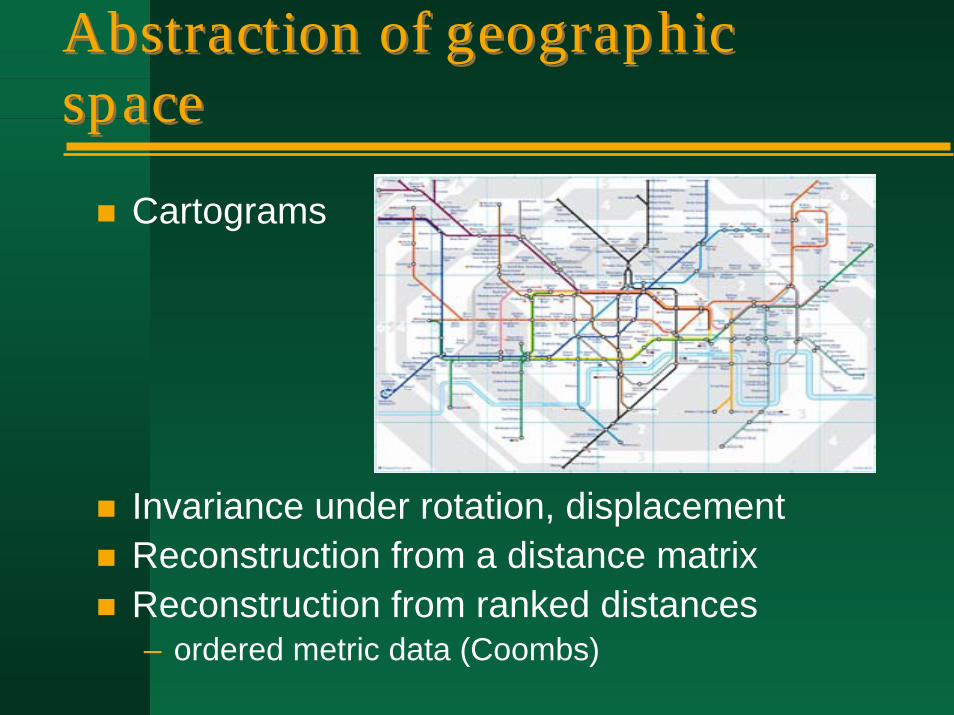
Abstraction of geographic spaceAbstraction of geographic space
Cartograms
Invariance under rotation, displacementReconstruction from a distance matrixReconstruction from ranked distances– ordered metric data (Coombs)
Space as a matrixSpace as a matrix
W where wij is some measure of interaction– adjacency– decreasing function of distance– invariant under rotation, displacement– readily obtained from a GIS
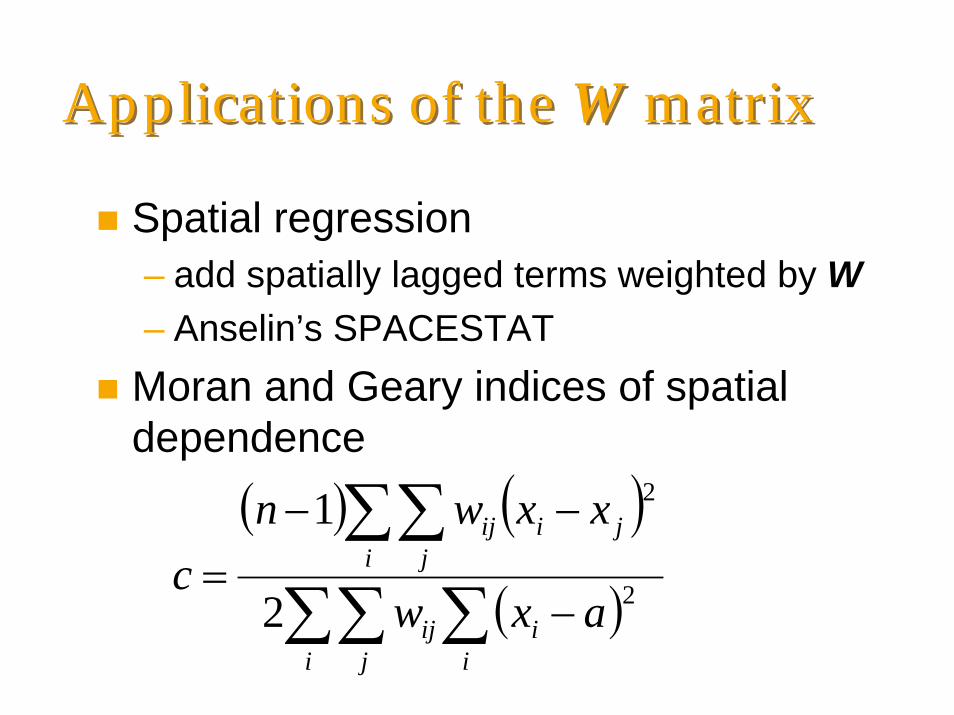
Applications of the W matrixApplications of the W matrix
Spatial regression– add spatially lagged terms weighted by W– Anselin’s SPACESTAT
Moran and Geary indices of spatial dependence
( ) ( )( )∑∑ ∑
∑∑−
−−=
i j iiij
i jjiij
axw
xxwnc 2
2
2
1
The location-as-attribute world viewThe location-as-attribute world view
Objective: scientific explanation, understanding of social processes– is location an explanatory factor?
Relative location as expressed in the Wmatrix– a surrogate for spatial interaction– reflecting costs of transport, probability of
interaction and acquaintance, probability of migration or travel, probability of seed dispersal
The Data Documentation InitiativeThe Data Documentation Initiative
A multinational multidisciplinary effortA standard for description of dataset contentsSocial science focusGeography working group– joint meeting August 02
Two world viewsTwo world views
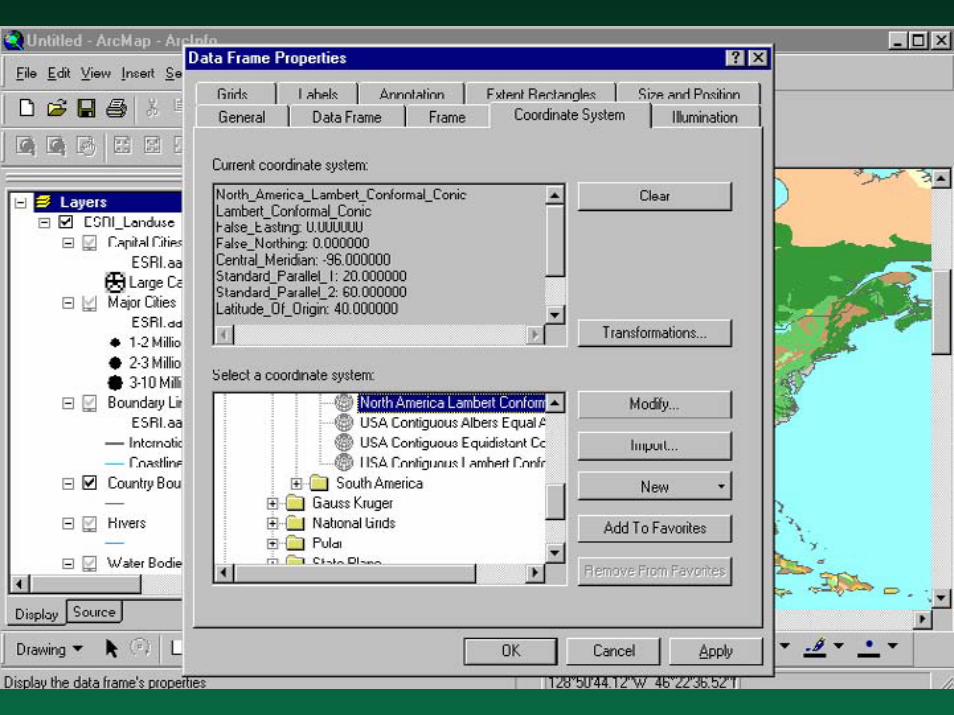
Location as continuum– the FGDC metadata standard– ISO 19115– attribute tables as part of GIS
Location as attribute– the DDI standard
Reinforced by technical GIS design– the hybrid model– attributes in an RDBMS– geometry in a specialized file structure– ARC/INFO
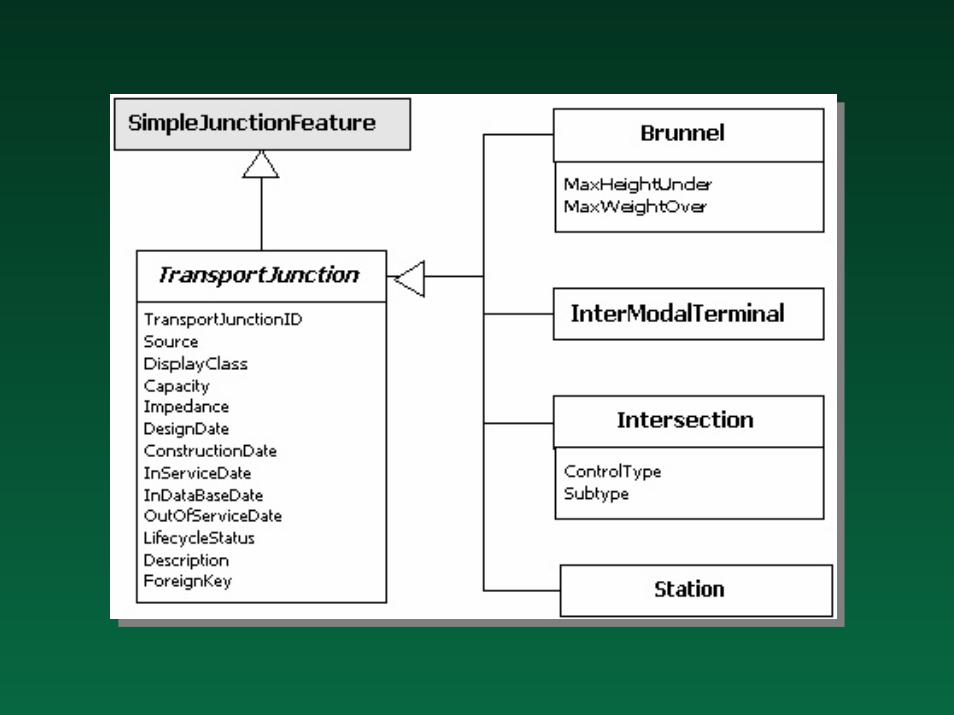
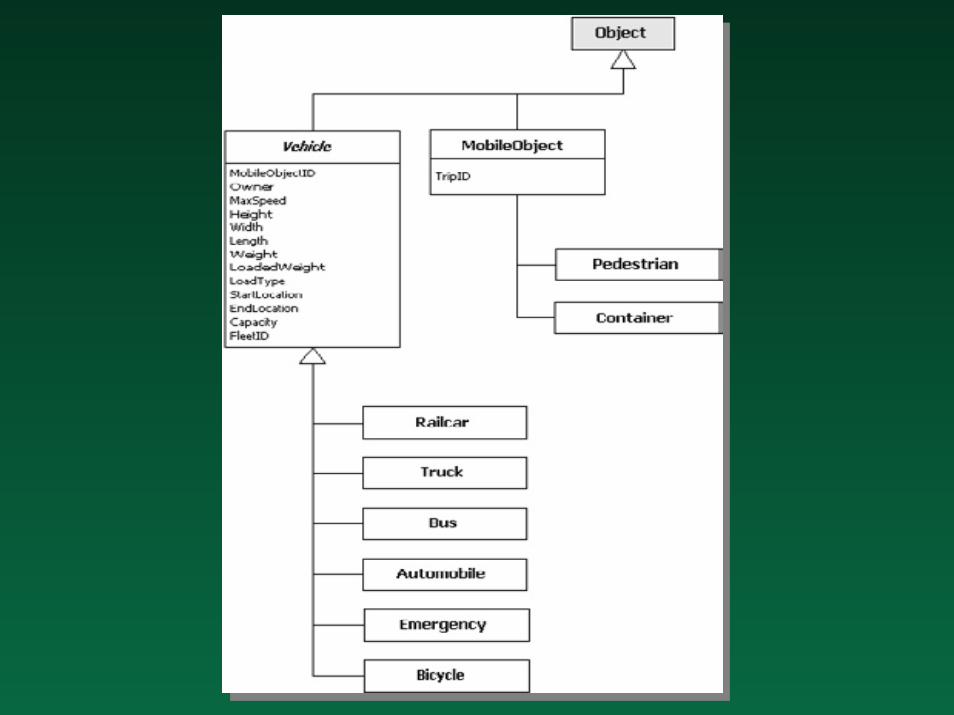
Object-oriented designObject-oriented design
Objects as instances of classesClasses inherit properties of more generalized classes (inheritance)Methods associated with classes (encapsulation)
Specialized GIS data modelsSpecialized GIS data models
The basic elements built into the GIS– points, lines, areas– the GIS mainstream
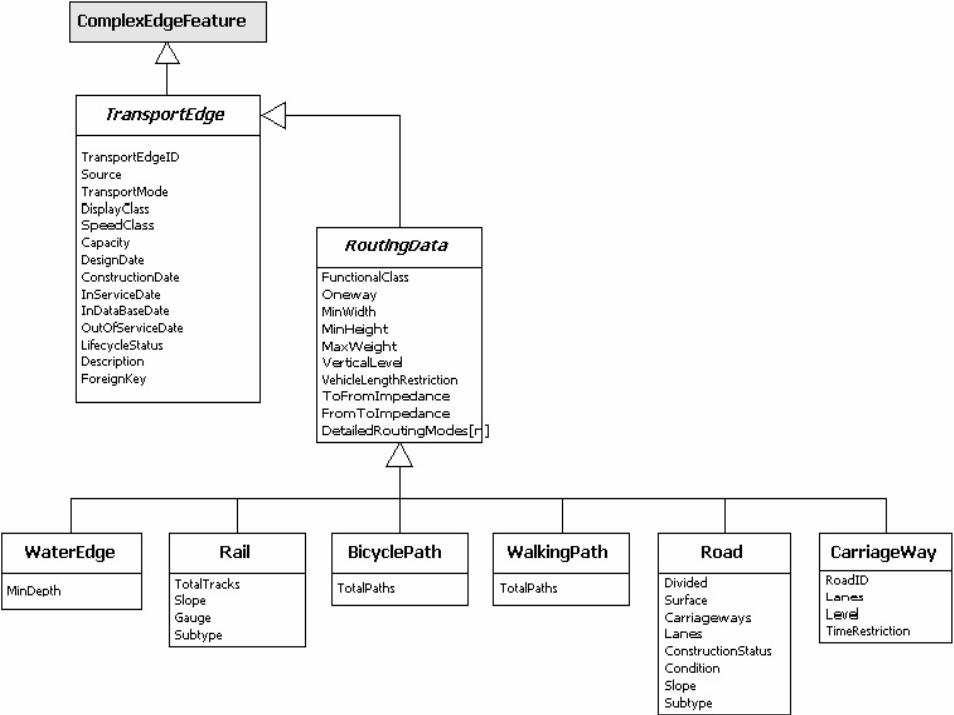
How these elements are specialized in application domains (vertical markets)– railroad track as a class of transportation
link– transportation link as a class of line
Unified Modeling LanguageUnified Modeling Language
Visual representation of a data model– conventional symbols– implemented in Visio
Creation of database layout– use CASE tools– build tables– populate tables with data
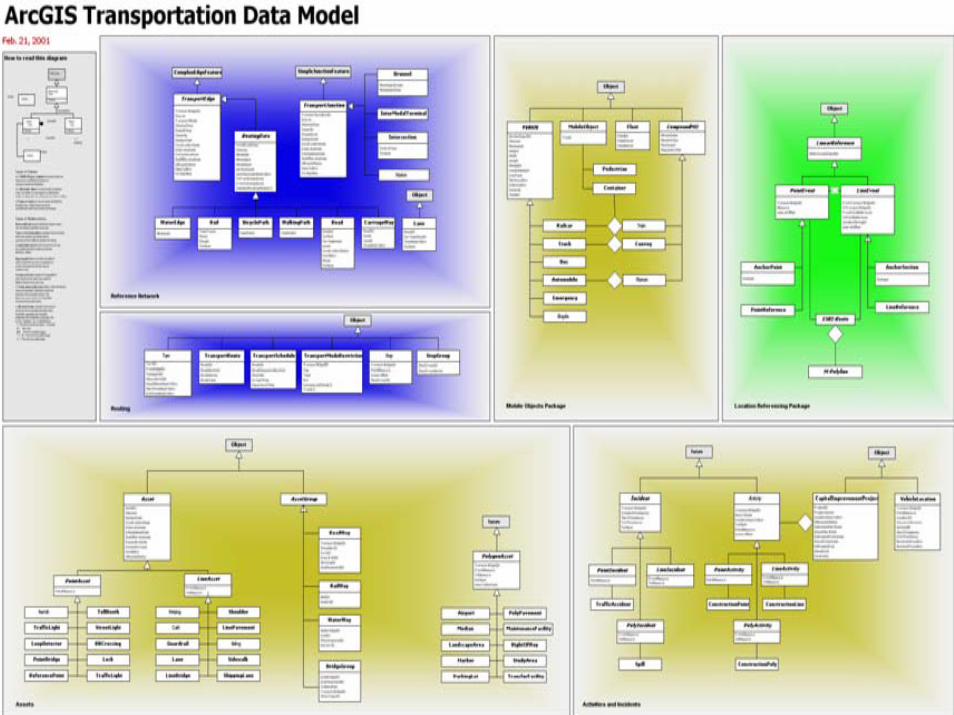
UNETRANSUNETRANS
Helping transportation users of ArcGISby providing a database framework that includes familiar elements– contains the core items– is easy to extend and specialize– add new attributes– add specialized classes
But what about metadata?But what about metadata?
At the class (table) level?At the database level?Granularity– an unresolved issue
A comprehensive view of informationA comprehensive view of information
To be sharable, information must be digitalMany types of information– maps, images– tables– text– methods– simulation models
What is the relative value per bit?– Windows XP >> a cloudy Ikonos image– academic paper >> survey data used
The infrastructure of information sharingThe infrastructure of information sharing
Metadata standardArchivesInteroperabilityTo date, almost exclusively about data– much less about methods
Towards an infrastructure for dynamic modelsTowards an infrastructure for dynamic models
Infrastructure for sharing– search– discovery– evaluation of fitness for use– acquisition– execution
Server-side or client-side execution
Falling through the cracksFalling through the cracks
Text-sharing infrastructure– libraries, bookstores, books, journals, WWW,
search enginesData-sharing infrastructure– metadata schema, archives, clearinghouses, data
centersModel-sharing infrastructure– models are the highest form of sharable
knowledge of the Earth system
Current statusCurrent status
Some archives– some pre-WWW
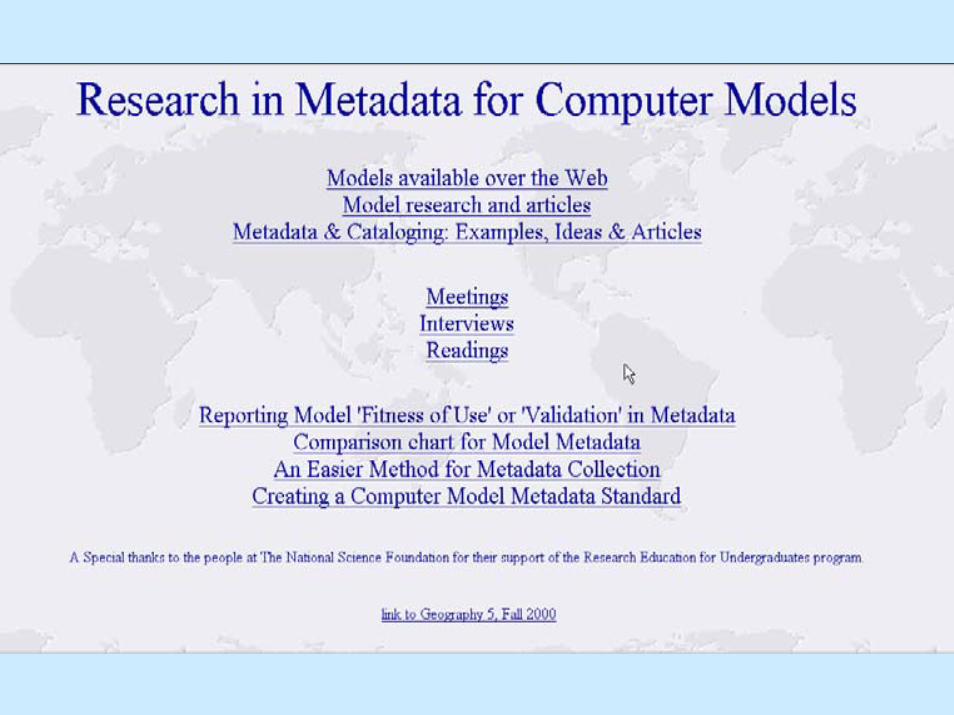
No standardsNo clearinghouseswww.ncgia.ucsb.edu/~scott
Building a metadata standard for describing modelsBuilding a metadata standard for describing models
A model is a transformation– characterized by metadata for inputs and
outputsWrite down the key elements– compare FGDC CSDGM
How do humans do it?– we’ve been doing it for decadesA first-draft standard
ConclusionsConclusions
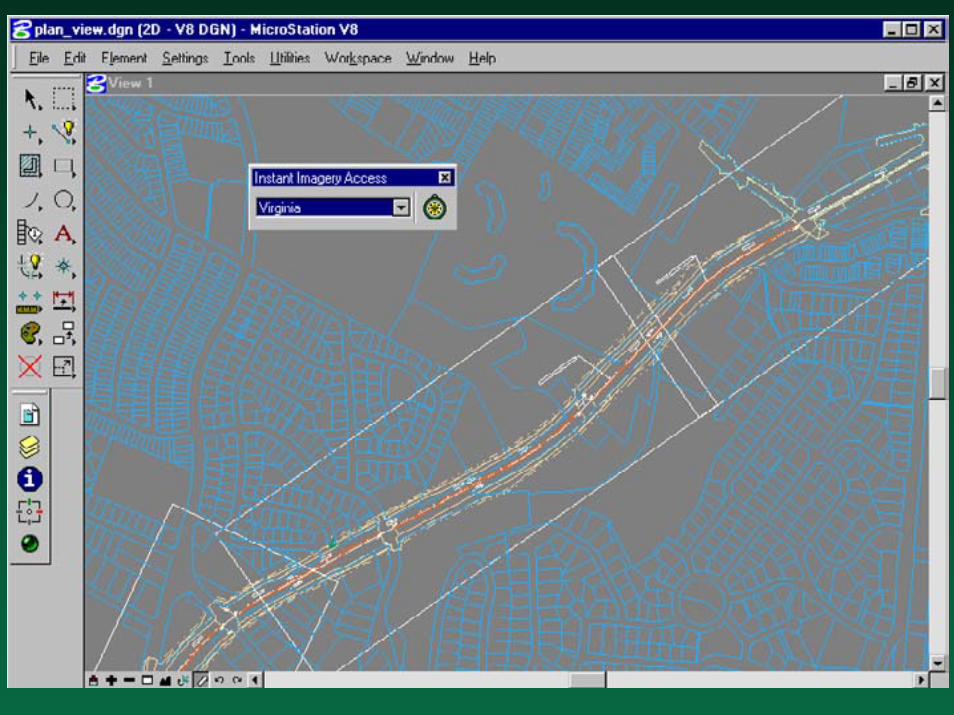
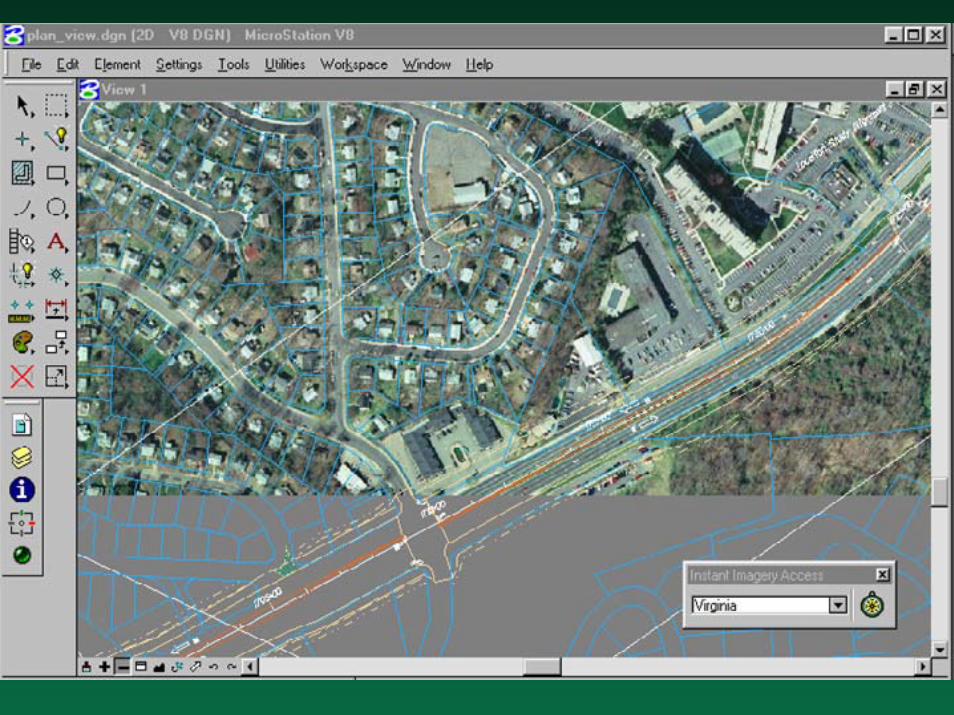
Instant geospatial data now feasible– access to distributed archives
CLM is a problem– only experts know where to look– the one-stop shop will not happen
Geohealth embodies two distinct world views– location as continuum– location as attribute
Effective sharing of data must somehow embrace both– perhaps through new data-modeling technologies
Conclusions (2)Conclusions (2)
Data may not be the most valuable type of information– other types may justify greater investment
in sharing infrastructure– a holistic approach to information sharing
is needed in geohealth