Embed Size (px)
Citation preview
Depression Anxiety Stress Scale: Is It Valid for Children andAdolescents?
Author
Patrick, Jeff, Dyck, Murray, Bramston, Paul
Published
2010
Journal Title
Journal of Clinical Psychology
DOI
https://doi.org/10.1002/jclp.20696
Copyright Statement
© 2010 British Psychological Society. Published by Wiley-Blackwell. This is the pre-peer-reviewed version of the following article: Depression anxiety stress scale (DASS): Is it validfor children and adolescents?, British Journal of Clinical Psychology (BJCP), Volume 66,Issue 9, pages 996–1007, September 2010, which has been published in final form at http://dx.doi.org/10.1002/jclp.20696
Downloaded from
http://hdl.handle.net/10072/35344
Griffith Research Online
https://research-repository.griffith.edu.au
DASS FOR CHILDREN AND ADOLESCENTS
1
Running Head: DASS FOR CHILDREN AND ADOLESCENTS
Depression anxiety stress scale (DASS): Is it valid for children and adolescents?
Jeff Patrick
University of Southern Queensland
Murray Dyck
Griffith University
Paul Bramston
University of Southern Queensland
Correspondence to:
Jeff Patrick, Psychology Department, University of Southern Queensland, Toowoomba,
Queensland, Australia, 4350
Tel: +61 7 4631 2898
Fax: +61 7 4631 2721
E-mail: [email protected]
DASS FOR CHILDREN AND ADOLESCENTS
2
Abstract
The Depression Anxiety Stress Scale (Lovibond & Lovibond, 1995) is used to assess the
severity of symptoms in child and adolescent samples although its validity in these
populations has not been demonstrated. We assessed the latent structure of the 21-item
version of the scale in samples of 425 and 285 children and adolescents on two occasions,
one year apart. On each occasion, parallel analyses suggested that only one component
should be extracted, indicating that the test does not differentiate depression, anxiety, and
stress in children and adolescents. The results provide additional evidence that adult
models of depression do not describe the experience of depression in children and
adolescents.
Keywords: Child and adolescent depression, Depression Anxiety Stress Scale, structure
of affect

DASS FOR CHILDREN AND ADOLESCENTS
3
The Depression Anxiety Stress Scale (DASS) and its short form (DASS-21;
Lovibond & Lovibond, 1995) were designed to maximize measurement of the distinct
features of depression, anxiety and stress, which typically co-occur in adults (Sanderson,
Ni Nado, Rapee & Barlow, 1990), and to minimize measurement of what these states
have in common. The original principal component analysis of DASS items revealed that
a stable three-factor solution of depression, anxiety and stress was the optimal fit
(Lovibond & Lovibond, 1995). Subsequent research has replicated the three-factor
solution in adult populations in both the complete test (Crawford & Henry, 2003) and in
the shorter version (Clara, Cox & Enns, 2001).
In commenting on the use of the DASS as a screening instrument, Lovibond and
Lovibond (1995) asserted that “given the necessary language proficiency, there seems no
compelling case against use of the scales for comparative purposes with children as
young as 12 years. It must be born in mind, however, that the lower age limit of the
development samples was 17 years” (p.3). Recent research has applied the self-report
version of the DASS to children and adolescents between the ages of 7 and 15 (Duffy,
Cunningham & Moore, 2005; Szabó & Lovibond, 2006; Szabó, 2009). Such use
presupposes that adult models and measures of the structure of affect and depression can
be applied to childhood and adolescence, despite evidence that they may not be suited to
the experience of depression by children and adolescents (Finch, Lipovsky & Casat,
1989).
Although there is good evidence that the criteria used to diagnose depression in
adults are no less valid when used with adolescents (Lewinsohn, Pettit, Joiner & Seeley,
2003), it is also true that the prominence of some depression symptoms varies across
DASS FOR CHILDREN AND ADOLESCENTS
4
development (e.g., Weiss & Weisz, 1988; Weiss et al., 1992) and, following puberty, the
prevalence of depression among females changes from being about the same as in males
to about twice that of males (Lewinsohn, Hops, Roberts, Seeley & Andrews, 1993;
Roberts, Lewinsohn & Seeley, 1995). And as Hammen and Compas (1994) noted, one
thing that distinguishes each developmental epoch is the extent to which depression is
comorbid with other disorders and with which other disorders it is comorbid. Among
other issues, Hammen and Compas pointed out that in childhood, depression typically co-
exists with anxiety or anger. Most evidence suggests that depression, anxiety and stress
are largely indistinguishable in children and adolescents (Cole, Truglio & Peeke, 1997;
Lahey, Applegate & Waldman, 2004), and some researchers have concluded that there is
no clear distinction between these states during childhood or adolescence (e.g., Finch,
Lipovsky & Casat, 1989). Among adolescents, in 8 out of 10 cases, depression co-occurs
with a significant anxiety and/or oppositional or severe disruptive behavior problem
(Herman, Ostrander, Walkup, Sylva & March, 2007; cf. Young, Mufson & Davies,
2006). Like children, adolescents who are depressed experience concomitant anxiety
and/or anger and it is not clear that these states can be readily distinguished from each
other.
Szabó and Lovibond (2006) failed to replicate the three-factor solution evident in
the DASS among adults using exploratory factor analysis with a sample of children and
adolescents aged 7 to 14 years old. Duffy, Cunningham and Moore (2005) also failed to
replicate the three-factor solution with the DASS-21 using confirmatory factor analysis in
their study of 216 adolescents aged between 11 and 15 years old. Intriguingly, Szabó
(2009) tested 8 different models ranging from 1 to 4 factors on data from adolescents
DASS FOR CHILDREN AND ADOLESCENTS
5
who completed both the DASS and DASS-21. All the models could be rationalized and
all had significant and nearly identical fit statistics. In the end, Szabó conceded that
correlations among the factors (however they were conceptualized) was “high”, which
renders their interpretability as distinct subscale scores mute. Ultimately, the exercise
failed to offer conclusive support for the superiority of any one model, and hence could
not resolve the issue of the how adolescent affect is structured. For the moment, there is
no compelling evidence that interpreting subscale scores for the DASS or DASS-21 is
valid for children or adolescents.
Another issue is how the latent structure of the DASS and other symptom scales
should be assessed in children/adolescents. Antony, Bieling, Cox, Enns and Swinson
(1998) used exploratory principal components analyses in their study of adults, as did
Brown, Chorpita, Korotitsch and Barlow (1997), but in both cases, the researchers relied
on a combination of a scree test and the eigenvalue>1 rule to decide how many principal
components to extract. The eigenvalue>1 rule typically overestimates the number of
factors to extract and the reliability of the scree test is low (O‟Connor, 2000).
Lovibond and Lovibond (1995) used a confirmatory factor analysis in their
original study of the DASS, and it has become standard procedure to use confirmatory
factor analyses to assess the goodness of fit of different structural models. However, in
practice this procedure has not been useful (Cliff, 1983; Breckler, 1990; Tomarken &
Waller, 2003, 2005). The rationale for using confirmatory analyses is that they facilitate
the testing of specific hypotheses, but the typical finding is that two or more different
models provide equally good (or poor) fits to the data (e.g., Chorpita, 2002; Lonigan,
Carey & Finch, 2003; Turner & Barrett, 2003). Where only one structural model is
DASS FOR CHILDREN AND ADOLESCENTS
6
assessed (as is often the case), and the fit statistics of this model are considered adequate,
no further (and potentially better-fitting) model is assessed. This over-reliance on fit
ignores the limitations of the underlying methodology, which have been pointed out
repeatedly (e.g., Breckler, 1990; Cliff, 1983; Tomarken & Waller, 2003; 2005). To be
more precise, confirmatory factor analysis is constrained to the proposed model, to which
a binary question (good fit, poor fit) is posed. This approach is akin to trying to
understand someone you have just met by exclusively asking closed questions.
Understanding will eventually come, but its progress is slowed, and at times biased by the
closed questions one poses.
One solution to these problems would be to test the fit of multiple plausible
models – although this could be construed as using Confirmatory Factor Analysis in an
exploratory way. This practice was evident in the work of Szabó (2009) who, as already
noted, tested 8 different models and failed to find clear support for one model over
another. A better approach would be to use an unconstrained analysis to identify the best
possible structural model. Exploratory principal components analysis, where total
variance is analysed and the model is not constrained (so as not to manufacture the result)
offers more compelling evidence about the latent structure of the DASS for this
population if the model can be replicated. Rather than use the scree test or other
unreliable procedures, this approach would involve parallel analysis to more reliably
determine the number of components to extract (Fabrigar, Wegener, MacCallum &
Strahan, 1999; O‟Connor, 2000). According to Gorsuch (2003, p. 157), “simulation
studies have found parallel analysis to be a prime candidate for the best procedure for
estimating the number of exploratory factors.” Parallel analyses involve the analysis of
DASS FOR CHILDREN AND ADOLESCENTS
7
sets of random data of the same order (number of variables and participants) to specify
the magnitude of eigenvalues that reflect random „sources‟ of shared variation. In the real
analyses, only eigenvalues that exceed the 95th
percentile of eigenvalues yielded by
random data are extracted and rotated. The validity of the latent structure is then
established by means of unconstrained replication, either by means of splitting one‟s
sample or with an independent sample (Gorsuch, 2003).
The aim of this study was to assess the latent structure of the DASS-21 with a
child/adolescent sample, and in particular to assess whether the scale measures three
distinct constructs, namely, depression, anxiety and stress. In order to test whether the
observed structure is replicable, a longitudinal design was used to assess whether the
structure was stable across a one-year period.
Method
Participants and Procedure
A community sample of 425 students, stratified for age (the overall average was
13.2 years) and sex (male=48.4%, female=51.6%), was recruited from eight schools in
rural/remote southwest Queensland after the research protocol had received ethical
approval and the permission of Education authorities (see Table 1). Four age groups were
sampled: ages 11 (n=105), 12 (n=153), 15 (n=110) and 17 years (n=57). In terms of
socioeconomic status, 71% of the sample came from families with household incomes
above the Australian average, although few earned more then twice the average. In 32.4%
of families, one or both parents had a trade certificate or diploma, and in 19.4% of
families, one or both parents had a university degree. Ethnicity was not recorded, but in
this region, the overwhelming majority of residents is of European origin, with about
DASS FOR CHILDREN AND ADOLESCENTS
8
1.67% of persons being of Asian descent, about 0.26% of persons being of South Pacific
Islander descent, and about 0.23% being of Aboriginal or Torres Strait Islander descent
(Australian Bureau of Statistics, 2008).
INSERT TABLE 1 ABOUT HERE
Students were followed-up approximately one year later. A 33% attrition rate
eroded the sample to 285 participants at Time 2. Students who did not participate at
follow-up did not differ significantly from students who did participate on any Time 1
measure. Of eligible students who could be located (n=401), the parents of 18% did not
give consent, 1% themselves refused to participate, 3% were not able to complete the
study due to poor reading skills or inattention, 2% did not complete for other reasons, and
5% were students with special learning needs who were excluded from the study. The
DASS-21 was administered during class time.
Measures
There are two versions of the DASS – the 42-item version and the 21-item short
form (Lovibond & Lovibond, 1995). Antony et al. (1998) reported that the 21-item
version has a more cohesive and replicable structure than the 42-item version. For this
reason, together with the fact that the short form is more widely used in clinical practice,
we chose the short form for this study. The DASS-21 is a set of 21 statements designed to
assess depression, anxiety, and stress by getting participants to rate how well each
statement describes them. The rating is along a five-point Likert scale in each case. The
DASS-21 has been shown to have excellent psychometric qualities for adults (Antony et
al., 1998; Daza, Novy & Stanley, 2002; de Beurs, Van Dyck & Marquenie, 2001). The
internal consistency of each of the subscales is high (Depression =.97, Anxiety =.92,
DASS FOR CHILDREN AND ADOLESCENTS
9
Stress =.95; Antony et al., 1998). The DASS-21 also demonstrates strong convergent
validity with other measures of depression (e.g., Beck Depression Inventory; r=.79) and
anxiety (e.g., Beck Anxiety Inventory; r=.85) and stress (e.g., State-Trait Anxiety
Inventory-Trait; r=.68; Antony et al.). Antony et al. observed that differences among
clinical samples were consistent with expectation (e.g., depression scores highest in the
major depression sample, all scores relatively low in a specific phobia sample), as were
differences between clinical and non-clinical samples, with average scores in the non-
clinical sample of adults appropriately low (depression mean=2.12, SD=3.64, mean=1.22,
SD=1.77, and stress mean=3.51, SD=3.78).
Results
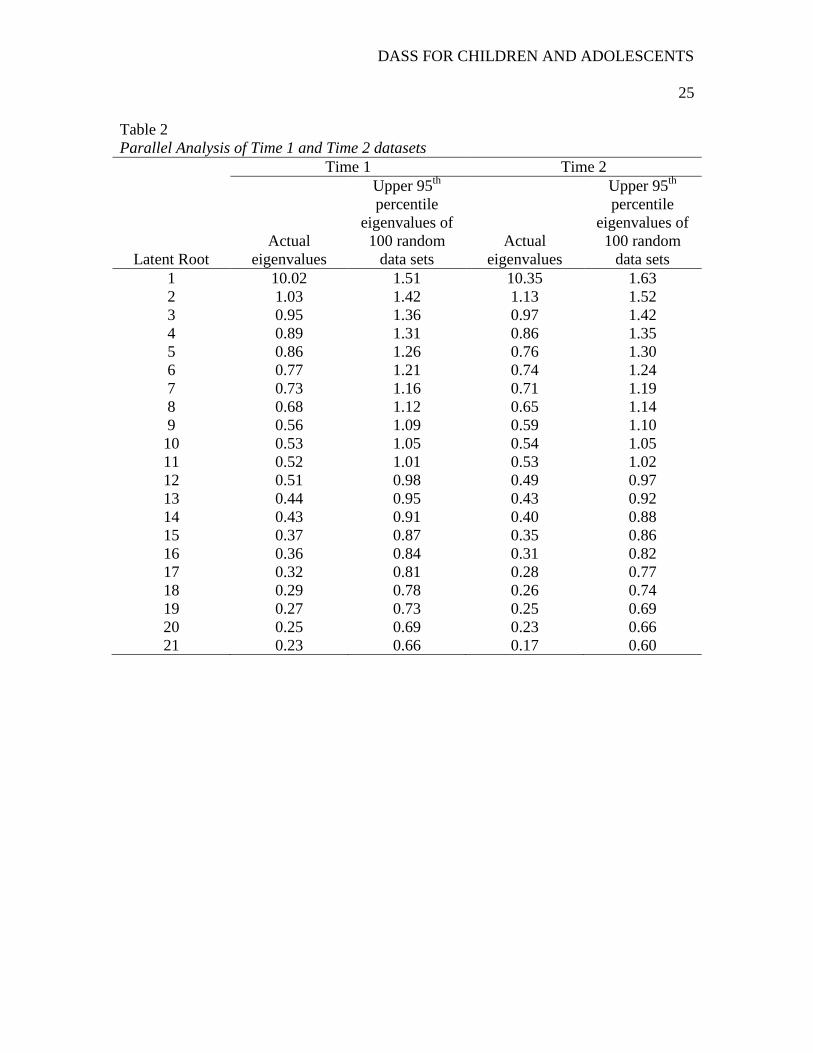
Two sets of analyses were conducted to assess the latent structure of the DASS-
21, the first in the initial sample (Time 1: n=425) and the second in the retest sample
(Time 2: n=285). In each sample, the Kaiser-Meyer-Olkin statistic indicated that the
matrix had definite latent structure (KMO=.95 at Time 1 and KMO=.95 at Time 2).
Parallel analysis was used to determine the number of principal components to extract
(Gorsuch, 2003). In each case, parallel analysis (O‟Connor, 2000) indicated that there
was only one component with an eigenvalue above the 95th
percentile of eigenvalues of
100 random datasets of the same dimensions (see Table 2). For this reason, only one
component was extracted for each matrix. These principal components accounted for
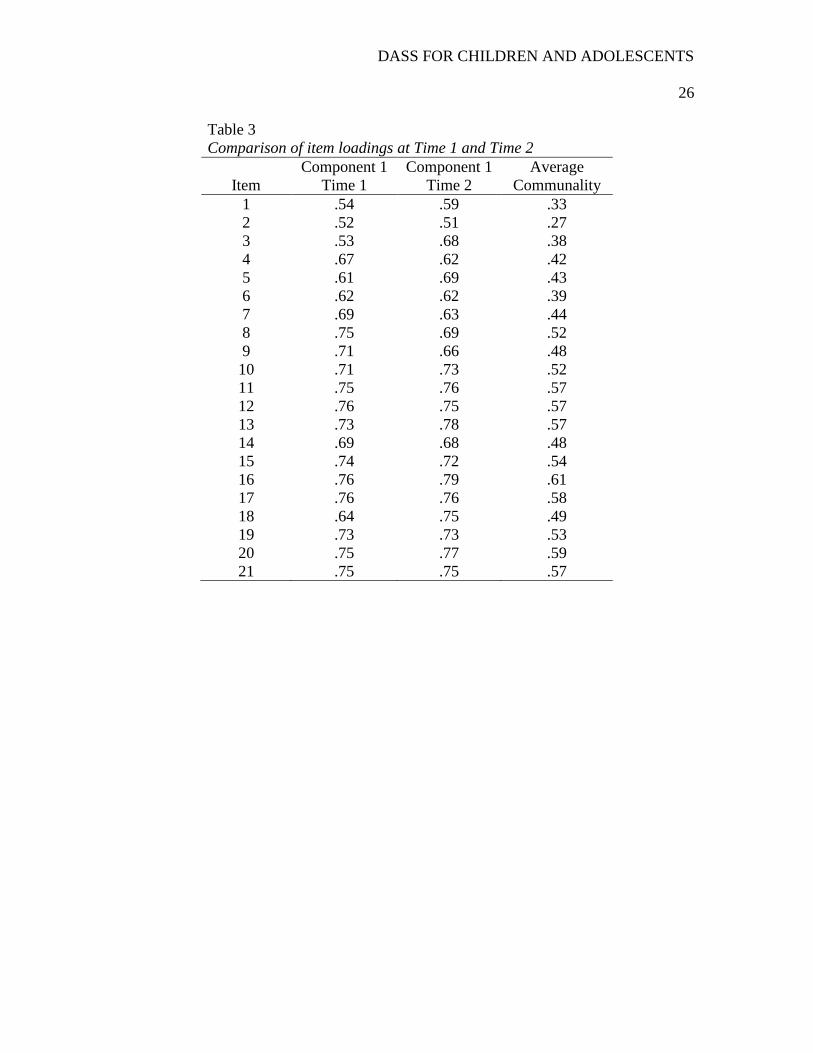
47.7% of total variance at Time 1 and 49.3% of total variance at Time 2. Item loadings
and communalities are presented in Table 3.
INSERT TABLE 2 AND TABLE 3 ABOUT HERE
DASS FOR CHILDREN AND ADOLESCENTS
10
Table 3 shows that the item loading pattern at Time 2 closely resembles what was
observed at Time 1: the two structures are nearly identical. In both cases, all items have
substantial loadings on the component, and the communalities reveal that the component
accounts for between 27% and 61% of the variance of each item.
By way of confirming these unidimensional results, we also conducted Velicer‟s
Minimum Average Partial (MAP) Test. This procedure assesses the fit of all possible
component solutions (k-1) as well as a zero component solution. In each case, the
principal component is partialed out of the correlations between the variables, and the
average squared coefficient in the off-diagonals of the resulting partial correlation
matrices is computed (O'Connor, 2000). The solution with the lowest average squared
correlation represents the optimal representation of the systematic variance (the best fit).
In this case, the MAP test showed that Velicer's Average Squared Correlation (ASC) for
both datasets was lowest with a one-component solution (ASC=.066 and ASC=.066,
respectively). By way of bolstering these results with the more commonly used
confirmatory factor analysis, we conducted one-factor, two-factor, and three-factor
solutions. The Root Mean Square Error of Approximation (RMSEA) was .02, .14, and
.17 respectively, again suggesting that that a one-factor solution is the most defensible
interpretation.
We then used Time 1 data to conduct additional parallel analyses to assess
whether the same structure is evident in each of the child (ages 11 and 12 years) and
adolescent (ages 15 and 17 years) samples, and in each of the male and female samples.
In each case, the results indicated that only the first eigenvalue exceeded the 95th
percentile of eigenvalues of 100 random data sets of the same dimensions. For the child
DASS FOR CHILDREN AND ADOLESCENTS
11
sample, the first three observed eigenvalues were 1=11.01; 2=1.05; 3=0.95 and those
derived from random datasets were 1=1.78; 2=1.64; 3=1.54. The values for the other
samples were as follows: adolescents (observed: ( 1=8.43; 2=1.73; 3=1.19; random:
1=2.03; 2=1.83; 3=1.67); females (observed: ( 1=10.18; 2=1.30; 3=1.03; random:
1=1.87; 2=1.72; 3=1.58); and males (observed: ( 1=10.52; 2=1.31; 3=1.04; random:
1=1.94; 2=1.72; 3=1.59).
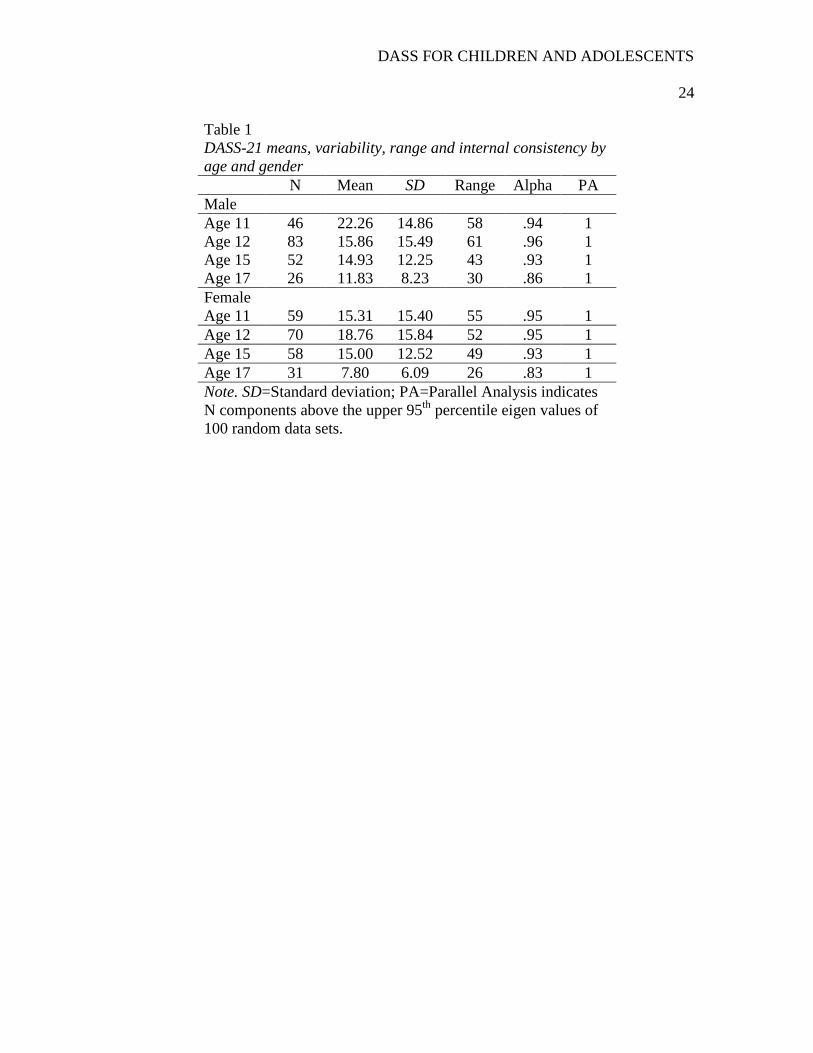
Table 1 indicates the average scores by age and gender of the total DASS score.
Table 1 also indicates that the same unidimensional structure was evident for all age
groups. The internal reliability of the total DASS score was high ( >.80) in each age and
gender cohort, with no improvement afforded by any item removal. Table 1 also indicates
some variability in average scores among boys and girls, and among age groups. In order
to test the meaningfulness of this we conducted a 2x4 ANOVA (gender by age group)
with the DASS-21 score as the dependent variable. There was no significant difference
for gender (p>.05), nor was there a significant interaction between age and gender
(p>.05). There was a significant effect for age (F(3,279)=3.71,p<.05). Post hoc analysis
(Tukey‟s HSD) revealed that the 17 year olds had lower DASS-21 scores than the other
age groups. There is a possibility that this effect is an artefact of the violation of the
assumption of homogeneity of variance (Levene‟s F(7,279)=4.43,p<.05). The 17 year
olds had noticeably less variability in their scores than the other age groups, so this effect
may be nothing more than a Type I error. If the effect is real, then it is a statistically small
effect (2=.04).
DASS FOR CHILDREN AND ADOLESCENTS
12
Discussion
The DASS-21 is a widely used scale that clearly distinguishes depression,
anxiety and stress in adults (Henry & Crawford, 2005). Our results suggest that the
test does not measure three distinct emotion dimensions in children or adolescents,
and suggest that „downsizing‟ adult theoretical constructs to childhood or
adolescence is not a good idea (Hammen & Compas, 1994; Vasey & Dadds, 2000).
Our results imply a fundamental change in the structure of affect from adolescence
to adulthood and mean that we need to question whether and how the DASS-21
should be used with children and adolescents.
As a counter-point, this research falls short of identifying exactly when this
change occurs, or explaining how or why it occurs. There is also no certainty that
these results would apply to other demographic groups or to the interpretation of
other similar measures (most obviously the DASS-42). Only independent
replication and sequential variation in demographic samples could achieve this. Nor
are these results a fundamental challenge to the content or criteria validity of the
DASS, merely a caution to its construct interpretation for children and adolescents.
In order to clarify whether our finding of a consistent unidimensional structure in
our data is due to our use of parallel analysis to identify how many principal components
to extract, we conducted parallel analyses of adult data in the two cases where
eigenvalues have been published (Antony et al., 1998; Brown et al., 1997) and in the one
case of adolescent data (Duffy et al., 2005). In order to conduct this procedure, all one
needs to know are the eigenvalues reported by the original author, the number of
variables being structurally analysed (either 42 or 21 items depending on the
DASS FOR CHILDREN AND ADOLESCENTS
13
questionnaire used), and the number of participants in the original study. With these key
features one can generate multiple random datasets of the same dimensions as the
original in order to conduct post-hoc parallel analyses. Brown et al. had administered the
DASS to a sample of 437 patients presenting for assessment and treatment at an anxiety
disorders clinic. In their principal components analysis, they extracted three components
( 1=16.46; 2=3.96; 3=2.53) based on a scree test and the eigenvalue>1 rule. The results
of our parallel analysis indicate that each of these eigenvalues exceeds the 95th
percentile
of the first three eigenvalues of 1000 random datasets of the same dimensions ( 1=1.71;
2=1.62; 3=1.56), indicating that the extraction of these three components was
appropriate. Because Brown et al. only reported the eigenvalues of the three components
that were extracted, we cannot judge whether the results of parallel analysis would have
suggested the extraction of more than three components.
Antony et al. (1998) administered the DASS to a sample of 258 outpatients with
DSM-III-R diagnoses of an anxiety or mood disorder and conducted separate principal
component analyses for both the 42-item and the 21-item versions of the test. Based on a
scree test and the eigenvalue>1 rule, Antony et al. extracted three components in each
analysis. In the 42-item analysis, the three eigenvalues ( 1=28.92; 2=4.24; 3=2.06) all
exceed the 95th
percentile of the first three eigenvalues of 1000 random datasets of the
same dimensions ( 1=1.96; 2=1.83; 3=1.75). However, in the 21-item analysis, only the
first two eigenvalues ( 1=9.07; 2=2.89; 3=1.23) achieved the criterion value ( 1=1.63;
2=1.52; 3=1.43). Based on these results, the extraction of three (or more) components
was appropriate for the 42-item scale, but only two components should have been
extracted for the 21-item scale.
DASS FOR CHILDREN AND ADOLESCENTS
14
Duffy et al. (2005) administered the DASS-21 to a sample of 216
adolescents, but because they conducted a confirmatory factor analysis, they did not
report eigenvalues. However, at our request, one of the authors conducted a factor
analysis of the data and shared the results with us (E. Cunningham, personal
communication, 27 August 2007). These results show that only the first eigenvalue
( 1=6.90; 2=1.46; 3=1.30) exceeded the 95th
percentile of eigenvalues derived
from random data ( 1=1.76; 2=1.59; 3=1.48), indicating that only one factor
should have been extracted from the scale. It could be that the parallel analysis was
underestimating, and hence producing this result for both independent adolescent
data sets, except it seems unlikely given that parallel analysis yielded the same
number of factors as confirmatory procedures with adult clinical and non-clinical
samples. The difference between Duffy et al‟s 2-factor solution, and our 1-
component solution is therefore more likely due to the confirmatory procedure
offering an adequate, but not an ideal fit.
What is clear from these results is that the difference in the structure of
affect between adults and children or adolescents does not appear to be a function of
our use of parallel analysis to decide how many principal components to extract.
Our parallel analyses of previously reported adult data supported the extraction of
three principal components in the two studies of the DASS (Antony et al., 1998;
Brown et al., 1997) and the extraction of two principal components in the one study
of the DASS-21 (Antony et al.). Similarly, our parallel analysis of the results of an
exploratory analysis of adolescent DASS-21 data (Duffy et al., 2005) was consistent
with our results in supporting the extraction of only one component. Parallel
DASS FOR CHILDREN AND ADOLESCENTS
15
analysis consistently results in the extraction of one component in child and
adolescent or adolescent data and in the extraction of three (or two) components in
adult data.
However, it has been shown that parallel analysis can underestimate the
number of real sources of common variation, especially when sample size is small
(n=100) and the real structure of the correlation matrix is complex (e.g., Turner,
1998). Turner recommended that researchers use a number of tests, in addition to
parallel analysis, to determine how many components to extract. Had we used scree
tests, the result would have been the same in each analysis. More importantly, we
relied on replication across time and across samples (i.e., the Duffy et al., 2005,
dataset) to show that a unidimensional structure is consistently obtained. The
findings of Duffy et al., based on confirmatory factor analysis, illustrate how
difficult it is to impose a multidimensional structure onto DASS-21 adolescent data.
When testing a 3-factor structure, not only were their fit statistics poor, “the
magnitude of the correlations between the factors anxiety and stress (r=.91;
s.e.=.05), anxiety and depression (r=.90; s.e.=.05) and stress and depression (r=.95;
s.e.=.06) revealed that the factors were not empirically distinguishable” (Duffy et
al., p. 679). They were only able to force an interpretable 2-factor solution with
reasonable fit statistics by eliminating an item, correlating the error terms of two
other items, and contrasting a small set (n=4) of physiological arousal items with all
other items (n=16), which still resulted in a factor intercorrelation of 0.71.
The fact that dividing our sample into older and younger groups yielded no
difference in result provides a hint as to the stage in development when the structure
DASS FOR CHILDREN AND ADOLESCENTS
16
of affect becomes differentiated. Most research on the structure of affect has been
conducted using undergraduate samples aged in their early 20s (e.g., Watson &
Walker, 1996; Watson, Clark et al., 1995; Watson, Weber et al., 1995), and so it is
clear that the adult structure has emerged by early adulthood. Based on our results,
we can now anticipate that the change occurs during late adolescence. However, we
are not aware of any theory that can account for such marked differentiation in the
structure of affect between middle adolescence and early adulthood.
Our results provide additional evidence that the experience of depression in
childhood and adolescence is more closely bound to other negative affects than is
true of adult samples. When a self-report scale like the DASS-21 is used with
children and adolescents, it is not measuring three discriminable emotion
dimensions as it does in adults. Rather, it appears to be measuring a single distress
dimension and, in the absence of other information, it cannot be clear that this single
dimension is more closely related to depression, to anxiety, or to general distress, or
even that it is possible to draw distinctions between these states. It may be the case
that when a child or adolescent has been diagnosed with one or more specific
anxiety, mood, or other disorder, the DASS-21 is a useful index of the severity of a
mixed affective and/or oppositional/disruptive behavior disorder (Herman et al.,
2007) which has symptoms of anxiety or depression as a core feature. That,
however, will also need to be the subject of future research.
DASS FOR CHILDREN AND ADOLESCENTS
17
References
Antony, M. M., Bieling, P. J., Cox, B. J., Enns, M. W. & Swinson, R. E. (1998).
Psychometric properties of the 42-item and 21-item versions of the Depression
Anxiety Stress Scales in clinical groups and a community sample. Psychological
Assessment, 10, 176-181.
Australian Bureau of Statistics (2008). 2006 census community profile series:
Toowoomba (Statistical Subdivision)]. Retrieved May 17, 2009 from
http://www.censusdata.abs.gov.au/ABSNavigation/prenav/ViewData?&action=40
4&documentproductno=LGA36900&documenttype=Details&tabname=Details&a
reacode=LGA36900&issue=2006&producttype=Community%20Profiles&&prod
ucttype=Community%20Profiles&javascript=true&textversion=false&navmapdis
played=true&breadcrumb=PLD&&collection=Census&period=2006&producttyp
e=Community%20Profiles&#Basic%20Community%20Profile.
Breckler, S. (1990). Applications of covariance structure modeling in psychology: Cause
for concern? Psychological Bulletin, 107, 260-273.
Brown, T., Chorpita, B., Korotitsch, W. & Barlow, D. (1997). Psychometric properties of
the Depression Anxiety Stress Scales (DASS) in clinical samples. Behaviour
Research & Therapy, 35, 79-89.
Chorpita, B. F. (2002). The tripartite model and dimensions of anxiety and depression:
An examination of structure in a large school sample. Journal of Abnormal Child
Psychology, 30, 177-190.
DASS FOR CHILDREN AND ADOLESCENTS
18
Clara, I. P., Cox, B. J. & Enns, M. W. (2001). Confirmatory factor analysis of the
Depression–Anxiety–Stress Scales in depressed and anxious patients. Journal of
Psychopathology & Behavioral Assessment, 23, 61-67.
Cliff, N. (1983). Some cautions concerning the application of causal modelling methods.
Multivariate Behavioral Research, 18, 115-126.
Cole, D. A., Truglio, R. & Peeke, L. (1997). Relation between symptoms of anxiety and
depression in children: A multitrait-multimethod-multigroup assessment. Journal
of Consulting & Clinical Psychology, 65, 110-119.
Crawford, J. R. & Henry, J. D. (2003). The Depression Anxiety Stress Scales (DASS):
Normative data and latent structure in a large non-clinical sample. British Journal
of Clinical Psychology, 42, 111–131.
Daza, P., Novy, D., Stanley, M. & Averill, P. (2002). The Depression Anxiety Stress
Scale-21: Spanish translation and validation with a Hispanic sample. Journal of
Psychopathology & Behavioral Assessment, 24, 195-205.
de Beurs, E., Van Dyck, R., Marquenie, L.A. (2001). De DASS: Een vragenlijst voor het
meten van depressie, angst en stress. = The DASS: A questionnaire for the
measurement of depression, anxiety, and stress. Gedragstherapie, 34, 35-53.
Duffy, C. J., Cunningham, E. G. & Moore, S. M. (2005). The factor structure of mood
states in an early adolescent sample. Journal of Adolescence, 28, 677-680.
Fabrigar, L. R., Wegener, D. T., MacCallum, R. C., & Strahan, E. J. (1999). Evaluating
the use of exploratory factor analysis in psychological research. Psychological
Methods, 4, 272-299.
DASS FOR CHILDREN AND ADOLESCENTS
19
Finch, A. J., Lipovsky, J. A., & Casat, C. D. (1989). Anxiety & depression in children &
adolescents: Negative affectivity or separate constructs? In P. C. Kendall & D.
Watson (Eds.), Anxiety & depression: Distinctive & overlapping features. New
York, NY: Academic Press.
Gorsuch, R. L. (2003). Factor analysis. In J. A. Schinka & W. F. Velicer (Eds.),
Handbook of psychology: Volume 2 Research methods in psychology (pp. 143-
164). Hoboken, NJ: Wiley.
Hammen, C., & Compas, B. E. (1994). Unmasking unmasked depression in children and
adolescents: The problem of comorbidity. Clinical Psychology Review, 14, 585-
603.
Henry, J. D. & Crawford, J. R. (2005). The short-form version of the Depression Anxiety
Stress Scales (DASS-21): Construct validity and normative data in a large non-
clinical sample. British Journal of Clinical Psychology, 44, 227-239.
Herman, K., Ostrander, R., Walkup, J., Sylva, S. & March, J. (2007). Empirically derived
subtypes of adolescent depression: Latent profile analysis of co-occurring
symptoms in the treatment of adolescents with depression study. Journal of
Consulting & Clinical Psychology, 75, 716-728.
Lahey, B. B., Applegate, B. & Waldman, I. D. (2004). The structure of child and
adolescent psychopathology: Generating new hypotheses. Journal of Abnormal
Psychology, 113, 358-385.
Lewinsohn, P. M., Hops, H., Roberts, R. E., Seeley, J. R., & Andrews, J. A. (1993).
Adolescent psychopathology: I. Prevalence and incidence of depression and other
DASS FOR CHILDREN AND ADOLESCENTS
20
DSM-IIIR disorders in high school students. Journal of Abnormal Psychology,
102, 133-144.
Lewinsohn, P. M., Pettit, J. W., Joiner, T. E., & Seeley, J. R. (2003). The symptomatic
expression of major depressive disorder in adolescents and young adults. Journal
of Abnormal Psychology, 112, 244-252.
Lonigan, C. J., Carey, M. P. & Finch, A. J. (1994). Anxiety and depression in children
and adolescents: Negative affectivity and the utility of self-reports. Journal of
Consulting & Clinical Psychology, 62, 1000-1008
Lovibond, S. H., & Lovibond, P. F. (1995). Manual for the Depression Anxiety Stress
Scales. Sydney: Psychology Foundation.
O‟Connor, B. P. (2000). SPSS, SAS, and MATLAB programs for determining the
number of components using parallel analysis and Velicer's MAP test. Behavior
Research Methods, Instruments & Computers, 32, 396-402.
Roberts, R. E., Lewinsohn, P. M., & Seeley, J. A. (1995). Symptoms of DSM-IIIR major
depression in adolescence: Evidence from an epidemiological survey. Journal of
the American Academy of Child & Adolescent Psychiatry, 34, 1608-1617.
Sanderson, W. C., DiNardo, P. A., Rapee, R. M. (1990). Syndrome comorbidity in
patients diagnosed with a DSM-III-R anxiety disorder. Journal of Abnormal
Psychology, 99, 308-312.
Szabó, M. (2009). The short version of the depression anxiety stress scales (DASS-21):
Factor structure in a young adolescent sample. Journal of Adolescence,
doi:10.1016/j.adolescence.2009.05.014
DASS FOR CHILDREN AND ADOLESCENTS
21
Szabó, M. & Lovibond, P. (2006). Anxiety, depression, and tension/stress in children.
Journal of Psychopathology and Behavioral Assessment, 28 (3), 195-205.
Tomarken, A. & Waller, G. (2003). Potential problems with “well fitting” models.
Journal of Abnormal Psychology, 112, 578–598.
Tomarken, A. & Waller, G. (2005). Structural equation modeling: Strengths, limitations,
and misconceptions. Annual Review of Clinical Psychology, 1, 31–65.
Turner, C. & Barrett, P. M. (2003). Does age play a role in structure of anxiety and
depression in children and youths? An investigation of the tripartite model in
three age cohorts. Journal of Consulting & Clinical Psychology, 71, 826-833.
Turner, N. E. (1998). The effect of common variance and structure pattern on random
data eigenvalues: Implications for the accuracy of parallel analysis. Educational &
Psychological Measurement, 58, 541-569.
Vasey, M. W. & Dadds, M. R. (2000). (Eds.) The developmental psychopathology of
anxiety. London, Oxford University Press.
Watson, D., Clark, L., Weber, K., Assenheimer, J., Strauss, M., & McCormick, R.
(1995). Testing a tripartite model: II. Exploring the symptom structure of anxiety
and depression in student, adult, and patient samples. Journal of Abnormal
Psychology, 104, 15-25.
Watson, D., & Walker, L. (1996). The long-term stability and predictive validity of trait
measures of affect. Journal of Personality & Social Psychology, 70, 567-577.
Watson, D., Weber, K., Assenheimer, J., Clark, L., Strauss, M., & McCormick, R.
(1995). Testing a tripartite model: I. Evaluating the convergent and discriminant
DASS FOR CHILDREN AND ADOLESCENTS
22
validity of anxiety and depression symptom scales. Journal of Abnormal
Psychology, 104, 3-14.
Weiss, B., & Weisz, J. (1988). Factor structure of self-reported depression: Clinic-
referred children versus adolescents. Journal of Abnormal Psychology, 97, 492-
495.
Weiss, B., Weisz, J., Politano, M., Carey, M., Nelson, W. M., & Finch, A. (1992).
Relations among self-reported depressive symptoms in clinic-referred children
versus adolescents. Journal of Abnormal Psychology, 101, 391-397.
Young, J., Mufson, S., & Davies, M. (2006). Impact of comorbid anxiety in an
effectiveness study of interpersonal psychotherapy for depressed adolescents.
Journal of the American Academy of Child & Adolescent Psychiatry, 45, 904-
912.
DASS FOR CHILDREN AND ADOLESCENTS
23
Acknowledgements
We wish to thank the Darling Downs Public Health Unit (Queensland Health) for
its support of the South-West Queensland Longitudinal Study of Adolescent Students
project, Marcus Jenick and Georgie Clarke for project management, the Centre for
Organizational Research and Evaluation and the Centre for Rural and Remote Area
Health for their support.
DASS FOR CHILDREN AND ADOLESCENTS
24
Table 1
DASS-21 means, variability, range and internal consistency by
age and gender
N Mean SD Range Alpha PA
Male
Age 11 46 22.26 14.86 58 .94 1
Age 12 83 15.86 15.49 61 .96 1
Age 15 52 14.93 12.25 43 .93 1
Age 17 26 11.83 8.23 30 .86 1
Female
Age 11 59 15.31 15.40 55 .95 1
Age 12 70 18.76 15.84 52 .95 1
Age 15 58 15.00 12.52 49 .93 1
Age 17 31 7.80 6.09 26 .83 1
Note. SD=Standard deviation; PA=Parallel Analysis indicates
N components above the upper 95th
percentile eigen values of
100 random data sets.
DASS FOR CHILDREN AND ADOLESCENTS
25
Table 2
Parallel Analysis of Time 1 and Time 2 datasets
Time 1 Time 2
Latent Root
Actual
eigenvalues
Upper 95th
percentile
eigenvalues of
100 random
data sets
Actual
eigenvalues
Upper 95th
percentile
eigenvalues of
100 random
data sets
1 10.02 1.51 10.35 1.63
2 1.03 1.42 1.13 1.52
3 0.95 1.36 0.97 1.42
4 0.89 1.31 0.86 1.35
5 0.86 1.26 0.76 1.30
6 0.77 1.21 0.74 1.24
7 0.73 1.16 0.71 1.19
8 0.68 1.12 0.65 1.14
9 0.56 1.09 0.59 1.10
10 0.53 1.05 0.54 1.05
11 0.52 1.01 0.53 1.02
12 0.51 0.98 0.49 0.97
13 0.44 0.95 0.43 0.92
14 0.43 0.91 0.40 0.88
15 0.37 0.87 0.35 0.86
16 0.36 0.84 0.31 0.82
17 0.32 0.81 0.28 0.77
18 0.29 0.78 0.26 0.74
19 0.27 0.73 0.25 0.69
20 0.25 0.69 0.23 0.66
21 0.23 0.66 0.17 0.60
DASS FOR CHILDREN AND ADOLESCENTS
26
Table 3
Comparison of item loadings at Time 1 and Time 2
Item
Component 1
Time 1
Component 1
Time 2
Average
Communality
1 .54 .59 .33
2 .52 .51 .27
3 .53 .68 .38
4 .67 .62 .42
5 .61 .69 .43
6 .62 .62 .39
7 .69 .63 .44
8 .75 .69 .52
9 .71 .66 .48
10 .71 .73 .52
11 .75 .76 .57
12 .76 .75 .57
13 .73 .78 .57
14 .69 .68 .48
15 .74 .72 .54
16 .76 .79 .61
17 .76 .76 .58
18 .64 .75 .49
19 .73 .73 .53
20 .75 .77 .59
21 .75 .75 .57