Embed Size (px)
Citation preview

Darunavir concentrations in CSF ofHIV-infected individuals when boosted
with cobicistat versus ritonavir
Hanni Bartels1, Laurent Decosterd2, Manuel Battegay1, Catia Marzolini1,3
1 Division of Infectious Diseases & Hospital Epidemiology, Departments of Medicine andClinical Research, University Hospital of Basel and University of Basel, Switzerland
2 Laboratory of Clinical Pharmacology, Department of Laboratories, University Hospital ofLausanne and University of Lausanne, Switzerland
3 www.hiv-druginteractions.org
Antivirals PK Workshop 2017
Financial support
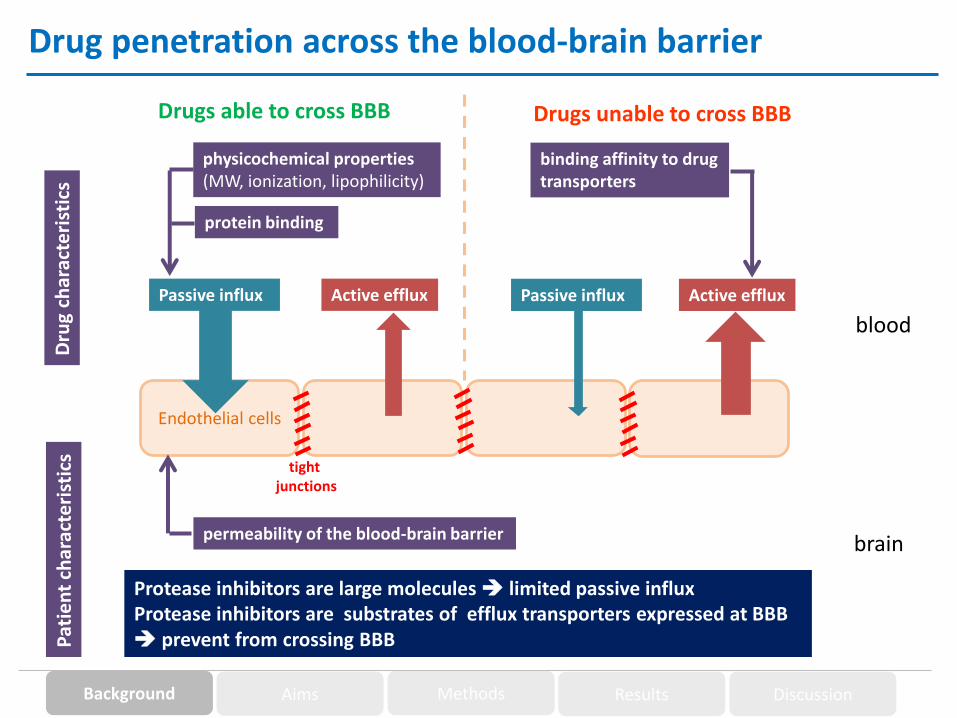
Drug penetration across the blood-brain barrier
Endothelial cells
brain
Drugs able to cross BBB Drugs unable to cross BBB
Active efflux
blood
Passive influx Active effluxPassive influx
Dru
g ch
arac
teri
stic
s
physicochemical properties(MW, ionization, lipophilicity)
protein binding
binding affinity to drugtransporters
Pat
ien
t ch
arac
teri
stic
s
permeability of the blood-brain barrier
tightjunctions
Protease inhibitors are large molecules limited passive influxProtease inhibitors are substrates of efflux transporters expressed at BBB prevent from crossing BBB
Background Aims Methods Results Discussion
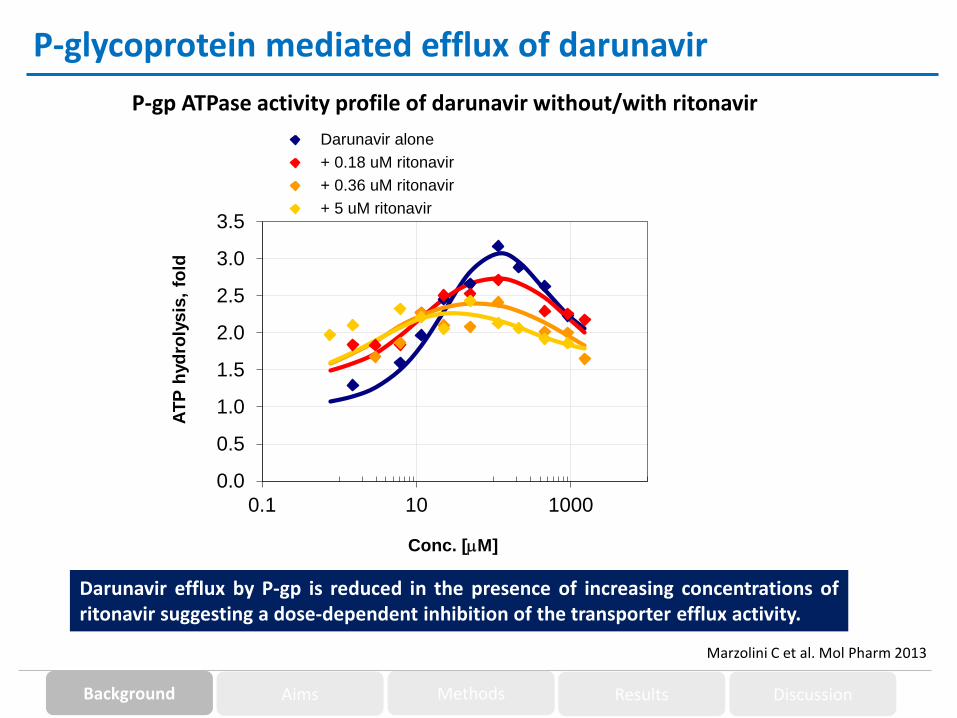
P-gp ATPase activity profile of darunavir without/with ritonavir
P-glycoprotein mediated efflux of darunavir
0.0
0.5
1.0
1.5
2.0
2.5
3.0
3.5
0.1 10 1000
AT
P h
yd
roly
sis
, fo
ld
Conc. [mM]
Darunavir alone darunavir fitting
+ 0.18 uM ritonavir fitting 0.18
+ 0.36 uM ritonavir fitting 0.36
+ 5 uM ritonavir fitting 5
Marzolini C et al. Mol Pharm 2013
Darunavir efflux by P-gp is reduced in the presence of increasing concentrations ofritonavir suggesting a dose-dependent inhibition of the transporter efflux activity.
Background Aims Methods Results Discussion

Pharmacokinetic boosting: cobicistat versus ritonavir
1. Kakuda TN et al. J Clin Pharmacol 2014; 2. FDA Antiviral Drug Advisory Meeting – May 2012; 3. Ronaldson PT et al. Glia 2008
Cobicistat is a structural analogue of ritonavir with:
o Similar strong inhibition of CYP3A4 resulting in bioequivalent systemicexposure of co-administered darunavir1
o Weaker in vitro inhibition of P-gp and BCRP2, both efflux transportersare expressed at BBB where they limit the brain entry of HIV proteaseinhibitors3
Study hypothesis:
Weaker inhibition of P-gp and BCRP by cobicistat could result in less
darunavir crossing BBB when boosted with cobicistat compared toritonavir
Background Aims Methods Results Discussion

Aims of the study
o Compare in the same patient darunavir concentrations in CSF when boostedwith ritonavir versus cobicistat relative to plasma concentrations (CSF/plasmaratio)
o Assess whether darunavir concentrations in CSF remain above darunavir IC50
(1.78 ng/ml) and IC90 (2.43 ng/ml)1 for WT HIV-1 when boosted with ritonavirversus cobicistat
1. Croteau D et al. J Antimicrob Chemother 2012
Background Aims Methods Results Discussion

Study population
Subjects: HIV infected patients > 18 years
Inclusion criteria Exclusion criteria
o HIV patients with HAND requiring alumbar puncture for clinical reasons
o Treated with DRV/r once daily orqualifying for such treatment
o Providing informed consent
o Conditions disrupting BBB (e.g. meningitis, meningoencephalitis, multiple sclerosis, progressive multifocal leucoenphephalopathy)
o Co-medications inducing/inhibitingP-gp, BCRP and/or CYP3A4
o Non-adherence
o Pregnancy
Background Aims Methods Results Discussion

Study design
Single-center, open, one-armed, sequential studyLumbarpuncture
Lumbarpuncture
Study period 1 Study period 2
Assessments screening
1 2 3 4 1 2 3 4
Visit 1 2 3
Informed consent X
In-/exclusion criteria X
Phys. examination X X X
Hematology X X X
Biochemistry X X X
Lumbar puncture X X
Albumin, glucose, lactate, cell in CSF X X
Initiation/maintain of darunavir/ritonavir X X X X X
initiation of darunavir/cobicistat X X X X
HIV RNA viral load plasma X X
HIV RNA viral load CSF X X
Drug level X X
Adherence evaluation X X X
Adverse effects X X
treatment darunavir/ritonavir treatment darunavir/cobicistat
week week
HIV patients with HAND requiring clinicalinvestigation + treated or qualifying for
DRV/r QD regimen
Treatment at least 30 dayswith DRV/c (800/150mg)
(Prezista/Tybost)
Switch to
DRV/r
Treatment at least 30 dayswith DRV/r (800/100mg)
(Prezista/Norvir)
Background Aims Methods Results Discussion

Sampling of drug levels and data analysis
o Paired samples collected systematically towards the end of the dosing interval(DRV/r: 22 + 3.5 h and DRV/c: 21 + 4.0 h)
o Paired blood and CSF samples taken < 30 minutes apart
o Sampling time intervals between study periods maintained as close as possiblefor the same patient
o Drug levels quantified using a validated LC-MS/MS method with lower limit ofquantification of:
PLASMA: DRV: 25 ng/ml RTV: 5 ng/ml Cobi: 4 ng/mlCSF: DRV: 0.5 ng/ml RTV: 0.5 ng/ml Cobi: 0.5 ng/ml
o Wilcoxon signed rank test was used to compare darunavir CSF concentrationsand CSF/plasma ratio between study periods
Clinical study was approved by Ethics Committee and registered (NCT02503462)
Background Aims Methods Results Discussion

Patients and treatment characteristics
Nb Sex Age Ethnicity BMI(kg/m2)
ARV treatment CD4(cells/mm3)
VL plasma(copies/ml)
VL CSF(copies/ml)
1 female 48 Caucasian 20.9 DRV/r + 3TC + ABC 802 <20 <20
2 male 64 Caucasian 22.9 DRV/r 640 <20 <20
3 male 60 Caucasian 30.0 DRV/r + TDF + FTC 690 <20 <20
4 male 54 Caucasian 24.2 DRV/r + TDF + FTC 775 <20 <20
5 female 31 African 19.5 DRV/r + TDF + FTC 870 <20 <20
6 male 66 Caucasian 26.0 DRV/r + TDF + FTC 344 <20 <20
7 male 55 Asian 20.2 DRV/r + 3TC + ABC 1098 <20 <20
o CSF-to-serum albumin ratios were within limits of normal and examination of CSF did not indicate any BBB impairment or abnormalities
o None of the patients received interfering co-medications
Background Aims Methods Results Discussion
Nb Plasma(ng/ml)
CSF(ng/ml)
CSF:plasma
CSF/IC50 CSF/IC90
1 1971 23.4 0.012 13.1 9.6
2 1313 8.6 0.007 4.8 3.5
3 2491 16.4 0.007 9.2 6.7
4 1761 11.2 0.006 6.3 4.6
5 1614 4.3 0.003 2.4 1.8
6 2473 17.9 0.007 10.1 7.4
7 1618 20.3 0.013 11.4 8.4
median 1761 16.4 0.007 9.2 6.7
IQR 1614-2473 8.6-20.3 0.006-0.012
4.8-11.4 3.5-8.4
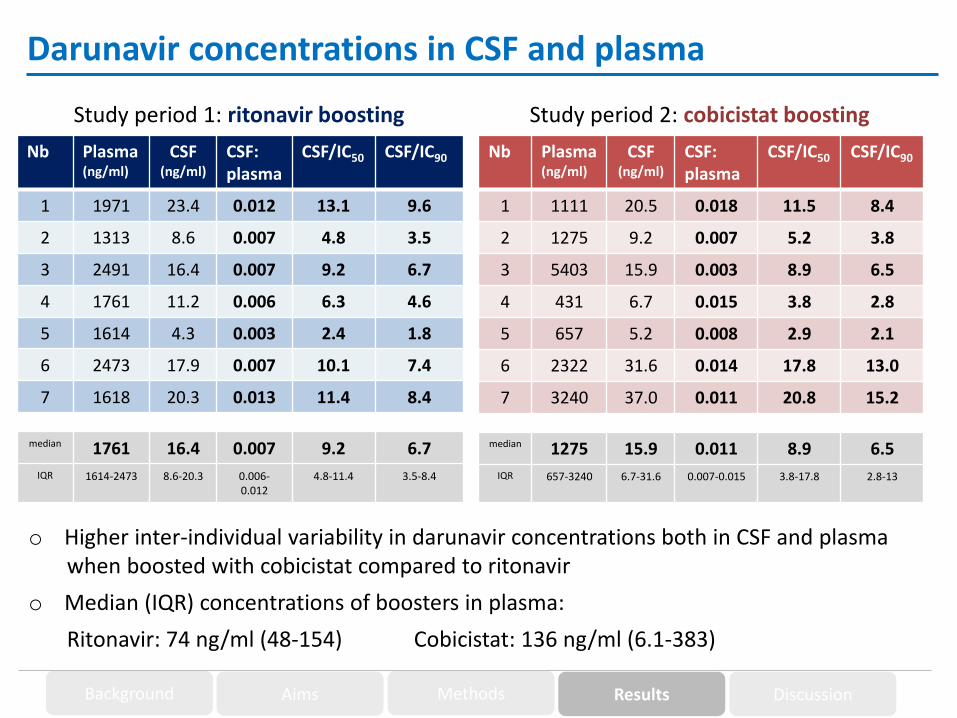
Darunavir concentrations in CSF and plasma
Nb Plasma(ng/ml)
CSF(ng/ml)
CSF:plasma
CSF/IC50 CSF/IC90
1 1111 20.5 0.018 11.5 8.4
2 1275 9.2 0.007 5.2 3.8
3 5403 15.9 0.003 8.9 6.5
4 431 6.7 0.015 3.8 2.8
5 657 5.2 0.008 2.9 2.1
6 2322 31.6 0.014 17.8 13.0
7 3240 37.0 0.011 20.8 15.2
median 1275 15.9 0.011 8.9 6.5
IQR 657-3240 6.7-31.6 0.007-0.015 3.8-17.8 2.8-13
Study period 1: ritonavir boosting Study period 2: cobicistat boosting
Background Aims Methods Results Discussion
o Higher inter-individual variability in darunavir concentrations both in CSF and plasmawhen boosted with cobicistat compared to ritonavir
o Median (IQR) concentrations of boosters in plasma:
Ritonavir: 74 ng/ml (48-154) Cobicistat: 136 ng/ml (6.1-383)

DR
V/r
DR
V/c
0
2 0
4 0
6 0
DR
V C
SF
co
nc
en
tra
tio
n (
ng
/ml)
DR
V/r
DR
V/c
0 .0 0
0 .0 1
0 .0 2
0 .0 3
DR
V C
SF
/pla
sm
a
1 2 3 4 5 6 7
1
1 0
1 0 0
1 0 0 0
1 0 0 0 0
p a t ie n t
DR
V c
on
ce
ntra
tio
n(n
g/m
l)
plasma concentrations
CSF concentrations
P = 0.58 P = 0.16
IC50
IC90
Background Aims Methods Results Discussion
Darunavir boosted with ritonavir Darunavir boosted with cobicistat
Darunavir concentrations in CSF and plasma
o Darunavir concentrations in CSF were mostly similar with cobicistat compared to ritonavirboosting

Laboratory parameters at each study period
Study period 1 Study period 2
Background Aims Methods Results Discussion
Chemistry parameters Median IQR Median IQR P value
Creatinine (umol/L) 85 69-101 84 70-103 0.75
Total bilirubin (umol/L) 6 4-8 7 5-7 0.55
ASAT (U/I) 26 18-42 27 20-53 0.87
ALAT (U/I) 25 13-34 22 15-30 0.67
Alkaline phosphatase (U/I) 72 68-78 66 62-78 0.06
Creatine kinase (U/I) 122 77-323 125 90-127 0.70
Glucose (mmol/L) 5.5 5.2-5.5 4.8 4.0-5.2 0.17
Total protein (g/L) 74 69-77 70 68-79 0.42
Albumin (g/L) 36 35-37 36 33-37 0.17
CRP (mg/L) 2 0.4-5.5 1 0.6-3.4 0.18
Hematology parameters Median IQR Median IQR P value
Leucocytes (x10e9/L) 5.3 4.8-6.5 5.8 4.4-8.9 0.40
Erythrocytes (x10e12/L) 4.6 4.1-4.8 4.5 4.1-4.7 0.40
Hemoglobin (g/L) 145 128-152
144 122-154
0.40
Hematocrit (I/I) 0.41 0.41-0.44
0.42 0.39-0.45
0.73
Thrombocytes (x10e9/L) 182 148-212
195 179-235
0.40
CSF parameters Median IQR Median IQR P value
Lactate (mmol/L) 1.7 1.6-2.0 1.6 1.4-1.8 0.07
Glucose (mmol/L) 3.6 3.2-3.8 3.6 3.3-4.2 0.70
Leucocytes (x10e6/L) 1.0 0.7-2.0 1.3 0.3-1.9 0.67
o No report of side effects

o Once daily boosting by cobicistat and ritonavir results in essentially identicaldarunavir concentrations in CSF which are well above the drug’s IC50 and IC90
and in the range of concentrations previously reported with ritonavir oncedaily boosting (i.e. 8.5 to 15.7 ng/ml)1-3
o CSF/plasma ratios were not significantly different between cobicistat andritonavir boosting
o Cobicistat boosting led to a higher inter-individual variability in both darunavirCSF and plasma concentrations however adequate darunavir concentrationswere still achieved in all patients
o All patients remained virologically suppressed throughout the study both in theCSF and plasma
o In conclusion, cobicistat and ritonavir give comparable effective darunavirconcentrations in CSF and therefore can be used interchangeably to boost oncedaily darunavir regimens
Background Aims Methods Results Discussion
Discussion
1. Calcagno A et al. AIDS 2012; 2. Delille CA et al. J Clin Pharmacol 2014; 3. Di Yacovo M et al. J Antimicrob Chemother 2015

Acknowledgements
Ms. S. Alves Saldanha
Dr. C. Moecklinghoff
Dr. L. Semlin
Ms. D. Gaignat (M.Sc.)
and the patients who consented to participate in this study
Prof. L. Decosterd
Dr. H. Bartels
Prof. M. Battegay