Embed Size (px)
Citation preview
Achieve Desire Productivity through Effective
Production GAP Analysis
A
Management Internship Program Report
Submitted to
SVKM’s
Narsee Monjee Institute of Management Studies (NMIMS)
M.Pharm (Pharmaceutics) + MBA (Pharma Tech & Healthcare Management)
By
Mr. Darshankumar R. Patel
Under the guidance of
Mr. Haresh Raulgaonkar
School of Pharmacy & Technology Management,
SVKM’s NMIMS,
Vile Parle (W), Mumbai-400056
2015
Statement by the candidate
This is to submit that this written submission in my report entitled “Achieve Desire
Productivity through Effective Production GAP Analysis” represents my ideas in my own
words and where others’ ideas or words have been included, I have adequately cited and
referenced the original sources. I also declare that I have stick to all principles of academic
honesty and integrity and have not misrepresented or fabricated or falsified any idea / data /
fact / source in my submission. I understand that any violation of the above will be cause for
disciplinary action by the School and can also evoke penal action from the sources which have
thus not been properly cited or from whom proper permission has not been taken when needed.
Student signature
Mr. Darshankumar R. Patel
Forwarded Through
Sign of the faculty
Mr. Haresh Raulgaonkar
Assistant Professor
SPP School of Pharmacy & Technology Management,
SVKM’s NMIMS,
Vile Parle (W),
Mumbai - 400056
Certificate
The work described in this report entitled “Achieve Desire Productivity through Effective
Production GAP Analysis” has been carried out by Mr. Darshankumar R. Patel under my
supervision. I certify that, this is his bonafide work. The work described is original and has
not been submitted for any degree to this or any other university.
Date:
Place:
Faculty signature
Mr. Haresh Raulgaonkar
Assistant Professor
______________________
Chairperson
______________________
Dean
Success is the sweet and succulent fruit of vision, inspiration, guidance and execution.
I earnestly revere The Almighty Lord for his boundless blessings, which accompanied me in
all endeavors of journey. I, therefore take this opportunity to register my acknowledgements to
all who supported me directly and indirectly in this journey.
I express my sincere thanks to Mr. Sunil Chaturvedi for giving me an opportunity to
work with esteemed organization, Novartis Vaccines.
It gives me immense pleasure in expressing my sincere regards and gratitude to Dr. R.
S. Gaud, Dean, School of Pharmacy and Technology management, SVKM’s NMIMS for their
support and constant encouragement for the project.
I am extremely grateful to my guide, Mr. Haresh Raulgaonkar, Assistant Professor,
School of Pharmacy and Technology management, SVKM’s NMIMS for his valuable
guidance, co-operation, affectionate encouragement and moral support throughout the course
of journey without whom it would have been a distant goal. I am greatly indebted towards him.
I have lack of words but I wish to express my warm regards,deep sense of gratitudes
and sincere thanks to Mr. Manoranjan Rayguru (GDSO, Senior Executive Manager) and
Mr. Surajit Pakira (GDSO, Senior Executive Manager) Zydus Cadila Healthcare Pvt Ltd.,
for the enthusiasm and support laid by them during all stages of my work and valuable
guidance, which boosted me to complete my project. I had a great pleasure and sweet
experience for doing my project under them and without whom I would not have got the
opportunity to proceed with this project work in this highly newer complicated field.
I am highly indebted to Mr. Bhavik Siddhpuriya, Mr. Manoj Patil and Mrs. Anuja
Roy for their continuous guidance &constant support.
I am eternally indebted to my Parents, Grand Parents, Brothers and Sisters for their
blessings, inspirations, constant support, faith in me and love throughout my life never tiring
moral support and dedicated efforts to educate me to this level. Which made my dreams comes
true & I promise to come up to their expectation.
This thesis would not have been possible without the support of my friends (Vishal,
Ankit, Brijesh, Yashdeep and Vishal Kulkarni) and my fiancé (Miss Payal). I’ll always
cherish the time spent with them.
Last but not the list I am also thankful to my M.Pharm + MBA classmates Chirag,
Jigar, Navin, Pritesh, Darshak, Sanket, Rudra, Bhavik, Ronak, Maulin & Palak for moral
support & motivation during my curriculum.
To sum up, I would only say that without the association of all the people mentioned,
the blessings of almighty and elders and also the ones whom I might have missed to mention,
this endeavor itself would have been a distant goal.
Mr. Darshankumar R. Patel
TABLE OF CONTENTS
I
Sr. No. Title Page No.
LIST OF TABLES III
LIST OF FIGURES IV
ABBREVIATION V
1 ABSTRACT 1
2 INTRODUCTION 2-17
2.1 Production GAP Analysis 2
2.2 GAP Analysis Tools 4
2.2.1 Spreadsheets Analysis 4
2.2.2 Fishbone Analysis 5
2.2.3 McKinsey 7S Model 6
2.2.4 SWOT Analysis 7
2.2.5 Nadler-Tushman Model 9
2.2.6 Force Field Analysis 9
2.2.7 SERVQUAL Model 10
2.2.8 Weisbord’s Six-Box Model 12
2.2.9 Organization Intelligence Model 13
2.2.10 PDCA Cycle 14
2.3 Objective of Production GAP Analysis 15
2.4 Function 15
2.5 Significance 16
2.6 Benefits 16
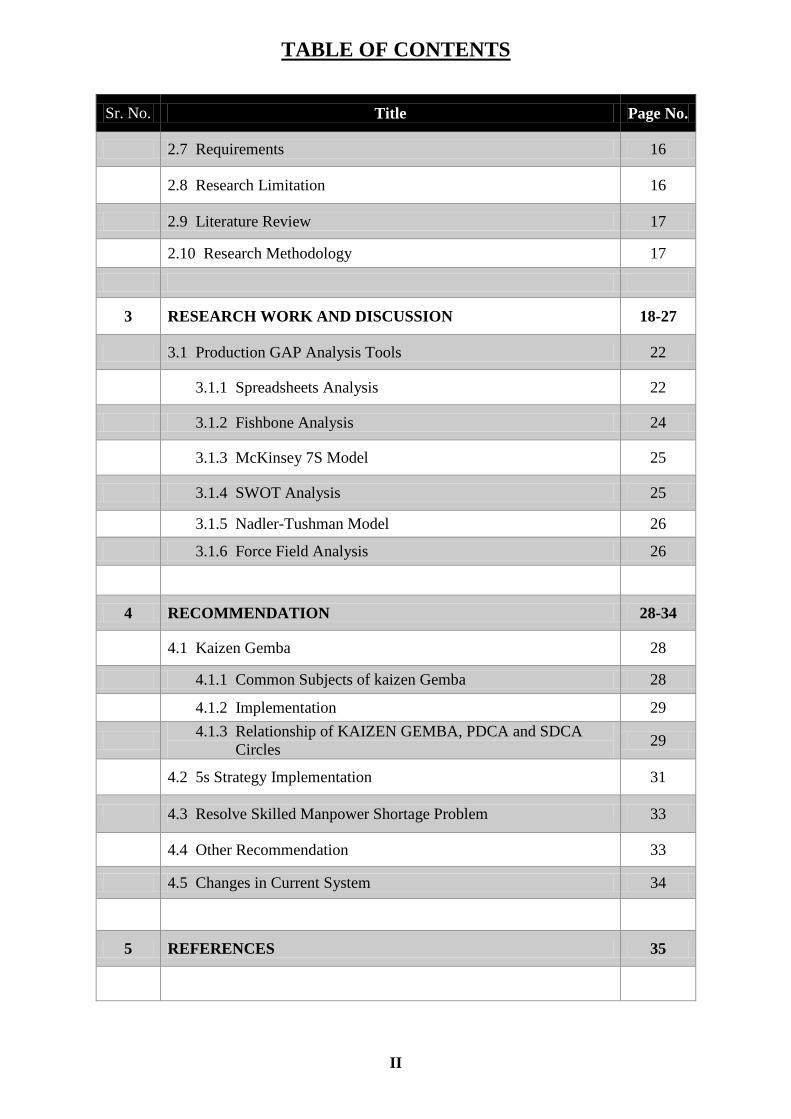
TABLE OF CONTENTS
II
Sr. No. Title Page No.
2.7 Requirements 16
2.8 Research Limitation 16
2.9 Literature Review 17
2.10 Research Methodology 17
3 RESEARCH WORK AND DISCUSSION 18-27
3.1 Production GAP Analysis Tools 22
3.1.1 Spreadsheets Analysis 22
3.1.2 Fishbone Analysis 24
3.1.3 McKinsey 7S Model 25
3.1.4 SWOT Analysis 25
3.1.5 Nadler-Tushman Model 26
3.1.6 Force Field Analysis 26
4 RECOMMENDATION 28-34
4.1 Kaizen Gemba 28
4.1.1 Common Subjects of kaizen Gemba 28
4.1.2 Implementation 29
4.1.3 Relationship of KAIZEN GEMBA, PDCA and SDCA
Circles 29
4.2 5s Strategy Implementation 31
4.3 Resolve Skilled Manpower Shortage Problem 33
4.4 Other Recommendation 33
4.5 Changes in Current System 34
5 REFERENCES 35
LIST OF TABLES
III
Sr. No. Title Page No.
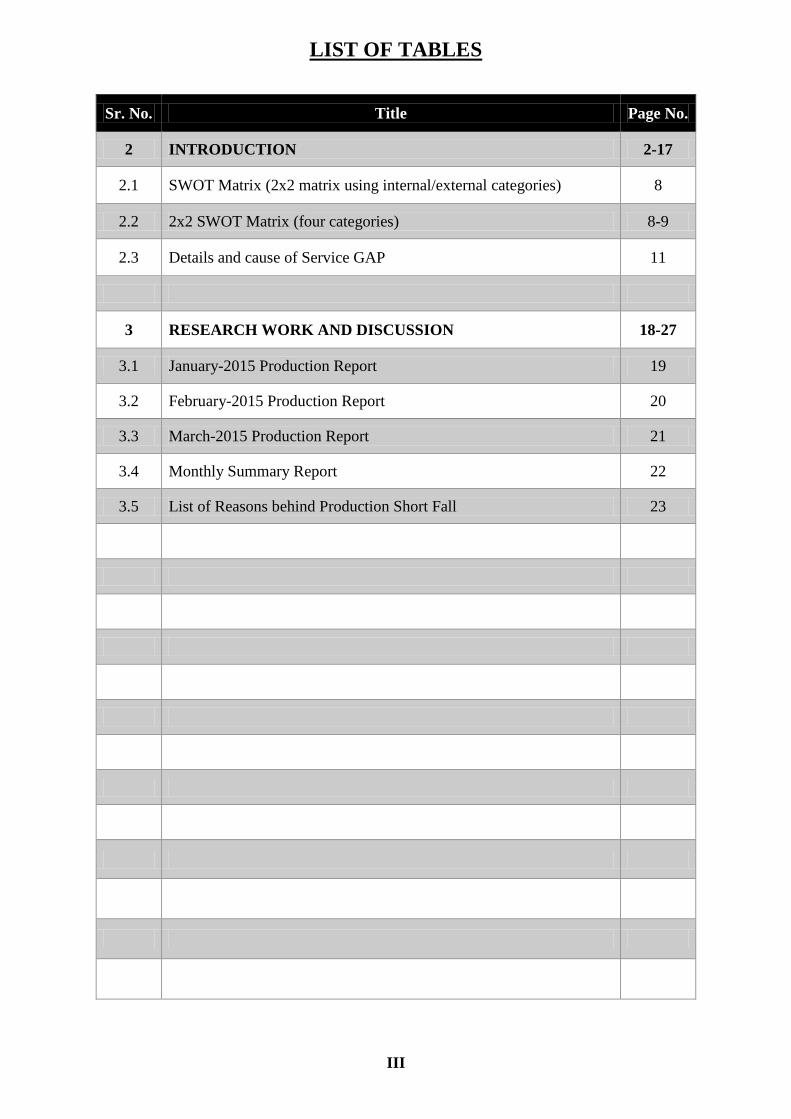
2 INTRODUCTION 2-17
2.1 SWOT Matrix (2x2 matrix using internal/external categories) 8
2.2 2x2 SWOT Matrix (four categories) 8-9
2.3 Details and cause of Service GAP 11
3 RESEARCH WORK AND DISCUSSION 18-27
3.1 January-2015 Production Report 19
3.2 February-2015 Production Report 20
3.3 March-2015 Production Report 21
3.4 Monthly Summary Report 22
3.5 List of Reasons behind Production Short Fall 23
LIST OF FIGURES
IV
Sr. No. Title Page No.
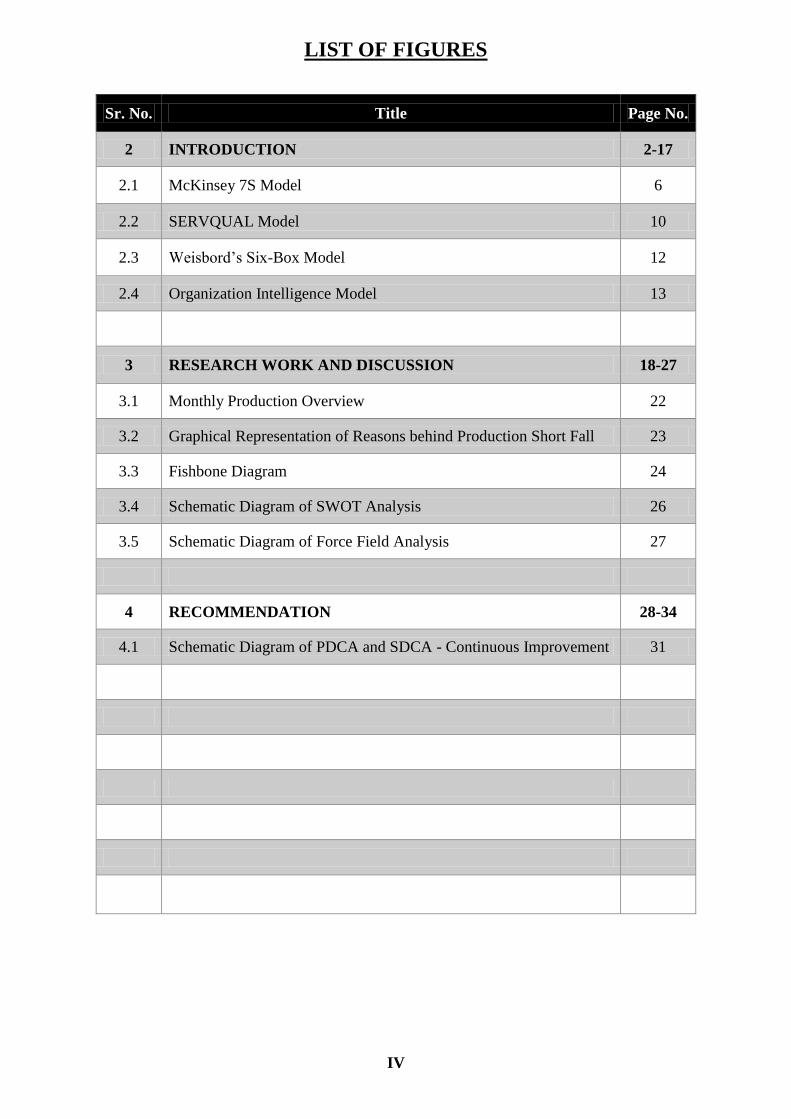
2 INTRODUCTION 2-17
2.1 McKinsey 7S Model 6
2.2 SERVQUAL Model 10
2.3 Weisbord’s Six-Box Model 12
2.4 Organization Intelligence Model 13
3 RESEARCH WORK AND DISCUSSION 18-27
3.1 Monthly Production Overview 22
3.2 Graphical Representation of Reasons behind Production Short Fall 23
3.3 Fishbone Diagram 24
3.4 Schematic Diagram of SWOT Analysis 26
3.5 Schematic Diagram of Force Field Analysis 27
4 RECOMMENDATION 28-34
4.1 Schematic Diagram of PDCA and SDCA - Continuous Improvement 31
LIST OF ABBREVIATION
V
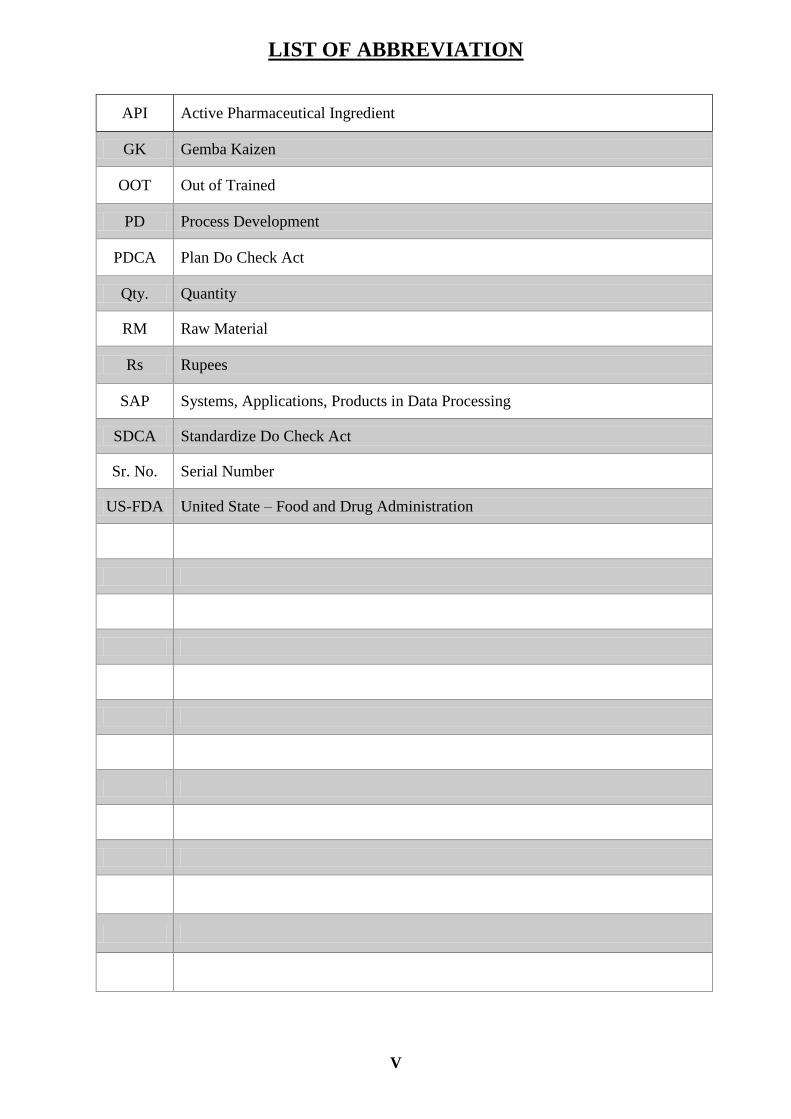
API Active Pharmaceutical Ingredient
GK Gemba Kaizen
OOT Out of Trained
PD Process Development
PDCA Plan Do Check Act
Qty. Quantity
RM Raw Material
Rs Rupees
SAP Systems, Applications, Products in Data Processing
SDCA Standardize Do Check Act
Sr. No. Serial Number
US-FDA United State – Food and Drug Administration
Chapter 1 Abstract
SPP, School of Pharmacy & Technology Management, NMIMS, Mumbai. 1
BSTRACT
Today’s practices in production are faced with volatility in demand, uncertain economy,
rising process/material costs and intense rivalry. Improving overall productivity and efficiency
at operations level has become an essential not just for margin purposes, but always act in line
with customer needs and achieving long term success. By reducing cost and improving
productivity, we can gain competitive advantage in whole market.1
Operational excellence is the pursuit of conducting integrated business planning (M2M
planning) and continuously improvement in performance at operations level. We can achieve
desire productivity through effective production GAP analysis which can be accomplished by
identify GAP between an optimized allocation of resources and integration of inputs, and the
current level of allocation. This helps provide the company with insight into areas which could
be improved. Once the general expectation of performance in the industry is understood, it is
possible to compare expectation with the company's current level of performance. This
comparison becomes the GAP analysis which can be performed at the strategic, tactical or
operational level of an organization in continuous manner for maintaining flow of operations
without any interruption and achieving expected productivity.
A
Chapter 2 Introduction
SPP, School of Pharmacy & Technology Management, NMIMS, Mumbai. 2
NTRODUCTION
Market rivalry is introducing high pressure on cost, quality and responsiveness to
consumer demands. Key challenges in manufacturing firms are lack of visibility and control in
production era and accomplish production operations in a proactive manner. Real time
measuring, monitoring and controlling through managers and production personnel is a tough
job. There is need of documentation, tracking and auditing to ensure compliance. To achieve
desire production, it is important to execute overall plan in an effective manner and evaluated
at fixed interval time for progress report, to provide visibility, of the operations.
Without any planning, we cannot execute process perfectly and cannot achieve desire
outcome. Production planning is a very vast process in which all parts include from starting
resource material management to actual delivery as per required demand on time. Production
planning is one of a technique related to achieve desire productivity. But some of external and
internal factor which affect to manage effectively all-over process of production planning,
Like –
- External factor: availability of funds, power, water, means of transport and
communication, raw and packing materials etc.
- Internal factor:
(a) Static factor: Difficult to change; which includes plant and equipment, raw and
packing materials, energy, products, technology, etc.
(b) Dynamic factor: men, management practices, work methods, systems, work culture
By managing these factors, we can effectively manage production planning process and getting
desire output without any disturbance. But in current scenario, this will not happened. So, by
using of effective GAP analysis, we can address the actual problems for executing planned
production process and solve them. [2-4]
2.1 Production GAP Analysis [8-9]
GAP analysis is a tool for companies to correlate actual performance with potential
performance. By asking two questions: "Where are we?" and "Where do we want to be?” we
can find out era where we are needed to improve. If a company or organization is not creating
the best usage of its current resources or is forgoing investment in capital or technology, then
I
Chapter 2 Introduction
SPP, School of Pharmacy & Technology Management, NMIMS, Mumbai. 3
it may be producing or performing at a level below its potential. This concept is analogous to
an economy's being below the production possibilities frontier.
Production GAP analysis addresses gaps where improvisation can be happened. GAP
analysis encompasses determining, documenting, and approving the variance between business
requirements and current capabilities. Production GAP analysis naturally flows from
benchmarking and other assessments. Once the general expectation of Production in the
industry is understood, it is probable to compare that planned production with the company's
current level of production. This comparison turn out to be the Production GAP analysis. Such
analysis can be done at the strategic, tactical or operational level of an organization. Production
GAP analysis is a formal study of what Organization Producing currently and where it wants
to go in the future. It can be conducted, in different viewpoints, as follows:
1) Organization (e.g., Human Resources)
2) Business direction
3) Business processes
4) Information technology
5) Gap in actual foundation for measuring investment of time, money and human resources
required to accomplish a particular outcome.
6) The need for new products or additions to current lines may arise from portfolio analysis,
or the need may arise from the regular process of following trends in the requirements of
consumers. At some point, a gap emerges between what existing products offer and what
the consumer demands. The organization must fill that gap to survive and grow.
7) GAP analysis can recognize gaps in the market. Thus, associating forecast profits to desired
profits reveals the planning gap. This signifies a goal for new activities in general, and new
products in particular. The planning gap can be divided into three main elements:
1) Usage gap
This is the gap between the total potential for the market and actual current usage
by all consumers in the market.
Usage gap = market potential – existing usage
Data for this calculation take account of:
- Market usage
- Existing usage
2) Existing usage
Existing consumer usage makes up the total current market, from which market
shares, for example, are calculated. It usually derives from marketing research, from
Chapter 2 Introduction
SPP, School of Pharmacy & Technology Management, NMIMS, Mumbai. 4
panel research and also ad hoc work. Sometimes it may be obtained from figures that
governments or industries have collected. Many, if not most, marketers accept existing
market size—suitably projected their forecast timescales—as the boundary for
expansion plans. Though this is often the most realistic assumption, it may execute an
unnecessary limit on horizons. For example: the original market for video-recorders
was limited to professional users who could afford high prices. Only after some time
did the technology extend to the mass market.
Usage gap is most significant for brand leaders. If a company has a significant
share of the whole market, they may find it worthwhile to invest in making the market
bigger. This option is not generally open to minor players, though they may still profit
by targeting specific offerings as market extensions.
All other gaps relate to the difference between existing sales (market share) and
total sales of the market as a whole. The difference is the competitor share. These gaps
therefore, associate to competitive activity.
3) Product gap
The product gap—also called the segment or positioning gap. This may be
because the market is segmented and the organization does not have offerings in some
segments, or because the organization positions its offerings in a way that effectively
excludes certain potential consumers—because competitive offerings are much
superior positioned for these consumers.
The product gap may be the main element of the planning gap where an
organization can have productive input; hence the weightage on the significance of
correct positioning.
2.2 GAP Analysis Tools
2.2.1 Spreadsheets Analysis
Computer spreadsheets are ideally suited for analyzing gaps in financial outcome. They
let you explore the effects of changes in values you regulate and see the results in the values
that interest to company. For example, if your profits are too low, you can placed all the
individual costs of production and the prices you charge into a spreadsheet. If you practice the
spreadsheet to calculate your profits, changing your prices gives you the effect on profits as
does altering some of the costs. You can govern how much you have to change the prices or
reduce the costs to get the profit you want.
Chapter 2 Introduction
SPP, School of Pharmacy & Technology Management, NMIMS, Mumbai. 5
2.2.2 Fishbone Analysis
Fishbone analysis is suited for perceiving at gaps in production results. The analysis
lists the 6Ms: manpower, methods, metrics, machines, materials and minutes and investigate
how they relate to the central problem. You have to inquire what additional people you require,
what processes like automation, what measurements to check for progress, what equipment,
what specific supplies and how much time. Bringing these fishbones together toward the central
bone bridges the gap.
The fishbone diagram is an analysis tool that gives a systematic way of looking at effects
and the causes that create or contribute to those effects. Because of the function of the fishbone
diagram, it may be referred to as "Problem-Analysis Tool" or the "Cause-&-Effect
Diagram". Dr. Kaoru Ishikawa a Japanese Quality Control Statistician developed the Fish
Bone Diagram in the year 1960. This diagram is used to address all the potential causes (during
the input, or process until the output stage) that result in a single effect (output).
The potential causes could be due to any of the 6(M's), 8 (P's), & 4 (S's)
6M's - Machines, Method, Material, Maintenance, Man & Mother Nature
8P's - Price, Promotion, People, Process, Place, Policy, Procedure, Product
4S's -Surrounding, Suppliers, Systems, Skills
The causes are organized according to their level of importance to recognize the root
cause of a problem (effect).This diagram is valuable for identifying and organizing the
known or possible causes of quality or the lack of it.
Steps to a Fishbone Diagram and to Identifying Those Causes
The fishbone diagram is a simple tool that permits quick and effective root causes to be
understood, in the taking of corrective actions.
Often referred to as a cause and effect diagram, or Ishikawa, it is a simple root cause analysis
tool that is used for brainstorming issues and causes of particular problems and consumed
in conjunction with the 5 Whys tool.
In a fishbone diagram, the various causes are clustered into categories and the causes
cascade from the main categories, flowing towards the effect, forming what bear a
resemblance to a fishbone appearance.
The prime concern is to brainstorm all the possibilities that could cause the problem and
then drill down to the factor(s) that are causing this issue. Once found, eliminate them. It
enables the team to focus on why the problem occurs, and not on the history or symptoms
Chapter 2 Introduction
SPP, School of Pharmacy & Technology Management, NMIMS, Mumbai. 6
of the problem, or other topics that digress from the intent of the session. It also exhibits a
real-time 'snap-shot' of the collective inputs of the team as it is updated.
2.2.3 McKinsey 7S Model
We can use the McKinsey 7S framework when a particular part of the company is not
living up to expectations. The seven aspects McKinsey examines are strategy, structure,
systems, shared values, skills, style and staff. The analysis looks at the characteristics of the
company in terms of each of these aspects and examines how the target group, where the gaps
are, doesn't fit. Once it is clear that the reason for the gaps is a lack of skills, for example, or a
different structure, you can address the problem in a focused way.
Definition of 'McKinsey 7S Model': A model of organizational effectiveness that postulates
that there are seven internal factors of an organization that need to be aligned and reinforced in
order for it to be successful.
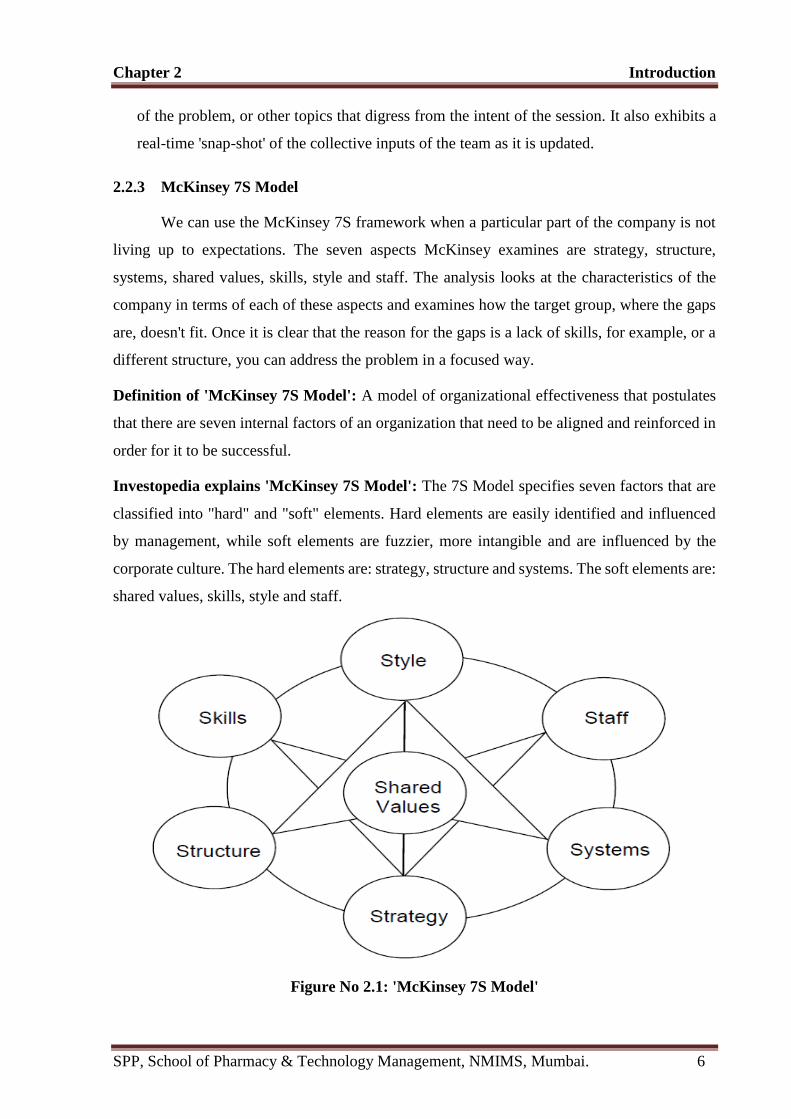
Investopedia explains 'McKinsey 7S Model': The 7S Model specifies seven factors that are
classified into "hard" and "soft" elements. Hard elements are easily identified and influenced
by management, while soft elements are fuzzier, more intangible and are influenced by the
corporate culture. The hard elements are: strategy, structure and systems. The soft elements are:
shared values, skills, style and staff.
Figure No 2.1: 'McKinsey 7S Model'
Chapter 2 Introduction
SPP, School of Pharmacy & Technology Management, NMIMS, Mumbai. 7
2.2.4 SWOT Analysis
SWOT analysis works well when the company has a specific problem and is
looking for ways to solve it. The GAP analysis identifies where the gaps are that
characterize the overall problem. SWOT analysis asks what are the company's strengths,
weaknesses, opportunities and threats. Describing the problem in these terms often
points the way toward a solution by showing you how to avoid potential threats while
using strengths to exploit an opportunity.
The SWOT analysis is an extremely beneficial tool for understanding and decision-
making for all sorts of situations in business and organizations. SWOT is an acronym for
Strengths, Weaknesses, Opportunities, and Threats. Information about the origins and inventors
of SWOT analysis is below. The SWOT analysis headings provide a good framework for
reviewing strategy, position and direction of a company or business proposition, or any other
idea. Completing a SWOT analysis is very simple, and is a good subject for workshop sessions.
SWOT analysis also works well in brainstorming meetings. SWOT analysis is often interpreted
and used as a SWOT Analysis 2x2 Matrix, especially in business and marketing planning.
In addition to this 2x2 matrix method, SWOT analysis is also a widely recognized
method for gathering, structuring, presenting and reviewing extensive planning data within a
larger business or project planning process.
If you use SWOT Analysis as a 2x2 matrix method, then technically Strengths and
Weaknesses are internal factors, whereas Opportunities and Threats are external factors.
The SWOT 2x2 'internal/external' matrix method thus only considers external threats and
opportunities.
A SWOT analysis is a subjective assessment of data which is organized by the SWOT
format into a systematic order that helps understanding, presentation, discussion and decision-
making. SWOT analysis can be used for all sorts of decision-making, and the SWOT template
enables proactive thinking, rather than relying on habitual or instinctive reactions.
Strengths and Weaknesses, are 'mapped' or 'graphed' against Opportunities and
Threats. To enable this to happen cleanly and clearly, and from a logical point of view anyway
when completing a SWOT analysis in most business and marketing situations, Strengths and
Weaknesses are regarded distinctly as internal factors, whereas Opportunities and Threats
are regarded distinctly as external factors. Here is the explanation in more detail:
Chapter 2 Introduction
SPP, School of Pharmacy & Technology Management, NMIMS, Mumbai. 8
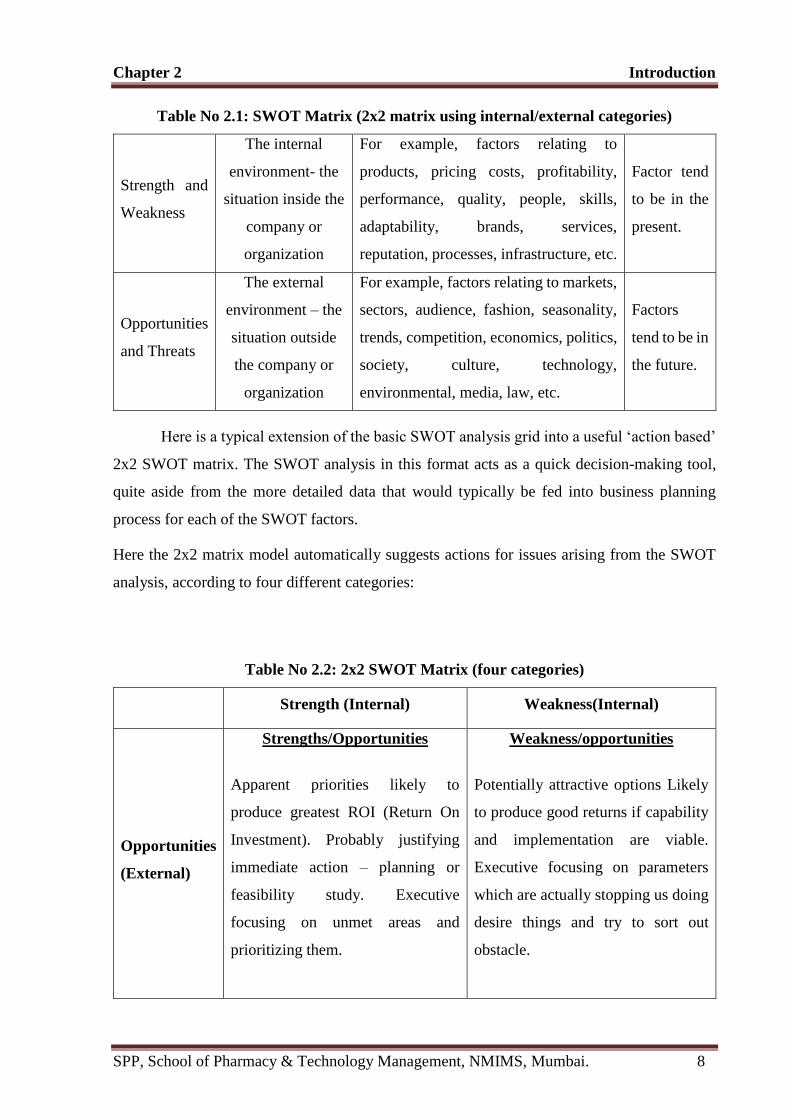
Table No 2.1: SWOT Matrix (2x2 matrix using internal/external categories)
Strength and
Weakness
The internal
environment- the
situation inside the
company or
organization
For example, factors relating to
products, pricing costs, profitability,
performance, quality, people, skills,
adaptability, brands, services,
reputation, processes, infrastructure, etc.
Factor tend
to be in the
present.
Opportunities
and Threats
The external
environment – the
situation outside
the company or
organization
For example, factors relating to markets,
sectors, audience, fashion, seasonality,
trends, competition, economics, politics,
society, culture, technology,
environmental, media, law, etc.
Factors
tend to be in
the future.
Here is a typical extension of the basic SWOT analysis grid into a useful ‘action based’
2x2 SWOT matrix. The SWOT analysis in this format acts as a quick decision-making tool,
quite aside from the more detailed data that would typically be fed into business planning
process for each of the SWOT factors.
Here the 2x2 matrix model automatically suggests actions for issues arising from the SWOT
analysis, according to four different categories:
Table No 2.2: 2x2 SWOT Matrix (four categories)
Strength (Internal) Weakness(Internal)
Opportunities
(External)
Strengths/Opportunities
Apparent priorities likely to
produce greatest ROI (Return On
Investment). Probably justifying
immediate action – planning or
feasibility study. Executive
focusing on unmet areas and
prioritizing them.
Weakness/opportunities
Potentially attractive options Likely
to produce good returns if capability
and implementation are viable.
Executive focusing on parameters
which are actually stopping us doing
desire things and try to sort out
obstacle.
Chapter 2 Introduction
SPP, School of Pharmacy & Technology Management, NMIMS, Mumbai. 9
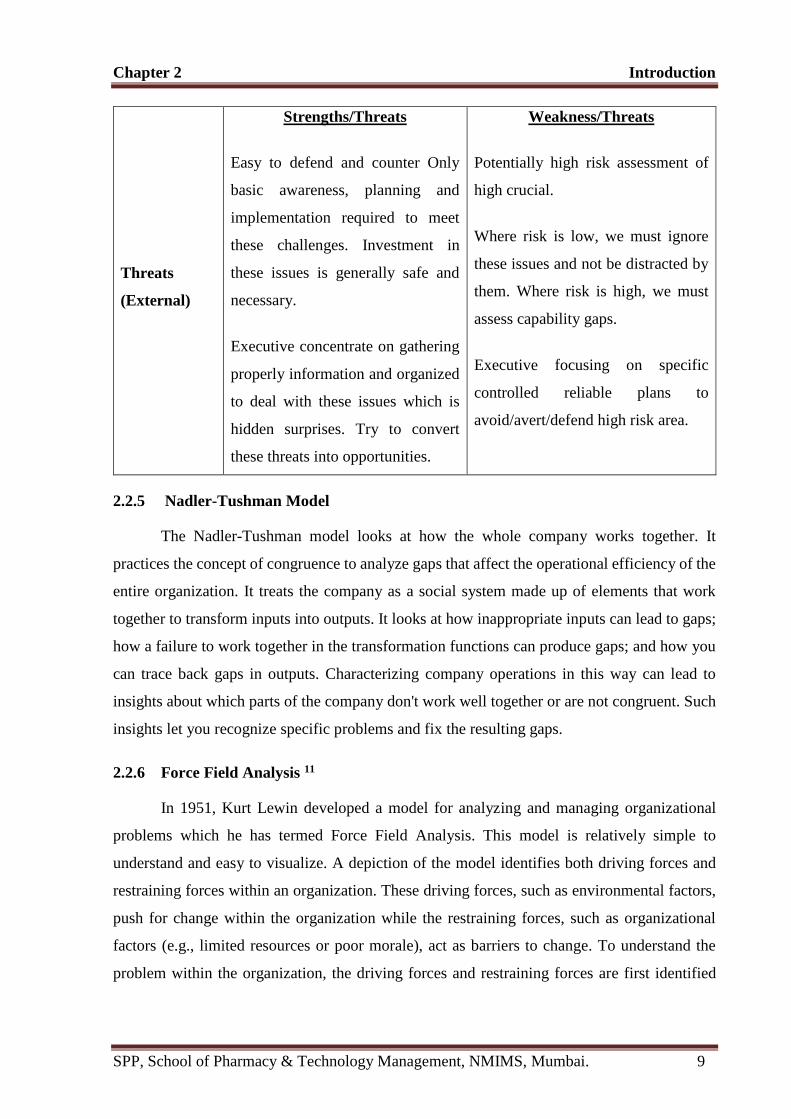
Threats
(External)
Strengths/Threats
Easy to defend and counter Only
basic awareness, planning and
implementation required to meet
these challenges. Investment in
these issues is generally safe and
necessary.
Executive concentrate on gathering
properly information and organized
to deal with these issues which is
hidden surprises. Try to convert
these threats into opportunities.
Weakness/Threats
Potentially high risk assessment of
high crucial.
Where risk is low, we must ignore
these issues and not be distracted by
them. Where risk is high, we must
assess capability gaps.
Executive focusing on specific
controlled reliable plans to
avoid/avert/defend high risk area.
2.2.5 Nadler-Tushman Model
The Nadler-Tushman model looks at how the whole company works together. It
practices the concept of congruence to analyze gaps that affect the operational efficiency of the
entire organization. It treats the company as a social system made up of elements that work
together to transform inputs into outputs. It looks at how inappropriate inputs can lead to gaps;
how a failure to work together in the transformation functions can produce gaps; and how you
can trace back gaps in outputs. Characterizing company operations in this way can lead to
insights about which parts of the company don't work well together or are not congruent. Such
insights let you recognize specific problems and fix the resulting gaps.
2.2.6 Force Field Analysis 11
In 1951, Kurt Lewin developed a model for analyzing and managing organizational
problems which he has termed Force Field Analysis. This model is relatively simple to
understand and easy to visualize. A depiction of the model identifies both driving forces and
restraining forces within an organization. These driving forces, such as environmental factors,
push for change within the organization while the restraining forces, such as organizational
factors (e.g., limited resources or poor morale), act as barriers to change. To understand the
problem within the organization, the driving forces and restraining forces are first identified
Chapter 2 Introduction
SPP, School of Pharmacy & Technology Management, NMIMS, Mumbai. 10
and, hence, defined. Goals and strategies for moving the equilibrium of the organization toward
the desired direction can then be planned.
The model relies upon the change process, with the social implications built into the
model (e.g. disequilibrium is expected to occur until equilibrium is reestablished). The general
goal of this model is to intentionally move to a desirable state of equilibrium by adding driving
forces and eliminating restraining forces. These changes are thought to occur simultaneously
within the dynamic organization.
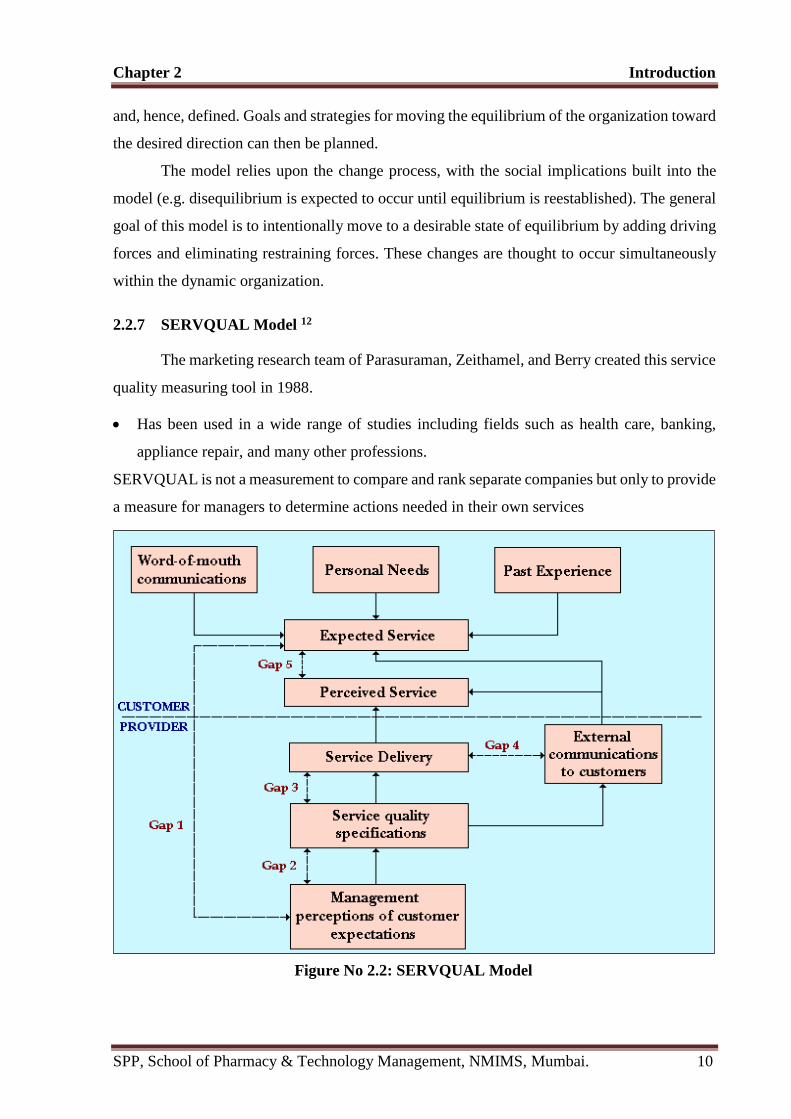
2.2.7 SERVQUAL Model 12
The marketing research team of Parasuraman, Zeithamel, and Berry created this service
quality measuring tool in 1988.
Has been used in a wide range of studies including fields such as health care, banking,
appliance repair, and many other professions.
SERVQUAL is not a measurement to compare and rank separate companies but only to provide
a measure for managers to determine actions needed in their own services
Figure No 2.2: SERVQUAL Model
Chapter 2 Introduction
SPP, School of Pharmacy & Technology Management, NMIMS, Mumbai. 11
Five Gaps include
Customer expectations vs. managerial perceptions
Manager’s expectations of quality vs. quality specs
Communication with customer at point of service or sale
Service delivery vs. communication
Perceived services vs. expected services
Table No 2.3: Details and cause of Service GAP
GAP Problem Cause(s)
1. Consumer
expectation – Mgmt.
perception
The offered service features
don’t meet customer needs
Lack of marketing research;
inadequate upward communication;
too many levels between contact
personnel and management
2. Management
perception – Service
quality specification
The service specifications
defined do not meet
management’s perceptions of
customer expectations
Resource constraints; management
indifference; poor service design
3. Service quality
specification –
Service delivery
Specifications for service
meet customer needs but
service delivery is not
consistent with those
specifications
Employee performance is not
standardized; customer perceptions
are not uniform
4. Service delivery –
External
communication
The service does not meet
customer expectations, which
have been influenced by
external communication
Marketing message is not consistent
with actual service offering;
promising more than can be
delivered
5. Expected service
– Perceived service
Customer judgments of
high/low quality based on
expectations vs. actual
service
A function of the magnitude and
direction of the gap between
expected service and perceived
service
Chapter 2 Introduction
SPP, School of Pharmacy & Technology Management, NMIMS, Mumbai. 12
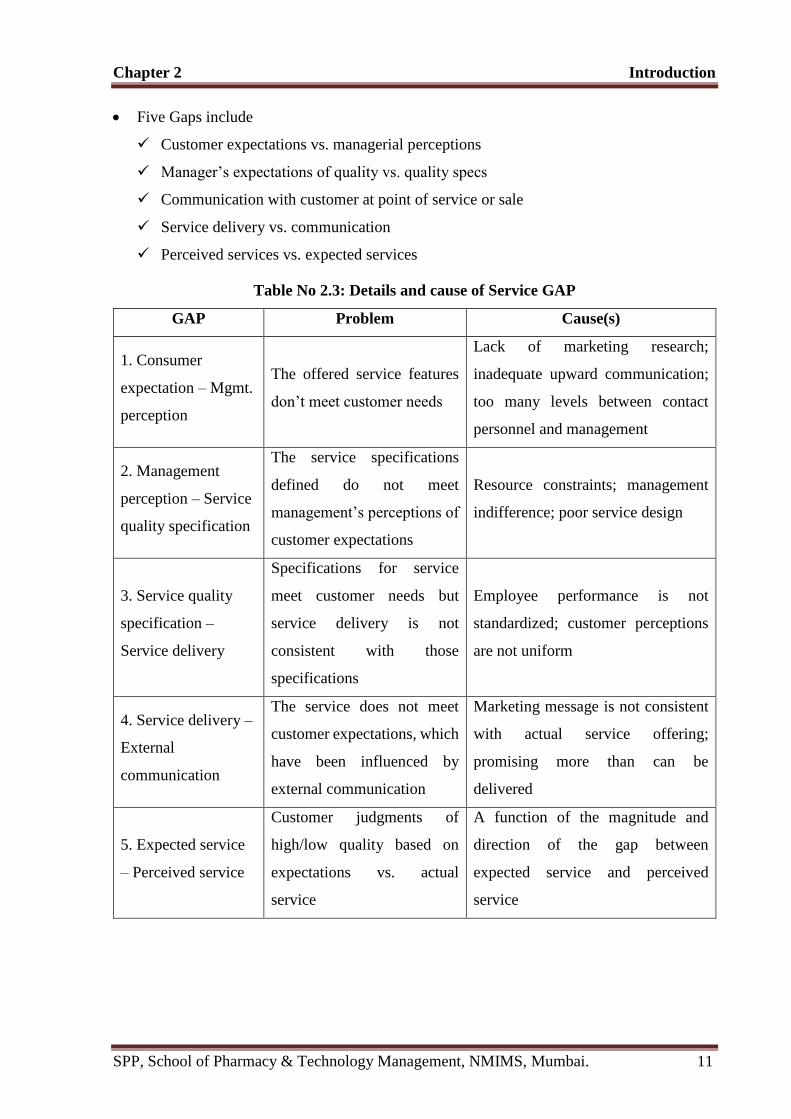
2.2.8 Weisbord’s Six-Box Model 13
Weisbord (1976) proposes six broad categories in his model of organizational life,
including purposes, structures, relationships, leadership, rewards, and helpful mechanisms. The
purposes of an organization are the organization’s mission and goals. Weisbord refers to
structure as the way in which the organization is organized; this may be by function – where
specialists work together – or by product, program, or project – where multi-skilled teams work
together. The ways in which people and units interact is termed relationships. Also included in
the box of relationships is the way in which people interact with technology in their work.
Rewards are the intrinsic and extrinsic rewards people associate with their work. The leadership
box refers to typical leadership tasks, including the balance between the other boxes. Finally,
the helping mechanisms are the planning, controlling, budgeting, and information systems that
serve to meet organizational goals. The external environment is also represented in Weisbord’s
model, although it is not represented as a “box”
Figure No 2.3: Weisbord’s Six-Box Model
The shape of the model was also designed to illustrate the interdependency of the
variables; the illustration of the model has been termed the “Managerial Molecule.” While the
authors thought that other variables existed within complex organizations, the variables
represented in the model were considered to be of crucial importance to managers and
practitioners.
Chapter 2 Introduction
SPP, School of Pharmacy & Technology Management, NMIMS, Mumbai. 13
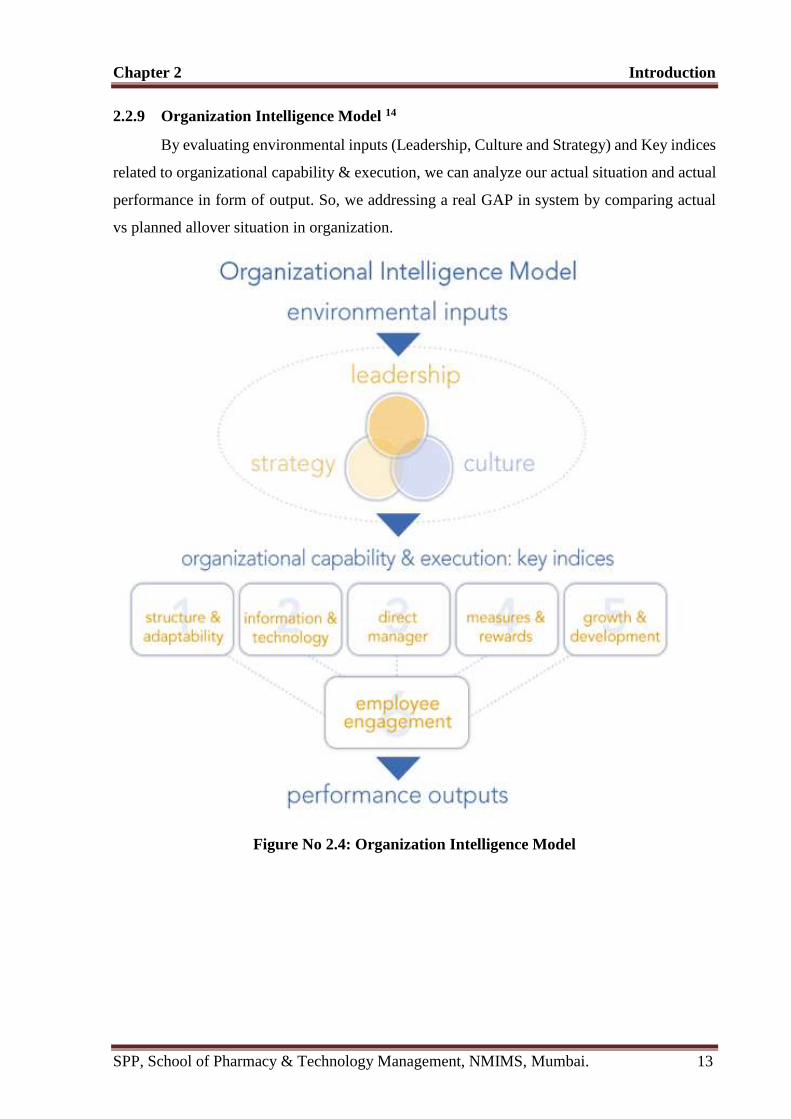
2.2.9 Organization Intelligence Model 14
By evaluating environmental inputs (Leadership, Culture and Strategy) and Key indices
related to organizational capability & execution, we can analyze our actual situation and actual
performance in form of output. So, we addressing a real GAP in system by comparing actual
vs planned allover situation in organization.
Figure No 2.4: Organization Intelligence Model
Chapter 2 Introduction
SPP, School of Pharmacy & Technology Management, NMIMS, Mumbai. 14
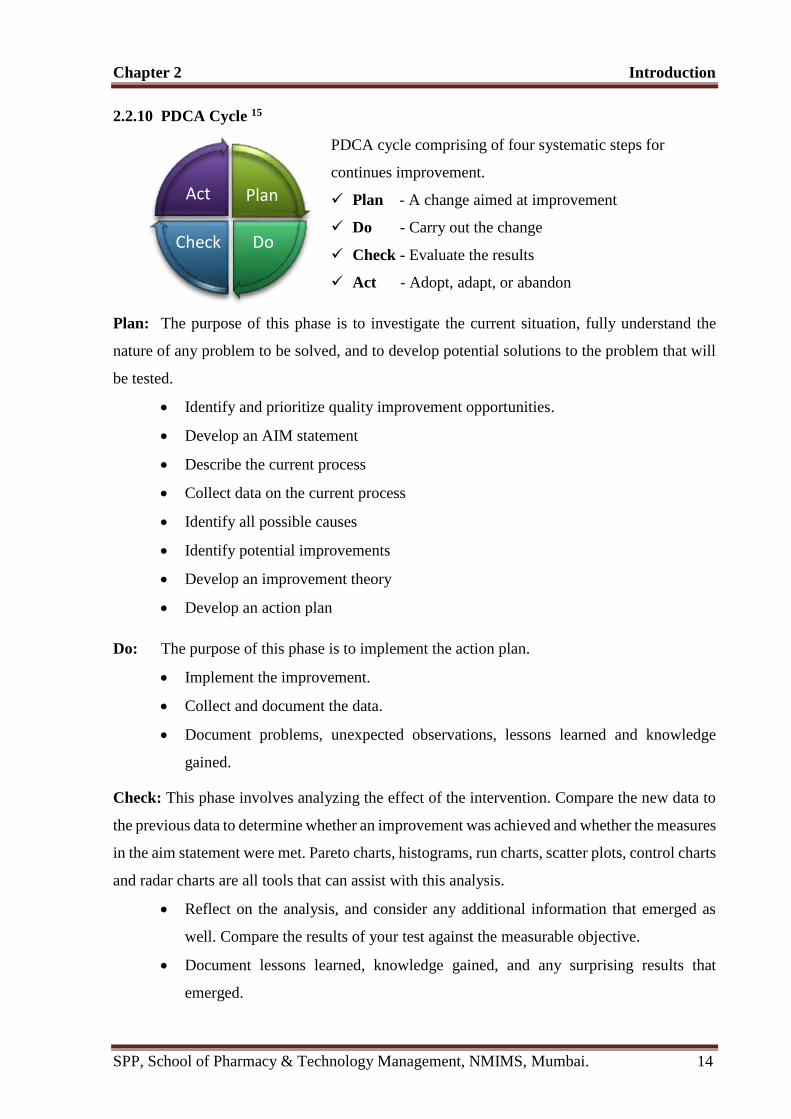
2.2.10 PDCA Cycle 15
PDCA cycle comprising of four systematic steps for
continues improvement.
Plan - A change aimed at improvement
Do - Carry out the change
Check - Evaluate the results
Act - Adopt, adapt, or abandon
Plan: The purpose of this phase is to investigate the current situation, fully understand the
nature of any problem to be solved, and to develop potential solutions to the problem that will
be tested.
Identify and prioritize quality improvement opportunities.
Develop an AIM statement
Describe the current process
Collect data on the current process
Identify all possible causes
Identify potential improvements
Develop an improvement theory
Develop an action plan
Do: The purpose of this phase is to implement the action plan.
Implement the improvement.
Collect and document the data.
Document problems, unexpected observations, lessons learned and knowledge
gained.
Check: This phase involves analyzing the effect of the intervention. Compare the new data to
the previous data to determine whether an improvement was achieved and whether the measures
in the aim statement were met. Pareto charts, histograms, run charts, scatter plots, control charts
and radar charts are all tools that can assist with this analysis.
Reflect on the analysis, and consider any additional information that emerged as
well. Compare the results of your test against the measurable objective.
Document lessons learned, knowledge gained, and any surprising results that
emerged.
Plan
DoCheck
Act
Chapter 2 Introduction
SPP, School of Pharmacy & Technology Management, NMIMS, Mumbai. 15
Act: This phase marks the culmination of the planning, testing, and analysis regarding
whether the desired improvement was achieved as articulated in the aim statement, and the
purpose is to act upon what has been learned. Options include:
Adopt
Adapt
Abandon
PDCA offers a data-based framework based on the scientific method. This simple yet powerful
format drives continuous and ongoing efforts to achieve measurable improvements in the
efficiency, effectiveness, performance, accountability, outcomes, and other indicators of quality
in services or processes.
2.3 Objective of Production GAP Analysis
The objective of Production GAP Analysis is to find out the GAP and to clearly elicit
the requirements to bridge the GAP, estimate the timelines to address them and perform a
comprehensive impact analysis. It required making no GAP for the business organization and
making more efficient Production in terms of quantity, quality and revenue through adapting
effective approaches in organization, like :-
Maximum the use of all resources of organization and gaining a greater share of the
Market. (Achieve desire productivity)
Maintain flow in production process with minimum waiting and setup time
Maintain inventory level
2.4 Function
The function of GAP analysis is to ask upper management two basic questions about
the organization: Where are we now? Where do we want to be in the future? To make the move
towards the future desired state, a company must develop and implement quantifiable and
measurable success factors that reflect the difference between success and failure of the
organization. If accomplished, a solid critical success factor should establish a competitive
advantage over the competition in the marketplace.
Chapter 2 Introduction
SPP, School of Pharmacy & Technology Management, NMIMS, Mumbai. 16
2.5 Significance
GAP analysis looks to improve inefficient business processes by optimizing allocation
of all resources and inputs. Many companies are performing below their potential because they
either misuse resources or lack the correct investment in technology or capital. GAP analysis
highlights these inefficiencies and offers recommendations for improvement.
2.6 Benefits
Correct GAP analysis should increase an organization’s production and performance,
resulting in higher-quality products at a lower total cost - that means enhancing overall
productivity. GAP analysis also measures the amount of time, money and resources needed to
fulfill an organization’s potential and reach the desired state.
2.7 Requirements
The fundamental requirement of GAP analysis is consistent, proactive and effective
management throughout the planning, implementation and transformation stages of the
analytical process. The planning stage and the extensive research required during this stage is
the foundation of successful GAP analysis. The research needs to focus on both the internal
operations of the organization as well as the external business environment. This research
provides the necessary knowledge about the current state of internal operations as well as
information about aspects such as market trends, consumer demands and competition, through
the process of benchmarking. Benchmarking is a useful tool companies use to compare
themselves to companies similar in nature that provides information and guidelines to what is
a realistic desired state for the business.
2.8 Research Limitation
Research reached at its aims for production GAP analysis. Although this research was carefully
prepared, I am still aware of its limitations and shortcomings. First of all, the research was
conducted in 4.5 months and for 25 products. Twenty weeks is not enough for the researcher to
observe the entire GAP. It would be better if it was done in a longer time. Second, Gap Analysis
can be goes to depth of the product processes by which the Gap can be identified but the
Pharmaceutical sectors are avoiding to share the product process as per there business concern.
Chapter 2 Introduction
SPP, School of Pharmacy & Technology Management, NMIMS, Mumbai. 17
2.9 Literature Review
Patil R. P. and Shakthi P. M. R., (2011) [1], reported critical problems which are faced by
company and how to enhance productivity and measure in pharmaceutical industry.
Other Reference gives idea related to problems which are faced by current manufacturing
facility, what is actual GAPs in Manufacturing firms, methods which are going to use for actual
GAP analysis and key improvement strategy used for achieving desire productivity and
fulfilling GAPs. [2-15]
2.10 Research Methodology
The GAP analysis also can be used to analyze GAPs in processes and the GAP between the
existing outcome and the desired outcome. This step process can be summarized as below:
1) Literature review and Discussion related finalization of project and all key aspects.
2) Identify and understanding of know-how of overall existing process for production in plant.
3) Identify the existing outcome from Production.
4) Identify and document desired outcome & process to achieve the desired outcome.
5) Identify GAP, document the GAP.
6) Develop the means to fill the GAP.
7) Develop and prioritize requirements to bridge the GAP.
8) Try to collect survey regarding readiness of accept key means to fulfilling GAP which
improve productivity. (Survey collect from line manager)
9) Compilation of data and result interpretation.
10) Deliver presentation regarding key recommendation which helps to meet desire output
without any disturbance in execution of planned production. (Improve productivity)
Chapter 3 Research Work and Discussion
SPP, School of Pharmacy & Technology Management, NMIMS, Mumbai. 18
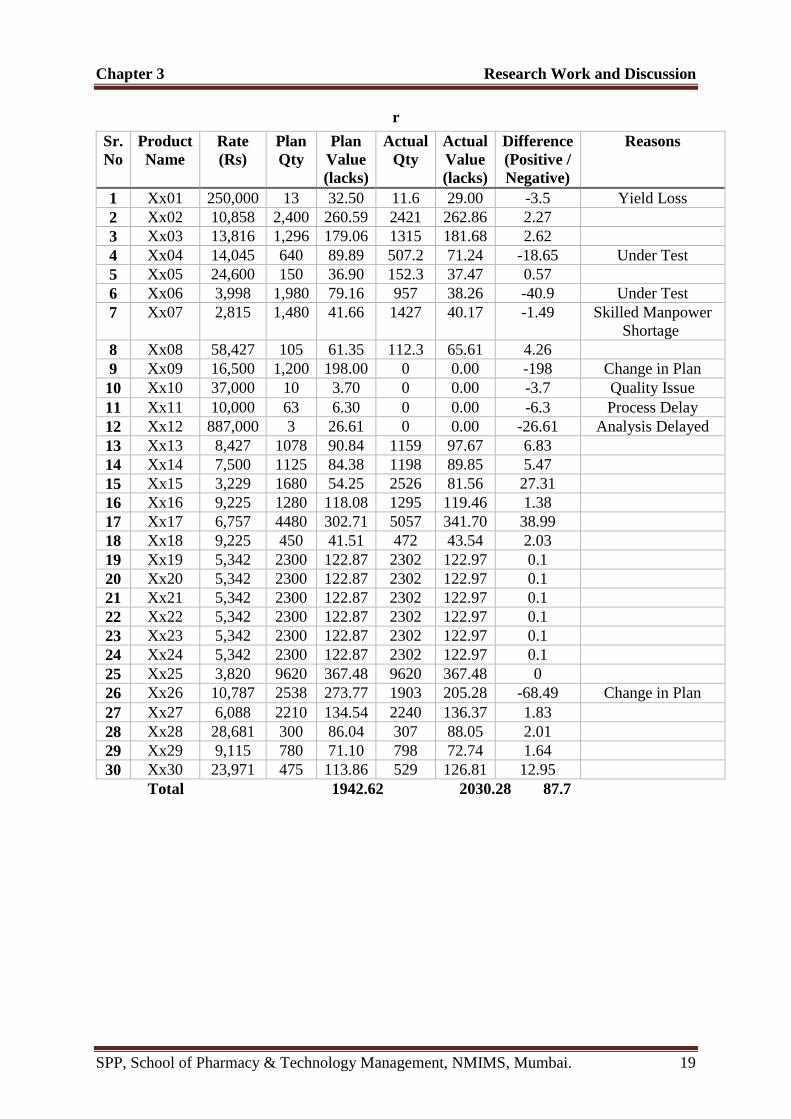
PRODUCTION PROCESS IN ZYDUS CADILA HEALTHCARE LTD.
The company production is based upon the forecasting by business
development team. After getting the forecast the production targets are decided in monthly
basis by production planning meeting (the gathering of all supporting departments).all the
products are manufactured in batch process which are fixed as per the research development
team and filed as drug masters.
Let us take some current and earlier production figures to analyze the production variations
as well as reasons behind production variations.
Chapter 3 Research Work and Discussion
SPP, School of Pharmacy & Technology Management, NMIMS, Mumbai. 19
r
Total 1942.62 2030.28 87.7
Sr.
No
Product
Name
Rate
(Rs)
Plan
Qty
Plan
Value
(lacks)
Actual
Qty
Actual
Value
(lacks)
Difference
(Positive /
Negative)
Reasons
1 Xx01 250,000 13 32.50 11.6 29.00 -3.5 Yield Loss
2 Xx02 10,858 2,400 260.59 2421 262.86 2.27
3 Xx03 13,816 1,296 179.06 1315 181.68 2.62
4 Xx04 14,045 640 89.89 507.2 71.24 -18.65 Under Test
5 Xx05 24,600 150 36.90 152.3 37.47 0.57
6 Xx06 3,998 1,980 79.16 957 38.26 -40.9 Under Test
7 Xx07 2,815 1,480 41.66 1427 40.17 -1.49 Skilled Manpower
Shortage
8 Xx08 58,427 105 61.35 112.3 65.61 4.26
9 Xx09 16,500 1,200 198.00 0 0.00 -198 Change in Plan
10 Xx10 37,000 10 3.70 0 0.00 -3.7 Quality Issue
11 Xx11 10,000 63 6.30 0 0.00 -6.3 Process Delay
12 Xx12 887,000 3 26.61 0 0.00 -26.61 Analysis Delayed
13 Xx13 8,427 1078 90.84 1159 97.67 6.83
14 Xx14 7,500 1125 84.38 1198 89.85 5.47
15 Xx15 3,229 1680 54.25 2526 81.56 27.31
16 Xx16 9,225 1280 118.08 1295 119.46 1.38
17 Xx17 6,757 4480 302.71 5057 341.70 38.99
18 Xx18 9,225 450 41.51 472 43.54 2.03
19 Xx19 5,342 2300 122.87 2302 122.97 0.1
20 Xx20 5,342 2300 122.87 2302 122.97 0.1
21 Xx21 5,342 2300 122.87 2302 122.97 0.1
22 Xx22 5,342 2300 122.87 2302 122.97 0.1
23 Xx23 5,342 2300 122.87 2302 122.97 0.1
24 Xx24 5,342 2300 122.87 2302 122.97 0.1
25 Xx25 3,820 9620 367.48 9620 367.48 0
26 Xx26 10,787 2538 273.77 1903 205.28 -68.49 Change in Plan
27 Xx27 6,088 2210 134.54 2240 136.37 1.83
28 Xx28 28,681 300 86.04 307 88.05 2.01
29 Xx29 9,115 780 71.10 798 72.74 1.64
30 Xx30 23,971 475 113.86 529 126.81 12.95
Chapter 3 Research Work and Discussion
SPP, School of Pharmacy & Technology Management, NMIMS, Mumbai. 20
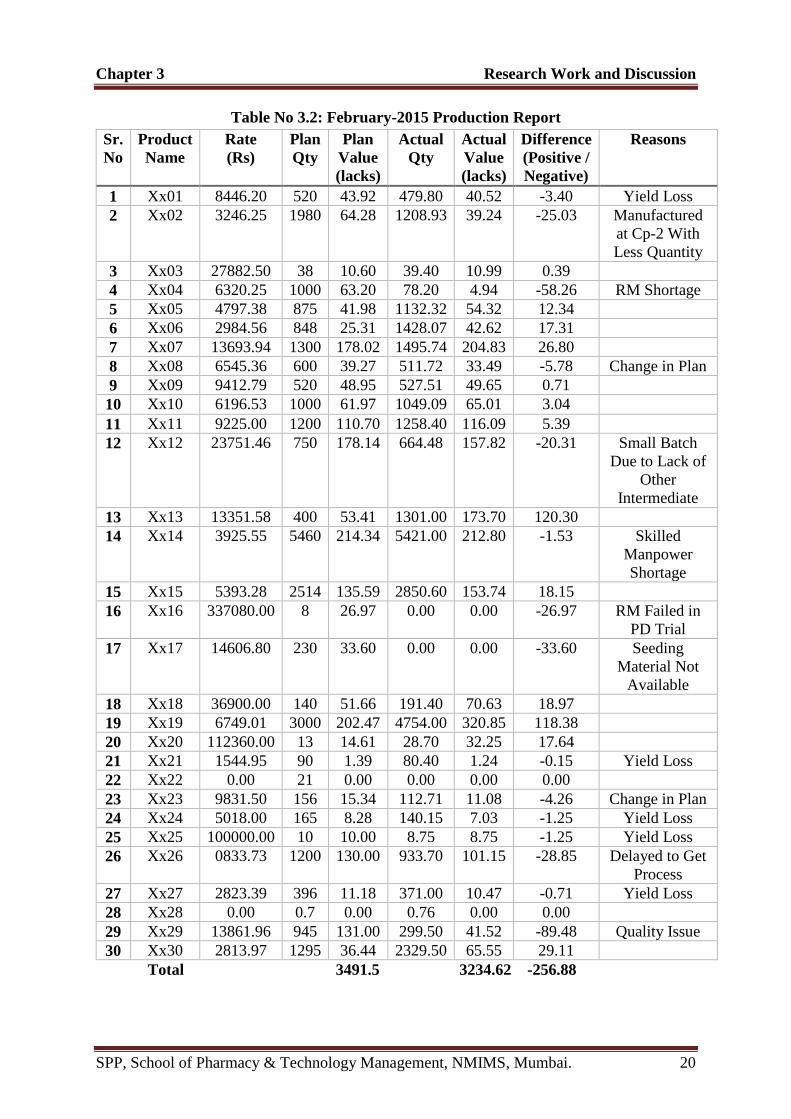
Table No 3.2: February-2015 Production Report
Total 3491.5 3234.62 -256.88
Sr.
No
Product
Name
Rate
(Rs)
Plan
Qty
Plan
Value
(lacks)
Actual
Qty
Actual
Value
(lacks)
Difference
(Positive /
Negative)
Reasons
1 Xx01 8446.20 520 43.92 479.80 40.52 -3.40 Yield Loss
2 Xx02 3246.25 1980 64.28 1208.93 39.24 -25.03 Manufactured
at Cp-2 With
Less Quantity
3 Xx03 27882.50 38 10.60 39.40 10.99 0.39
4 Xx04 6320.25 1000 63.20 78.20 4.94 -58.26 RM Shortage
5 Xx05 4797.38 875 41.98 1132.32 54.32 12.34
6 Xx06 2984.56 848 25.31 1428.07 42.62 17.31
7 Xx07 13693.94 1300 178.02 1495.74 204.83 26.80
8 Xx08 6545.36 600 39.27 511.72 33.49 -5.78 Change in Plan
9 Xx09 9412.79 520 48.95 527.51 49.65 0.71
10 Xx10 6196.53 1000 61.97 1049.09 65.01 3.04
11 Xx11 9225.00 1200 110.70 1258.40 116.09 5.39
12 Xx12 23751.46 750 178.14 664.48 157.82 -20.31 Small Batch
Due to Lack of
Other
Intermediate
13 Xx13 13351.58 400 53.41 1301.00 173.70 120.30
14 Xx14 3925.55 5460 214.34 5421.00 212.80 -1.53 Skilled
Manpower
Shortage
15 Xx15 5393.28 2514 135.59 2850.60 153.74 18.15
16 Xx16 337080.00 8 26.97 0.00 0.00 -26.97 RM Failed in
PD Trial
17 Xx17 14606.80 230 33.60 0.00 0.00 -33.60 Seeding
Material Not
Available
18 Xx18 36900.00 140 51.66 191.40 70.63 18.97
19 Xx19 6749.01 3000 202.47 4754.00 320.85 118.38
20 Xx20 112360.00 13 14.61 28.70 32.25 17.64
21 Xx21 1544.95 90 1.39 80.40 1.24 -0.15 Yield Loss
22 Xx22 0.00 21 0.00 0.00 0.00 0.00
23 Xx23 9831.50 156 15.34 112.71 11.08 -4.26 Change in Plan
24 Xx24 5018.00 165 8.28 140.15 7.03 -1.25 Yield Loss
25 Xx25 100000.00 10 10.00 8.75 8.75 -1.25 Yield Loss
26 Xx26 0833.73 1200 130.00 933.70 101.15 -28.85 Delayed to Get
Process
27 Xx27 2823.39 396 11.18 371.00 10.47 -0.71 Yield Loss
28 Xx28 0.00 0.7 0.00 0.76 0.00 0.00
29 Xx29 13861.96 945 131.00 299.50 41.52 -89.48 Quality Issue
30 Xx30 2813.97 1295 36.44 2329.50 65.55 29.11
Chapter 3 Research Work and Discussion
SPP, School of Pharmacy & Technology Management, NMIMS, Mumbai. 21
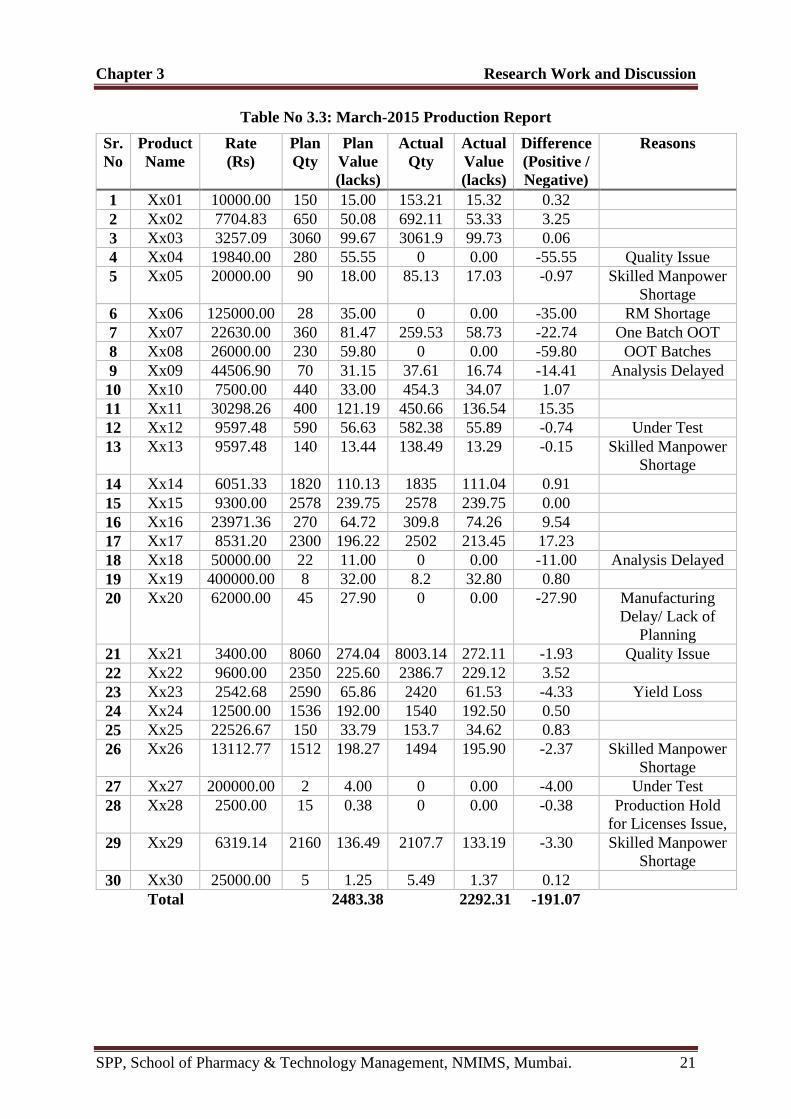
Table No 3.3: March-2015 Production Report
Total 2483.38 2292.31 -191.07
Sr.
No
Product
Name
Rate
(Rs)
Plan
Qty
Plan
Value
(lacks)
Actual
Qty
Actual
Value
(lacks)
Difference
(Positive /
Negative)
Reasons
1 Xx01 10000.00 150 15.00 153.21 15.32 0.32
2 Xx02 7704.83 650 50.08 692.11 53.33 3.25
3 Xx03 3257.09 3060 99.67 3061.9 99.73 0.06
4 Xx04 19840.00 280 55.55 0 0.00 -55.55 Quality Issue
5 Xx05 20000.00 90 18.00 85.13 17.03 -0.97 Skilled Manpower
Shortage
6 Xx06 125000.00 28 35.00 0 0.00 -35.00 RM Shortage
7 Xx07 22630.00 360 81.47 259.53 58.73 -22.74 One Batch OOT
8 Xx08 26000.00 230 59.80 0 0.00 -59.80 OOT Batches
9 Xx09 44506.90 70 31.15 37.61 16.74 -14.41 Analysis Delayed
10 Xx10 7500.00 440 33.00 454.3 34.07 1.07
11 Xx11 30298.26 400 121.19 450.66 136.54 15.35
12 Xx12 9597.48 590 56.63 582.38 55.89 -0.74 Under Test
13 Xx13 9597.48 140 13.44 138.49 13.29 -0.15 Skilled Manpower
Shortage
14 Xx14 6051.33 1820 110.13 1835 111.04 0.91
15 Xx15 9300.00 2578 239.75 2578 239.75 0.00
16 Xx16 23971.36 270 64.72 309.8 74.26 9.54
17 Xx17 8531.20 2300 196.22 2502 213.45 17.23
18 Xx18 50000.00 22 11.00 0 0.00 -11.00 Analysis Delayed
19 Xx19 400000.00 8 32.00 8.2 32.80 0.80
20 Xx20 62000.00 45 27.90 0 0.00 -27.90 Manufacturing
Delay/ Lack of
Planning
21 Xx21 3400.00 8060 274.04 8003.14 272.11 -1.93 Quality Issue
22 Xx22 9600.00 2350 225.60 2386.7 229.12 3.52
23 Xx23 2542.68 2590 65.86 2420 61.53 -4.33 Yield Loss
24 Xx24 12500.00 1536 192.00 1540 192.50 0.50
25 Xx25 22526.67 150 33.79 153.7 34.62 0.83
26 Xx26 13112.77 1512 198.27 1494 195.90 -2.37 Skilled Manpower
Shortage
27 Xx27 200000.00 2 4.00 0 0.00 -4.00 Under Test
28 Xx28 2500.00 15 0.38 0 0.00 -0.38 Production Hold
for Licenses Issue,
29 Xx29 6319.14 2160 136.49 2107.7 133.19 -3.30 Skilled Manpower
Shortage
30 Xx30 25000.00 5 1.25 5.49 1.37 0.12
Chapter 3 Research Work and Discussion
SPP, School of Pharmacy & Technology Management, NMIMS, Mumbai. 22
3.1 Production GAP Analysis Tools
3.1.1 Spreadsheet Analysis
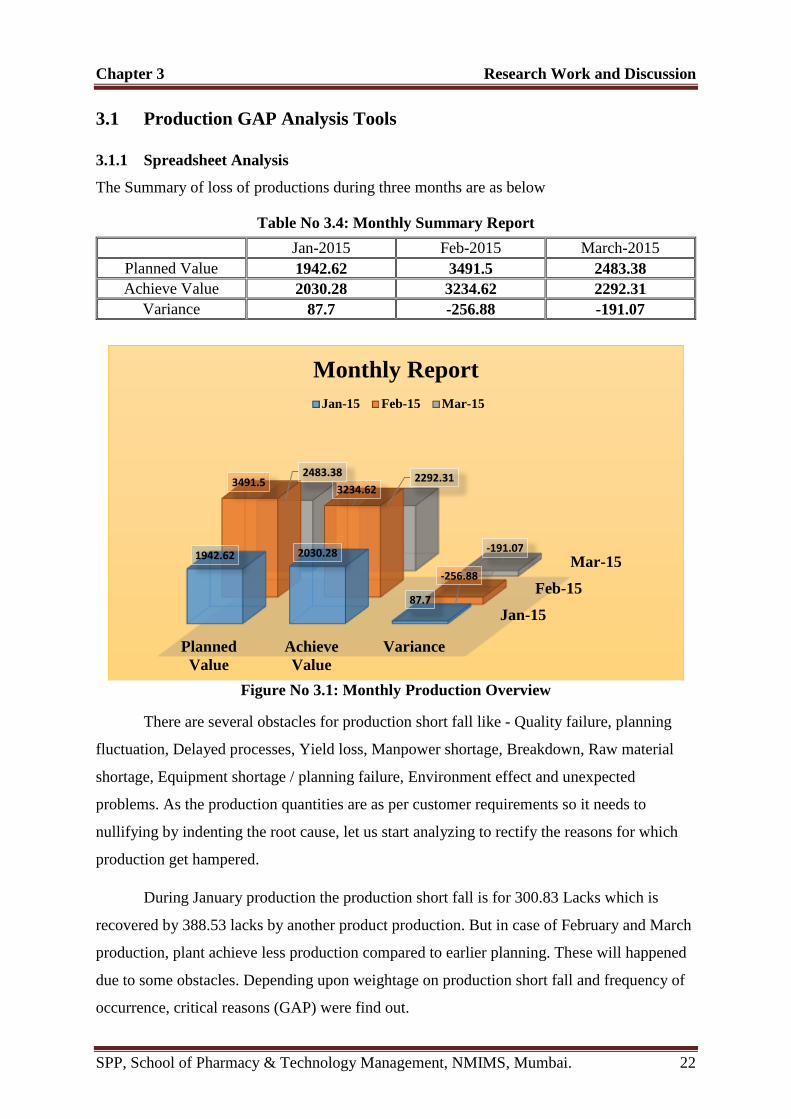
The Summary of loss of productions during three months are as below
Table No 3.4: Monthly Summary Report
There are several obstacles for production short fall like - Quality failure, planning
fluctuation, Delayed processes, Yield loss, Manpower shortage, Breakdown, Raw material
shortage, Equipment shortage / planning failure, Environment effect and unexpected
problems. As the production quantities are as per customer requirements so it needs to
nullifying by indenting the root cause, let us start analyzing to rectify the reasons for which
production get hampered.
During January production the production short fall is for 300.83 Lacks which is
recovered by 388.53 lacks by another product production. But in case of February and March
production, plant achieve less production compared to earlier planning. These will happened
due to some obstacles. Depending upon weightage on production short fall and frequency of
occurrence, critical reasons (GAP) were find out.
Jan-2015 Feb-2015 March-2015
Planned Value 1942.62 3491.5 2483.38
Achieve Value 2030.28 3234.62 2292.31
Variance 87.7 -256.88 -191.07
Jan-15
Feb-15
Mar-15
Planned
Value
Achieve
Value
Variance
1942.62 2030.28
87.7
3491.53234.62
-256.88
2483.38 2292.31
-191.07
Monthly Report
Jan-15 Feb-15 Mar-15
Figure No 3.1: Monthly Production Overview
Chapter 3 Research Work and Discussion
SPP, School of Pharmacy & Technology Management, NMIMS, Mumbai. 23
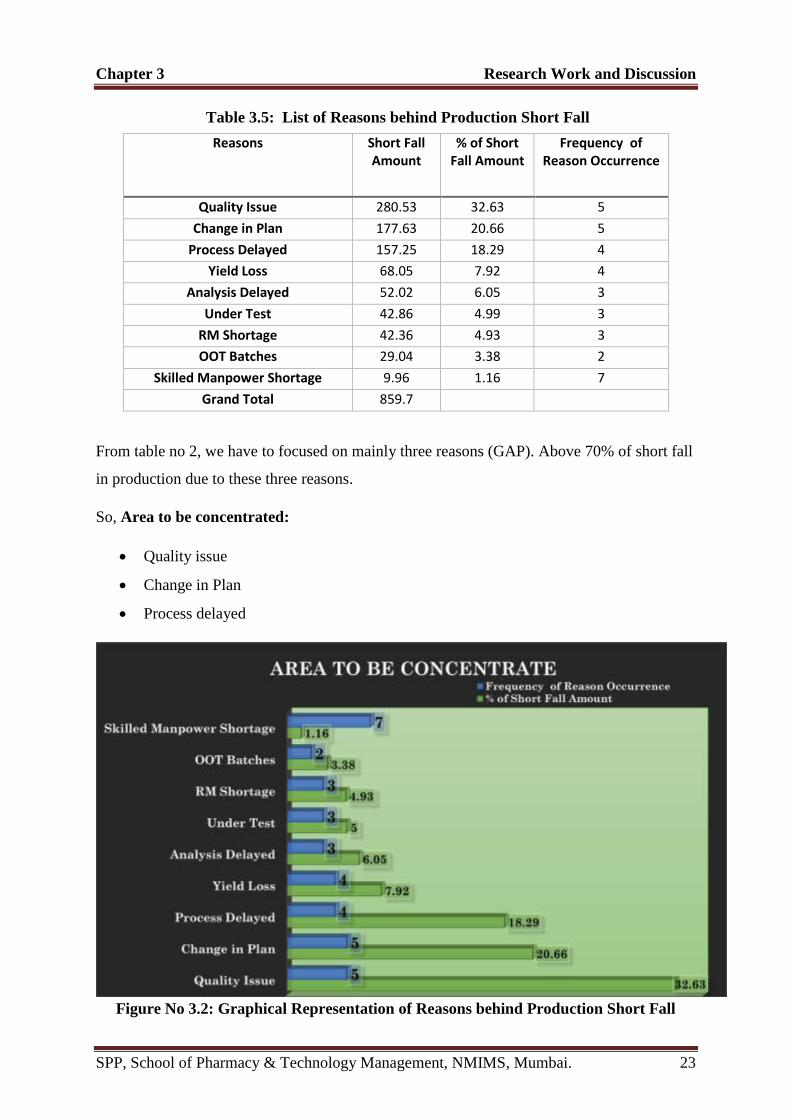
Table 3.5: List of Reasons behind Production Short Fall
From table no 2, we have to focused on mainly three reasons (GAP). Above 70% of short fall
in production due to these three reasons.
So, Area to be concentrated:
Quality issue
Change in Plan
Process delayed
Figure No 3.2: Graphical Representation of Reasons behind Production Short Fall
Reasons Short Fall Amount
% of Short Fall Amount
Frequency of Reason Occurrence
Quality Issue 280.53 32.63 5
Change in Plan 177.63 20.66 5
Process Delayed 157.25 18.29 4
Yield Loss 68.05 7.92 4
Analysis Delayed 52.02 6.05 3
Under Test 42.86 4.99 3
RM Shortage 42.36 4.93 3
OOT Batches 29.04 3.38 2
Skilled Manpower Shortage 9.96 1.16 7
Grand Total 859.7
Chapter 3 Research Work and Discussion
SPP, School of Pharmacy & Technology Management, NMIMS, Mumbai. 24
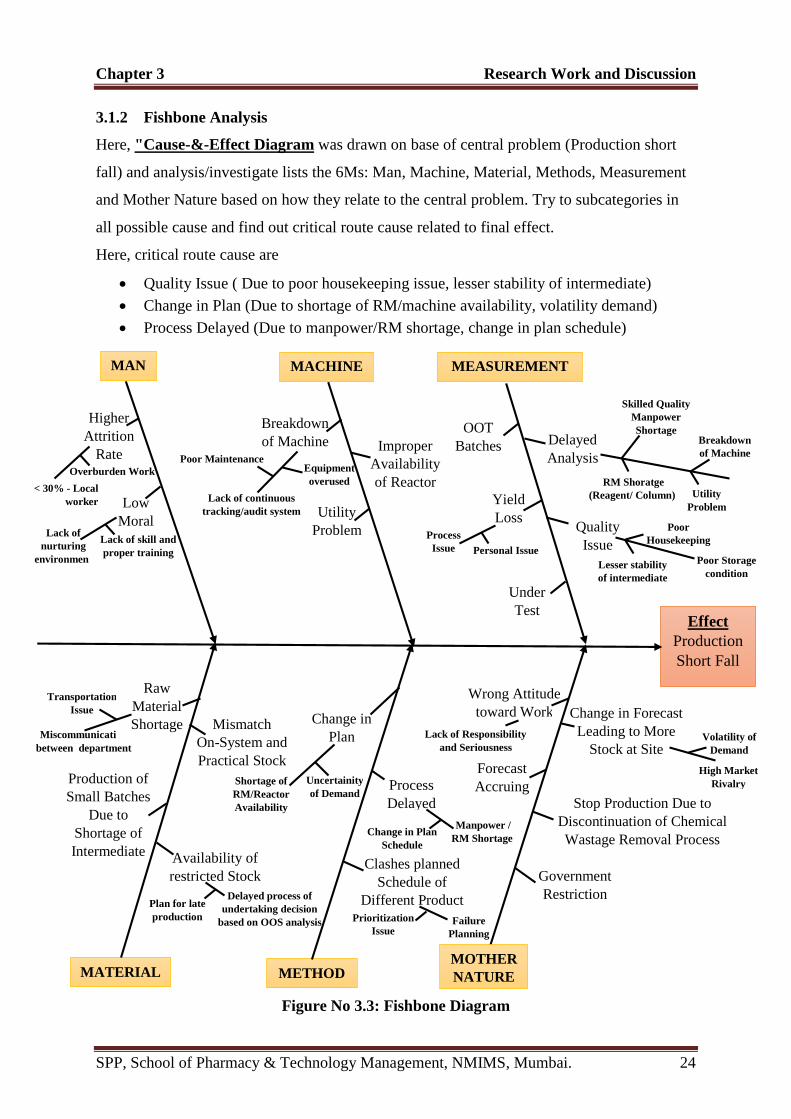
3.1.2 Fishbone Analysis
Here, "Cause-&-Effect Diagram was drawn on base of central problem (Production short
fall) and analysis/investigate lists the 6Ms: Man, Machine, Material, Methods, Measurement
and Mother Nature based on how they relate to the central problem. Try to subcategories in
all possible cause and find out critical route cause related to final effect.
Here, critical route cause are
Quality Issue ( Due to poor housekeeping issue, lesser stability of intermediate)
Change in Plan (Due to shortage of RM/machine availability, volatility demand)
Process Delayed (Due to manpower/RM shortage, change in plan schedule)
Figure No 3.3: Fishbone Diagram
Prioritization
Issue
Lack of
nurturing
environment
Poor Maintenance
Lack of Responsibility
and Seriousness
Wrong Attitude
toward Work
Forecast
Accruing
Failure
Planning
OOT
Batches
Personal Issue
Process
Issue
High Market
Rivalry
Volatility of
Demand
Uncertainity
of Demand
Shortage of
RM/Reactor
Availability
Miscommunication
between department
Transportation
Issue
Plan for late
production
Delayed process of
undertaking decision
based on OOS analysis
Change in Plan
Schedule
Manpower /
RM Shortage
Government
Restriction
< 30% - Local
worker
Overburden Work
Lack of skill and
proper training Poor Storage
condition Lesser stability
of intermediate
Poor
Housekeeping
Equipment
overused
Utility
Problem
Delayed
Analysis
Skilled Quality
Manpower
Shortage
RM Shoratge
(Reagent/ Column)
Stop Production Due to
Discontinuation of Chemical
Wastage Removal Process
Change in Forecast
Leading to More
Stock at Site
Clashes planned
Schedule of
Different Product
Process
Delayed
Change in
Plan
Production of
Small Batches
Due to
Shortage of
Intermediate Availability of
restricted Stock
Mismatch
On-System and
Practical Stock
Raw
Material
Shortage
Under
Test
Quality
Issue
Yield
Loss
Improper
Availability
of Reactor
Utility
Problem
Breakdown
of Machine
Higher
Attrition
Rate
Low
Moral
Effect
Production
Short Fall
MAN MACHINE MEASUREMENT
MATERIAL METHOD
Breakdown
of Machine
Lack of continuous
tracking/audit system
MOTHER
NATURE
Chapter 3 Research Work and Discussion
SPP, School of Pharmacy & Technology Management, NMIMS, Mumbai. 25
3.1.3 McKinsey 7S Model
The analysis looks at the characteristics of the company in terms of two aspects (Hard and
Soft Elements) and examines how the target group, where the gaps are, doesn't fit. Here, we
have capability to improve and control the hard elements which are identified and influenced
by management. So, our main target era is hard elements. (System, Structure, Strategy)
Target era:-
Quality era, Planning and process design era for easily compatible with fluctuating planning
environment.
Require to emphasis on -
Lacking in Continuous Improvement systems
Mainly focused on onetime target achievement rather than process improvement.
Continuous co-ordination between top manager, line manager and worker must require.
Poor housekeeping system (Remaining to implement complete 5s strategy).
Increasing manpower in quality control staff.
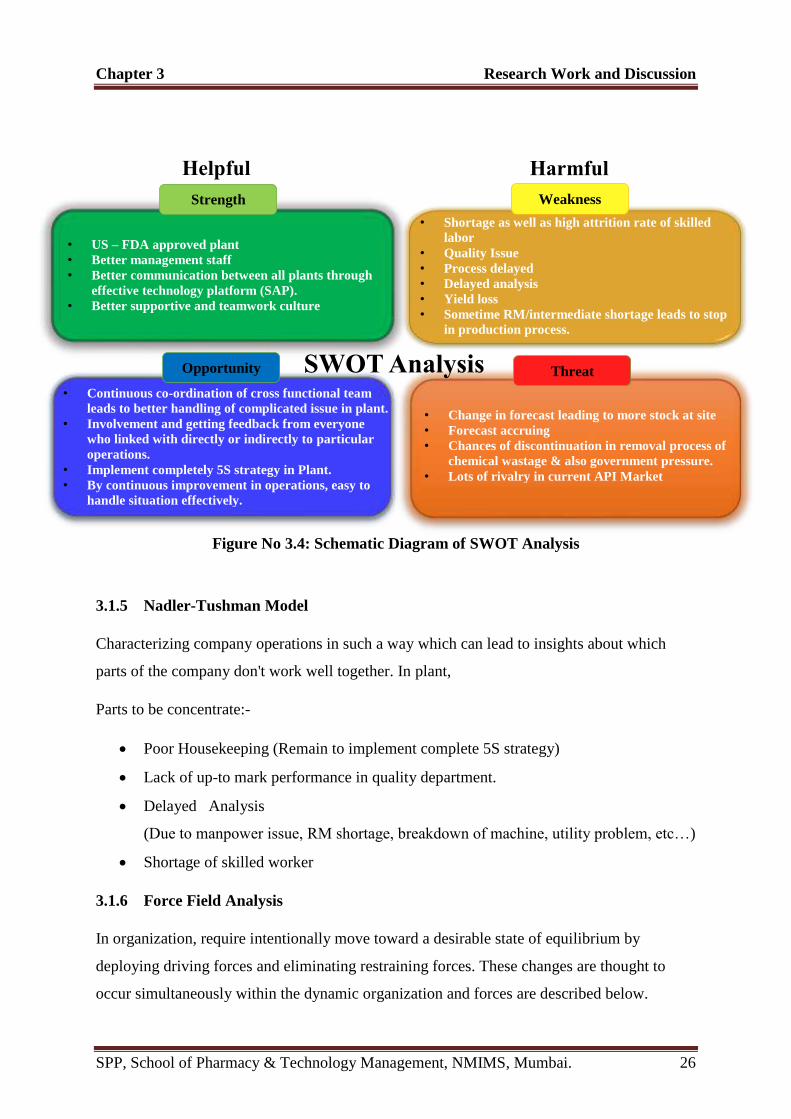
3.1.4 SWOT Analysis
Analyzing and describing production short fall problem in the terms which points
different way toward a solution by showing you how to avoid potential threats while using
strengths to exploit an opportunity. Here, the company's strengths, weaknesses, opportunities
and threats are described. Depending upon these, company gets idea to fulfilling the GAPs.
Chapter 3 Research Work and Discussion
SPP, School of Pharmacy & Technology Management, NMIMS, Mumbai. 26
Figure No 3.4: Schematic Diagram of SWOT Analysis
3.1.5 Nadler-Tushman Model
Characterizing company operations in such a way which can lead to insights about which
parts of the company don't work well together. In plant,
Parts to be concentrate:-
Poor Housekeeping (Remain to implement complete 5S strategy)
Lack of up-to mark performance in quality department.
Delayed Analysis
(Due to manpower issue, RM shortage, breakdown of machine, utility problem, etc…)
Shortage of skilled worker
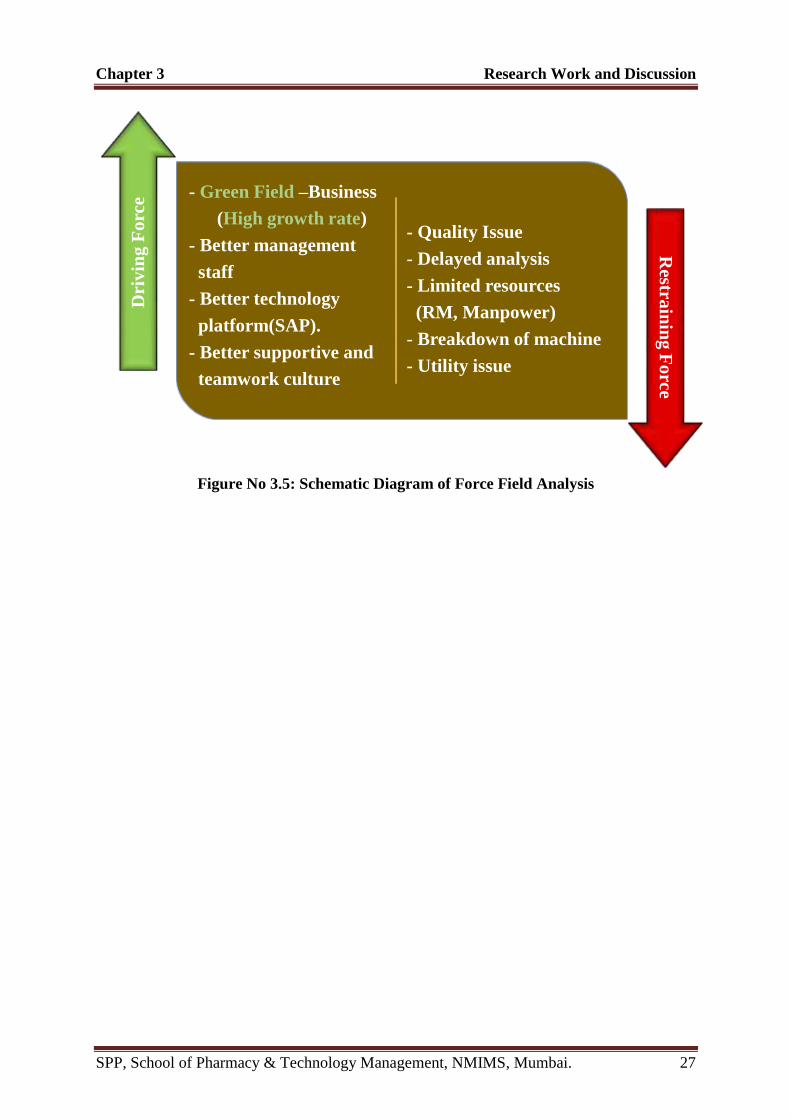
3.1.6 Force Field Analysis
In organization, require intentionally move toward a desirable state of equilibrium by
deploying driving forces and eliminating restraining forces. These changes are thought to
occur simultaneously within the dynamic organization and forces are described below.
• US – FDA approved plant
• Better management staff
• Better communication between all plants through
effective technology platform (SAP).
• Better supportive and teamwork culture
SWOT Analysis
Harmful
• Shortage as well as high attrition rate of skilled labor
• Quality Issue • Process delayed • Delayed analysis • Yield loss • Sometime RM/intermediate shortage leads to
stop in production process.
• Continuous co-ordination of cross functional team
leads to better handling of complicated issue in plant.
• Involvement and getting feedback from everyone
who linked with directly or indirectly to particular
operations.
• Implement completely 5S strategy in Plant.
• By continuous improvement in operations, easy to
handle situation effectively.
• Change in forecast leading to more stock at site
• Forecast accruing • Chances of discontinuation in removal
process of chemical wastage & also government pressure.
• Lots of rivalry in current API Market
• Shortage as well as high attrition rate of skilled
labor
• Quality Issue
• Process delayed
• Delayed analysis
• Yield loss
• Sometime RM/intermediate shortage leads to stop
in production process.
• Change in forecast leading to more stock at site
• Forecast accruing
• Chances of discontinuation in removal process of
chemical wastage & also government pressure.
• Lots of rivalry in current API Market
SWOT Analysis
Helpful Harmful
Strength Weakness
Opportunity Threat
Chapter 3 Research Work and Discussion
SPP, School of Pharmacy & Technology Management, NMIMS, Mumbai. 27
Figure No 3.5: Schematic Diagram of Force Field Analysis
- Green Field –Business
(High growth rate)
- Better management
staff
- Better technology
platform(SAP).
- Better supportive and
teamwork culture
- Quality Issue
- Delayed analysis
- Limited resources
(RM, Manpower)
- Breakdown of machine
- Utility issue
Dri
vin
g F
orc
eR
estrain
ing F
orce
Chapter 4 Recommendation
SPP, School of Pharmacy & Technology Management, NMIMS, Mumbai. 28
ECOMMENDATION
Zydus Cadila Healthcare API production shortfall is mainly caused by major three critical
issues according to production GAP analysis study. (71.58% of Total Production Short Fall
Amount in three month)
Quality Issue ( Due to poor housekeeping issue, lesser stability of intermediate)
Change in Plan (Due to shortage of RM/machine availability, volatility demand)
Process Delayed (Due to manpower/RM shortage, change in plan schedule)
Key Recommendation/Solution to Achieve Desire Productivity
Kaizen Gemba
Complete 5s Strategy Implementation
Resolve Skilled Manpower Shortage Problem
4.1 Kaizen Gemba 5
Kaizen means ‘improvement’ and Gemba means ‘Workplace’.
Definition: “Systematic organized effort to continuously improve the performance at the
work area by individual efforts in a group who assemble periodically to discuss their
work related problems.”
To achieve desire productivity the service and management departments should provide
the appropriate actions in a continuous manner. Management also focused on mainly
process oriented rather than result oriented. Improvement is not a trigger event but it’s an
ongoing process in which require to track and standardize process continuously. When
the processes become an error proof then it will be easy to adopt any complicated
situation and achieve desire output automatically.
4.1.1 Common Subjects of kaizen Gemba
Major focus areas are as follows:
Improvements in methods, work content, workshop quality.
Reduction in wastage, defective, rework, errors.
Saving in energy, fuel, space, time.
Use of improved tools.
R
Chapter 4 Recommendation
SPP, School of Pharmacy & Technology Management, NMIMS, Mumbai. 29
Machine maintenance.
Inventory control.
Housekeeping etc.
4.1.2 Implementation
Quality council decides to implement the kaizen gemba, done by ‘pareto analysis’.
Supervisor in charge of problematic departments are chosen as ‘kaizenees’.
Each kaizenee form a group of ten workers from his department, train them on principles
and guidelines of kaizen gemba.
Gather once a while in a month for an hour, speaks of regarding the improvements done
in preceding month and its results.
It must be ensured that there must be an honest give and take of ideas, thoughts and
experiences.
All kaizenees submit the monthly scores of their members to the kaizen gemba
coordinator, who’s responsible for submitting further to quality council.
Quality council tracks the progress of companywide kaizen gemba activities.
4.1.3 Relationship of KAIZEN GEMBA, PDCA and SDCA Circles
I. Definition of Gemba Kaizen (GK)
Need of improvement
Value stream mapping (VSM)
All important processes and their operations, lead time, cycle times WIP, setup time are
included.
Gemba Kaizen opportunities are spotted and GK workshop is planned
II. 1st Pre-GK (minimally 2 – 4 weeks before GK workshop)
Owner of the process with lean specialist will lead that GK from the methodologist
perspective
They discuss about expectations and define targets, basic resources material, labor, etc.
Plan
Chapter 4 Recommendation
SPP, School of Pharmacy & Technology Management, NMIMS, Mumbai. 30
III. 2nd Pre-GK (minimally 1 – 2 weeks before GK workshop)
Leader and his deputy are the key participants
Whole GK team is defined in two groups.
First group contains operators, store keepers, line technicians, maintainers, etc
Second group supports GK according to their needs
Check everything is prepared for GK workshop or not then go for further step.
IV. Gemba Kaizen workshop (x days of teamwork)
Workshop is officially started with targets and team presentation in the presence of plant,
production and lean managers.
Lean specialist presents and teaches GK team about lean philosophy and important tools
and methods which can be used during Kaizen event.
Analyze the problems and possibilities how to solve them.
Each employee has assigned a task for which takes responsibility.
V. Visualization of GK results, trainings, etc. (1 week after GK)
Results are visualized directly on Gemba
Employs are shown changes
VI. 1st Post-GK (maximally 2 weeks after GK)
Review the status and sustainability of changes/improvements on place where Kaizen was
performed.
Plus at this meeting has to be checked action plan from workshop
Process owner, lean specialist and leader of GK attend this meeting.
VII. 2nd Post-GK (maximally 4 week after GK)
Similar to the 1st meeting
It is held if the problems still persists
Check results which are sustainable or not then go for further step.
Do
Check
Chapter 4 Recommendation
SPP, School of Pharmacy & Technology Management, NMIMS, Mumbai. 31
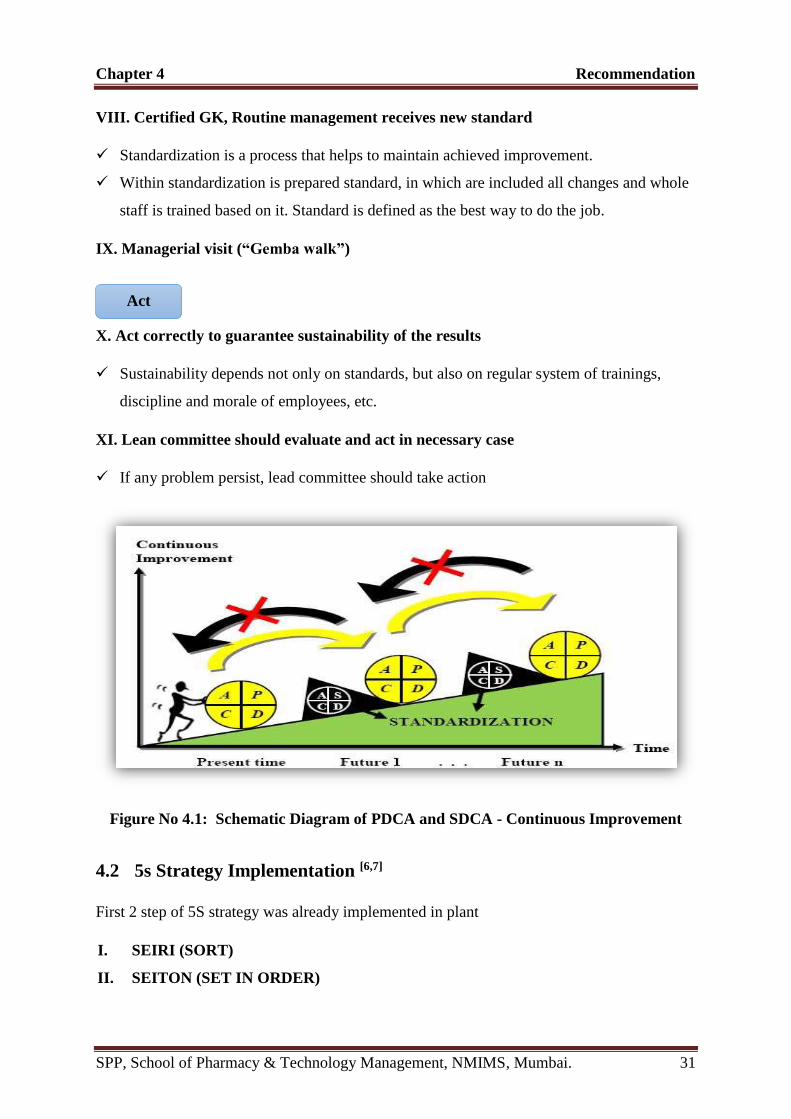
VIII. Certified GK, Routine management receives new standard
Standardization is a process that helps to maintain achieved improvement.
Within standardization is prepared standard, in which are included all changes and whole
staff is trained based on it. Standard is defined as the best way to do the job.
IX. Managerial visit (“Gemba walk”)
X. Act correctly to guarantee sustainability of the results
Sustainability depends not only on standards, but also on regular system of trainings,
discipline and morale of employees, etc.
XI. Lean committee should evaluate and act in necessary case
If any problem persist, lead committee should take action
Figure No 4.1: Schematic Diagram of PDCA and SDCA - Continuous Improvement
4.2 5s Strategy Implementation [6,7]
First 2 step of 5S strategy was already implemented in plant
I. SEIRI (SORT)
II. SEITON (SET IN ORDER)
Act
Chapter 4 Recommendation
SPP, School of Pharmacy & Technology Management, NMIMS, Mumbai. 32
Require to proper and complete implementation of 5S strategy with all employers &
employees support.
III. SEISO (CLEAN) - “Cleaning with meaning”
Everyone should equally participate in cleaning activity.
Benefits:
Defects are easier to identify in clean environment.
A work area (clean of debris) is less likely to cause a tripping hazard
Machines which are clean and maintained work more efficiently with less occurrence of
break down.
A clean work area promotes improved morale and instills pride in the team members
Implementation:
Determine the shine targets: what are we going to clean?
Set a schedule and assign individuals
Create procedures for continued daily shine processes
Set periodic machine inspection and maintenance targets
IV. SEIKETSU (STANDARDIZE) - “Make the best way, the easiest way”
Action Step
Brainstorm ideas for making 5S changes
Update documentation to reflect changes
Make sure all stakeholders are aware of the new standards - inform and educate
Resources
Support from those who can create documentation, job aids, and visual aids
Information and approval for maintaining company procedures
Poster-making supplies for posting new standards in work areas
V. SHITSUKE (SUSTAIN) – “A workplace that automatically restores order,
regulates activity, and continuously improves”
Action Step
Monitor processes established
during S4 - Standardize
Chapter 4 Recommendation
SPP, School of Pharmacy & Technology Management, NMIMS, Mumbai. 33
Expand 5S efforts to other work areas
Evaluate 5S effectiveness and continuously improve
Recognize and reward strong efforts
Resources
Management audit forms
Newsletters, Displays, Awards
Presentation tools for sharing best practices with other work areas
Management commitment and focus on maintaining the new standards
4.3 Resolve Skilled Manpower Shortage Problem
In vacation and festival season – more attrition rate
Require to decrease attrition rate and try to attract worker/operator through giving better
nurturing working environment. (Try to develop symbiotic relationship)
Require to organize continuous skill development program with scoring system based on
key performance indicator and reward system.
Powerful continuous training program require as per worker/operator needed
In kaizen Gemba, try to involve and getting feedback for improvement
Giving some importance and try to feel out as a their own workplace
Make them more responsible and confident about their work
Try to avoid much more load in workplace by organizing systematic refreshing and
replacement system. (At every plant – 2 extra manpower require)
4.4 Other Recommendation
Resolve problem of on system and practical stock mismatch by taking regular feedback
and continuous inspection.
Try to develop day to day planning with day to day tracking system. That helps in
Finding right focus era where we are lacking in performance
Making uninterrupted scheduling process
Effectively implementation of Kaizen Gemba system
Chemical wastage of API production system are managed effectively by taking some
preventative steps or measurement against removal process.
Chapter 4 Recommendation
SPP, School of Pharmacy & Technology Management, NMIMS, Mumbai. 34
Improve in attitude of employees.
(More responsibility and more seriousness toward own work.)
4.5 Changes in Current System
1 Implementation of Daily based tracking system
Benefits:
Helps in future planning as well as inventory management system and there will be no
delay in production due to non- availability of Raw material.
2 Complete 5S Implementation in QC Department.
Benefits:
Make effective and efficient QC process & make an error proof processes.
The QC labs achieved zero observations in following their most recent internal and
US-FDA audit.
3 Increasing manpower in plant operator, worker as well as in QC department.
Benefits:
Reducing burden in work
Increase in output as well as completing work on time.
Chapter 5 References
SPP, School of Pharmacy & Technology Management, NMIMS, Mumbai. 35
EFERENCES
1. Patil R. P. and Shakthi P. M. R., “Productivity enhancement and measurement in
pharmaceutical industry”, International Journal of Pharma. Research and Development,
March 2011; 3(1): 193-198.
2. Robert J. B. and Chase R. B. Operations and Supply Management: The Core. 2nd Ed. New
York: McGraw-Hill/Irwin, a business unit of The McGraw-Hill Companies, Inc., 2010.
3. Silver E. A., Pyke D. F., and Peterson R. Inventory Management and Production
Planning and Scheduling. 3rd Ed. New York: John Wiley Inc., 23th January 1998.
4. Graves S. C. A Review of Production Scheduling. Operations Research. July-August 1981;
29(4): 646-675.
5. Masaaki Imai. Gemba Kaizen – A Commonsense Approach To A Continuous Improvement
Strategy. 2nd Ed. New York: McGraw-Hill/Irwin, a business unit of The McGraw-Hill
Companies, Inc. 1st July 2012; 1-78.
6. Khanna V. K. 5”S” and TQM status in Indian organization. TQM J. 2009; 21: 486-501.
7. Gapp R., R. Fisher and K. Kobayashi. Implementing 5S within a Japanese context: An
integrated management system. December 2008; 46: 565-579.
8. http://smallbusiness.chron.com/tools-gap-analysis-46456.html
9. http://www.mindtools.com/pages/article/gap-analysis.htm
10. http://www.batimes.com/articles/do-we-need-a-mature-gap-analysis.html
11. http://www.mindtools.com/pages/article/newTED_06.htm
12. http://www.12manage.com/methods_zeithaml_servqual.html
13. http://reflectlearn.org/discover/the-marvin-weisbord-six-box-model-
weisbord%E2%80%99s-model
14. http://www.oi-institute.com/organizational-intelligence-model-skyline
15. http://asq.org/learn-about-quality/project-planning-tools/overview/pdca-cycle.html
R