Embed Size (px)
Citation preview

ii
DARPA ANTIBODY TECHNOLOGY PROGRAM
STANDARDIZED TEST BED FOR ANTIBODY CHARACTERIZATION: CHARACTERIZATION OF AN MS2
SDAB PRODUCED BY U.S. NAVAL RESEARCH LABORATORY
ECBC-TR-1421
Patricia E. Buckley Alena M. Calm Heather Welsh
Roy Thompson James Carney
RESEARCH AND TECHNOLOGY DIRECTORATE
Candice Warner Melody Zacharko
EXCET, INC.
Springfield, VA 22151-2110
October 2016
July 2013
Patricia E. Buckley Alena M. Calm Heather Welsh
Approved for public release; distribution unlimited.

Disclaimer
The findings in this report are not to be construed as an official Department of the Army position unless so designated by other authorizing documents.
REPORT DOCUMENTATION PAGE Form Approved OMB No. 0704-0188
Public reporting burden for this collection of information is estimated to average 1 h per response, including the time for reviewing instructions, searching existing data sources, gathering and maintaining the data needed, and completing and reviewing this collection of information. Send comments regarding this burden estimate or any other aspect of this collection of information, including suggestions for reducing this burden to Department of Defense, Washington Headquarters Services, Directorate for Information Operations and Reports (0704-0188), 1215 Jefferson Davis Highway, Suite 1204, Arlington, VA 22202-4302. Respondents should be aware that notwithstanding any other provision of law, no person shall be subject to any penalty for failing to comply with a collection of information if it does not display a currently valid OMB control number. PLEASE DO NOT RETURN YOUR FORM TO THE ABOVE ADDRESS.
1. REPORT DATE (DD-MM-YYYY)
XX-10-2016 2. REPORT TYPE
Final 3. DATES COVERED (From - To)
Oct 2010 – Sep 2012
4. TITLE AND SUBTITLE
DARPA Antibody Technology Program
Standardized Test Bed for Antibody Characterization: Characterization of an MS2
sdAb Produced by U.S. Naval Research Laboratory
5a. CONTRACT NUMBER
5b. GRANT NUMBER
5c. PROGRAM ELEMENT NUMBER
6. AUTHOR(S)
Buckley, Patricia E.; Calm, Alena; Welsh, Heather; Thompson, Roy; Carney,
James (ECBC); Warner, Candice; and Zacharko, Melody (Excet)
5d. PROJECT NUMBER
5e. TASK NUMBER
5f. WORK UNIT NUMBER
7. PERFORMING ORGANIZATION NAME(S) AND ADDRESS(ES)
Director, ECBC, ATTN: RDCB-DRB-M, APG, MD 21010-5424 Excet, Inc.; 8001 Braddock Road, Suite 303; Springfield, VA 22151-2110
8. PERFORMING ORGANIZATION REPORT NUMBER
ECBC-TR-1421
9. SPONSORING / MONITORING AGENCY NAME(S) AND ADDRESS(ES)
Defense Advanced Research Projects Agency;
675 N. Randolph Street; Arlington, VA 22203-2114
10. SPONSOR/MONITOR’S ACRONYM(S)
DARPA 11. SPONSOR/MONITOR’S REPORT NUMBER(S)
12. DISTRIBUTION / AVAILABILITY STATEMENT
Approved for public release; distribution unlimited. 13. SUPPLEMENTARY NOTES 14. ABSTRACT:
The selection of antibodies for inclusion in a final assay format has primarily relied on an antibody’s performance in an
enzyme-linked immunosorbent assay, with little regard for quantification of the full spectrum of variables that affect antibody–
antigen interactions. The Joint Product Management Office for Biosurveillance (JPMO BSV), Critical Reagents Program
instituted a quality program for the standardization of test methods to support more-comprehensive characterization and
comparison of the physical and functional properties of antibody reagents within its repository. The development and
standardization of antibody testing provides JPMO BSV with an invaluable platform for providing consistent, high-quality
assays and reagents for current biodetection platforms and for developing and validating future systems. This platform will be
used to characterize and evaluate the MS2 recombinant antibody produced and supplied by the Defense Advanced Research
Projects Agency (DARPA; Arlington, VA)-funded U.S. Naval Research Laboratory (Bethesda, MD) for affinity and stability
enhancements. The study provides standardized parametric data on antibody properties and performance and contributes to the
development of a decisional analysis tool used to expand the confidence level for selection of antibody-based reagents that will
optimize field operational and performance metrics for future detection and diagnostic platforms.
15. SUBJECT TERMS
Antibody Biosurveillance Antibody Technology Program (ATP) Quality MS2 coat protein (MS2CP) Enzyme-linked immunosorbent assay (ELISA)
16. SECURITY CLASSIFICATION OF:
17. LIMITATION OF ABSTRACT
18. NUMBER OF PAGES
19a. NAME OF RESPONSIBLE PERSON
Renu B. Rastogi a. REPORT b. ABSTRACT c. THIS PAGE 19b. TELEPHONE NUMBER (include area code)
U U U UU 32 (410) 436-7545 Standard Form 298 (Rev. 8-98)
Prescribed by ANSI Std. Z39.18

ii
Blank

iii
PREFACE
The work described in this report was supported by Defense Advanced Research
Projects Agency funding. The work was started in October 2010 and completed in September
2012.
The use of either trade or manufacturers’ names in this report does not constitute
an official endorsement of any commercial products. This report may not be cited for purposes of
advertisement.
This report has been approved for public release.

iv
Blank

v
CONTENTS
1. INTRODUCTION ...................................................................................................1
2. MATERIALS AND METHODS .............................................................................2
2.1 MS2 scFv and MS2CP .......................................................................................2 2.2 Ultraviolet-Visible (UV-Vis) Spectrophotometry .............................................2 2.3 Electrophoresis ...................................................................................................2 2.4 Dynamic Light Scattering (DLS) .......................................................................3 2.5 Differential Scanning Calorimetry (DSC) .........................................................3
2.6 Thermal Stress Test............................................................................................4 2.7 ELISA ................................................................................................................4
2.8 SPR Methodology ..............................................................................................4 2.8.1 Thermostability Testing Using SPR ............................................................5 2.8.2 Kinetic Analysis Using SPR ........................................................................5
3. RESULTS ................................................................................................................5
3.1 Spectrophotometry Results ................................................................................5 3.2 Electrophoresis Results ......................................................................................6
3.3 DLS Results .......................................................................................................7 3.4 DSC Results .....................................................................................................10
3.5 ELISA Results .................................................................................................11 3.6 SPR Results ......................................................................................................12 3.6.1 Thermostability Testing Results Using SPR..............................................12
3.6.2 Kinetic Analysis Results Using SPR .........................................................13
4. DISCUSSION ........................................................................................................15
5. CONCLUSION ......................................................................................................17
LITERATURE REFERENCES .............................................................................19
ACRONYMS AND ABBREVIATIONS ..............................................................21
vi
FIGURES
1. Molecular weight and purity of the two NRL MS2 sdAbs. Digital gel of
NRL MS2 sdAbs produced by the Experion Pro260 analysis kit. The thick
band shown in the second lane corresponds to the NRL MS2 sdAb
2cams2, and the bands in the fourth lane correspond to the heavy and light
chains of NRL MS2 sdAb B1-AP ............................................................................6 2. Radius and polydispersity representations of thermostable NRL MS2 sdAb
2cams2. (A) Correlation and (B) regularization graphs of the NRL
thermostable sdAb 2cams2. .....................................................................................8 3. Radius and polydispersity representations of affinity-matured NRL MS2
sdAb B1-AP. (A) Correlation and (B) regularization graphs of the NRL
affinity-matured sdAb B1-AP used for determining the radius and
polydispersity of the samples ...................................................................................9 4. Transition midpoint curve for NRL MS2 2cams2. Curves were generated
on the MicroCal VP-DSC microcalorimeter and analyzed using the Peak
Find function in the Origin 7.0 software. The transition midpoint was
calculated to be 64.7 °C for NRL MS2 2cams2 ....................................................10 5. Transition midpoint curve for NRL MS2 B1-AP. Curves were generated
on the MicroCal VP-DSC microcalorimeter and analyzed using the Peak
Find function in the Origin 7.0 software. The transition midpoint was
calculated to be 67.5 °C for NRL MS2 B1-AP. The other peak represents
the molecule added for stability .............................................................................11 6. Thermostability of NRL MS2 2cams2 using ELISA. (A) Activity of NRL
MS2 2cams2 as a function of antigen concentration after thermal stress.
The different curves are represented on the legend by the number of
minutes the sample was held at 70 °C. (B) Area under the curve analysis
depicting the effect of thermal stress. ....................................................................12 7. Thermostability of the NRL MS2 sdAb 2cams2 compared with the ECBC
MS2 scFv obtained using SPR. The NRL antibody maintained activity
after heating to 70 ºC for 45 min, compared with the original ECBC MS2
scFv antibody, which lost all ability to recognize the MS2CP target within
15 min of heating. ..................................................................................................13
8. Comparison of the kinetic fits with residuals of the MS2 antibodies,
determined using a Proteon XPR36 system. (A) Kinetics of NRL affinity-
enhanced MS2 sdAb B1-AP (26.3 nM) and (B) kinetics of original MS2
scFv (15.5 nM) .......................................................................................................14
TABLES
1. NanoDrop A280 Readings .........................................................................................5 2. Features of MS2 sdAbs in Solution .........................................................................7

1
DARPA ANTIBODY TECHNOLOGY PROGRAM
STANDARDIZED TEST BED FOR ANTIBODY CHARACTERIZATION:
CHARACTERIZATION OF AN MS2 SDAB
PRODUCED BY U.S. NAVAL RESEARCH LABORATORY
1. INTRODUCTION
Current platforms for the detection and diagnosis of biothreat agent exposure
depend on the use of antibodies to recognize and bind to specific antigens. To date, the selection
of antibodies for inclusion in a final assay format has primarily relied on an antibody’s
performance in an enzyme-linked immunosorbent assay (ELISA), with little regard for
quantification of the full spectrum of variables that affect antibody–antigen interactions. The
Joint Product Management Office for Biosurveillance (JPMO BSV), Critical Reagents Program
(CRP) instituted a quality program for the standardization of test methods to more fully
characterize and compare the physical and functional properties of antibody reagents in its
repository. The development and standardization of antibody testing provides the JPMO BSV
with an invaluable platform for providing consistent, high-quality assays and reagents for the
existing biodetection platforms and for developing and validating future systems. This platform
will be used to characterize the MS2 single domain antibody (sdAb), which was produced at the
U.S. Naval Research Laboratory (NRL; Bethesda, MD) for the Defense Advanced Research
Projects Agency (DARPA; Arlington, VA) Antibody Technology Program (ATP).
The DARPA ATP focuses on developing technologies to enhance the thermal
stability and binding affinity of a given antibody. Functioning as an independent testing
laboratory for this program, the U.S. Army Edgewood Chemical Biological Center (ECBC;
Aberdeen Proving Ground, MD) provided specific technical support on immune reagents and
defined the government-supplied, antibody–antigen pairs. The goal of this project was two-fold:
(a) select, develop, and standardize the methods for characterizing the de novo thermal and
binding properties of select reagents to be used by DARPA-funded investigators, and (b) use
those methods to validate the changes in antibody thermal stability and binding affinity that were
achieved by the DARPA investigators. The antibody chosen for this project was the MS2
recombinant single-chain fragment (scFv) antibody produced at ECBC (1), which detects an
MS2 coat protein (MS2CP) that forms the capsid for the MS2 bacteriophage. The focus of the
work described herein was to evaluate the MS2 antibodies supplied by the DARPA-funded
investigator, NRL, for affinity and stability enhancements. The results of this study provide
standardized parametric data on antibody properties and performance. This information will also
contribute to the development of a decisional analysis tool to expand the confidence levels for
the selection of antibody-based reagents that will optimize the field operational and performance
metrics for future detection and diagnostic platforms.

2
2. MATERIALS AND METHODS
2.1 MS2 scFv and MS2CP
The original MS2 scFv antibody was produced from a plasmid that was supplied
by Ellen Goldman at NRL. The plasmid was designated as Gv1, and the sequence was cloned
into a pET-22b(+) plasmid (EMD Millipore; Billerica, MA). The protein was produced and
eluted in 20 mM sodium phosphate (pH 8.0), 0.5 M sodium chloride, and 0.5 M imidazole. Peak
fractions were then collected and separated on a 16/60 Superdex 200 gel filtration column
(GE Healthcare Life Sciences; Pittsburgh, PA), and fractions that corresponded with a
monomeric protein were collected and flash-frozen in liquid nitrogen. These fractions were then
provided (along with sequence data) to NRL as baseline material for modification.
The MS2CP was produced from a pET-28a(+) plasmid (Novagen, Inc.; Madison,
WI) with the MS2CP sequence inserted with an amino acid substitution of an arginine at position
83 construct engineered by DNA2.0, Inc. (Menlo Park, CA; www.DNA20.com). MS2CP was
produced and eluted with 300 mM imidazole in pH 7.4 phosphate-buffered saline (PBS; Sigma-
Aldrich Company LLC; St. Louis, MO). Peak fractions were collected, and buffer was
exchanged into PBS (pH 7.4) using 470 mL of packed volume of Sephadex G-25 (Amersham
Biosciences Corporation; Piscataway, NJ) fine gel chromatography media and provided to NRL
as an antigen for the MS2 antibody.
2.2 Ultraviolet-Visible (UV-Vis) Spectrophotometry
A NanoDrop ND-1000 spectrophotometer (Thermo Fisher Scientific, Inc.;
Waltham, MA) was used to determine the MS2 sdAb concentrations and the absorbance of light
at 280 nm (A280) for the samples supplied by NRL. The A280 value is influenced by the number
of tryptophan and tyrosine residues in a given protein. For this reason, the extinction coefficient
is used in conjunction with the A280 value to determine an accurate concentration. The MS2 sdAb
concentrations were determined by dividing the average A280 value by 1.44, which is the
extinction coefficient for an sdAb. Each reading required a 2 µL sample, which was placed on
the sample pedestal. The arm of the instrument was lowered, creating a liquid column between
the top of the arm and the surface of the pedestal; this was the path length through which the
laser passed. The instrument was blanked using PBS, and readings were taken in triplicate. A
positive control, bovine γ-globulin (BGG; Bio-Rad Laboratories; Hercules, CA), was also tested
to validate the instrument operation.
2.3 Electrophoresis
Molecular weight and purity data were collected using an Experion automated
electrophoresis system (Bio-Rad). The Experion system employs microfluidic technology to
automate electrophoresis for protein analysis. The microfluidic chip, in conjunction with the
Experion reagents, electrophoresis station, and software, are designed to accomplish separation,
staining, destaining, detection, and basic data analysis. The Experion Pro260 analysis kit uses
engineered lower and upper internal alignment markers to provide clean baselines, accurate
molecular weight sizing, and quantitative protein analysis (2). The Pro260 analytical software

3
also determines sample purity by calculating the percent mass of the separated proteins in a
sample. For Experion analysis, each of the NRL MS2 sdAbs was standardized to a final
concentration of 1 mg/mL by diluting it in PBS. The BGG control and the NRL samples were
then processed using a validated procedure specified in the Bio-Rad Experion Pro260 analysis
kit, rev. C (3). Briefly, a Pro260 microfluidic chip was prepared by adding 12 µL of Pro260 gel
and gel stain to the designated wells. The chip was then placed on the priming station and primed
for 1 min at the medium (B) pressure setting. Priming filled the fluidic channels with gel, which
was used by the instrument to form a barrier between samples during the run. The sample was
reduced with dithiothrietol (Sigma-Aldrich) and denatured in the kit-provided sample buffer at
95 °C before it was applied to the primed chip. The chip was then placed in the instrument, and
the lid was closed, which lowered the sample needles into the wells. The instrument was
operated using the Experion software, and each chip took 30 min to complete. All samples were
run in triplicate alongside one sample of the BGG control and the Pro260 ladder. All analyses
were performed using the Experion software.
2.4 Dynamic Light Scattering (DLS)
DLS was used to paint a picture of how the proteins behaved in solution. DLS
data indicate whether a protein is in solution by measuring the polydispersity, hydrodynamic
radius, and molecular weight of the sample. Prediction algorithms within the DLS software
produce a range of values for the protein under evaluation. For DLS analysis, five 20 µL aliquots
of the NRL MS2 sdAbs, along with the control bovine serum albumin (Sigma-Aldrich), were
placed into a quartz 384-well plate (Wyatt Technology Corporation; Santa Barbara, CA) and
centrifuged for 2 min at 239 × g to remove trapped air bubbles from the samples. Mineral oil
(Sigma-Aldrich) was applied to the top of each sample to prevent sample evaporation. The plate
was then placed into a DynaPro temperature-controlled plate reader (Wyatt Technology). Each
well was scanned 10 times for 5 s each at 25 °C. Values were averaged to provide measurements
of polydispersity, hydrodynamic radius, percent mass, and molecular weight for each sample
using the Dynamics software (Wyatt Technology). The results of three wells were averaged and
reported.
2.5 Differential Scanning Calorimetry (DSC)
DSC was used to obtain a quantitative melting temperature (Tm) for each of the
NRL MS2 sdAb proteins. The Tm should predict the results of subsequent ELISA and surface
plasmon resonance (SPR) thermostability testing. A Tm above 70 °C predicts that the percentage
of antibody activity after the thermal stress test will remain above 50%. A Tm below 70 °C
predicts at least a 50% decrease in antibody activity after the thermal stress test. For DSC
experiments, samples were diluted to 0.5 mg/mL and dialyzed overnight in PBS (pH 7.4). Before
analysis, samples were degassed for 5 min and then injected into the sample cell of a VP-DSC
microcalorimeter (MicroCal of Malvern Instruments; Malvern, UK). Dialysis buffer was added
to the reference cell of the calorimeter, and a buffer scan was used as the baseline for all
experiments. The duplicate samples were each scanned from 15 to 100 °C at a rate of 60 °C/h.
The transition midpoint of the protein was determined by data analysis using Origin 7.0 software
(MicroCal).

4
2.6 Thermal Stress Test
Before applying heat, all samples were diluted to 1 mg/mL to negate any
protective effects that may have been due to concentration (2). The NRL thermally stabilized
antibody (2cams2) was diluted to 1 mg/mL in 1× PBS and divided into five tubes. One aliquot
was kept on ice for the duration of the experiment and was marked “time 0”. The remaining four
aliquots were heated to 70 °C on a calibrated heat block for 15, 30, 45, and 60 min each. After
each time point, the corresponding aliquot was removed and placed in an ice bath. These samples
were then tested for activity.
2.7 ELISA
ELISAs were performed in triplicate using standard techniques. After the thermal
stress test, each sample was diluted to 1 µg/mL in PBS and used to coat one row each of three
Nunc MaxiSorp 96-well plates (Thermo Fisher Scientific). The plates were incubated at 4 °C
overnight. In the morning, each plate was washed in 1× wash buffer (KPL, Inc.; Gaithersburg,
MD) using a standard wash protocol on an AquaMax 200 plate washer (Molecular Devices,
LLC; Sunnyvale, CA). The plate was then blocked with 1× milk diluent block (MDB; KPL, Inc.)
for 30 min at 37 °C. The plate was washed, and 100 µL of PBS with 0.05% Tween 20 (PBS-T;
Sigma-Aldrich) was applied to each well in the plate. MS2CP was diluted in PBS-T to
2 µg/mL, and 100 µL of this solution was applied to the first well of each row. A 2-fold serial
dilution was performed across the plate, and then it was incubated for 1 h at 37 °C.
After the plate was washed, rabbit anti-MS2 (supplied by JPMO BSV CRP) was
diluted to 5 µg/mL in 1× MDB, and 100 µL of this solution was added to each well. The plate
was then incubated at 37 °C for 1 h. After incubation, the plate was washed. Goat anti-rabbit IgG
(H+L)*-horseradish peroxidase (HRP; KPL, Inc.) was diluted to 0.2 µg/mL in 1× MDB, and
100 µL of this solution was added to each well. The plate was incubated at 37 °C for 30 min.
After the plate was washed, 100 µL of room-temperature 2,2'-azino-bis(3-ethylbenzthiazoline-6-
sulphonic acid) (ABTS) one-component HRP substrate (KPL, Inc.) was added to each well.
After 20 min at 37 °C, the optical density at the 405 nm light wavelength was determined using a
Synergy H4 hybrid multi-mode microplate reader (BioTek Instruments, Inc.; Winooski, VT).
Data analysis was performed using Prism software (GraphPad Prism, version 5.00 for Windows,
GraphPad Software; San Diego, CA).
2.8 SPR Methodology
SPR is one method used to determine the kinetic parameters of antibody–antigen
interactions. It is a rapid methodology for monitoring biomolecular interactions through
excitation of surface plasmons. Polarized light is shone through a prism on a sensor chip with a
thin metal film coating, which reflects the light by acting as a mirror. If the angle of light shone
through the prism is changed, and the intensity of the reflected light is monitored, differences in
intensity can be recorded. Although the refractive index at the prism side of the sensor chip does
not change, the refractive index in the immediate vicinity of the metal surface will change when
* H+L, heavy and light chains of the antibody.
5
accumulated mass (bound proteins) adsorbs on the surface. Therefore, if binding occurs, the
resonance angle (SPR angle) changes, and this SPR angle shift provides information on the
protein adsorption kinetics on the surface. The software can then be used to provide an accurate
analysis of the association (ka) and dissociation (kd) rate constants for the antibody interactions
and to calculate the overall affinity constant (KD) between antibody and antigen.
2.8.1 Thermostability Testing Using SPR
Using a Biacore T200 system (GE Healthcare), 6500 response units (RUs) of
MS2CP was tethered to one flow cell of a Biacore CM5 sensor chip using standard amine
coupling chemistry. After a thermal stress test was performed, samples were centrifuged at
2000 × g and 5 °C for 5 min. The analyte was run at 10 µL/min for 120 s. A calibration curve
was created by injecting eight concentrations of the time 0 unheated, NRL MS2 sdAb samples
(2cams2 or B1-AP) at 400, 350, 300, 250, 200, 150, 100, and 50 nM and plotting their respective
analyte-binding capacities of the surfaces in RU (RMax). Unheated and heated samples were then
diluted 1:90 and 1:180 so that the time 0 control points fall on the linear calibration curve. All
samples were run in triplicate. The chip’s surface was regenerated with an 18 s injection of
0.85% phosphoric acid at a flow rate of 30 µL/min. Data was collected using the Biacore
concentration analysis software, and the active concentration of heated sample was recorded. The
running buffer used for this experiment was Biacore HBS-EP 1× buffer (GE Healthcare Life
Sciences).
2.8.2 Kinetic Analysis Using SPR
Using a Proteon XPR36 SPR system (Bio-Rad) and PBS-T running buffer,
200 RU of MS2CP was tethered to a GLC sensor chip (Bio-Rad) using standard amine-coupling
chemistry. NRL MS2 sdAb (2cams2 or B1-AP) was injected across the chip’s surface for 120 s
at a flow rate of 100 µL/min with 600 s of dissociation at 5 nM, 1.67 nM, 560 pM, 190 pM, and
60 pM. The chip’s surface was regenerated using an 18 s injection of 0.85% phosphoric acid at
100 µL/min. Data was analyzed using a Langmuir 1:1 fit.
3. RESULTS
3.1 Spectrophotometry Results
Both of the NRL MS2 sdAbs were read in triplicate on the NanoDrop ND-1000
spectrophotometer. The A280 readings are shown in Table 1.
Table 1. NanoDrop A280 Readings
Replicate NRL MS2 2cams2
(mg/mL)
NRL MS2 B1-AP
(mg/mL)
1 2.34 4.14
2 2.32 4.13
3 2.31 4.10

6
For each antibody, these three readings (Table 1) were averaged and divided by
the extinction coefficient of 1.44. The final concentrations were determined to be 2.32 mg/mL
for the thermally stabilized NRL MS2 2cams2 and 4.12 mg/mL for affinity-matured NRL MS2
B1-AP.
3.2 Electrophoresis Results
The molecular weights of the NRL MS2 sdAbs were determined using the
Experion Pro260 analysis kit, as shown in Figure 1. The thick bands observed in the second and
fourth lanes correspond to the MS2 sdAbs 2cams2 and B1-AP, respectively. According to the
results of the Experion software analysis, 2cams2 was only 49.9% pure and weighed 19.0 kDa,
and B1-AP was 98.1% pure with a heavy chain of 49.5 kDa and a light chain of 19.5 kDa.
Figure 1. Molecular weight and purity of the two NRL MS2 sdAbs. Digital gel of NRL MS2
sdAbs produced by the Experion Pro260 analysis kit. The thick band shown in the second lane
corresponds to the NRL MS2 sdAb 2cams2, and the bands in the fourth lane correspond to the
heavy and light chains of NRL MS2 sdAb B1-AP.

7
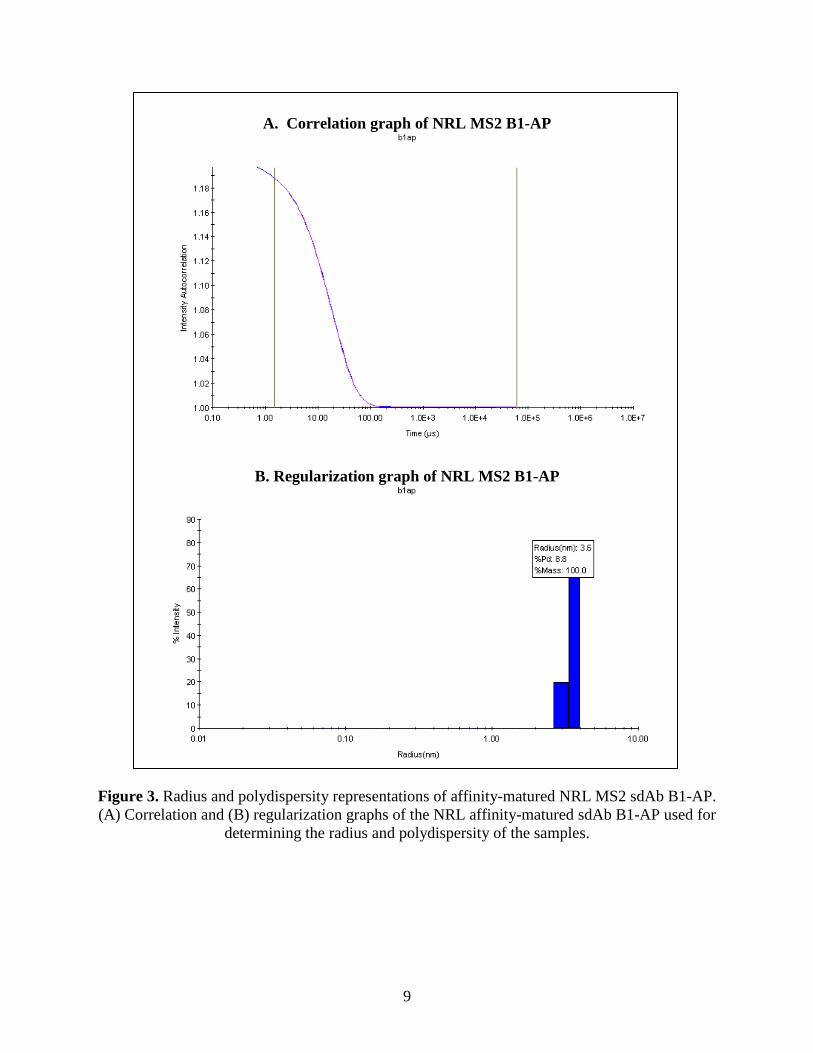
3.3 DLS Results
Both of the NRL MS2 sdAbs were analyzed in triplicate using the DynaPro plate
reader. The radius of NRL MS2 2cams2 was determined to be 2.3 nm, with a polydispersity of
15.9% (Table 2), whereas the radius of NRL MS2 B1-AP was determined to be 3.6 nm with a
polydispersity of 10.4%. Figure 2 contains representative correlation and regularization graphs
for each of the NRL MS2 sdAbs. The correlation graphs (Figures 2A and 3A) depict a sigmoidal
curve, which is indicative of a valid size distribution. The regularization graphs (Figures 2B and
3B) illustrate the monodispersity found in both samples. Table 2 shows the raw data produced
for each replicate. Because 100% of the mass displays favorable polydispersity and
hydrodynamic radius, both of these sample preparations are considered to be monodisperse.
Table 2. Features of MS2 sdAbs in Solution
Sample Replicate Radius
(nm)
Polydispersity
(%)
NRL MS2
2cams2
1 2.5 24.9
2 2.4 21.3
3 2.2 9.7
4 2.1 11.7
5 2.1 11.8
Average 2.3 15.9
NRL MS2
B1-AP
1 3.5 11.1
2 3.8 13.7
3 3.6 8.8
4 3.6 9.9
5 3.6 8.4
Average 3.6 10.4

8
A. Correlation graph of NRL MS2 2cams2
B. Regularization graph of NRL MS2 2cams2
Figure 2. Radius and polydispersity representations of thermostable NRL MS2 sdAb 2cams2.
(A) Correlation and (B) regularization graphs of the NRL thermostable sdAb 2cams2.
9
A. Correlation graph of NRL MS2 B1-AP
B. Regularization graph of NRL MS2 B1-AP
Figure 3. Radius and polydispersity representations of affinity-matured NRL MS2 sdAb B1-AP.
(A) Correlation and (B) regularization graphs of the NRL affinity-matured sdAb B1-AP used for
determining the radius and polydispersity of the samples.

10
3.4 DSC Results
The NRL MS2 sdAbs were analyzed in duplicate using the MicroCal VP-DSC
instrument. The peak Tm values were as follows:
NRL MS2 2cams2 Replicate 1: 67.2 °C;
NRL MS2 2cams2 Replicate 2: 62.2 °C;
NRL MS2 B1-AP Replicate 1: 67.5 °C; and
NRL MS2 B1-AP Replicate 2: 67.5 °C.
The final Tm for NRL MS2 2cams2 was determined to be 64.7 °C (Figure 4), and
that of NRL MS2 B1-AP was determined to be 67.5 °C (Figure 5).
Figure 4. Transition midpoint curve for NRL MS2 2cams2. Curves were generated on the
MicroCal VP-DSC microcalorimeter and analyzed using the Peak Find function in the Origin 7.0
software. The transition midpoint was calculated to be 64.7 °C for NRL MS2 2cams2.

11
Figure 5. Transition midpoint curve for NRL MS2 B1-AP. Curves were generated on the
MicroCal VP-DSC microcalorimeter and analyzed using the Peak Find function in the Origin 7.0
software. The transition midpoint was calculated to be 67.5 °C for NRL MS2 B1-AP. The other
peak represents the molecule added for stability.
3.5 ELISA Results
ELISAs were used to test the functional interactions of antibodies and antigens
after thermal stress at 70 ºC. The ELISA data (Figure 6) show that when the NRL sdAb 2cams2
was heated to 70 °C, it maintained activity during 45 min of thermal stress, unlike the
government-supplied MS2 scFv, which lost activity after 15 min and did not maintain activity
over the full hour of thermal stress. The curves in Figure 6A show antibody activity for different
time points at 70 °C, as a function of the concentration of antigen supplied. The area under the
curve for each of the different time points at 70 °C was calculated, averaged, and graphed
(Figure 6B) to show how the MS2 sdAb reacted to thermal stress over time. Evaluation of this
graph indicates that some of the MS2 sdAb remains functionally capable of binding to antigen
after a 45 min exposure to 70 °C, unlike the original MS2 scFv, which lost activity within 15 min
of heating.

12
Figure 6. Thermostability of NRL MS2 2cams2 using ELISA. (A) Activity of NRL MS2
2cams2 as a function of antigen concentration after thermal stress. The different curves are
represented on the legend by the number of minutes the sample was held at 70 °C. (B) Area
under the curve analysis depicting the effect of thermal stress.
3.6 SPR Results
3.6.1 Thermostability Testing Results Using SPR
After heating the antibody–antigen complex to 70 °C for variable time periods,
SPR was used to assess the functional binding between the NRL MS2 sdAb (2cams2) and
antigen. Five tubes of 1 mg/mL MS2 sdAb were prepared and heated to 70 °C for the following
time periods: 15, 30, 45, and 60 min, followed by quenching the tubes on ice. A Biacore T200
system was used to compare the activity of each sample with a calibration curve for unheated
samples. The percent activities of the heated samples were plotted over time (Figure 7). The
results indicated that 2cams2 did not maintain over 85% activity over the full 60 min of thermal
stress, but it did remain active over the first 45 min, whereas the activity of the scFv dropped off
completely within the first 15 min at 70 °C. However, this amount of activity did not meet the
thermostability requirement.
A. B.

13
NRL 2cams2 Thermostability
Time at 70 deg c (minutes)
Percen
t A
cti
vit
y
0 20 40 60 800
50
100
Figure 7. Thermostability of the NRL MS2 sdAb 2cams2 compared with the ECBC MS2 scFv
obtained using SPR. The NRL antibody maintained activity after heating to 70 ºC for 45 min,
compared with the original ECBC MS2 scFv antibody, which lost all ability to recognize the
MS2CP target within 15 min of heating.
3.6.2 Kinetic Analysis Results Using SPR
Kinetic analysis of the affinity-enhanced NRL MS2 sdAb B1-AP binding to the
MS2CP antigen was performed as a direct-binding SPR experiment on the Proteon XPR36
system, and the results are presented in Figure 8A. Data was normalized to a blank-immobilized
reference flow cell and fit to a Langmuir 1:1 model using the Bio-Rad Proteon XPR36 software.
The KD was determined to be 26.3 nM. Results from similar experiments run using the original
ECBC MS2 scFv are presented in Figure 8B. The KD of the original scFv was determined to be
8.66 nM; therefore, the NRL staff provided an antibody that did not meet the 100-fold
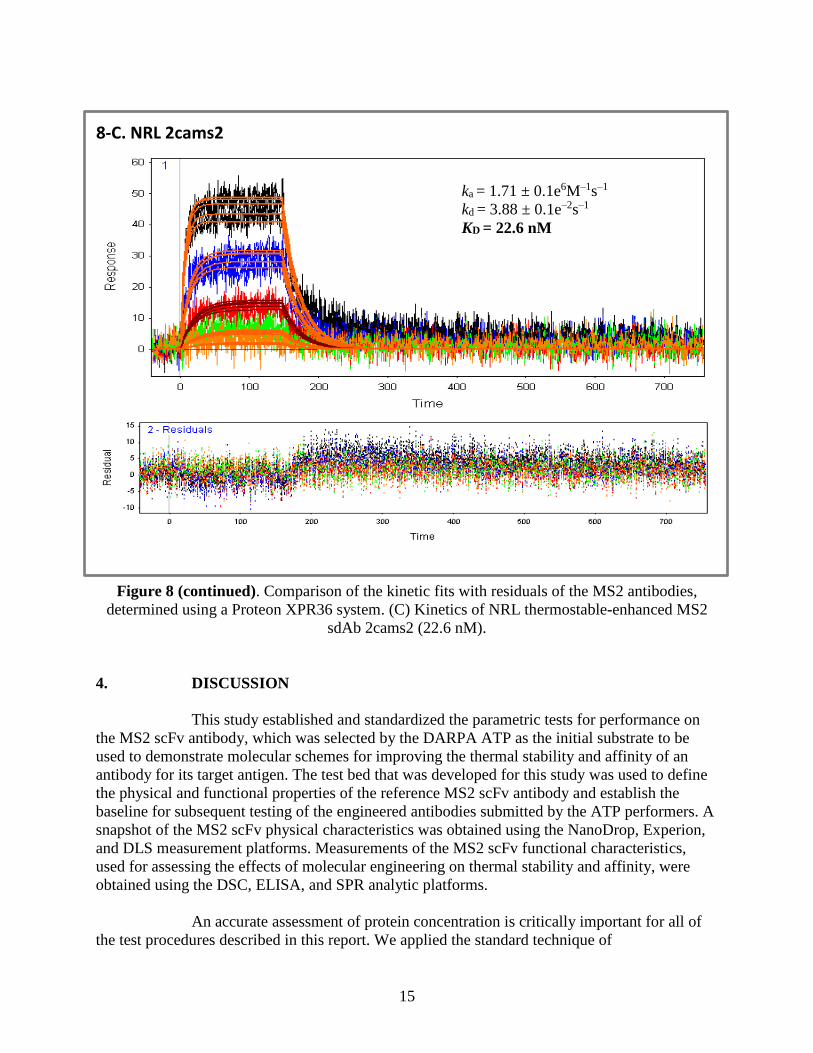
improvement threshold. Finally, kinetics analysis was also performed on the thermostable-
enhanced NRL MS2 sdAb 2cams2 and the results are presented in Figure 8C. The KD was
determined to be 22.6 nM.

14
Figure 8. Comparison of the kinetic fits with residuals of the MS2 antibodies, determined using
a Proteon XPR36 system. (A) Kinetics of NRL affinity-enhanced MS2 sdAb B1-AP (26.3 nM)
and (B) kinetics of original MS2 scFv (15.5 nM).
ka = 1.53 ± 0.4e6M–1s–1
kd = 1.29 ± 0.2e–2s–1
KD = 8.66 nM
8-A. NRL B1-AP
8-B. ECBC MS2 scFv
ka = 2.42 ± 0.3e6M–1s–1
kd = 6.27 ± 0.3e–2s–1
KD = 26.3 nM
Continued on next page.
15
Figure 8 (continued). Comparison of the kinetic fits with residuals of the MS2 antibodies,
determined using a Proteon XPR36 system. (C) Kinetics of NRL thermostable-enhanced MS2
sdAb 2cams2 (22.6 nM).
4. DISCUSSION
This study established and standardized the parametric tests for performance on
the MS2 scFv antibody, which was selected by the DARPA ATP as the initial substrate to be
used to demonstrate molecular schemes for improving the thermal stability and affinity of an
antibody for its target antigen. The test bed that was developed for this study was used to define
the physical and functional properties of the reference MS2 scFv antibody and establish the
baseline for subsequent testing of the engineered antibodies submitted by the ATP performers. A
snapshot of the MS2 scFv physical characteristics was obtained using the NanoDrop, Experion,
and DLS measurement platforms. Measurements of the MS2 scFv functional characteristics,
used for assessing the effects of molecular engineering on thermal stability and affinity, were
obtained using the DSC, ELISA, and SPR analytic platforms.
An accurate assessment of protein concentration is critically important for all of
the test procedures described in this report. We applied the standard technique of
ka = 1.71 ± 0.1e6M–1s–1
kd = 3.88 ± 0.1e–2s–1
KD = 22.6 nM
8-C. NRL 2cams2

16
spectrophotometry with the NanoDrop ND-1000 system. This instrument was employed to
provide the A280 value of the sample, which is influenced by the number of tryptophan and
tyrosine residues in a given protein. For this reason, the extinction coefficient was used in
conjunction with A280 value to determine an accurate concentration.
After concentration was determined using spectrophotometry with the NanoDrop
system, molecular weight and purity data were collected with the Experion automated
electrophoresis system, which employs microfluidic technology to automate electrophoresis for
protein analysis. The results of the Experion system analysis of the MS2 sdAb protein fell within
the acceptable range of purity for use in assay development, and the molecular weight
determined by the software (shown in Figure 1) was typical for an sdAb.
DLS was used in conjunction with the Experion and NanoDrop systems to
illustrate how the protein behaved in solution. The DLS data indicate the physical state and
potential aggregation of a protein in solution by measuring the polydispersity, hydrodynamic
radius, and molecular weight of a sample. The DLS data were used to establish whether the MS2
sdAbs provided by NRL were monomeric and monodisperse. Less than 1% of the sample mass
appeared to be aggregating in solution (Figures 2 and 3). To mitigate the exacerbating effect of
freeze-thawing on future sample aggregation and provide consistent testing, the NRL MS2
sdAbs were aliquoted into single-use vials and centrifuged before use.
In the next round of testing, the thermostabilities of the NRL MS2 sdAbs were
evaluated using DSC, ELISA, and SPR. DSC was used to obtain a quantitative Tm for the MS2
sdAbs. The Tm can be used to predict the results of ELISA and SPR thermostability testing. A Tm
above 70 °C predicts that the percent activity of the MS2 sdAbs after thermal stress should
remain above 50%. A Tm below 70 °C predicts at least a 50% decrease in MS2 sdAb activity
after thermal stress. The NRL MS2 sdAb 2cams2, which was optimized for thermostability and
described herein, exhibited a Tm of 64.7 °C (Figure 4). This was compared with a Tm from the
original MS2 scFv of 67.5 °C (4). Therefore, it was expected that heating the NRL MS2 sdAb
2cams2 above 70 °C would cause the sample to unfold and lose at least 50% of its activity when
evaluated using ELISA and SPR.
The results of the thermal stress test demonstrated that the NRL MS2 sdAb did
not remain active for over 60 min of heating at 70 °C. Evaluation of the ELISA and SPR data
confirmed that the NRL sdAb 2cams2 was able to bind the MS2CP after 45 min of heating but
not for the full 60 min (Figures 6 and 7). This result was unlike that of the original MS2 scFv
reference antibody, which was unable to bind the MS2CP after only 15 min of heating at 70 °C.
SPR was also used to obtain a kinetic analysis of the affinity-enhanced NRL MS2
sdAb B1-AP binding to its target antigen (MS2CP) to compare binding parameters with the
original antibody. Kinetic data for the binding of B1-AP MS2 sdAb to the MS2CP was obtained
using the Proteon XPR36 SPR platform, which yielded a KD of 26.3 nM, and the original MS2
scFv yielded a KD of 8.66 nM (Figure 8). The KDs clearly show that the NRL results did not meet
the 100-fold improvement requested by DARPA.

17
5. CONCLUSION
The DARPA ATP sought to establish methods for rapidly engineering a given
antibody reagent that would exhibit physical and functional properties far exceeding those of its
native state, thereby expanding user confidence in fielding antibody-based detection and
diagnostic platforms for use in environments or operational scenarios that would degrade or
interfere with the currently available reagents. By optimizing the thermal stability and binding
affinity of an antibody for its biological target, the DARPA ATP will develop antibody reagents
that can reliably function in harsh environmental conditions and increase the sensitivity of sensor
platforms to detect lower levels of a threat agent.
This report documents the testing of an improved, thermostable antibody
(2cams2) and an affinity-improved antibody (B1-AP), which were both produced by NRL. This
study evaluated the physical and functional characteristics of these sdAbs in the ECBC testing
pipeline. The results were compared to the baseline characteristics of the original antibody’s
physical properties to include concentration, molecular weight, purity, state of aggregation in
solution, and functional measures such as binding affinity and thermal stability. Neither NRL
antibody exhibited enhanced thermal stability or affinity for binding to the MS2CP antigen.

18
Blank
19
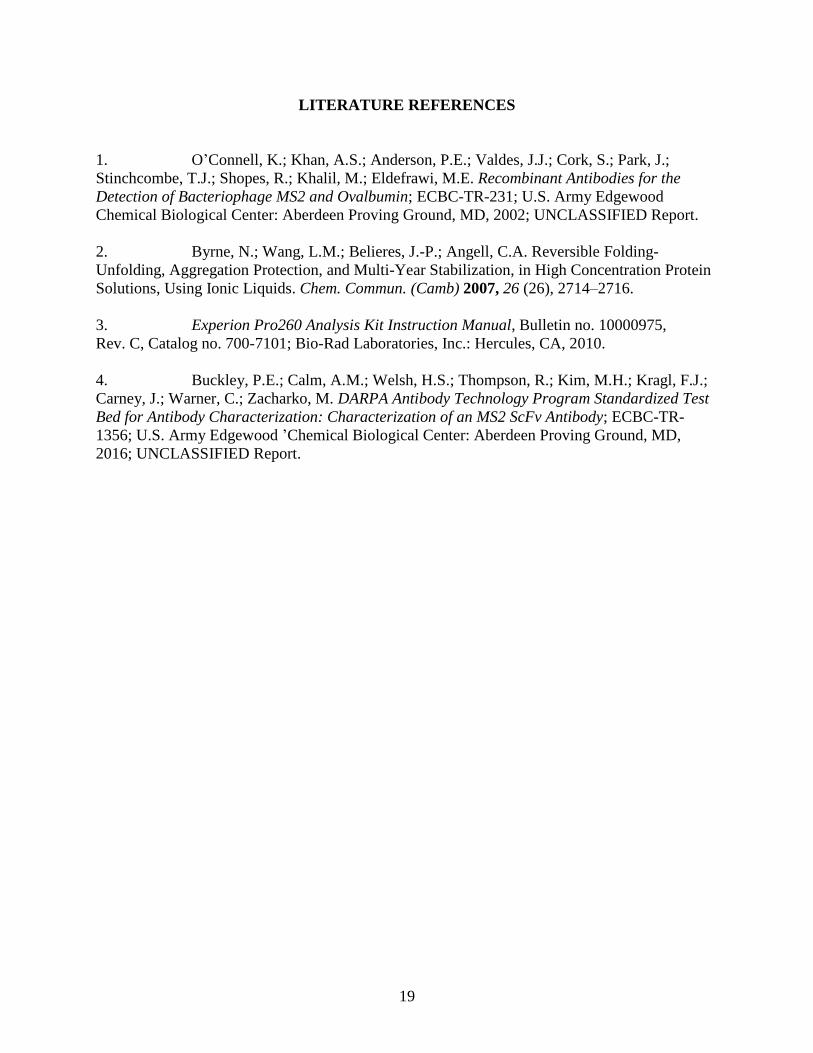
LITERATURE REFERENCES
1. O’Connell, K.; Khan, A.S.; Anderson, P.E.; Valdes, J.J.; Cork, S.; Park, J.;
Stinchcombe, T.J.; Shopes, R.; Khalil, M.; Eldefrawi, M.E. Recombinant Antibodies for the
Detection of Bacteriophage MS2 and Ovalbumin; ECBC-TR-231; U.S. Army Edgewood
Chemical Biological Center: Aberdeen Proving Ground, MD, 2002; UNCLASSIFIED Report.
2. Byrne, N.; Wang, L.M.; Belieres, J.-P.; Angell, C.A. Reversible Folding-
Unfolding, Aggregation Protection, and Multi-Year Stabilization, in High Concentration Protein
Solutions, Using Ionic Liquids. Chem. Commun. (Camb) 2007, 26 (26), 2714–2716.
3. Experion Pro260 Analysis Kit Instruction Manual, Bulletin no. 10000975,
Rev. C, Catalog no. 700-7101; Bio-Rad Laboratories, Inc.: Hercules, CA, 2010.
4. Buckley, P.E.; Calm, A.M.; Welsh, H.S.; Thompson, R.; Kim, M.H.; Kragl, F.J.;
Carney, J.; Warner, C.; Zacharko, M. DARPA Antibody Technology Program Standardized Test
Bed for Antibody Characterization: Characterization of an MS2 ScFv Antibody; ECBC-TR-
1356; U.S. Army Edgewood ’Chemical Biological Center: Aberdeen Proving Ground, MD,
2016; UNCLASSIFIED Report.

20
Blank
21
ACRONYMS AND ABBREVIATIONS
A280 absorbance of light at 280 nm
ABTS 2,2'-azino-bis(3-ethylbenzthiazoline-6-sulphonic acid)
ATP Antibody Technology Program
BGG bovine γ-globulin
CRP Critical Reagents Program
DARPA Defense Advanced Research Projects Agency
DLS dynamic light scattering
DSC differential scanning calorimetry
ECBC U.S. Army Edgewood Chemical Biological Center
ELISA enzyme-linked immunosorbent assay
HRP horseradish peroxidase
JPMO BSV Joint Product Management Office for Biosurveillance
ka association rate constant
kd dissociation rate constant
KD affinity constant
MDB milk diluent block
MS2CP MS2 coat protein
NRL U.S. Naval Research Laboratory
PBS phosphate-buffered saline
PBS-T phosphate-buffered saline with 0.05% Tween 20
RMax maximum analyte-binding capacity of the surface in RU
RU response unit
scFv single-chain fragment variable
sdAb single domain antibody
SPR surface plasmon resonance
Tm melting temperature
UV-Vis ultraviolet-visible spectroscopy

DISTRIBUTION LIST
The following individuals and organizations were provided with one Adobe
portable document format (pdf) electronic version of this report:
U.S. Army Edgewood Chemical
Biological Center (ECBC)
RDCB-DRB-M
ATTN: Buckley, P.
Thompson, R.
Defense Threat Reduction Agency
J9-CBS
ATTN: Graziano, A.
Department of Homeland Security
DHS-ORD-CSAC
ATTN: Famini, G.
DHS Chemical Security Analysis Center
RDCB-PI-CSAC
ATTN: Negron, A.
Defense Technical Information Center
ATTN: DTIC OA
G-3 History Office
U.S. Army RDECOM
ATTN: Smart, J.
ECBC Technical Library
RDCB-DRB-BL
ATTN: Foppiano, S.
Stein, J.
Office of the Chief Counsel
AMSRD-CC
ATTN: Upchurch, V.
ECBC Rock Island
RDCB-DES
ATTN: Lee, K.