Embed Size (px)
Citation preview
Dark Sky Project The study of light pollution and its effects on Mount Desert
Island for the Acadia National Park
An Interactive Qualifying Project submitted to the faculty of Worcester Polytechnic Institute in partial fulfillment of the requirements for the
Degree of Bachelor of Science
Submitted by:
Andrew Larsen Joshua Morse Mario Rolón Sarah Roth
Submitted to:
Project Advisors:
Prof. Frederick Bianchi
Project Liaison:
Acadia National Park
July, 31 2013
Table of Contents
Authorship..................................................................................................................................... IV Acknowledgements ......................................................................................................................... V Abstract ......................................................................................................................................... VI Executive Summary ..................................................................................................................... VII Chapter 1: Introduction ................................................................................................................. 11 Chapter 2: Background ................................................................................................................. 12
2.1 Acadia National Park ....................................................................................................... 12 2.1.1 The Community ....................................................................................................... 13
2.2 Previous Research ............................................................................................................ 14 2.3 Light Pollution ................................................................................................................. 16 2.4 Ecological and Physiological Impacts of Light Pollution ............................................... 17
2.4.1 Ecological Impacts ................................................................................................... 17 2.4.2 Physiological Impacts .............................................................................................. 19
2.5 Summary .......................................................................................................................... 20 Chapter 3: Methodology ............................................................................................................... 20
3.1 Calendar ........................................................................................................................... 20 3.2 Preparation and Equipment Testing ................................................................................. 21
3.2.1 Assessing Locations ................................................................................................. 21 3.2.2 Equipment Testing ................................................................................................... 22
3.3 Acquiring Raw Light Pollution Data ............................................................................... 23 3.4 Mapping Data .................................................................................................................. 24
3.4.1 Geographic Information System .............................................................................. 25 3.4.2 Bortle Scale .............................................................................................................. 26
3.5 Summary .......................................................................................................................... 28 Chapter 4: Results ......................................................................................................................... 28
4.1 Collection of Data ............................................................................................................ 29 4.2 GIS Maps ......................................................................................................................... 30 4.3 Analysis ........................................................................................................................... 34
4.3.1 Lens Difference ........................................................................................................ 34 4.3.2 Season Difference .................................................................................................... 35 4.3.3 Reasoning for the Bortle Scale ................................................................................. 36 4.3.4 Points of Interest ...................................................................................................... 36
Chapter 5: Recommendations ....................................................................................................... 41 5.1 Study Continuation and Expansion .................................................................................. 41
5.1.1 Summer Study .......................................................................................................... 41 5.1.2 Winter Study ............................................................................................................ 43 5.1.3 Schoodic Peninsula .................................................................................................. 43
5.2 Time-Lapse Graphs .......................................................................................................... 43 Chapter 6: Conclusion ................................................................................................................... 44 Appendix A: Python Program ....................................................................................................... 46 Appendix B: Light Readings and GPS Coordinates ..................................................................... 48 Appendix C: Magnitudes per Square Arcsecond (mag/arcsec2) ................................................... 51
III
Appendix D: Extra Maps .............................................................................................................. 52 Works Cited .................................................................................................................................. 56
Table of Figures Figure 1: Map of Acadia National Park ........................................................................................ 13 Figure 2: Light Pollution on Mount Desert Island ........................................................................ 15 Figure 3: Illustrating lighting efficiency ....................................................................................... 17 Figure 4: Illustrating the differences between ecological and astronomical light pollution ........ 18 Figure 5: Dark Sky Project calendar ............................................................................................. 20 Figure 6: Lunar calendar of July 2013 .......................................................................................... 22 Figure 7: SQM-LU-DL ................................................................................................................. 24 Figure 8: UTM coordinate system diagram .................................................................................. 25 Figure 9: The Bortle Scale ............................................................................................................ 27 Figure 10: Comparison of Bortle Scale to mag/arcsec2 ................................................................ 28 Figure 11: Dark Sky Travel Path .................................................................................................. 29 Figure 12: Dark Sky Map With College of the Atlantic Color Scale ........................................... 30 Figure 13: Dark Sky Final Map of Mount Desert Island .............................................................. 31 Figure 14: Dark Sky Final Map of Schoodic Peninsula ............................................................... 32 Figure 15: Dark Sky Final Map With Acadia National Park Boundaries ..................................... 33 Figure 16: Sky Quality Meter lens comparison ............................................................................ 35 Figure 17: Bar Harbor ................................................................................................................... 37 Figure 18: Northeast Harbor and Southwest Harbor .................................................................... 38 Figure 19: Somesville Area .......................................................................................................... 39 Figure 20: Sand Beach .................................................................................................................. 40 Figure 21: Seawall Campground and Picnic Area ........................................................................ 41 Figure 22: Island expansion sites .................................................................................................. 42 Figure 23: Sky Quality Over Time ............................................................................................... 44
IV
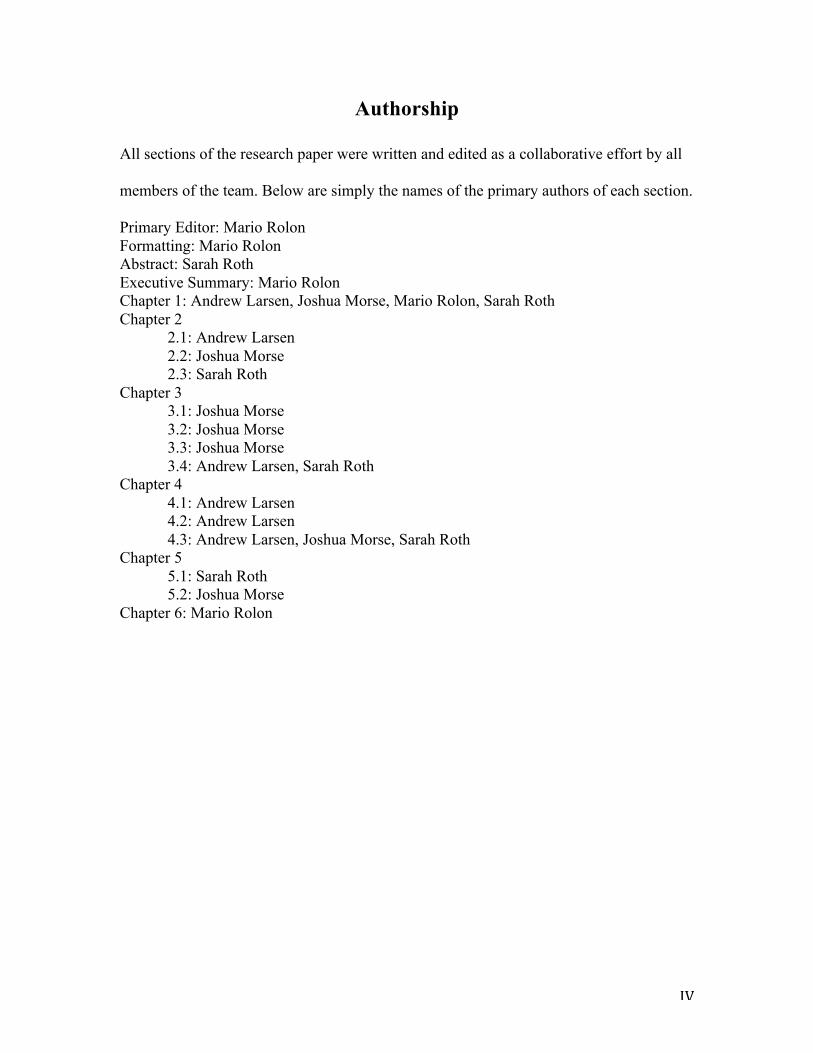
Authorship
All sections of the research paper were written and edited as a collaborative effort by all
members of the team. Below are simply the names of the primary authors of each section.
Primary Editor: Mario Rolon Formatting: Mario Rolon Abstract: Sarah Roth Executive Summary: Mario Rolon Chapter 1: Andrew Larsen, Joshua Morse, Mario Rolon, Sarah Roth Chapter 2 2.1: Andrew Larsen 2.2: Joshua Morse 2.3: Sarah Roth Chapter 3 3.1: Joshua Morse 3.2: Joshua Morse 3.3: Joshua Morse 3.4: Andrew Larsen, Sarah Roth Chapter 4 4.1: Andrew Larsen 4.2: Andrew Larsen 4.3: Andrew Larsen, Joshua Morse, Sarah Roth Chapter 5 5.1: Sarah Roth 5.2: Joshua Morse Chapter 6: Mario Rolon
V
Acknowledgements
The team would like to give special thanks to specific people that were
instrumental to the creation of this project. Dr. Abraham Miller-Rushing, the sponsor
liaison, who helped with the guidance of the project and provided important contact
information. Mr. Gordon Longsworth, the director of the College of the Atlantic GIS lab,
who helped immensely in the creation of the final maps that resulted from the study. Dr.
Frederick Bianchi, the project advisor, who made sure the project stayed on track.
Finally, Dr. Robert Traver, the professor during the preparation period, who helped with
the writing of the project proposal. Many thanks to all of them!
VI
Abstract
The purpose of this project was to map the quality of the sky on Mount Desert
Island and Schoodic Peninsula for the National Park Service. The first phase of the
project was acquiring data points from across the island using a Sky Quality Meter. The
second involved mapping the data using Geographic Information System software. The
results of this project can be used by Acadia National Park to advise new lighting
ordinance policies within the park and in major towns on Mount Desert Island.
VII
Executive Summary
Synthetic lighting is often seen as an advance in technology and an improvement
in the quality of life. Yet the use of excessive lighting is detrimental to the local
environment. Large urban areas and cities emanate a vast amount of light during the
night, causing sky glow. This in turn covers the dark sky and hides the view of stars,
planets, and the Milky Way.
The Dark Sky Project’s goal is to prevent sky glow from covering the skies of
Mount Desert Island and Acadia National Park; one of the few locations left in the
Northeast to still have a clear view of the sky.
The Dark Sky Project is a response to the National Park Service’s Call to Action.
Under the sponsorship of Acadia National Park, the team focused on point 27, “Starry,
Starry Night.” The point focuses on natural darkness, classifying it as a natural resource.
It calls for the preservation of a natural dark sky, in an effort to restrain man-made light
from intruding on such.
College of the Atlantic (CoA) and the Astronomy Institute of Maine are the only
studies done on light levels on Mount Desert. In the winter of 2006/2007, two students
from the CoA created a color-scale map representing the different light levels across the
island using Sky Quality Meters (SQMs). The Astronomy Institute of Maine, on the other
hand, used special CCD cameras and created gradient pictures of specific locations
throughout the island. The Dark Sky Project based their study off of the CoA study.
There are three reasons for synthetic lighting: general illumination, security, and
decorative. Light pollution is created from excessive use of this lighting. The three types
VIII
of light pollution are upward light, light trespass, and source intensity. Light pollution has
detrimental effects on the ecology of an area. The physiology of humans can be affected.
Many animals are affected from excess lighting by disturbing their circadian
clock. Light pollution can have several effects on humans and even be a promoter of
cancer.
Following a specific calendar, the Dark Sky Project executed their study over
seven weeks, starting mid June through the end of July 2013. The first steps were to
assess possible locations to take readings and to test the equipment. Certain criteria had to
be met in order for the locations to be valid. Key aspects such as tree coverage, weather,
and the lunar calendar were closely monitored in order to get consistent readings.
The most important piece of equipment used was the Sky Quality Meter Lens
USB Data Logger (SQM-LU-DL). The device is used to collect light readings of the sky,
measured in magnitudes per square arcsecond. Using the meter and a Global Positioning
System (GPS) device, the team was able to collect the raw data across the island.
After the collection of raw data, the next step was the creation of maps using
Geographic Information System (GIS) software. Using the GPS coordinates and the SQM
readings, the software can use interpolation to generate a color-coded map.
The Bortle scale is widely accepted by astronomers as a way to assess the quality
of a night sky. Ranging from 1 to 9, the Bortle scale classifies different night skies from
darkest to brightest respectively.
The collection of data was carried out by driving along main roads, secondary
roads, and some fire roads, and taking measurements along the way. The team made sure
IX
to stop every half-mile, or as often as possible if tree coverage was too dense for proper
readings.
The team was able to create various maps to represent light levels on the island. In
order to compare the new results to the CoA study, the first map created used the same
color scale. This proved to give a low quality representation of the data, so the team used
the Bortle scale to illustrate their final results. Finally, the team created modified versions
of the map. For example, a map was made marking the park boundaries.
Final analysis compares the CoA study to the WPI study. It describes the benefits
from using the Bortle scale over the CoA’s scale, and finally discusses certain points of
interest on the island.
An important factor was the different SQMs used by the two studies. The
difference in lens width was the most important difference between the two studies.
Another inconsistency was the season each study was conducted. The CoA study was
done during the winter, while the WPI study was done during the summer.
The reasoning behind using the Bortle scale is simple. Since astronomers and
stargazers commonly use the scale, the color scheme is easily identified and understood.
Additionally, the Bortle scale gave a more comprehensive representation of the data
collected by the WPI team.
The team analyzed specific points of interest on the island. Bar Harbor, Northeast
Harbor, Southwest Harbor, and the Somesville area were analyzed because of bright light
emissions. Seawall and Sand Beach were analyzed because of their dark readings.
Finally, the team explains recommendations for future studies. Continuation of
the project during the summer would be ideal in order to start a longitudinal study.
X
Expansion to other seasons to have a comparison between different times of the year was
recommended. Additional studies were recommended. A more thorough study on
Schoodic Peninsula and time-lapse studies on different parts of the island were suggested.
The Dark Sky Project met the goals they set. The collection of data and creation
of maps was successful. A baseline for future studies on Mount Desert Island was
created.
11
Chapter 1: Introduction
Light pollution is an increasing problem in the United States. Presently more
than two thirds of the United States population cannot view a clear dark sky. Large cities
and urban areas where lights remain lit throughout the night produce light pollution. The
emitted light brightens up the sky to the point where stars and planets cannot be seen.
Light pollution, by definition, is “the alteration of light levels in the outdoor environment
(from those present naturally) due to man-made sources of light” (Hollan 3). The
objective of the Dark Sky Project is to measure, analyze, and map light pollution.
The lightscape of the Acadia National Park is of great value and significance
not only to the park itself, but to the entire Mount Desert Island area and neighboring
communities. It is one of the only places in the United States where a clear, unpolluted
sky can be seen, showing a vast number of stars and a clear view of the Milky Way. If
proper methodologies to preserve this sight are established and maintained, Mount Desert
Island will always be a place to look to the stars.
There is currently limited research dedicated to light pollution on Mount Desert
Island. A study was conducted in the winter of 2006/2007 by two students from the
College of the Atlantic (CoA). The students took measurements with sky quality meters
(SQMs) throughout the island. The result was a gradient map showing different light
levels constructed using a Geographic Information System. No comparable research has
been conducted in recent years.
The project was conducted as a response to Acadia National Park's Night Sky
Initiative. The Dark Sky Project created a basis for future research on Mount Desert
12
Island. The team outlined how to measure and document light pollution and established a
stepping-stone toward preserving this unique piece of Mount Desert Island.
Chapter 2: Background
The Dark Sky Project aims to aid Acadia National Park in its mission to
maintain a clear night sky. In this section, Acadia National Park's Call to Action and light
pollution research is discussed. Research related to health and environmental impacts is
examined. The importance of a clear night sky is described and examples are cited.
2.1 Acadia National Park
A Call to Action issued by the National Park Service includes thirty-six points.
The points focus on self-improvement in preparation for the National Park's 2016
centennial. Point 27 of that plan, “Starry, Starry Night”, classifies natural darkness as a
precious resource and creates a model for its protection (US National Park Service 20). A
report issued in 2006 states it is the National Park Services’ mandate to
“[P]reserve, to the greatest extent possible, the natural light scape of parks,
which are natural resources and values that exist in the absence of human-
caused light... [t]o prevent the loss of dark conditions and of natural night skies,
the Service will minimize light that emanates from park facilities, and seek the
cooperation of park visitors, neighbors, and local government agencies to
prevent or minimize the intrusion of artificial light into the night scene of the
ecosystems of parks” (National Park Service 57)
Natural darkness is a primary attraction of Acadia National Park. Monitoring this
important aspect of the natural world is indispensable to maintain the park’s large influx
of visitors. It is part of an enriching outdoor experience that cannot necessarily be found
13
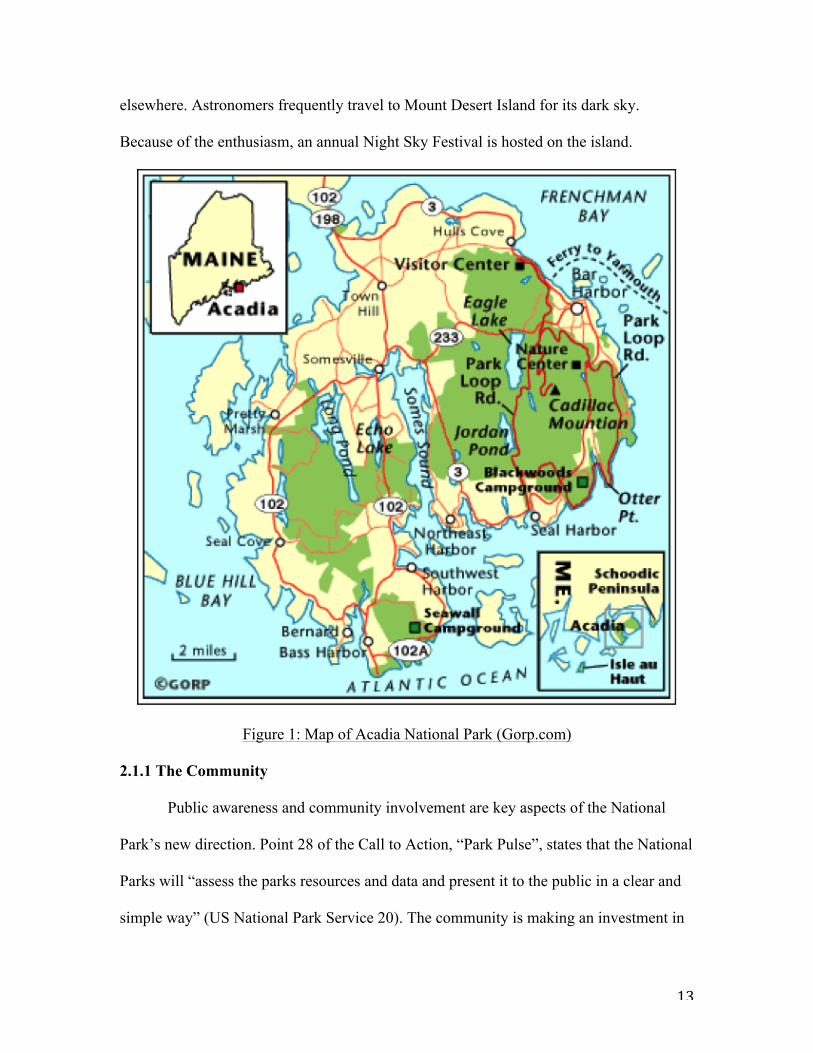
elsewhere. Astronomers frequently travel to Mount Desert Island for its dark sky.
Because of the enthusiasm, an annual Night Sky Festival is hosted on the island.
Figure 1: Map of Acadia National Park (Gorp.com)
2.1.1 The Community
Public awareness and community involvement are key aspects of the National
Park’s new direction. Point 28 of the Call to Action, “Park Pulse”, states that the National
Parks will “assess the parks resources and data and present it to the public in a clear and
simple way” (US National Park Service 20). The community is making an investment in
14
the future by improving light efficiency, methods, and usage. Point 27, “Starry, Starry
Night”, includes a clause that urges National Parks to partner with the local community to
achieve the goal of reduced artificial light (US National Park Service 20). Monitoring
light pollution is currently a challenge for the National Park Service. This is especially
true for smaller national parks, like Acadia, because they coexist with bustling towns like
Bar Harbor.
Acadia National Park is looking at the issue of light pollution from a marketing
and educational perspective. The Night Sky Initiative created in 2009 lists long-term
objectives designed for this purpose. The park’s outlined plans include work with the
public to quantify sky brightness using SQMs, develop alternative outdoor lighting
solutions, educate residents and park visitors about the value of the natural dark sky,
develop community stewardship plans, and educate young residents in schools (Kelly).
Bar Harbor hosts a biennial conservation summit. In 2007, the participating
organizations drafted the first Dark Sky Ordinance for Bar Harbor. The former director of
The Astronomy Institute of Maine, Peter Lord, served as a consultant for the project. The
end result of the project was an amendment that standardized Bar Harbor’s lighting
requirements (Maine Association of Conservation Commissions).
2.2 Previous Research
The College of the Atlantic research consisted of light measurements taken along
the roads across Mount Desert Island. The light measurements were taken using a
Unihedron SQMs. This SQM takes readings in a 42° cone above the device. Two
students conducted it over two consecutive clear nights during the winter of 2006/2007.
They used ArcGIS, a Geographic Information System to map and interpolate their 140
15
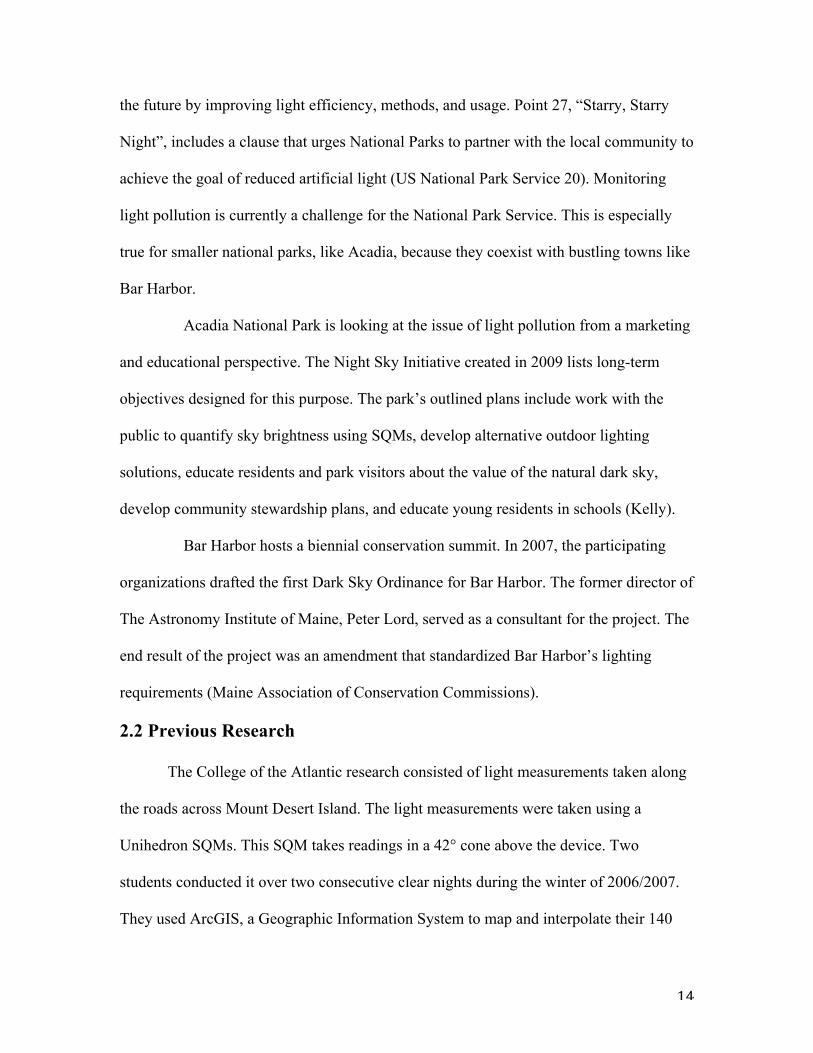
data points. The maps that were created show an easy-to-understand visual representation
of the light pollution present on the island.
Figure 2: Light Pollution on Mount Desert Island (Bacon, Geholt)
The Astronomy Institute of Maine (AIM) conducted research consisting of light
measurements taken at specific locations across Mount Desert Island. Using special CCD
cameras and custom software developed by Chad Moore for the project, nightscape
images showing only the artificial light data were produced. Detailed reports showing the
nightscape images for each location, the readings, and weather conditions at the time of
16
the recording were the result of Acadia National Park’s effort to assess light pollution on
Mount Desert Island. Preliminary data reports were submitted to Acadia National Park in
2010 to show comparisons (Astronomy Institute of Maine).
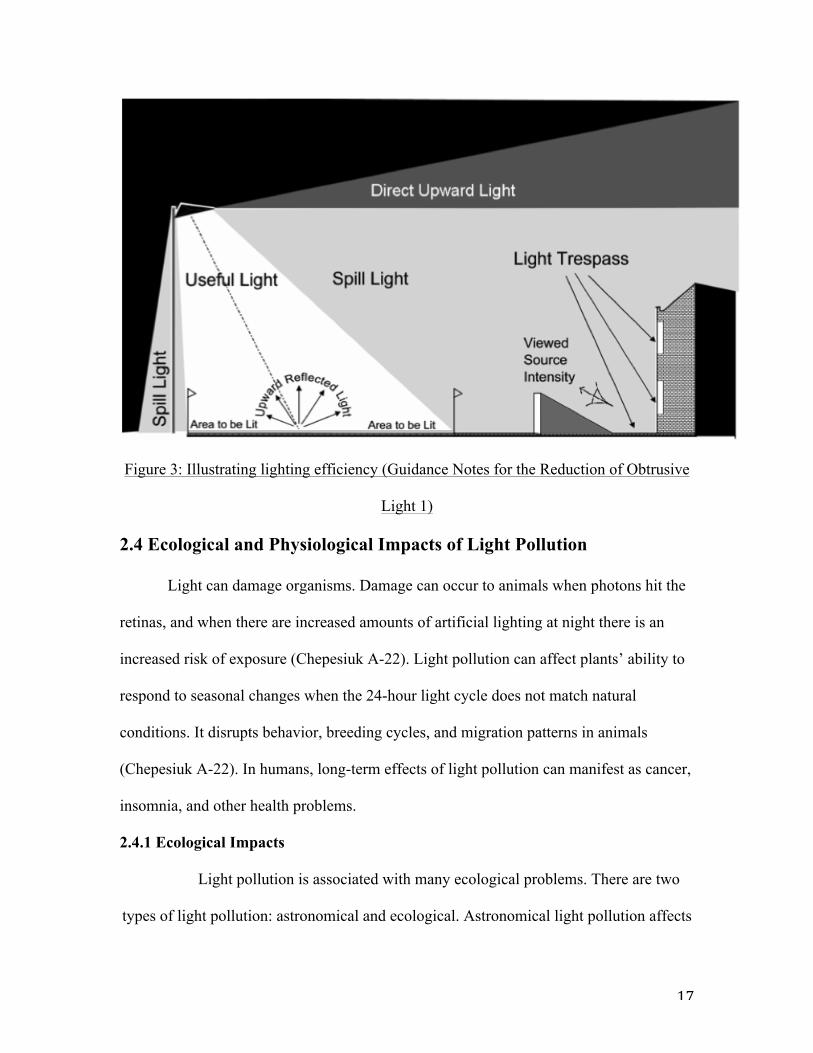
2.3 Light Pollution
Outdoor lighting is typically regulated but sometimes it is unneeded and wasteful,
or even provides too much light for its purpose. The Lighting Code Handbook lists three
reasons for outdoor lighting: general illumination, security, and decorative. General
illumination allows pedestrians to navigate nearby areas safely. Security lighting
improves the sense of safety and reduces the risk of crime. Decorative lighting enhances
appearances of an area (International Dark Sky Association 7-8).
The three forms of light pollution listed in the handbook by the Institution of
Lighting Engineers (ILE) are upward light, light trespass, and source intensity. Upward
facing lights create sky glow. Sky glow is “the brightening of the night sky above our
towns, cities and countryside” (The Institution of Lighting Engineers 1). Light trespass
occurs when light from outdoor fixtures spills into unintended areas. Source intensity is
the wattage, or lumen output of the bulb (The Institution of Lighting Engineers 1).
17
Figure 3: Illustrating lighting efficiency (Guidance Notes for the Reduction of Obtrusive
Light 1)
2.4 Ecological and Physiological Impacts of Light Pollution
Light can damage organisms. Damage can occur to animals when photons hit the
retinas, and when there are increased amounts of artificial lighting at night there is an
increased risk of exposure (Chepesiuk A-22). Light pollution can affect plants’ ability to
respond to seasonal changes when the 24-hour light cycle does not match natural
conditions. It disrupts behavior, breeding cycles, and migration patterns in animals
(Chepesiuk A-22). In humans, long-term effects of light pollution can manifest as cancer,
insomnia, and other health problems.
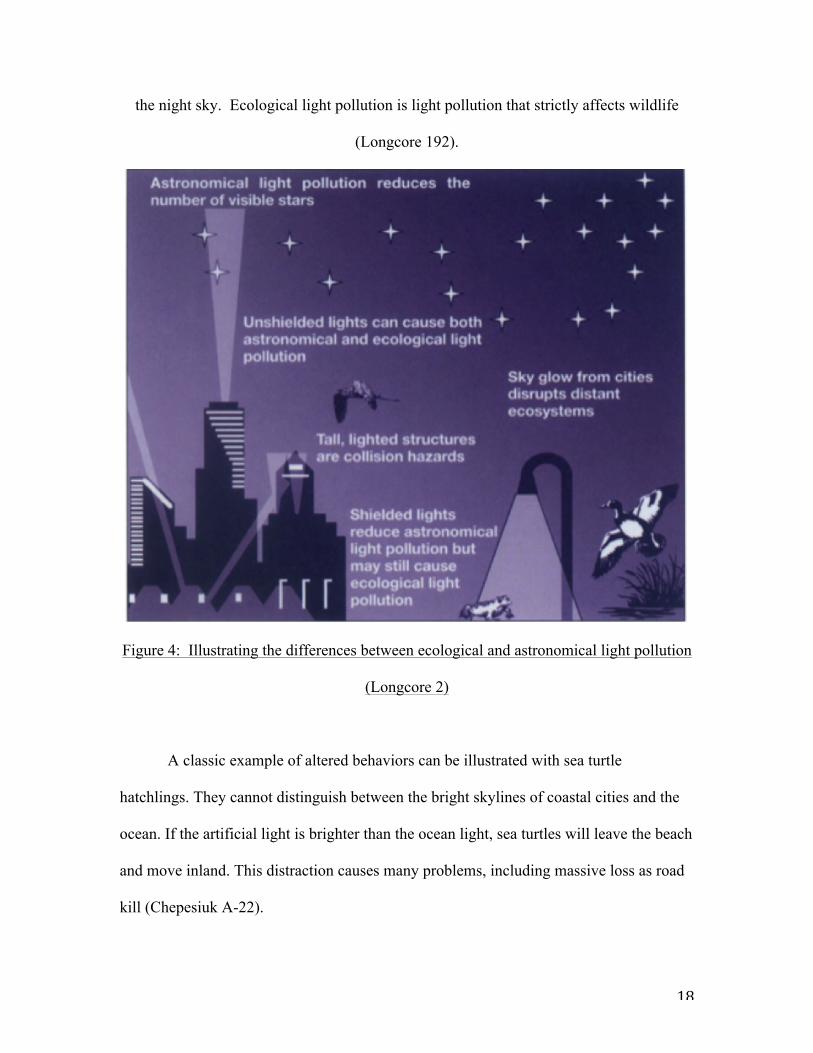
2.4.1 Ecological Impacts
Light pollution is associated with many ecological problems. There are two
types of light pollution: astronomical and ecological. Astronomical light pollution affects
18
the night sky. Ecological light pollution is light pollution that strictly affects wildlife
(Longcore 192).
Figure 4: Illustrating the differences between ecological and astronomical light pollution
(Longcore 2)
A classic example of altered behaviors can be illustrated with sea turtle
hatchlings. They cannot distinguish between the bright skylines of coastal cities and the
ocean. If the artificial light is brighter than the ocean light, sea turtles will leave the beach
and move inland. This distraction causes many problems, including massive loss as road
kill (Chepesiuk A-22).
19
There are many other studies of the effects of light pollution on animal
behavior. One study conducted by Mark Miller addresses changes in American Robin
song patterns due to increased light. The study was conducted in areas where the level of
artificial light differed during the night. Miller determined that song activity increased
before dawn in areas with higher amounts of artificial light during “true night” (130). In
another study, foraging behaviors of beach mice were affected by artificial lighting on
beaches. Mice foraged at more patches in dark areas than in light areas, and foraged
fewer seeds in light areas (BIRD et al. 1437).The researchers do note that these readings
reflect microhabitat level analysis and may not fully represent the problem on a large
scale (BIRD et al. 1437).
Outdoor lighting utilizes brighter energy-efficient methods, such as light-
emitting diodes (LEDs). These brighter lights have negative effects on the foraging
behavior of certain bat species. The increased ambient light delays the emergence of bats
at night. This limits the amount of time bats have to hunt (Stone et al. 2584).
2.4.2 Physiological Impacts
There are many physiological effects of light pollution in humans. Exposure to
light stresses the body, and prolonged stress weakens the body’s immune response
(Navara et al. 217). The Navara paper suggests that prolonged exposure to artificial light
may increase the risks of cancer in exposed individuals due to a number of factors
including epidermal cell damage and suppressed immune response due to stress (217).
Exposure to light at night suppresses melatonin secretion by the pineal gland. Changes in
melatonin levels affect immune response, metabolism, and hormone levels in the body
(Chepesiuk A-26). Low nighttime levels of melatonin in the body have been linked to
20
heart disease, type II diabetes, and obesity. Melatonin may suppress tumor growth, and
the absence of melatonin due to light pollution may increase the risk of breast and colon
cancers (Chepesiuk A-24, A-26).
2.5 Summary
As seen in the previous sections, light pollution is a silent but serious issue.
The Dark Sky Project contributed to previous efforts to combat light pollution in Mount
Desert Island and Acadia National Park.
Chapter 3: Methodology
This chapter discusses how the Dark Sky Project was executed. The team
reviews the project calendar, methods for data collection and analysis, and plans for
dissemination of project results.
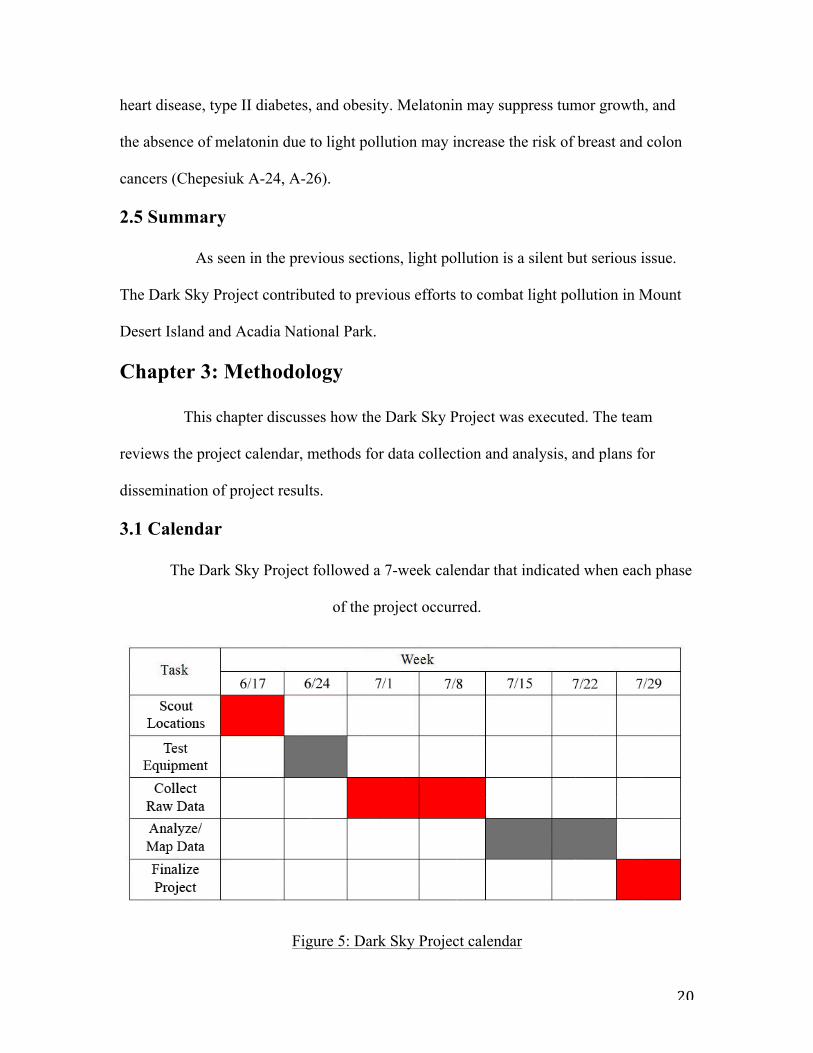
3.1 Calendar
The Dark Sky Project followed a 7-week calendar that indicated when each phase
of the project occurred.
Figure 5: Dark Sky Project calendar
21
3.2 Preparation and Equipment Testing
3.2.1 Assessing Locations
The team began the project by scouting sites for measuring light pollution. The
following factors were addressed to ensure adequate coverage of Mount Desert Island:
• Popular Park Visitor Locations
• Open Sky
• Time Restrictions
• Accessibility
• Extensive Coverage
Acadia National Park attracts thousands of park visitors during the summer
months (NPS Stats Report Viewer). The team designed a plan that accounted for
locations park visitors typically go to view the sky. A few of these locations include Sand
Beach, Thunder Hole, Cadillac Mountain, and Otter Cliffs. This information was
obtained from the team’s sponsor.
Measuring light levels in the night sky requires a set of parameters to obtain
useful data. The most important of these parameters is to have an unobstructed view of
the sky. The team surveyed areas around the island to ensure that this was not a problem.
The locations were recorded via geographical positioning devices.
There are limiting factors when choosing sites. Time was a limiting factor in the
number of sites accessed. Research time in Acadia National Park was limited, and useful
light pollution measurements could only be collected at night. Taking the measurements
after astronomical twilight ensured a dark sky. The Lunar cycle was another factor
22
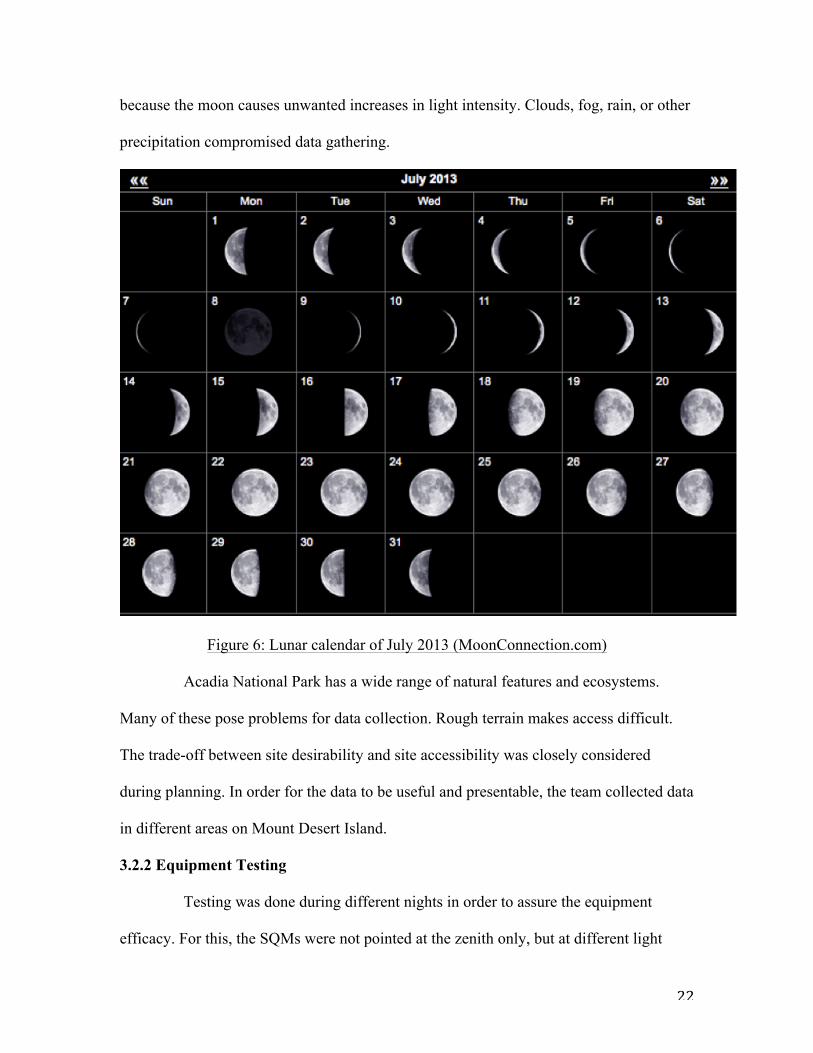
because the moon causes unwanted increases in light intensity. Clouds, fog, rain, or other
precipitation compromised data gathering.
Figure 6: Lunar calendar of July 2013 (MoonConnection.com)
Acadia National Park has a wide range of natural features and ecosystems.
Many of these pose problems for data collection. Rough terrain makes access difficult.
The trade-off between site desirability and site accessibility was closely considered
during planning. In order for the data to be useful and presentable, the team collected data
in different areas on Mount Desert Island.
3.2.2 Equipment Testing
Testing was done during different nights in order to assure the equipment
efficacy. For this, the SQMs were not pointed at the zenith only, but at different light
23
sources as well. This decreased risk of malfunction. In order to test the GPS device, the
team visited various locations and took coordinate readings.
3.3 Acquiring Raw Light Pollution Data
The most vital step to assess light pollution is to collect data in a consistent
manner. Consistent data collection requires:
• Sky Quality Meter – Lens USB - Data Logger (SQM-LU-DL)
• Global Positioning System Device (GPS)
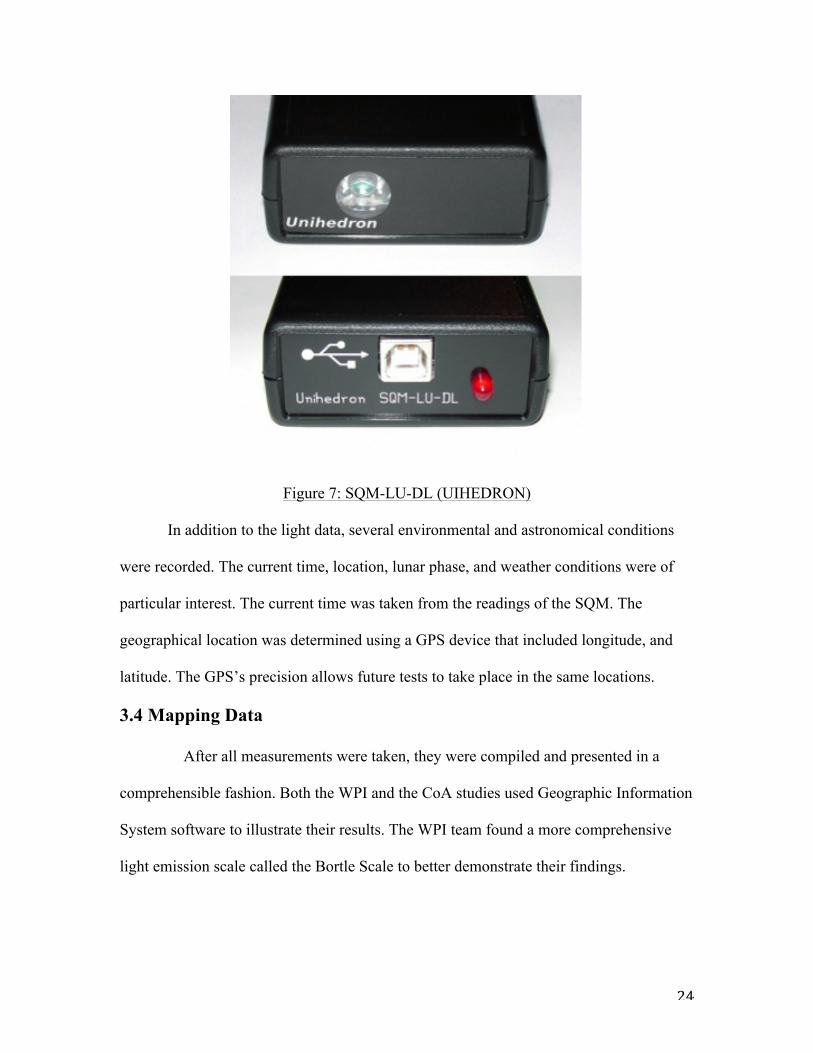
The most important resource utilized was the SQM. The SQM measures the
intensity of light in magnitudes per square arcsecond (mpsas). This number is an average
of the amount of light in a small section of sky. More information about mpsas can be
found in Appendix C. To take a reading, the device should be pointed at the zenith of the
sky. A reading can be taken every pre-set period of time or it can be taken manually with
a computer. The reading taken is stored in the device. The data can be retrieved with a
USB cable and downloaded to a computer for analysis. To ensure accuracy, three
readings were taken and the average of them was recorded per site.
24
Figure 7: SQM-LU-DL (UIHEDRON)
In addition to the light data, several environmental and astronomical conditions
were recorded. The current time, location, lunar phase, and weather conditions were of
particular interest. The current time was taken from the readings of the SQM. The
geographical location was determined using a GPS device that included longitude, and
latitude. The GPS’s precision allows future tests to take place in the same locations.
3.4 Mapping Data
After all measurements were taken, they were compiled and presented in a
comprehensible fashion. Both the WPI and the CoA studies used Geographic Information
System software to illustrate their results. The WPI team found a more comprehensive
light emission scale called the Bortle Scale to better demonstrate their findings.
25
3.4.1 Geographic Information System
The College of the Atlantic has a dedicated Geographic Information System lab.
The lab uses a ArcGIS as the primary software. It is the same software used to create the
map from the previous study. The team used it to create the final maps.
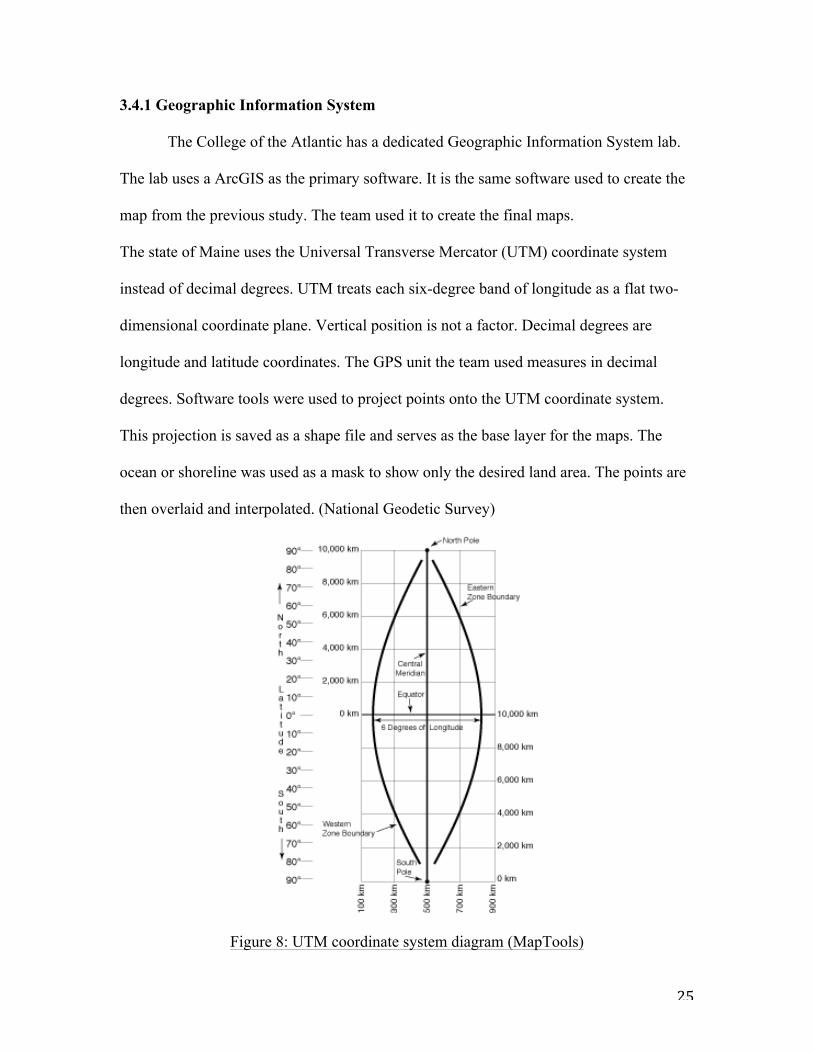
The state of Maine uses the Universal Transverse Mercator (UTM) coordinate system
instead of decimal degrees. UTM treats each six-degree band of longitude as a flat two-
dimensional coordinate plane. Vertical position is not a factor. Decimal degrees are
longitude and latitude coordinates. The GPS unit the team used measures in decimal
degrees. Software tools were used to project points onto the UTM coordinate system.
This projection is saved as a shape file and serves as the base layer for the maps. The
ocean or shoreline was used as a mask to show only the desired land area. The points are
then overlaid and interpolated. (National Geodetic Survey)
Figure 8: UTM coordinate system diagram (MapTools)
26
The spatial analysis software uses an Inverse Distance Weighted (IDW)
interpolation tool to determine cell values from the location-dependent data points.
Locations are specified by the teams collected GPS coordinates. The dependent data
points are the values from the SQM. Layers can be added to enhance the image. Layers
include Park boundaries, bodies of water, roads, contours and shadows, and the points
themselves. Colors and value scales can be customized to create the desired visual
gradient. (Environmental Systems Research Institute)
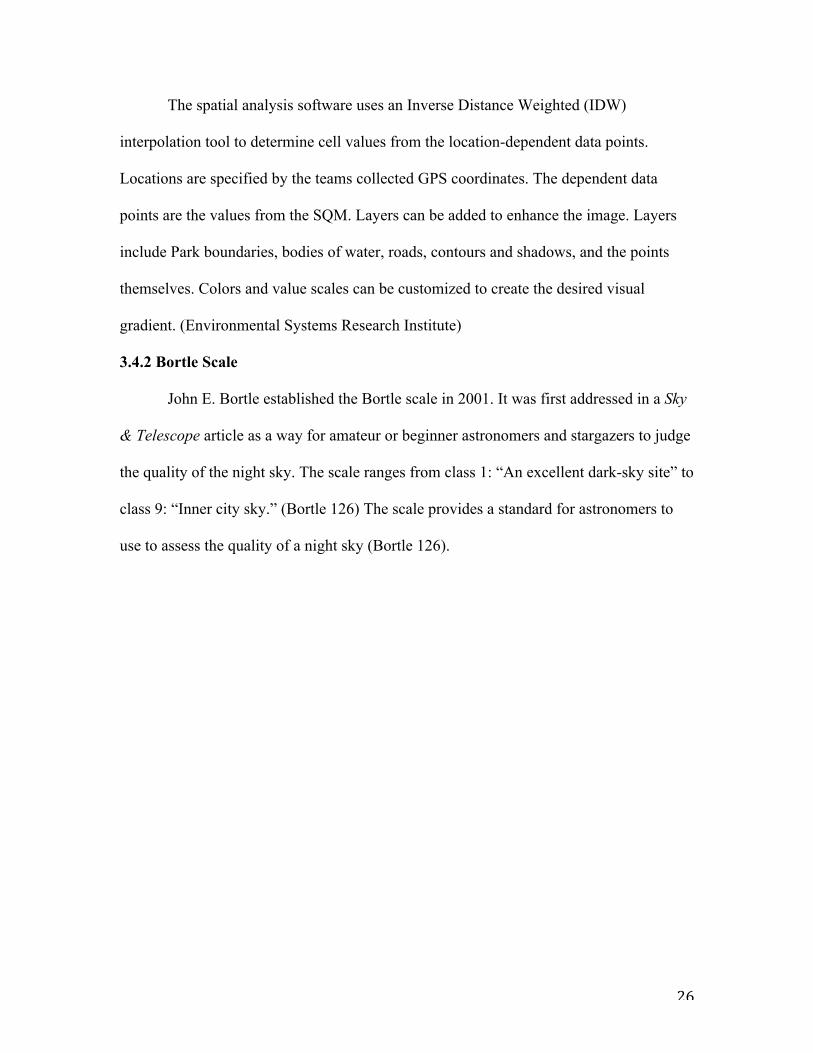
3.4.2 Bortle Scale
John E. Bortle established the Bortle scale in 2001. It was first addressed in a Sky
& Telescope article as a way for amateur or beginner astronomers and stargazers to judge
the quality of the night sky. The scale ranges from class 1: “An excellent dark-sky site” to
class 9: “Inner city sky.” (Bortle 126) The scale provides a standard for astronomers to
use to assess the quality of a night sky (Bortle 126).
27
Figure 9: The Bortle Scale (Filmer)
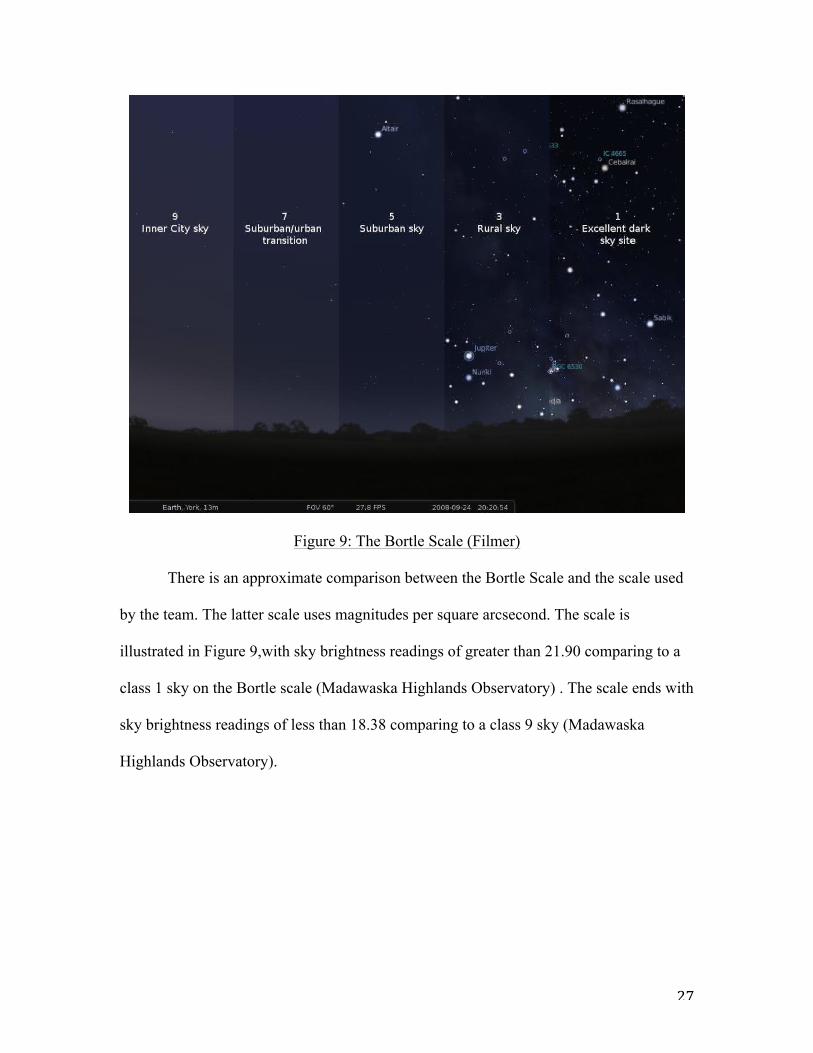
There is an approximate comparison between the Bortle Scale and the scale used
by the team. The latter scale uses magnitudes per square arcsecond. The scale is
illustrated in Figure 9,with sky brightness readings of greater than 21.90 comparing to a
class 1 sky on the Bortle scale (Madawaska Highlands Observatory) . The scale ends with
sky brightness readings of less than 18.38 comparing to a class 9 sky (Madawaska
Highlands Observatory).
28
Figure 10: Comparison of Bortle Scale to mag/arcsec2 (Madawaska Highlands
Observatory)
3.5 Summary
The dark sky team aimed to measure light on Mount Desert Island. The team
took measurements across the island, and later presented the results to the Acadia
National Park. This created a baseline for future standardized research on Mount Desert
Island.
Chapter 4: Results
In this chapter, the collection of data is explained. The final maps are presented
and a comparison between the previous study and the present one is made. Finally, a brief
analysis of the team’s findings is explained.
29
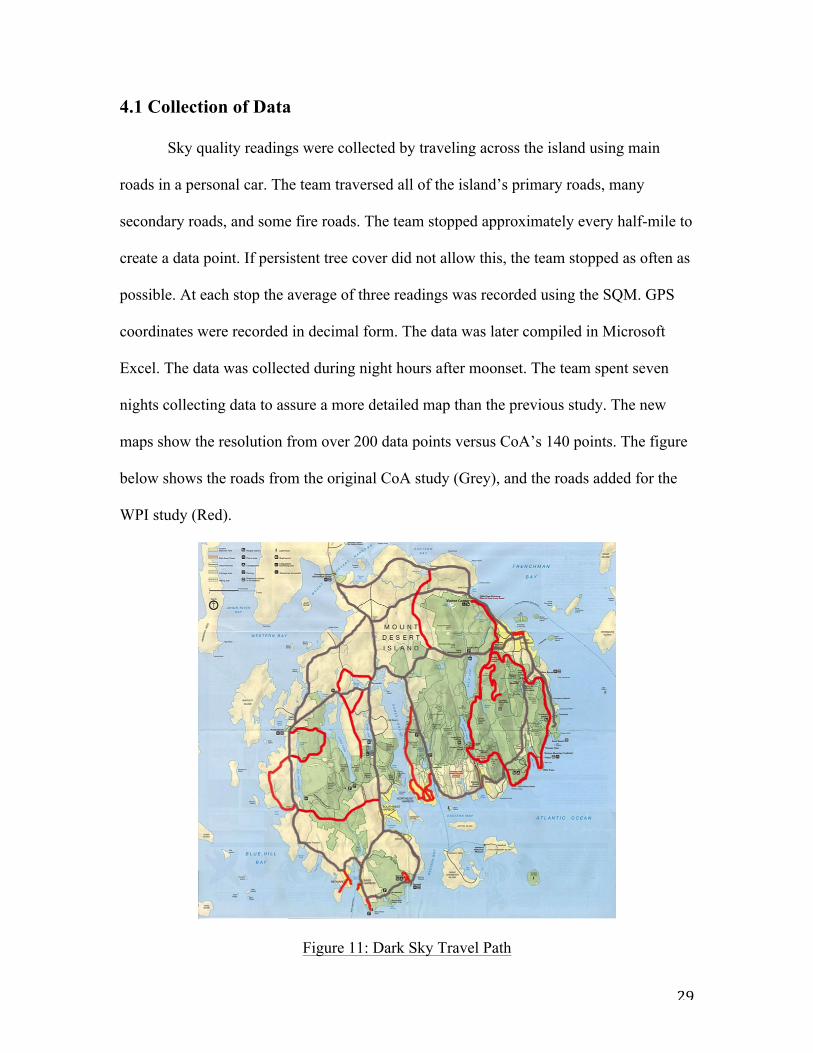
4.1 Collection of Data
Sky quality readings were collected by traveling across the island using main
roads in a personal car. The team traversed all of the island’s primary roads, many
secondary roads, and some fire roads. The team stopped approximately every half-mile to
create a data point. If persistent tree cover did not allow this, the team stopped as often as
possible. At each stop the average of three readings was recorded using the SQM. GPS
coordinates were recorded in decimal form. The data was later compiled in Microsoft
Excel. The data was collected during night hours after moonset. The team spent seven
nights collecting data to assure a more detailed map than the previous study. The new
maps show the resolution from over 200 data points versus CoA’s 140 points. The figure
below shows the roads from the original CoA study (Grey), and the roads added for the
WPI study (Red).
Figure 11: Dark Sky Travel Path
30
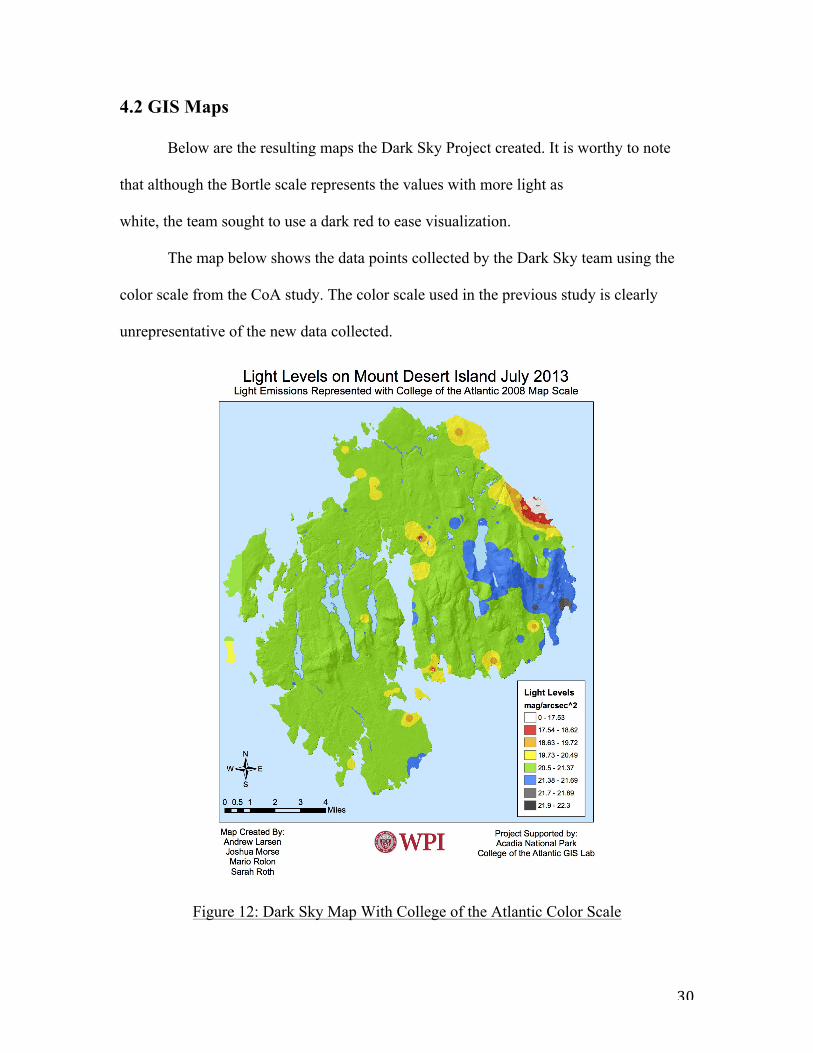
4.2 GIS Maps
Below are the resulting maps the Dark Sky Project created. It is worthy to note
that although the Bortle scale represents the values with more light as
white, the team sought to use a dark red to ease visualization.
The map below shows the data points collected by the Dark Sky team using the
color scale from the CoA study. The color scale used in the previous study is clearly
unrepresentative of the new data collected.
Figure 12: Dark Sky Map With College of the Atlantic Color Scale
31
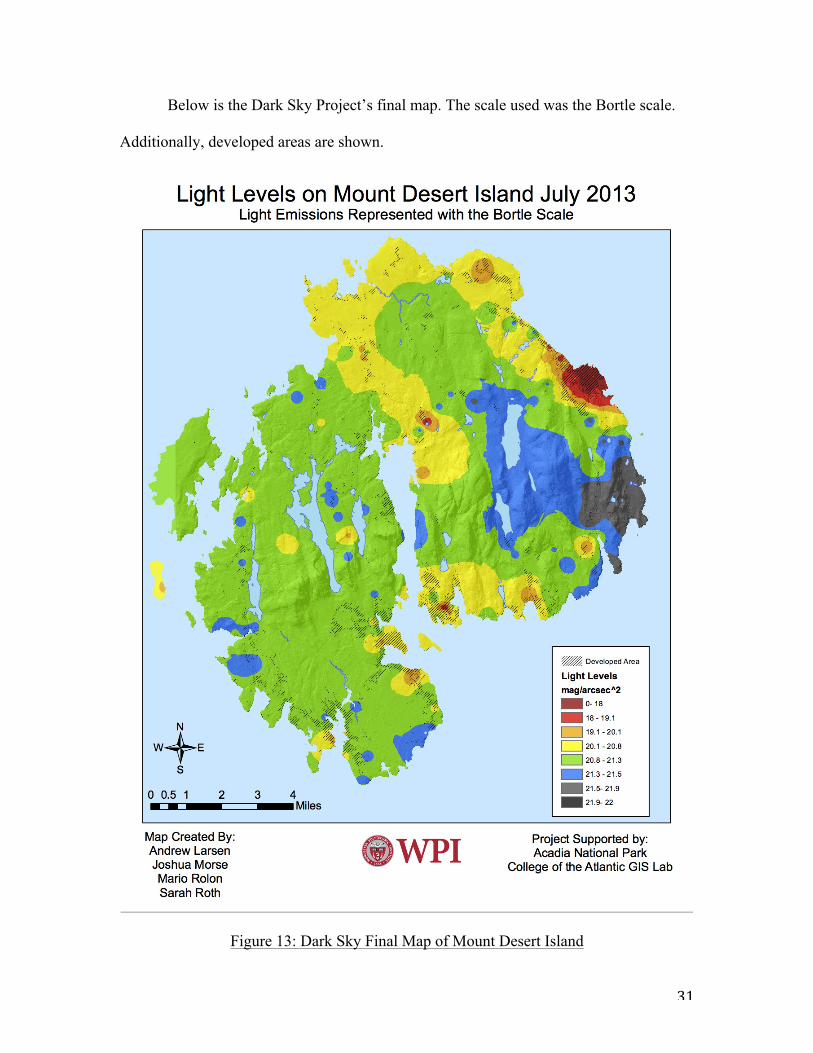
Below is the Dark Sky Project’s final map. The scale used was the Bortle scale.
Additionally, developed areas are shown.
Figure 13: Dark Sky Final Map of Mount Desert Island
32
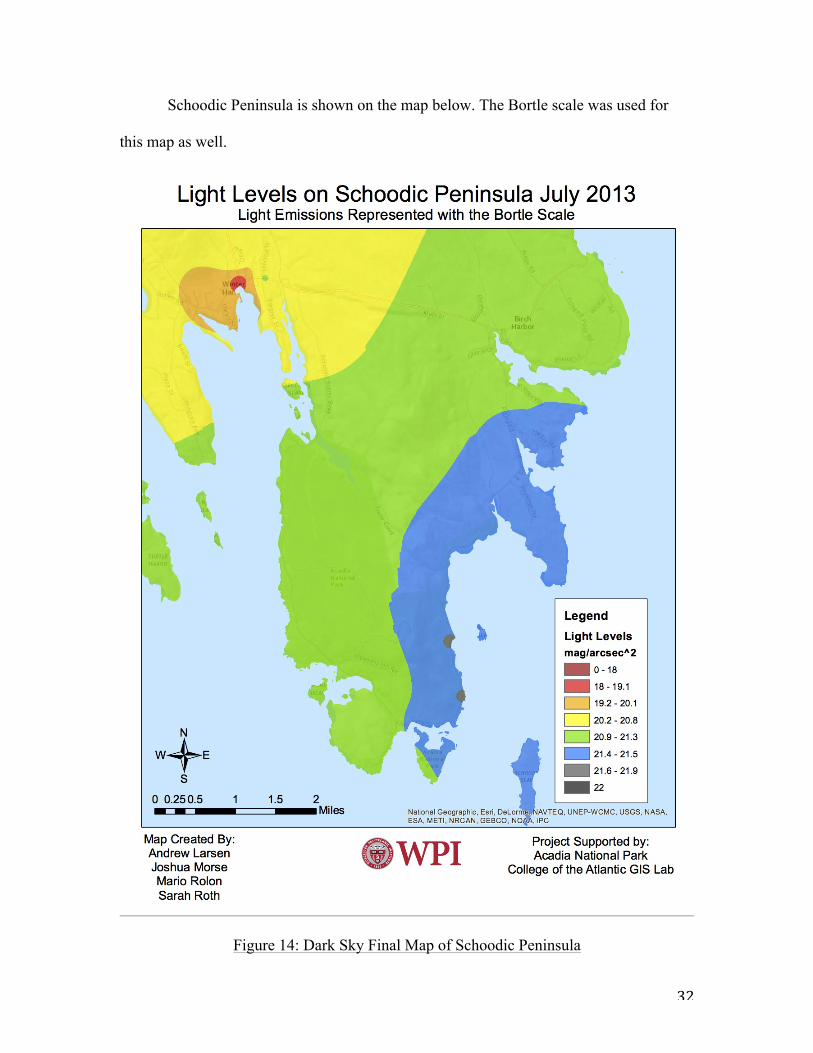
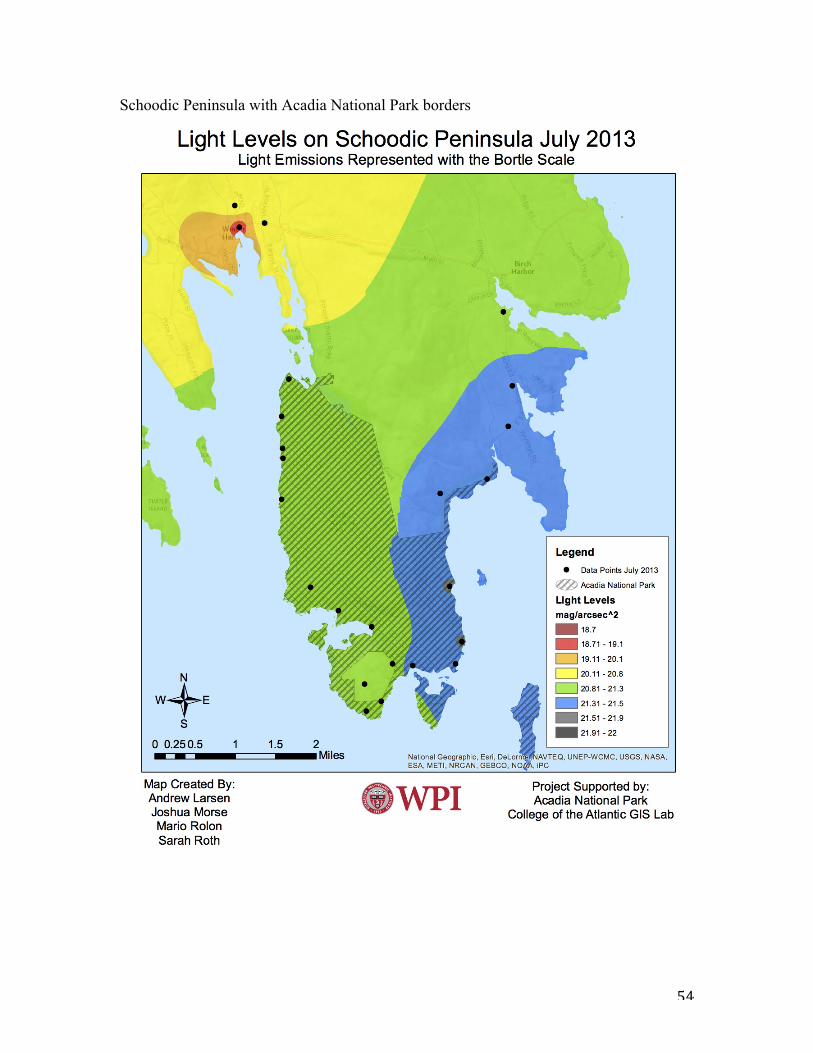
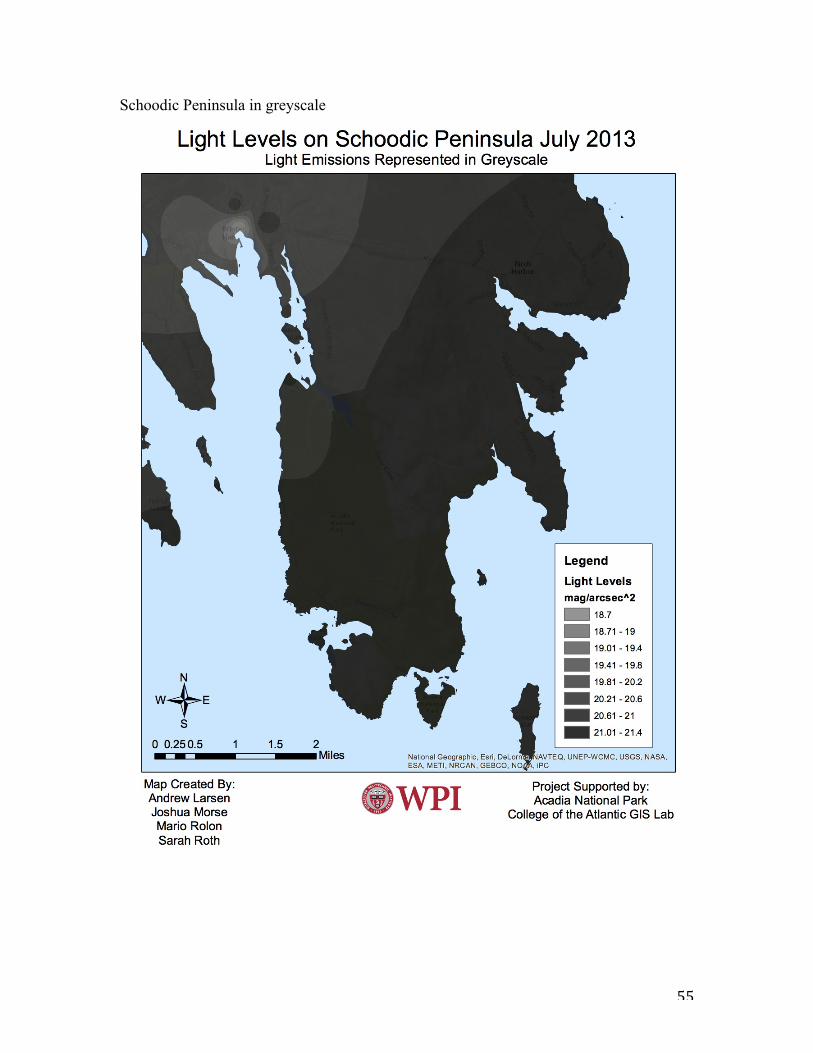
Schoodic Peninsula is shown on the map below. The Bortle scale was used for
this map as well.
Figure 14: Dark Sky Final Map of Schoodic Peninsula
33
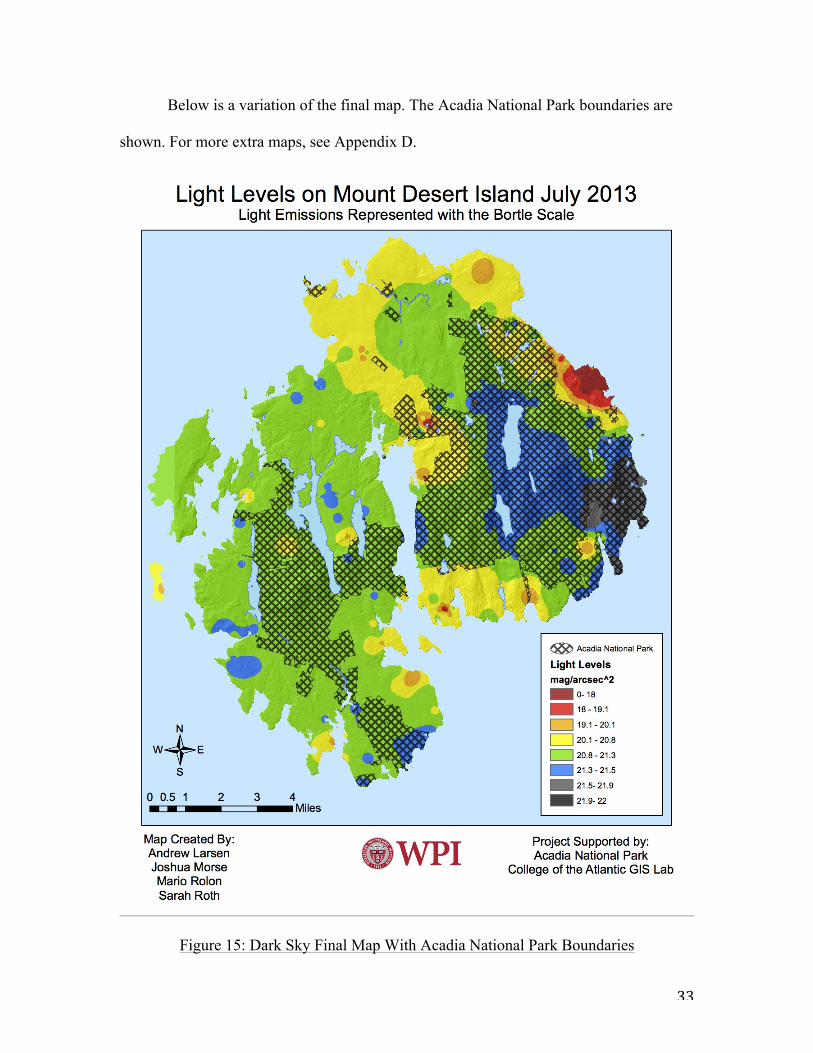
Below is a variation of the final map. The Acadia National Park boundaries are
shown. For more extra maps, see Appendix D.
Figure 15: Dark Sky Final Map With Acadia National Park Boundaries
34
4.3 Analysis
This section discusses how the two studies were compared, how the Bortle scale
map illustrates light emissions better than the CoA scale, and points of interest on the
island.
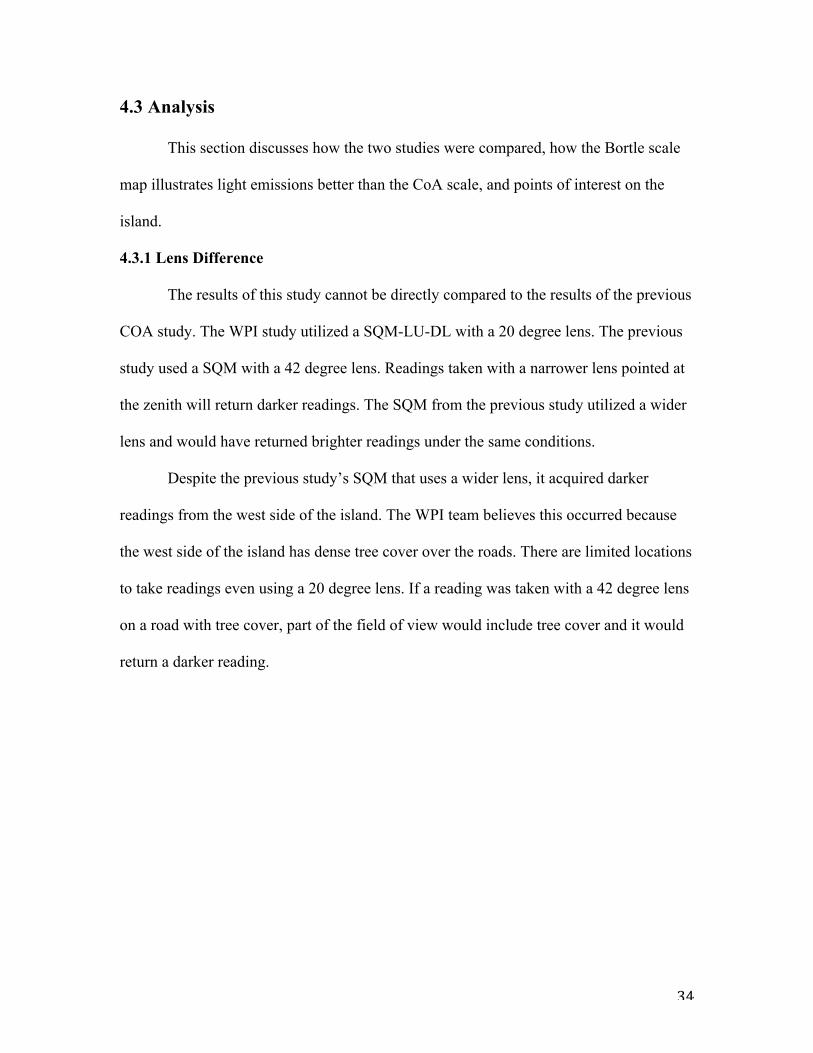
4.3.1 Lens Difference
The results of this study cannot be directly compared to the results of the previous
COA study. The WPI study utilized a SQM-LU-DL with a 20 degree lens. The previous
study used a SQM with a 42 degree lens. Readings taken with a narrower lens pointed at
the zenith will return darker readings. The SQM from the previous study utilized a wider
lens and would have returned brighter readings under the same conditions.
Despite the previous study’s SQM that uses a wider lens, it acquired darker
readings from the west side of the island. The WPI team believes this occurred because
the west side of the island has dense tree cover over the roads. There are limited locations
to take readings even using a 20 degree lens. If a reading was taken with a 42 degree lens
on a road with tree cover, part of the field of view would include tree cover and it would
return a darker reading.
35
Figure 16: Sky Quality Meter lens comparison (UNIHEDRON)
4.3.2 Season Difference
The studies were conducted during different seasons. This set of data was taken in
the summer and the previous set was taken in the winter. While the studies cannot be
directly compared, certain assumptions can be made using the maps and population
differences on the island between the winter and summer. The west side of the island
contains less light pollution in the winter than it does in the summer. The team believes
this is due to the large influx of park visitors and summer residents the island receives
during the summer.
36
4.3.3 Reasoning for the Bortle Scale
The CoA study generated two maps, one with data points and developed areas
indicated, and one without. The CoA study contained 140 data points that did not allow
for accurate data interpolation in certain areas by the mapping software. Limited road
access was a factor. This produced a map with a low resolution and inaccurate
interpolation, especially within the park’s boundaries.
The WPI study collected 201 data points on Mount Desert Island. This allowed
for more accurate interpolation. This study showed that the park is significantly darker
than it was shown in the CoA study. This can be attributed to the higher resolution data
interpolation, as well as lens differences, rather than lighting ordinances. The side by
side comparison using the CoA color scale revealed that their scale was not a good fit for
the WPI team’s data.
The WPI team chose the Bortle Scale to represent the new data. The Bortle scale
reveals a more detailed and comprehensive representation. Using this scale, the
interpolation of the data points was more indicative of the quality of the sky throughout
the island.
Using the Bortle scale allowed for standardization of future studies. Because the
Bortle scale is used widely among stargazers and astronomers, the maps can be compared
to studies from other locations. Lastly, the Bortle scale has an easy-to-understand color
scheme. It is designed so that amateur stargazers can identify sky qualities.
4.3.4 Points of Interest
Bar Harbor is the brightest source of light on the island. There are many street
lights on the main roads. West Street, Main Street, and Cottage Street all contribute a
37
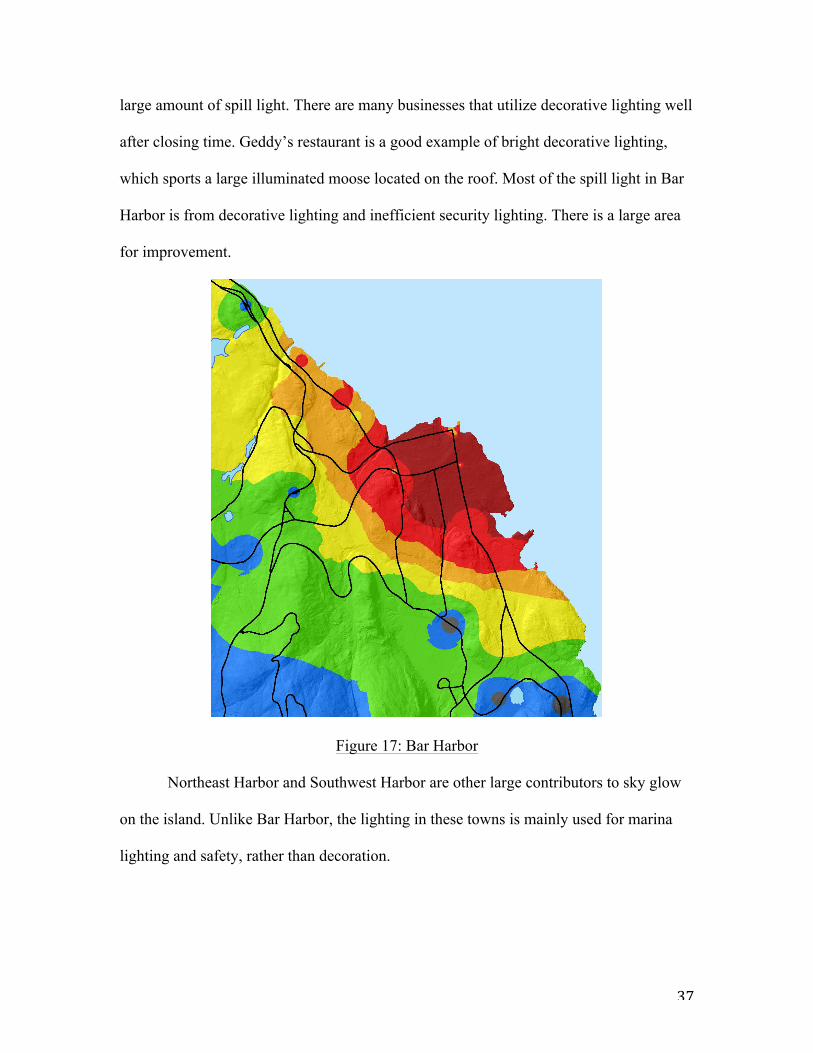
large amount of spill light. There are many businesses that utilize decorative lighting well
after closing time. Geddy’s restaurant is a good example of bright decorative lighting,
which sports a large illuminated moose located on the roof. Most of the spill light in Bar
Harbor is from decorative lighting and inefficient security lighting. There is a large area
for improvement.
Figure 17: Bar Harbor
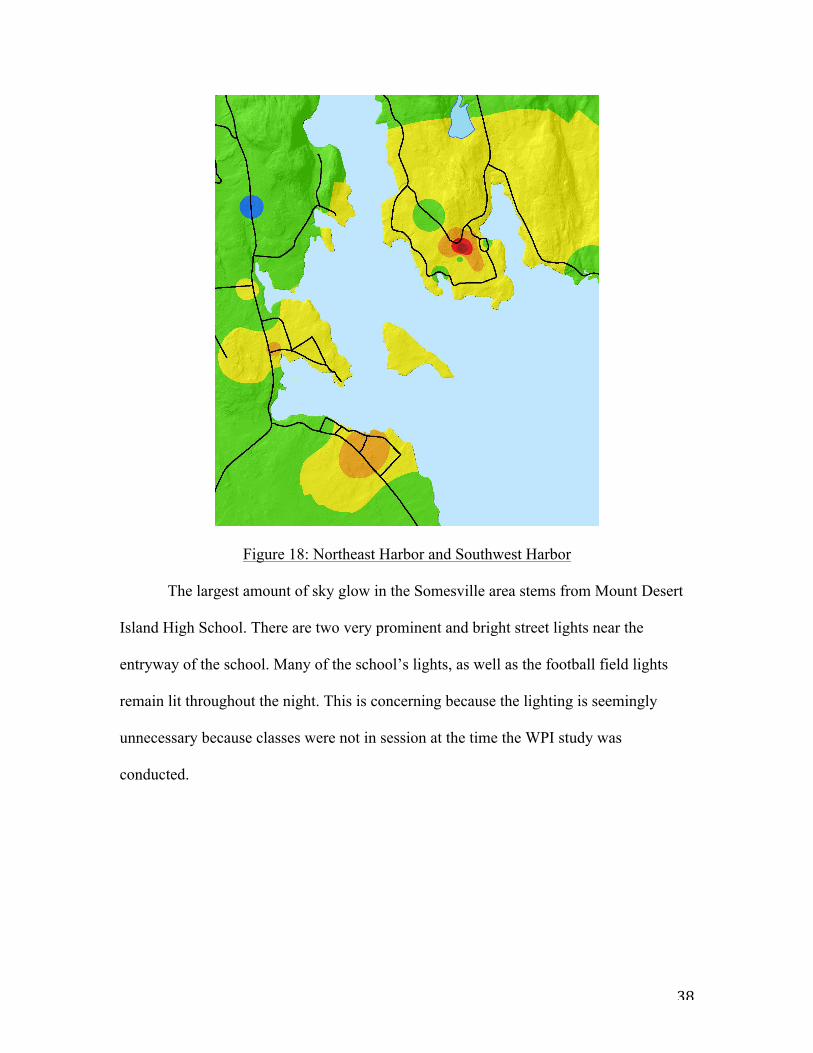
Northeast Harbor and Southwest Harbor are other large contributors to sky glow
on the island. Unlike Bar Harbor, the lighting in these towns is mainly used for marina
lighting and safety, rather than decoration.
38
Figure 18: Northeast Harbor and Southwest Harbor
The largest amount of sky glow in the Somesville area stems from Mount Desert
Island High School. There are two very prominent and bright street lights near the
entryway of the school. Many of the school’s lights, as well as the football field lights
remain lit throughout the night. This is concerning because the lighting is seemingly
unnecessary because classes were not in session at the time the WPI study was
conducted.
39
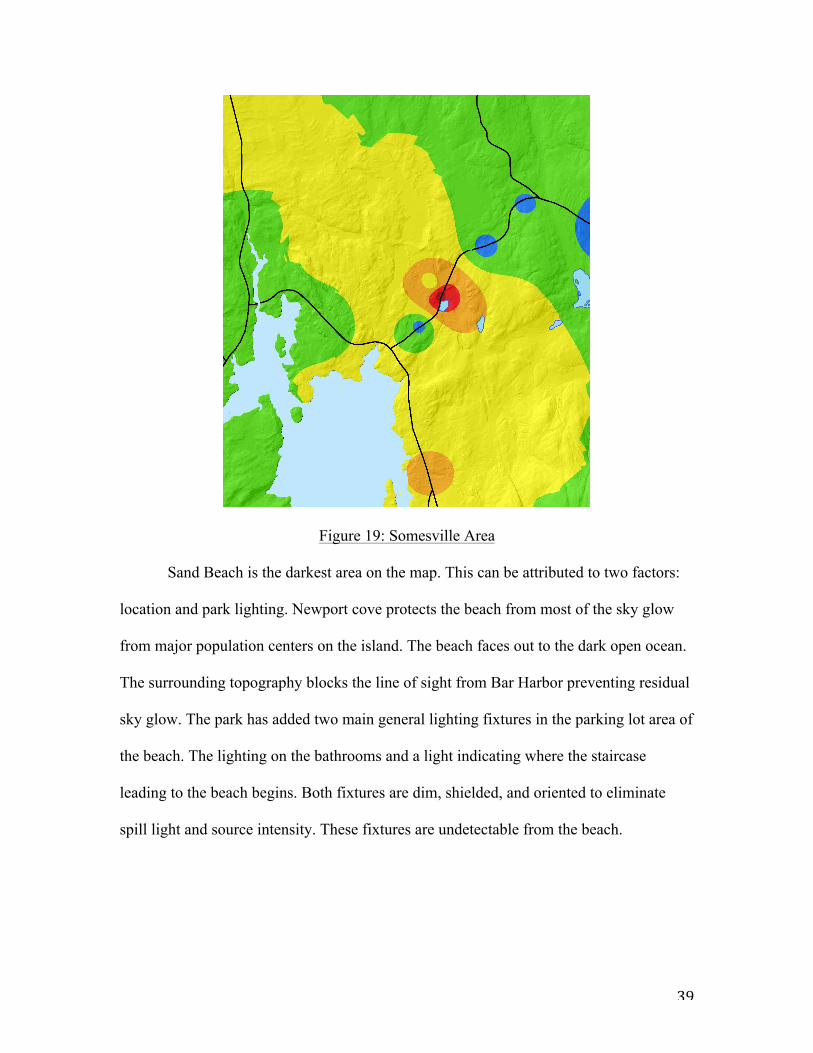
Figure 19: Somesville Area
Sand Beach is the darkest area on the map. This can be attributed to two factors:
location and park lighting. Newport cove protects the beach from most of the sky glow
from major population centers on the island. The beach faces out to the dark open ocean.
The surrounding topography blocks the line of sight from Bar Harbor preventing residual
sky glow. The park has added two main general lighting fixtures in the parking lot area of
the beach. The lighting on the bathrooms and a light indicating where the staircase
leading to the beach begins. Both fixtures are dim, shielded, and oriented to eliminate
spill light and source intensity. These fixtures are undetectable from the beach.
40
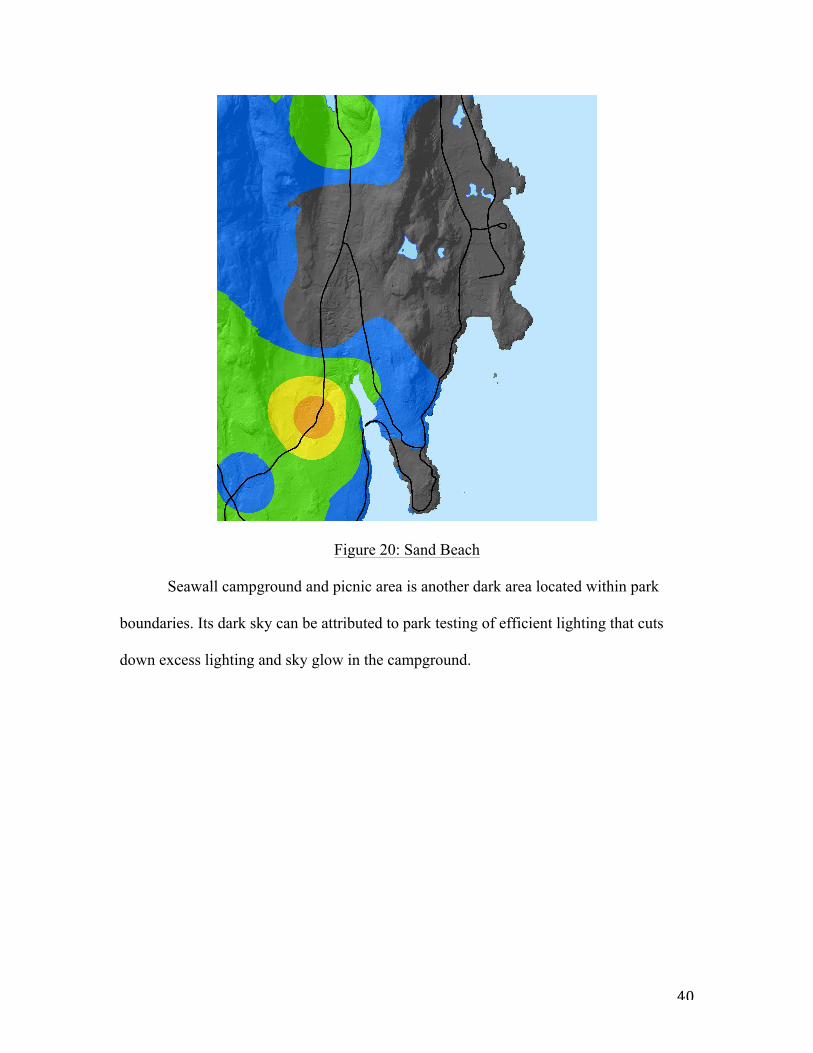
Figure 20: Sand Beach
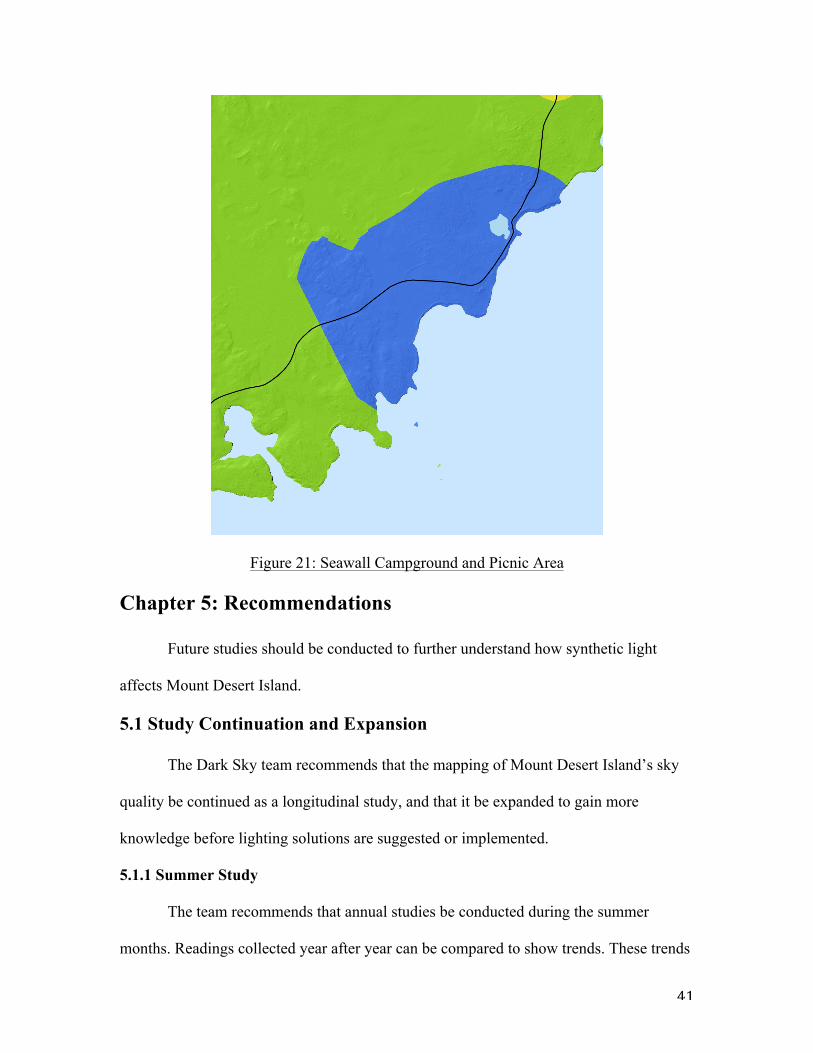
Seawall campground and picnic area is another dark area located within park
boundaries. Its dark sky can be attributed to park testing of efficient lighting that cuts
down excess lighting and sky glow in the campground.
41
Figure 21: Seawall Campground and Picnic Area
Chapter 5: Recommendations
Future studies should be conducted to further understand how synthetic light
affects Mount Desert Island.
5.1 Study Continuation and Expansion
The Dark Sky team recommends that the mapping of Mount Desert Island’s sky
quality be continued as a longitudinal study, and that it be expanded to gain more
knowledge before lighting solutions are suggested or implemented.
5.1.1 Summer Study
The team recommends that annual studies be conducted during the summer
months. Readings collected year after year can be compared to show trends. These trends
42
can show increases or decreases in light pollution severity or verify previous results as
constant.
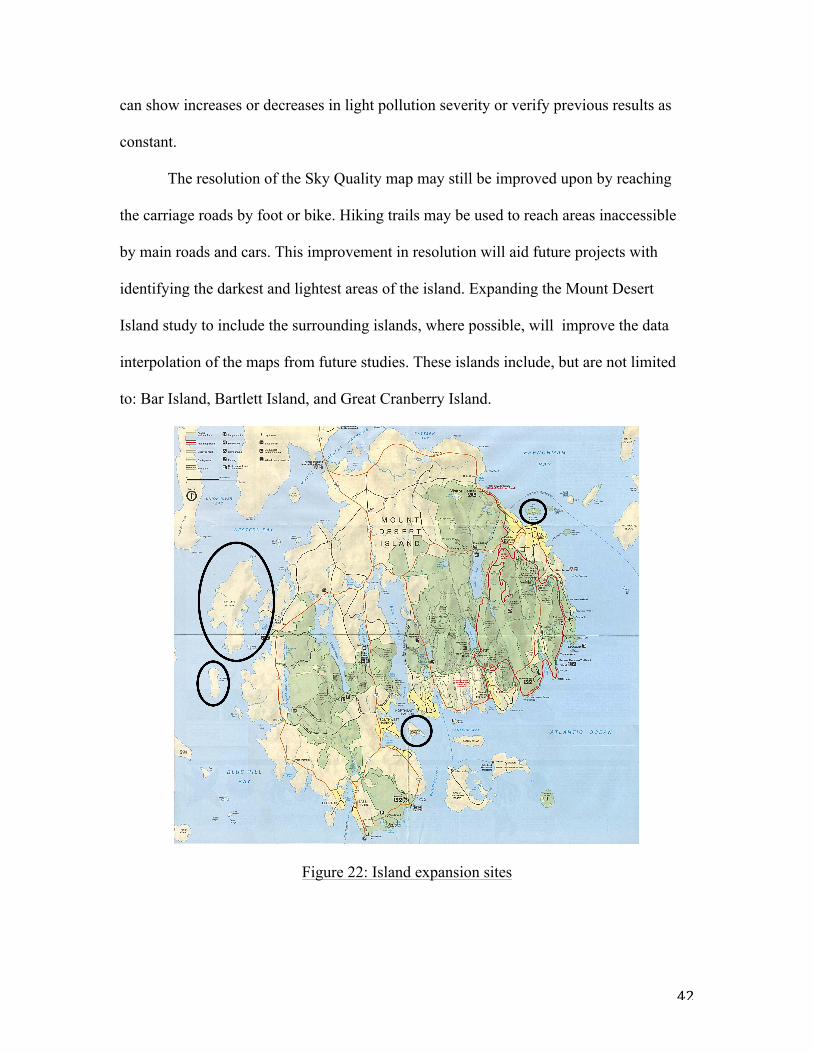
The resolution of the Sky Quality map may still be improved upon by reaching
the carriage roads by foot or bike. Hiking trails may be used to reach areas inaccessible
by main roads and cars. This improvement in resolution will aid future projects with
identifying the darkest and lightest areas of the island. Expanding the Mount Desert
Island study to include the surrounding islands, where possible, will improve the data
interpolation of the maps from future studies. These islands include, but are not limited
to: Bar Island, Bartlett Island, and Great Cranberry Island.
Figure 22: Island expansion sites
43
The summer study can be expanded to include more detailed maps of the island’s
major towns. Bar Harbor, Northeast Harbor, and Bass Harbor can be mapped extensively
to gain better understanding of where most sky glow is concentrated.
5.1.2 Winter Study
The team recommends that the study is repeated during the winter months, as the
July map is not directly comparable to the CoA map created in December. Used together,
the summer and winter studies can direct future projects towards what light sources cause
the most significant damage to the night sky on Mount Desert Island, as they will give a
more complete picture of which light sources are a constant problem.
5.1.3 Schoodic Peninsula
The team recommends more extensive readings and maps of Schoodic Peninsula.
The resolution can be improved by adding readings from hiking trails, picnic areas, and,
depending on tides, even Little Moose Island. If Schoodic Peninsula is included in the
winter study previously recommended, Schoodic Island, and Rolling Island can be
included. Another recommendation is to create more extensive maps of Winter Harbor
and Birch Harbor.
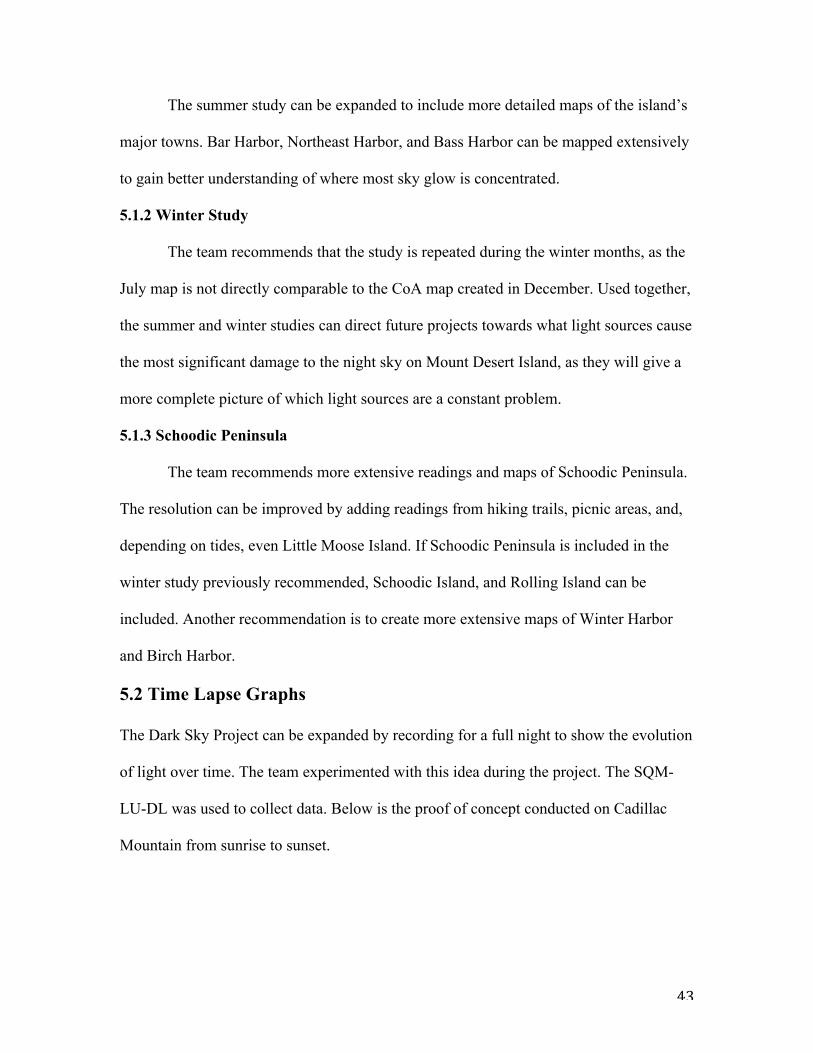
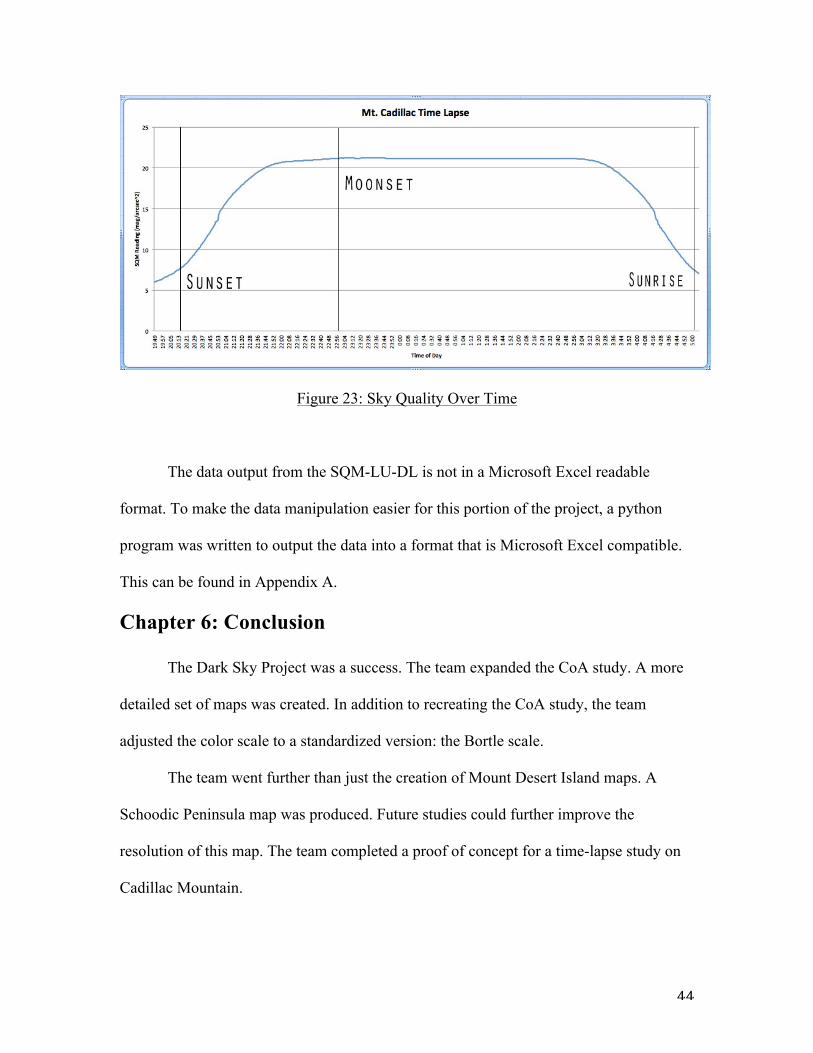
5.2 Time Lapse Graphs
The Dark Sky Project can be expanded by recording for a full night to show the evolution
of light over time. The team experimented with this idea during the project. The SQM-
LU-DL was used to collect data. Below is the proof of concept conducted on Cadillac
Mountain from sunrise to sunset.
44
Figure 23: Sky Quality Over Time
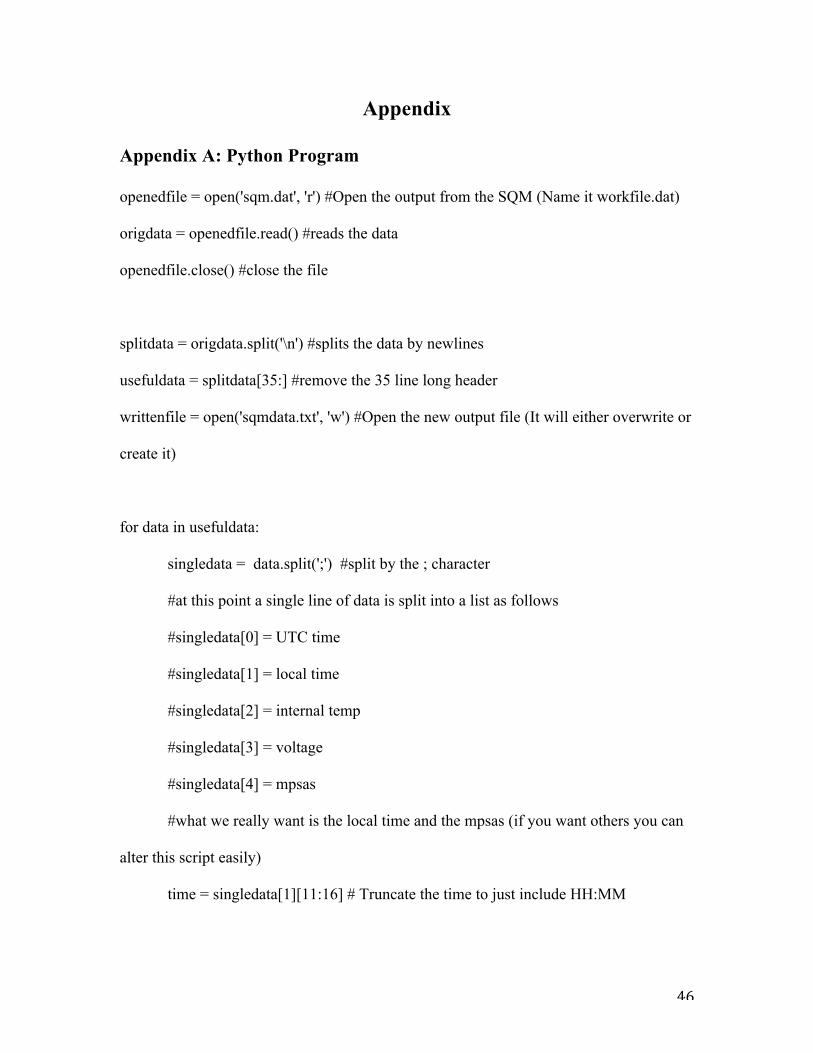
The data output from the SQM-LU-DL is not in a Microsoft Excel readable
format. To make the data manipulation easier for this portion of the project, a python
program was written to output the data into a format that is Microsoft Excel compatible.
This can be found in Appendix A.
Chapter 6: Conclusion
The Dark Sky Project was a success. The team expanded the CoA study. A more
detailed set of maps was created. In addition to recreating the CoA study, the team
adjusted the color scale to a standardized version: the Bortle scale.
The team went further than just the creation of Mount Desert Island maps. A
Schoodic Peninsula map was produced. Future studies could further improve the
resolution of this map. The team completed a proof of concept for a time-lapse study on
Cadillac Mountain.
45
Overall, the fundamental project goals were achieved. The Dark Sky Project set a
baseline for a longitudinal study. By standardizing their results, future studies can be
compared to discover changes and trends of light levels on Mount Desert Island and
Acadia National Park.
46
Appendix
Appendix A: Python Program
openedfile = open('sqm.dat', 'r') #Open the output from the SQM (Name it workfile.dat)
origdata = openedfile.read() #reads the data
openedfile.close() #close the file
splitdata = origdata.split('\n') #splits the data by newlines
usefuldata = splitdata[35:] #remove the 35 line long header
writtenfile = open('sqmdata.txt', 'w') #Open the new output file (It will either overwrite or
create it)
for data in usefuldata:
singledata = data.split(';') #split by the ; character
#at this point a single line of data is split into a list as follows
#singledata[0] = UTC time
#singledata[1] = local time
#singledata[2] = internal temp
#singledata[3] = voltage
#singledata[4] = mpsas
#what we really want is the local time and the mpsas (if you want others you can
alter this script easily)
time = singledata[1][11:16] # Truncate the time to just include HH:MM
47
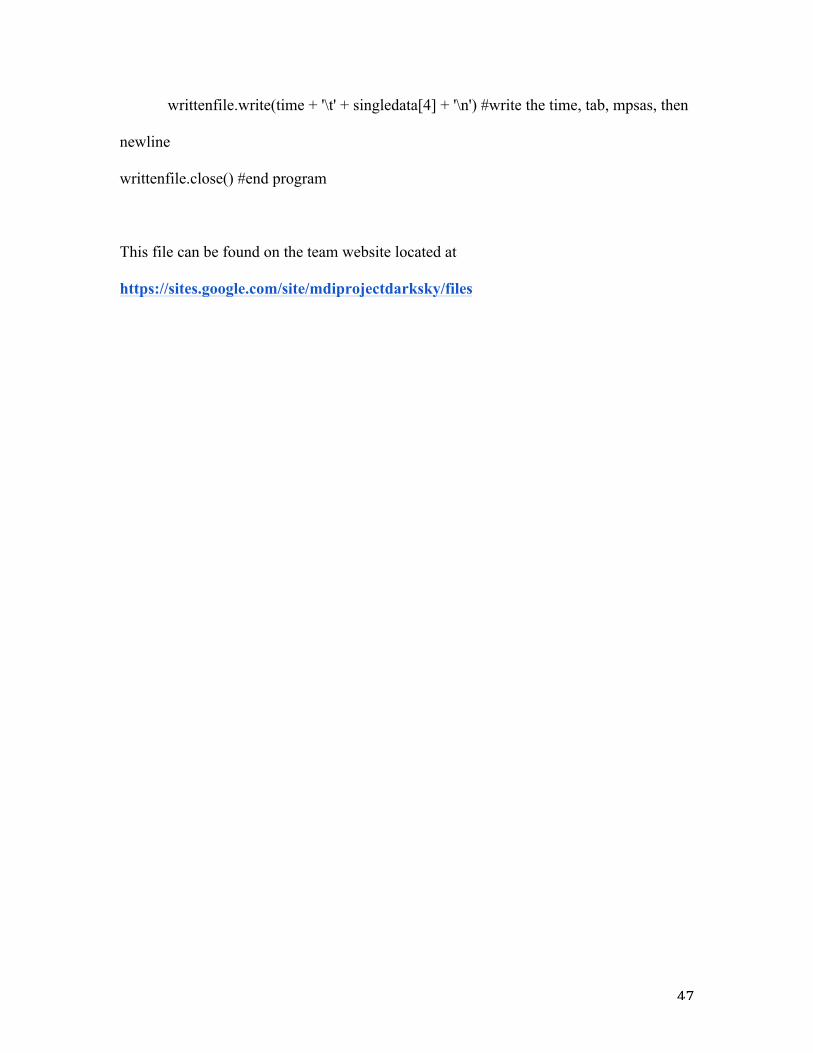
writtenfile.write(time + '\t' + singledata[4] + '\n') #write the time, tab, mpsas, then
newline
writtenfile.close() #end program
This file can be found on the team website located at
https://sites.google.com/site/mdiprojectdarksky/files
48
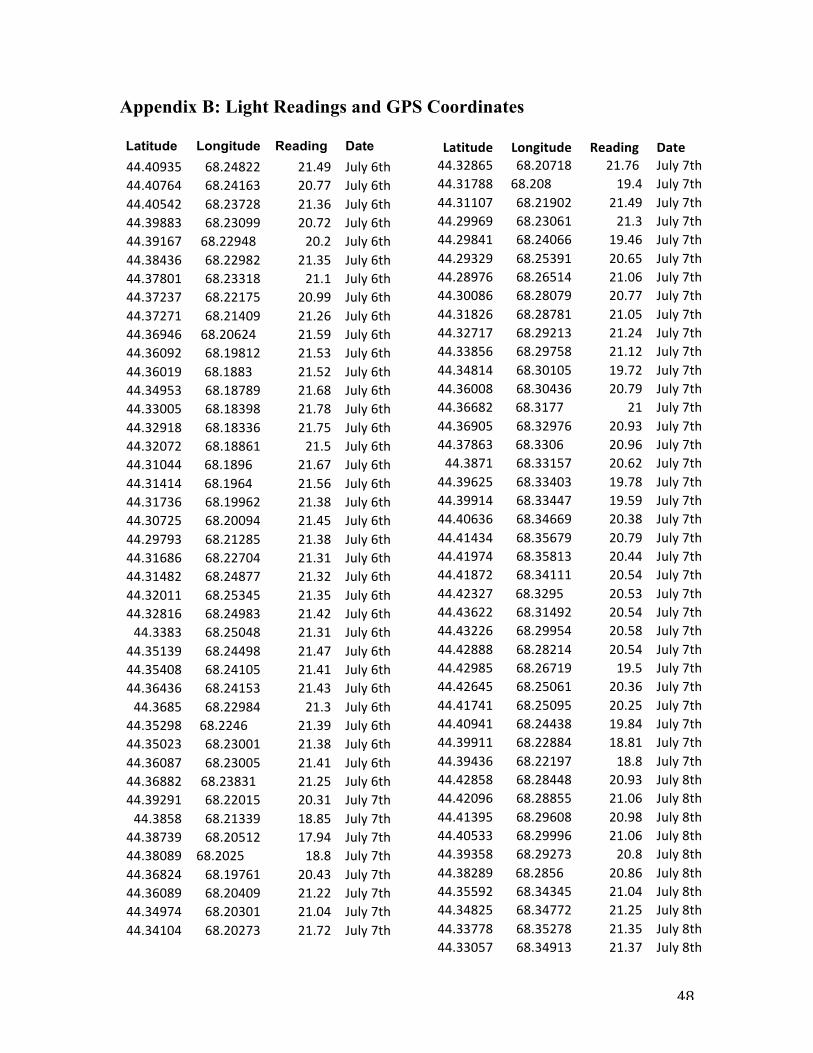
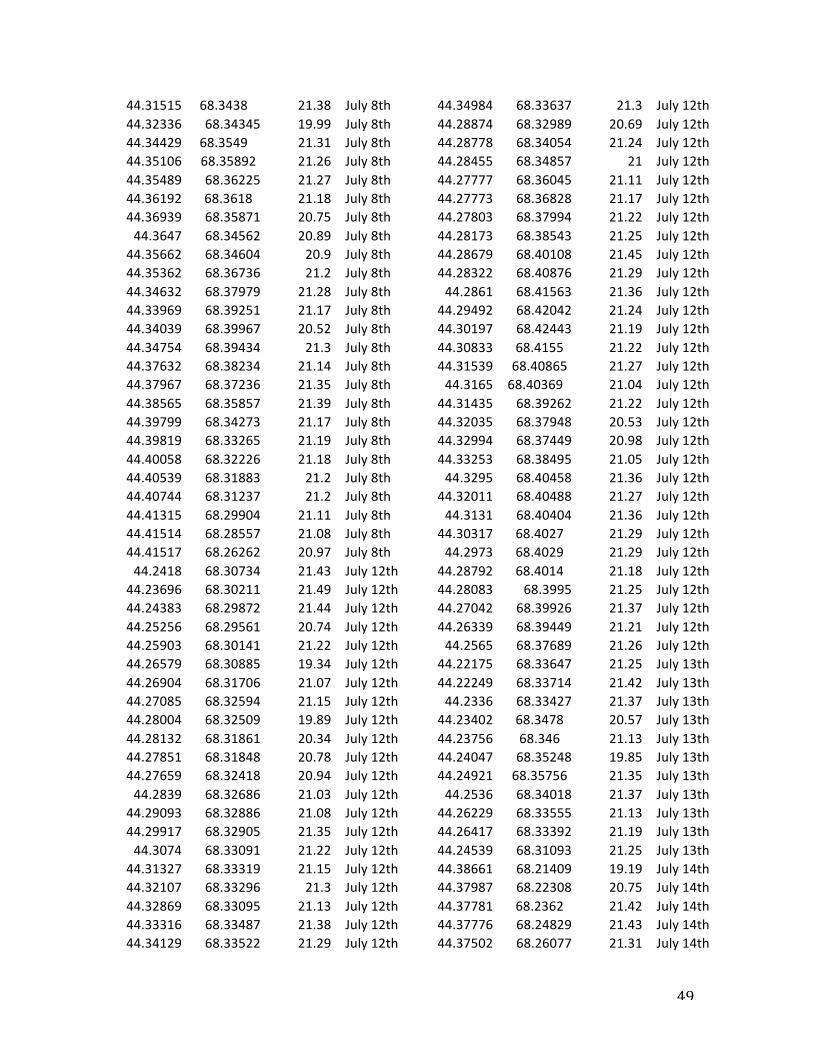
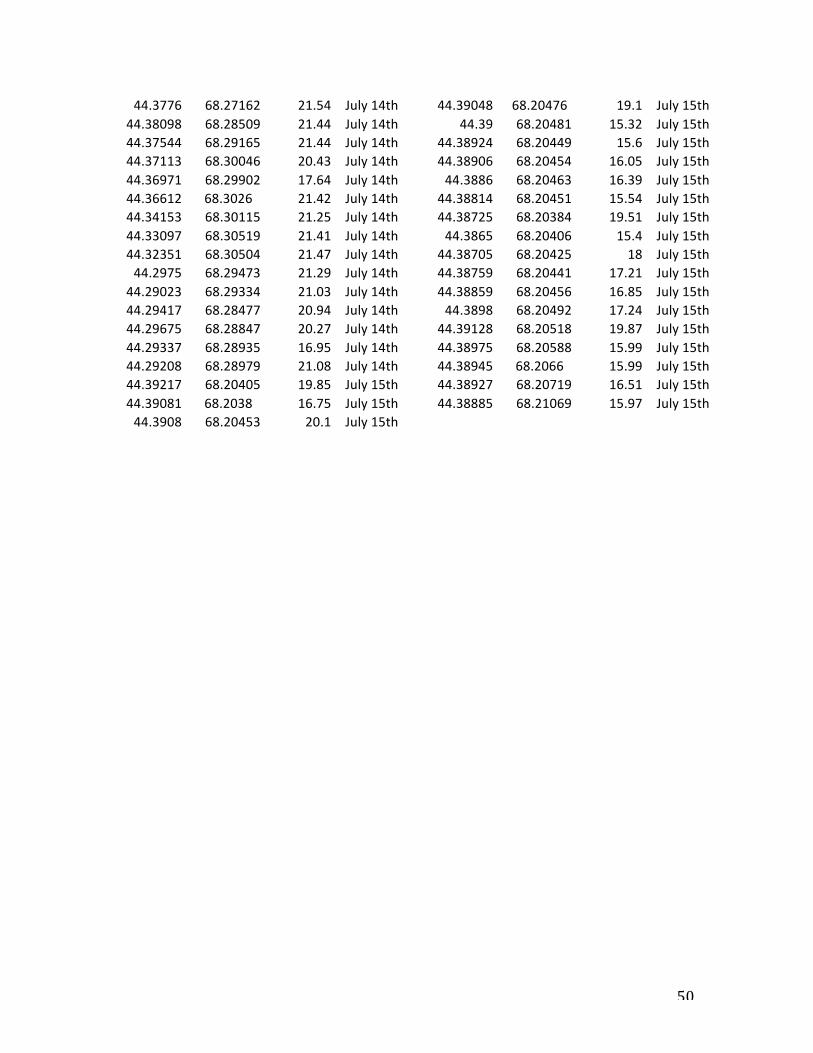
Appendix B: Light Readings and GPS Coordinates
Latitude Longitude Reading Date 44.40935 68.24822 21.49 July 6th 44.40764 68.24163 20.77 July 6th 44.40542 68.23728 21.36 July 6th 44.39883 68.23099 20.72 July 6th 44.39167 68.22948 20.2 July 6th 44.38436 68.22982 21.35 July 6th 44.37801 68.23318 21.1 July 6th 44.37237 68.22175 20.99 July 6th 44.37271 68.21409 21.26 July 6th 44.36946 68.20624 21.59 July 6th 44.36092 68.19812 21.53 July 6th 44.36019 68.1883 21.52 July 6th 44.34953 68.18789 21.68 July 6th 44.33005 68.18398 21.78 July 6th 44.32918 68.18336 21.75 July 6th 44.32072 68.18861 21.5 July 6th 44.31044 68.1896 21.67 July 6th 44.31414 68.1964 21.56 July 6th 44.31736 68.19962 21.38 July 6th 44.30725 68.20094 21.45 July 6th 44.29793 68.21285 21.38 July 6th 44.31686 68.22704 21.31 July 6th 44.31482 68.24877 21.32 July 6th 44.32011 68.25345 21.35 July 6th 44.32816 68.24983 21.42 July 6th 44.3383 68.25048 21.31 July 6th
44.35139 68.24498 21.47 July 6th 44.35408 68.24105 21.41 July 6th 44.36436 68.24153 21.43 July 6th 44.3685 68.22984 21.3 July 6th
44.35298 68.2246 21.39 July 6th 44.35023 68.23001 21.38 July 6th 44.36087 68.23005 21.41 July 6th 44.36882 68.23831 21.25 July 6th 44.39291 68.22015 20.31 July 7th 44.3858 68.21339 18.85 July 7th
44.38739 68.20512 17.94 July 7th 44.38089 68.2025 18.8 July 7th 44.36824 68.19761 20.43 July 7th 44.36089 68.20409 21.22 July 7th 44.34974 68.20301 21.04 July 7th 44.34104 68.20273 21.72 July 7th
Latitude 44.32865
Longitude 68.20718
Reading 21.76
Date July 7th
44.31788 68.208 19.4 July 7th 44.31107 68.21902 21.49 July 7th 44.29969 68.23061 21.3 July 7th 44.29841 68.24066 19.46 July 7th 44.29329 68.25391 20.65 July 7th 44.28976 68.26514 21.06 July 7th 44.30086 68.28079 20.77 July 7th 44.31826 68.28781 21.05 July 7th 44.32717 68.29213 21.24 July 7th 44.33856 68.29758 21.12 July 7th 44.34814 68.30105 19.72 July 7th 44.36008 68.30436 20.79 July 7th 44.36682 68.3177 21 July 7th 44.36905 68.32976 20.93 July 7th 44.37863 68.3306 20.96 July 7th 44.3871 68.33157 20.62 July 7th
44.39625 68.33403 19.78 July 7th 44.39914 68.33447 19.59 July 7th 44.40636 68.34669 20.38 July 7th 44.41434 68.35679 20.79 July 7th 44.41974 68.35813 20.44 July 7th 44.41872 68.34111 20.54 July 7th 44.42327 68.3295 20.53 July 7th 44.43622 68.31492 20.54 July 7th 44.43226 68.29954 20.58 July 7th 44.42888 68.28214 20.54 July 7th 44.42985 68.26719 19.5 July 7th 44.42645 68.25061 20.36 July 7th 44.41741 68.25095 20.25 July 7th 44.40941 68.24438 19.84 July 7th 44.39911 68.22884 18.81 July 7th 44.39436 68.22197 18.8 July 7th 44.42858 68.28448 20.93 July 8th 44.42096 68.28855 21.06 July 8th 44.41395 68.29608 20.98 July 8th 44.40533 68.29996 21.06 July 8th 44.39358 68.29273 20.8 July 8th 44.38289 68.2856 20.86 July 8th 44.35592 68.34345 21.04 July 8th 44.34825 68.34772 21.25 July 8th 44.33778 68.35278 21.35 July 8th 44.33057 68.34913 21.37 July 8th
49
44.31515 68.3438 21.38 July 8th 44.32336 68.34345 19.99 July 8th 44.34429 68.3549 21.31 July 8th 44.35106 68.35892 21.26 July 8th 44.35489 68.36225 21.27 July 8th 44.36192 68.3618 21.18 July 8th 44.36939 68.35871 20.75 July 8th 44.3647 68.34562 20.89 July 8th
44.35662 68.34604 20.9 July 8th 44.35362 68.36736 21.2 July 8th 44.34632 68.37979 21.28 July 8th 44.33969 68.39251 21.17 July 8th 44.34039 68.39967 20.52 July 8th 44.34754 68.39434 21.3 July 8th 44.37632 68.38234 21.14 July 8th 44.37967 68.37236 21.35 July 8th 44.38565 68.35857 21.39 July 8th 44.39799 68.34273 21.17 July 8th 44.39819 68.33265 21.19 July 8th 44.40058 68.32226 21.18 July 8th 44.40539 68.31883 21.2 July 8th 44.40744 68.31237 21.2 July 8th 44.41315 68.29904 21.11 July 8th 44.41514 68.28557 21.08 July 8th 44.41517 68.26262 20.97 July 8th 44.2418 68.30734 21.43 July 12th
44.23696 68.30211 21.49 July 12th 44.24383 68.29872 21.44 July 12th 44.25256 68.29561 20.74 July 12th 44.25903 68.30141 21.22 July 12th 44.26579 68.30885 19.34 July 12th 44.26904 68.31706 21.07 July 12th 44.27085 68.32594 21.15 July 12th 44.28004 68.32509 19.89 July 12th 44.28132 68.31861 20.34 July 12th 44.27851 68.31848 20.78 July 12th 44.27659 68.32418 20.94 July 12th 44.2839 68.32686 21.03 July 12th
44.29093 68.32886 21.08 July 12th 44.29917 68.32905 21.35 July 12th 44.3074 68.33091 21.22 July 12th
44.31327 68.33319 21.15 July 12th 44.32107 68.33296 21.3 July 12th 44.32869 68.33095 21.13 July 12th 44.33316 68.33487 21.38 July 12th 44.34129 68.33522 21.29 July 12th
44.34984 68.33637 21.3 July 12th 44.28874 68.32989 20.69 July 12th 44.28778 68.34054 21.24 July 12th 44.28455 68.34857 21 July 12th 44.27777 68.36045 21.11 July 12th 44.27773 68.36828 21.17 July 12th 44.27803 68.37994 21.22 July 12th 44.28173 68.38543 21.25 July 12th 44.28679 68.40108 21.45 July 12th 44.28322 68.40876 21.29 July 12th 44.2861 68.41563 21.36 July 12th
44.29492 68.42042 21.24 July 12th 44.30197 68.42443 21.19 July 12th 44.30833 68.4155 21.22 July 12th 44.31539 68.40865 21.27 July 12th 44.3165 68.40369 21.04 July 12th
44.31435 68.39262 21.22 July 12th 44.32035 68.37948 20.53 July 12th 44.32994 68.37449 20.98 July 12th 44.33253 68.38495 21.05 July 12th 44.3295 68.40458 21.36 July 12th
44.32011 68.40488 21.27 July 12th 44.3131 68.40404 21.36 July 12th
44.30317 68.4027 21.29 July 12th 44.2973 68.4029 21.29 July 12th
44.28792 68.4014 21.18 July 12th 44.28083 68.3995 21.25 July 12th 44.27042 68.39926 21.37 July 12th 44.26339 68.39449 21.21 July 12th 44.2565 68.37689 21.26 July 12th
44.22175 68.33647 21.25 July 13th 44.22249 68.33714 21.42 July 13th 44.2336 68.33427 21.37 July 13th
44.23402 68.3478 20.57 July 13th 44.23756 68.346 21.13 July 13th 44.24047 68.35248 19.85 July 13th 44.24921 68.35756 21.35 July 13th 44.2536 68.34018 21.37 July 13th
44.26229 68.33555 21.13 July 13th 44.26417 68.33392 21.19 July 13th 44.24539 68.31093 21.25 July 13th 44.38661 68.21409 19.19 July 14th 44.37987 68.22308 20.75 July 14th 44.37781 68.2362 21.42 July 14th 44.37776 68.24829 21.43 July 14th 44.37502 68.26077 21.31 July 14th
50
44.3776 68.27162 21.54 July 14th 44.38098 68.28509 21.44 July 14th 44.37544 68.29165 21.44 July 14th 44.37113 68.30046 20.43 July 14th 44.36971 68.29902 17.64 July 14th 44.36612 68.3026 21.42 July 14th 44.34153 68.30115 21.25 July 14th 44.33097 68.30519 21.41 July 14th 44.32351 68.30504 21.47 July 14th 44.2975 68.29473 21.29 July 14th
44.29023 68.29334 21.03 July 14th 44.29417 68.28477 20.94 July 14th 44.29675 68.28847 20.27 July 14th 44.29337 68.28935 16.95 July 14th 44.29208 68.28979 21.08 July 14th 44.39217 68.20405 19.85 July 15th 44.39081 68.2038 16.75 July 15th 44.3908 68.20453 20.1 July 15th
44.39048 68.20476 19.1 July 15th 44.39 68.20481 15.32 July 15th
44.38924 68.20449 15.6 July 15th 44.38906 68.20454 16.05 July 15th 44.3886 68.20463 16.39 July 15th
44.38814 68.20451 15.54 July 15th 44.38725 68.20384 19.51 July 15th 44.3865 68.20406 15.4 July 15th
44.38705 68.20425 18 July 15th 44.38759 68.20441 17.21 July 15th 44.38859 68.20456 16.85 July 15th 44.3898 68.20492 17.24 July 15th
44.39128 68.20518 19.87 July 15th 44.38975 68.20588 15.99 July 15th 44.38945 68.2066 15.99 July 15th 44.38927 68.20719 16.51 July 15th 44.38885 68.21069 15.97 July 15th
51
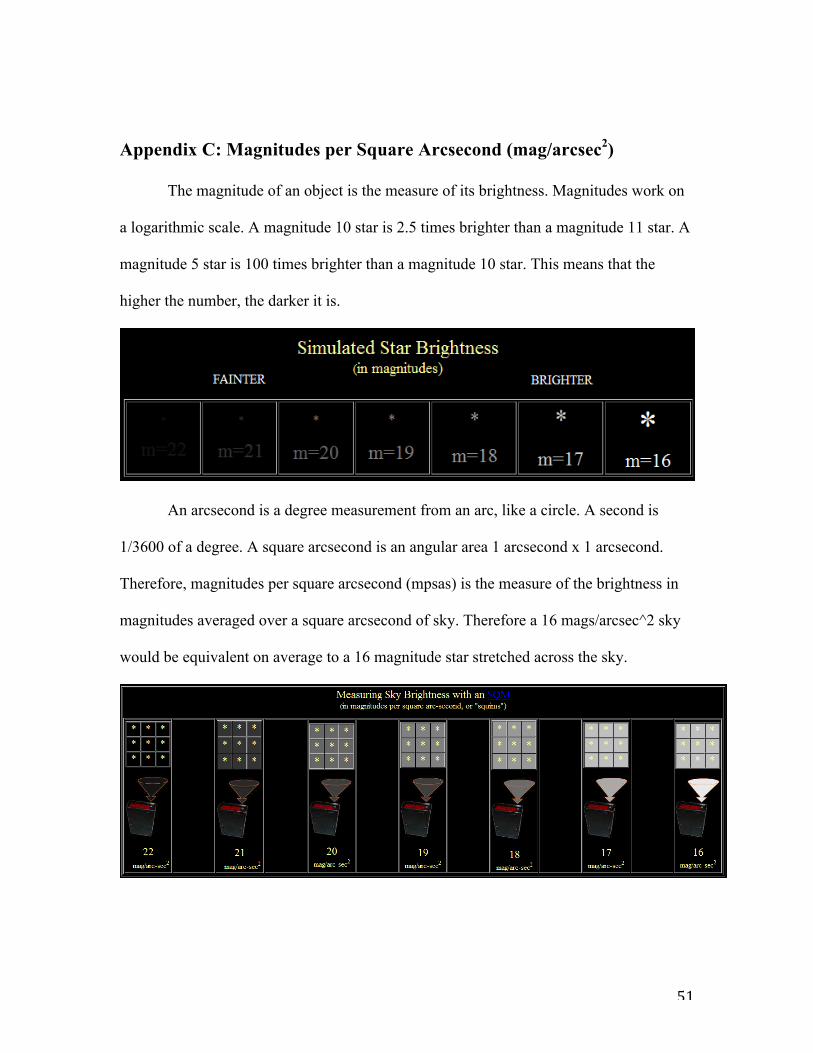
Appendix C: Magnitudes per Square Arcsecond (mag/arcsec2)
The magnitude of an object is the measure of its brightness. Magnitudes work on
a logarithmic scale. A magnitude 10 star is 2.5 times brighter than a magnitude 11 star. A
magnitude 5 star is 100 times brighter than a magnitude 10 star. This means that the
higher the number, the darker it is.
An arcsecond is a degree measurement from an arc, like a circle. A second is
1/3600 of a degree. A square arcsecond is an angular area 1 arcsecond x 1 arcsecond.
Therefore, magnitudes per square arcsecond (mpsas) is the measure of the brightness in
magnitudes averaged over a square arcsecond of sky. Therefore a 16 mags/arcsec^2 sky
would be equivalent on average to a 16 magnitude star stretched across the sky.
52
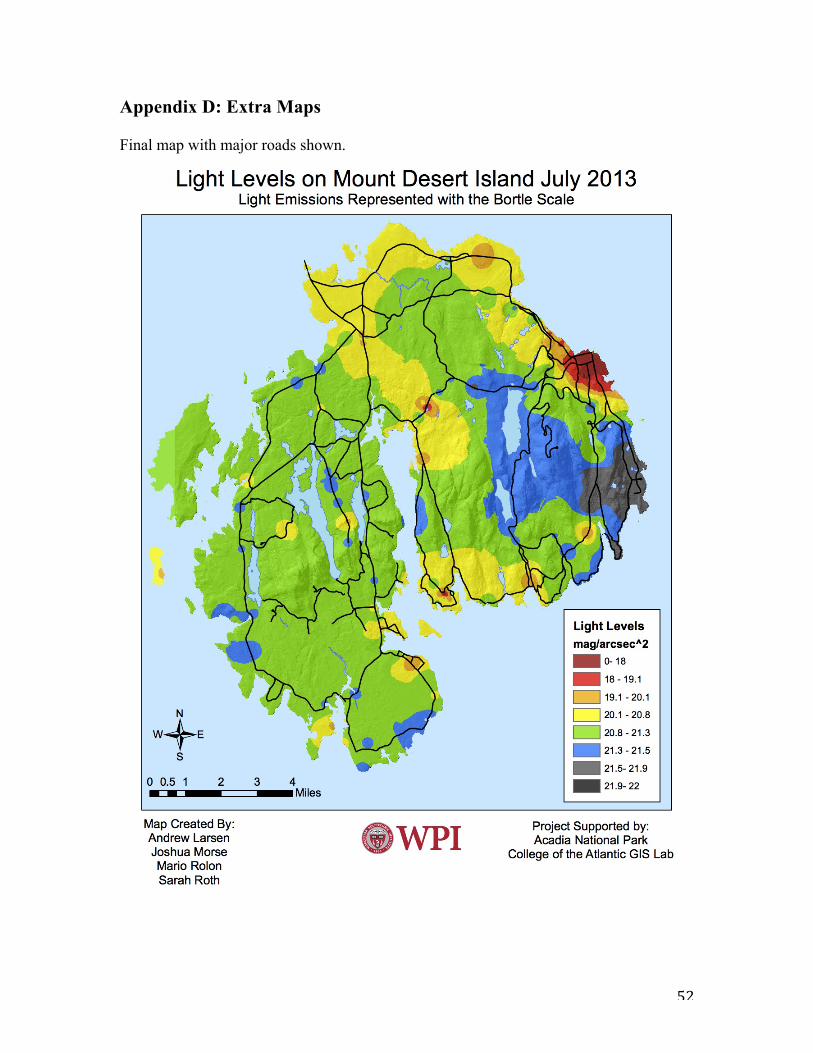
Appendix D: Extra Maps Final map with major roads shown.
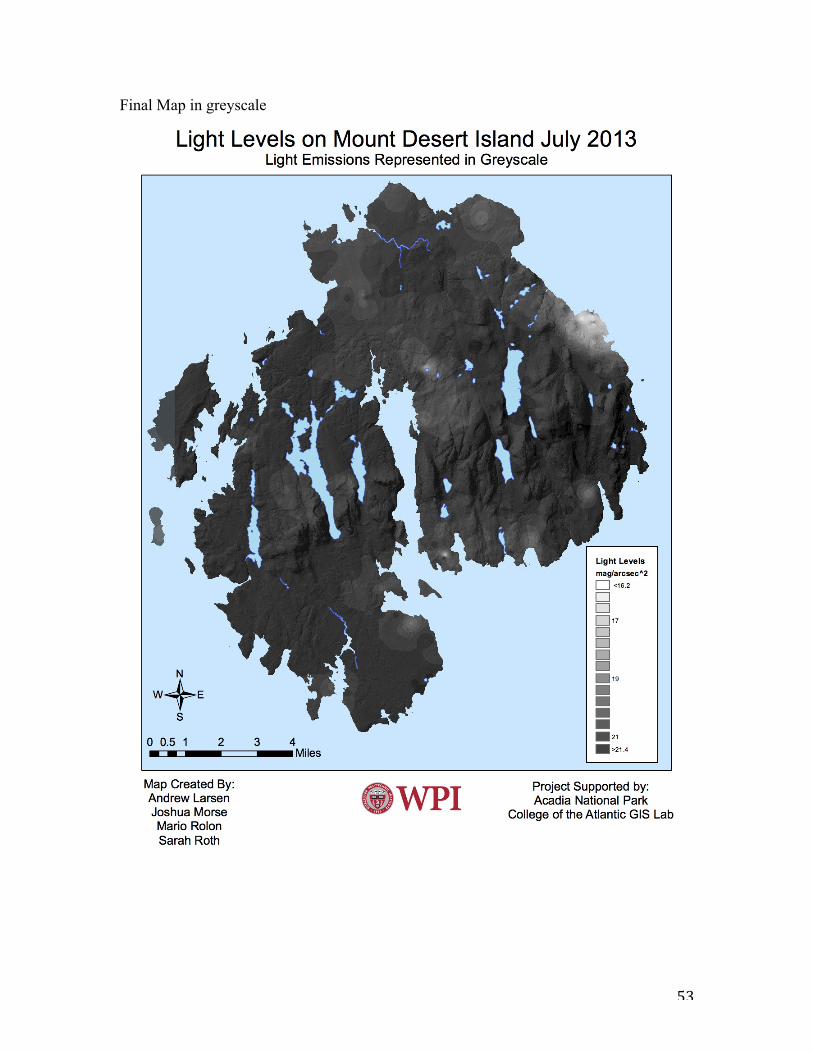
53
Final Map in greyscale
54
Schoodic Peninsula with Acadia National Park borders
55
Schoodic Peninsula in greyscale
56
Works Cited
"Nps Stats Report Viewer." 2013.
"Sample Size: How Many Survey Participants Do I Need?" (2013). Print.
Association, International Dark Sky. "Outdoor Lighting Code Handbook." 1.14
ed2000. Print.
Bacon, Nicholas, and Apoorv Gehlot. "Light Pollution on Mount Desert Island."
Print2008. Print.
BIRD, BRITTANY L., et al. "Effects of Coastal Lighting on Foraging Behaviorof
Beach Mice." Conservation Biology 18.5 (2004): 1435-39. Print.
Bortle, John E. "The Bortle Dark-Sky Scale." Sky & Telescope 2001. Print.
Chepesiuk, Ron. "Missing the Dark: Health Effects of Light Pollution."
Environmental Health Perspectives 117.1 (2009): A20-A27. Print.
Cinzano, P., et al. "NakedEye Star Visibility and Limiting Magnitude Mapped from
DmspOls Satellite Data." Monthly Notices of the Royal Astronomical Society:
Blackwell Science Ltd. 34-46. Vol. 323. .
Commissions, The Maine Association of Conservation. "Bar Harbor's Dark
Sky Ordinance." 2010. Print.
Engineers, The Institution of Lighting. "Guidance Notes for the Reduction of
Obtrusive Light." 2005. Print.
Environmental Systems Research Institute. Arcgis. Vers. Environmental Systems
Research Institute, 2013.
Filmer, Joshua. "Bortle’s Dark-Sky Scale." (2013). Web.
Gorp.com. "Map of Acadia National Park." Ed. Park, Map of Acadia National. Print.
57
Hollan, Jan. "What Is Light Pollution, and How Do We Quantify It?": N.
Copernicus Observatory and Planetarium, December 2006, January
2007, July-October 2008, April 2009 Print.
Kelly, John. "Night Sky Initiative: Measuring, Promoting, and Protecting Acadia's Dark
Night Sky." 2009. Print.
Longcore, Travis. "Ecological Light Pollution." Frontiers in Ecology and the
Environment 2.4 (2004): 191-98. Print.
Longcore, Travis, and Catherine Rich. "Ecological Light Pollution."
http://dx.doi.org/10.1890/1540-9295(2004)002[0191:ELP]2.0.CO;2 (2008).
Print.
Maine, Astronomy Institute of. "Demonstration of the Astronomy Institute's
Nightscape Survey System." 2010. Print.
Maine Association of Conservation Commissions. "Bar Harbor's Dark Sky Ordinance."
2010. Print.
Madawaska Highlands Observatory. "Sky Brightness Table." 2013. Web. July 26 2013.
MapTools. "More Details About the Utm Coordinate System." MapTools 2012. Web.
July 25 2013.
Miller, Mark W. "Apparent Effects of Light Pollution on Singing Behavior of
American Robins." The Condor 108.1 (2006): 130-39. Print.
MoonConnection.com. "Lunar Calendar, July 2013." MoonConnection.com2013.
Print.
National Geodetic Survey. "Utm Utilities." National Oceanic and Atmospheric
Administration 2013. Web. July 24 2013.
58
National Park Service. "Management Policies 2006." U.S. Government ed. U.S.
Government Printing Office: Department of the Interior, 2006. 57. Print.
Navara, Kristen J., et al. "The Dark Side of Light at Night: Physiological,
Epidemiological, and Ecological Consequences." Journal of Pineal Research
43.3 (2007): 215-24. Print.
Owje.com. "Map of Mount Desert Island Detail Map." Ed. Map, Map of Mount
Desert Island Detail. Print.
Stone, Emma L., et al. "Conserving Energy at a Cost to Biodiversity? Impacts of Led
Lighting on Bats." Global Change Biology 18.8 (2012): 2458-65. Print.
U.S. National Park Service . "U.S. National Park Service: A Call to Action." (2013).
Print.
Witherington, Blair E., and R. Erik Martin. "Understanding, Assessing, and
Resolving Light-Pollution Problems on Sea Turtle Nesting Beaches." (2000).
Print.