Embed Size (px)
Citation preview
Herpetological Conservation and Biology 9(2):394–405. Submitted: 13 November 2014; Accepted: 21 February 2014; Published: 12 October 2014.
394
LIFE HISTORY, DEMOGRAPHY, AND THE INFLUENCE OF CAVE-ROOSTING BATS ON A POPULATION OF THE GROTTO SALAMANDER
(EURYCEA SPELAEA) FROM THE OZARK PLATEAUS OF OKLAHOMA
(CAUDATA: PLETHODONTIDAE)
DANTÉ B. FENOLIO1, MATTHEW L. NIEMILLER2, RONALD M. BONETT3, G. O. GRAENING4, BRET A. COLLIER5, AND JIM F. STOUT6
1Department of Conservation and Research, San Antonio Zoo, 3903 North St. Mary’s Street, San Antonio,
Texas 78212, USA, e-mail: [email protected] 2Illinois Natural History Survey, University of Illinois Urbana-Champaign, Champaign, IL 61821, USA.
3Department of Biological Science, University of Tulsa, 800 S. Tucker Drive, Tulsa, Oklahoma 74104, USA. 4Department of Biological Sciences, California State University at Sacramento,6000 J Street,
Sacramento, California 95819, USA. 5School of Renewable Natural Resources, Louisiana State University, Baton Rouge, Louisiana 70803, USA.
6Oklahoma Biological Survey, 111 E. Chesapeake Street, Norman, Oklahoma 73019, USA. Abstract.—Salamanders are among the few vertebrates that have successfully colonized and exploited subterranean habitats, demonstrating flexibility in behavior and physiology. However, our knowledge of the ecology and life history of many subterranean salamanders is poor because of the limits and challenges of studying organisms in subterranean habitats. The Grotto Salamander (Eurycea spelaea) is an obligate subterranean plethodontid salamander, endemic to the Ozark Plateau Ecoregion of North America, and a top predator in many caves. We conducted a 25-mo mark-release-recapture study of E. spelaea within a 440-m section of a cave in Delaware County, Oklahoma to better understand the life history and demography of the species. We also examined this salamander’s association with another cave-dependent species, the federally endangered Gray Bat (Myotis grisescens). We found that Grotto Salamanders spend typically 2–5 years as larvae, although some individuals delay metamorphosis several additional years, and that adults could live at least 9 years. We estimated population size to be 305 126 individuals between December 2001 and February 2002, but decreased during subsequent surveys to a low of 101 48 individuals. Body condition varied seasonally; in general, body condition was greater from May to November, when bats were roosting and depositing fresh guano, and lower from December to April when bats were absent. Presumably, fresh guano produced pulses in nutrient availability and invertebrate densities, the latter of which are important food sources for E. spelaea. Declines in bat populations could have detrimental effects throughout subterranean food webs, including negative impacts on E. spelaea populations. Key Words.—amphibian; population ecology; population estimate
INTRODUCTION
Caves and associated subterranean habitats represent
some of the most challenging environments on the planet, as organisms must deal with perpetual absence of light and low energy resources (Poulson and Lavoie 2000; Culver and Pipan 2009). Most cave ecosystems are fueled by allochthonous organic matter (Culver 1982; Culver and Pipan 2009) and ultimately controlled by bottom-up forces (Gibert and Deharveng 2002; Huntsman et al. 2011). Important life history and demographic factors, such as growth rate, age at first reproduction, longevity, and population size depend on food availability, among other factors. In response to limited food resources, many troglobionts (obligate cave-dwelling species) have evolved traits consistent with a K-selected life history, including slower growth rates and development, reduced metabolism, and longer
life spans, when compared to surface relatives (Culver 1982; Hüppop 2000).
More than 100 species of bats in temperate and tropical regions regularly roost in caves forming large colonies of thousands to millions of individuals and are an important source of organic input in many cave ecosystems which are otherwise energy-limited (Barr 1968; Poulson 1972; Howarth 1983; Gnaspini and Trajano 2000; Kunz et al. 2011). In some cave systems, large quantities of guano are often deposited seasonally and exploited by cave invertebrates (see review by Howarth 1983), influencing trophic dynamics and community structure of cave ecosystems (Poulson 1972; Gnaspini and Trajano 2000; Poulson and Lavoie 2000; Fenolio et al. 2006; Graening 2005). Invertebrate communities associated with guano are known to increase in numbers and density after bats congregate in cave systems (Howarth 1983; Poulson and Lavoie 2000; Culver and Pipan 2009). This increase in invertebrate
Copyright © 2014. Danté Fenolio. All Rights Reserved.

Herpetological Conservation and Biology
395
biomass provides a potentially important food resource for vertebrate predators, such as cavefishes and salamanders, in cave ecosystems (Fenolio et al. 2006; Niemiller and Poulson 2010).
One group of vertebrates that have successfully colonized caves and evolved an obligate subterranean existence is salamanders. At least ten species from two families in North America and Europe are restricted to caves (Goricki et al. 2012). In addition to regression of eyes and pigmentation, most cave-dwelling salamanders are neotenic, retaining larval characteristics throughout life and attaining sexual maturity while still in the larval form. The Grotto Salamander, Eurycea spelaea (=Typhlotriton spelaeus), a plethodontid species endemic to the Ozark Highlands of North America (Fig. 1), is unusual among troglobiotic salamanders in that it regularly undergoes metamorphosis (Brandon 1966; Petranka 1998), although neotenic populations have been reported (Bishop 1944; Mohr 1950; Smith 1960) as well as disputed (Brandon 1966; Brandon and Black 1970).
Eurycea spelaea reportedly is most abundant in larger passageways of caves that harbor extensive bat colonies, particularly from April into October in caves supporting Gray Bat (Myotis grisescens) maternity roosts (Hendricks and Kezer 1958; Brandon 1971b; Fenolio et al. 2006). Larvae, and probably adults, eat the invertebrate fauna found near guano piles (Brandon 1971b; Fenolio et al. 2006). Although E. spelaea, and troglobiotic salamanders in general, are thought to be strictly carnivorous, larvae from at least one population of E. spelaea will consume bat guano, which may serve as important nutrition in an otherwise resource-limited environment (Fenolio et al. 2006).
Although increases in abundance have been noted for E. spelaea associated with caves harboring bat roosts (Hendricks and Kezer 1958), potential effects on life history have not been examined. Moreover, little
information is available on the life history and ecology of E. spelaea in general, despite being a top predator in many caves they inhabit (Petranka 1998). In this study we used data acquired from a 25-mo capture-mark-recapture study and estimated growth rates, age at metamorphosis, age at sexual maturity, and longevity for a population of E. spelaea inhabiting a cave system that also contains a relatively large seasonal bat maternity colony. In addition, we estimated population size for E. spelaea and tested for associations of larval body condition and the presence of bats. This association has implications for conservation of cave ecosystems, and is of special concern given the recent extirpation of North American bat populations, particularly those associated with the fungus Pseudogymnoascus (= Geomyces) destructans, which causes White Nose Syndrome (e.g., Gargas et al. 2009; Minnis and Lindner 2013).
MATERIALS AND METHODS
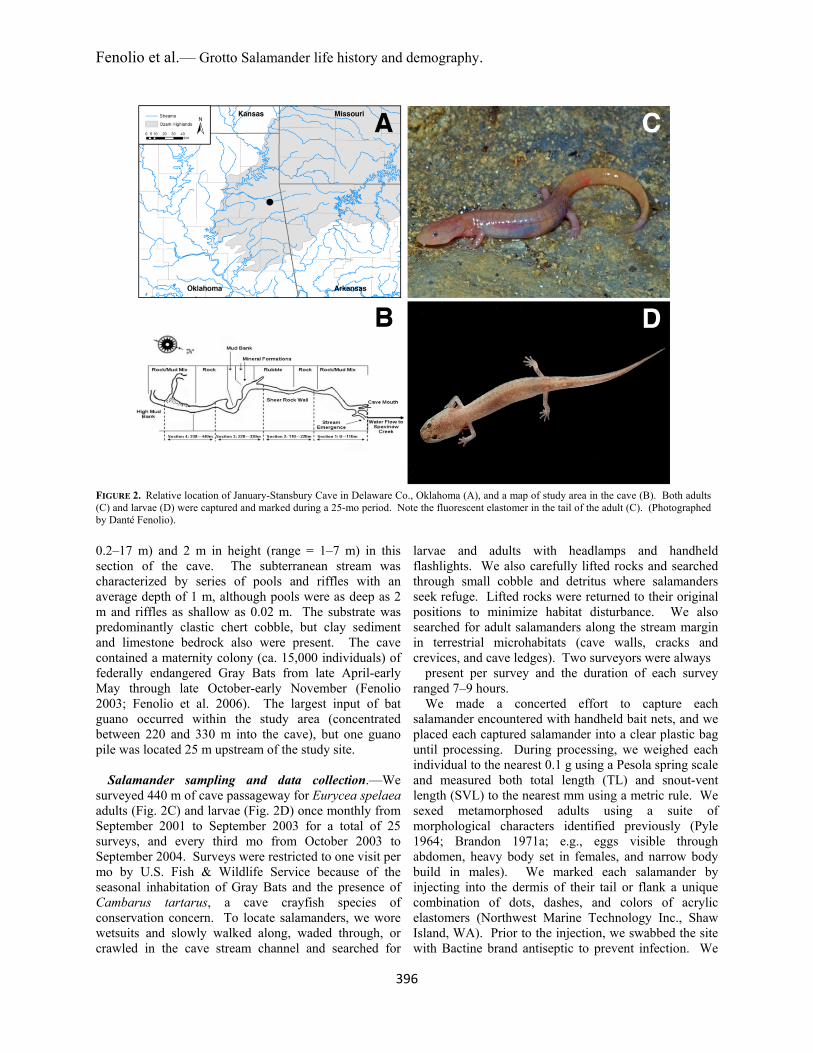
Study site.—January-Stansbury Cave is located 6 km
north of the town of Colcord in Delaware County, Oklahoma, within the Ozark Plateaus Ecoregion (Fig. 2A). It is a phreatic conduit 1,800 m long with secondary vadose development formed from the dissolution of the Mississippian-age limestone of the Boone Formation (Looney and Puckett 1970). January-Stansbury Cave contains a subterranean stream that discharges from a spring at one entrance to the cave system with a base level flow of 1 m3 min-1 (Looney and Puckett 1970). Water from the cave ultimately drains into Spavinaw Creek of the Neosho River drainage.
The study area was confined to the first 440 m of stream passage from the main entrance to the first large chamber known as the “Moonshine Room” (Fig. 2B). The cave passage averaged ca. 5 m in width (range =
FIGURE 1. Adult Grotto Salamanders, Eurycea spelaea, live a terrestrial life and have vestigial eyes with eyelids fused over them (left). Larval E. spelaea (right) are aquatic, have fully functional eyes, and can be found in surface streams as well as subterranean waterways. (Photographed by Danté Fenolio).
Fenolio et al.— Grotto Salamander life history and demography.
396
0.2–17 m) and 2 m in height (range = 1–7 m) in this section of the cave. The subterranean stream was characterized by series of pools and riffles with an average depth of 1 m, although pools were as deep as 2 m and riffles as shallow as 0.02 m. The substrate was predominantly clastic chert cobble, but clay sediment and limestone bedrock also were present. The cave contained a maternity colony (ca. 15,000 individuals) of federally endangered Gray Bats from late April-early May through late October-early November (Fenolio 2003; Fenolio et al. 2006). The largest input of bat guano occurred within the study area (concentrated between 220 and 330 m into the cave), but one guano pile was located 25 m upstream of the study site.
Salamander sampling and data collection.—We
surveyed 440 m of cave passageway for Eurycea spelaea adults (Fig. 2C) and larvae (Fig. 2D) once monthly from September 2001 to September 2003 for a total of 25 surveys, and every third mo from October 2003 to September 2004. Surveys were restricted to one visit per mo by U.S. Fish & Wildlife Service because of the seasonal inhabitation of Gray Bats and the presence of Cambarus tartarus, a cave crayfish species of conservation concern. To locate salamanders, we wore wetsuits and slowly walked along, waded through, or crawled in the cave stream channel and searched for
larvae and adults with headlamps and handheld flashlights. We also carefully lifted rocks and searched through small cobble and detritus where salamanders seek refuge. Lifted rocks were returned to their original positions to minimize habitat disturbance. We also searched for adult salamanders along the stream margin in terrestrial microhabitats (cave walls, cracks and crevices, and cave ledges). Two surveyors were always
present per survey and the duration of each survey ranged 7–9 hours.
We made a concerted effort to capture each salamander encountered with handheld bait nets, and we placed each captured salamander into a clear plastic bag until processing. During processing, we weighed each individual to the nearest 0.1 g using a Pesola spring scale and measured both total length (TL) and snout-vent length (SVL) to the nearest mm using a metric rule. We sexed metamorphosed adults using a suite of morphological characters identified previously (Pyle 1964; Brandon 1971a; e.g., eggs visible through abdomen, heavy body set in females, and narrow body build in males). We marked each salamander by injecting into the dermis of their tail or flank a unique combination of dots, dashes, and colors of acrylic elastomers (Northwest Marine Technology Inc., Shaw Island, WA). Prior to the injection, we swabbed the site with Bactine brand antiseptic to prevent infection. We
FIGURE 2. Relative location of January-Stansbury Cave in Delaware Co., Oklahoma (A), and a map of study area in the cave (B). Both adults (C) and larvae (D) were captured and marked during a 25-mo period. Note the fluorescent elastomer in the tail of the adult (C). (Photographed by Danté Fenolio).

Herpetological Conservation and Biology
397
allowed salamanders to recover, and then we released them at their point of capture. To determine how frequently larvae from the surface stream potentially entered January-Stansbury Cave, we captured and marked larvae from the surface stream issuing from the cave mouth to 20 m downstream during a single survey in September 2001. Larvae were handled and marked as described previously.
We tested whether adults differed from a 1:1 sex ratio using a binomial test, and used Shapiro-Wilk normality tests to test for deviations from normality. We also employed Wilcoxon rank sum tests to assess if males differed from females in body size or mass. We conducted all statistical analyses in the computer application R v2.15.1 (R Developmental Core Team 2012).
Detectability, survival rates, and population size.—
We employed an open population model to estimate population size, capture probabilities and survival rates by fitting a Jolly-Seber open population model using program RCAPTURE (Baillargeon and Rivest 2007). An open population model was most appropriate for the January-Stansbury Cave population for several reasons. First, the length of study (25 mo) and estimated growth rates (see Results) suggest both birth and death likely contribute to a lack of closure. Second, immigration and emigration by adults and larvae likely occurs in the study area, as we did not survey the entirety of available habitat in the study area. Because there were a large number of capture occasions but a limited number of captures, we reduced the capture history matrix from 25 capture occasions to eight primary capture periods by pooling capture occasions in three-mo intervals (the last period consisted of four mo). We evaluated two open models: one that allowed capture probabilities to vary between periods, and one that held capture probabilities equal across periods. We evaluated model fit via Akaike's Information Criterion (AIC).
Body condition and growth rates.—We estimated
growth rates for recaptured individuals as the difference between body size (SVL) at the time of recapture and initial SVL at time of first capture divided by the number of days elapsed between capture events. We then multiplied this rate by 30 to obtain a monthly growth increment. Negative growth increments were attributed to measurement error and were excluded. For salamanders recaptured multiple times, we calculated monthly growth increments using the recapture interval closest to 365 days. We regressed monthly growth increments against the geometric mean of SVL over the recapture time interval to estimate a size-specific monthly growth rate. The regression equation formed the basis for a growth model to estimate body size at specific ages. We initialized the growth model at 13 mm
SVL, the mean size of hatchlings reported in the literature (Brandon 1970), and iterated over monthly intervals until the body size of the largest individuals in the population was encompassed. This approach allowed us to estimate the expected body size of different age-classes and, also, longevity (Huntsman et al. 2011; Venarsky et al. 2012).
We used a bootstrap technique (Whitmore and Huryn 1999) to generate 95% confidence limits around these estimates. We calculated a body condition index (BCI) for individual salamanders based on the equation BCI = wet body mass/aSVLb (as in Huntsman et al. 2011), where a and b are the intercept and slope, respectively, of a length-wet mass relationship for all salamanders measured in the population. We tested if BCI differed among sexes of adults using a Wilcoxon rank sum test.
Time to metamorphosis and longevity.—We
estimated time to metamorphosis by plotting the body size (SVL) of the smallest metamorphosed salamander and the body size of the largest larval form salamander on the growth curve. The body size of the largest adult was plotted to estimate the minimum life span. The values constrained by the 95% confidence intervals represent the estimated age range. We also constructed density plots to visualize the distribution of body sizes for both larvae and adults.
Association with bats.—We tested for associations
between the presence/absence of Gray Bats with salamander abundance and BCI. A Wilcoxon rank sum test was used to determine if salamander abundance (both larvae and adults) was greater when bats were present than when bats were absent. A Wilcoxon rank sum test was also used to determine if BCI was greater when bats were present than when bats were absent. We assumed that a direct relationship exists between allochthonous organic input and stream flow into the cave (e.g., Culver 1982; Graening 2005; Culver and Pipan 2009), and we used linear regression to test for a relationship between mean monthly BCI and mean monthly stream flow. We obtained monthly flow data from 2000 to 2003 for the Spavinaw Creek near Sycamore, Oklahoma, stream gauge (USGS 07191220) from the U.S. Geological Survey National Water Information System website (http://waterdata.usgs.gov/ nwis).
Movement and distribution in the study area.—To examine whether salamanders used stream habitat equally, we tested if salamander abundance varied among stream sections of the study area. We divided the 440-m study area divided into four 110 m sections. We took the total distance from the mouth of the cave to the last section of the cave where our surveys would end and divided it into four equal distances (the nature of the
Fenolio et al.— Grotto Salamander life history and demography.
398
cave changes beyond that point into a mostly aquatic system that is more difficult to sample). We recorded the distance from the entrance for each salamander captured. For recaptured salamanders, we also calculated the mean distance moved between capture encounters (in 5 m intervals). We used multinomial tests to determine if salamander abundance differed among the study area for larvae and adults. We used only data from the first capture occasion. We used a Fisher Exact Test to determine if adults and larvae differed in sections of streams inhabited.
RESULTS
We captured and marked 113 larvae and 28 adult salamanders during the 25-mo study. Of the adults, 11 were males and 16 were females; one individual could not be sexed. The M : F sex ratio of adults was 1 : 1.45, and no bias was detected (binomial test, P=0.442). One hundred seven salamanders were captured only once, 31 salamanders twice, two salamanders three times, and one salamander was captured four times. Of the 34 salamanders recaptured, 29 were larvae and five were adults. All recaptured adults were male. No larvae marked (n = 30) during the single survey in September 2001 from the 20-m surface stream reach outside of the cave were recaptured in the study area within January-Stansbury Cave.
Larvae ranged 14–45 mm in body size (mean SVL SE; 30.1 0.7 mm) and 0.1–2.1 g in mass (mean 0.8 0.1 g). Adults ranged 37–52 mm in body size (mean SVL 47.9 0.7 mm) and 1.6–2.6 g in mass (mean 2.1 0.1 g). Adult males and females did not differ in body size (W = 100, P = 0.567), but females were heavier than males (W = 139, P = 0.012).
Detectability, survival rates, and population size.—
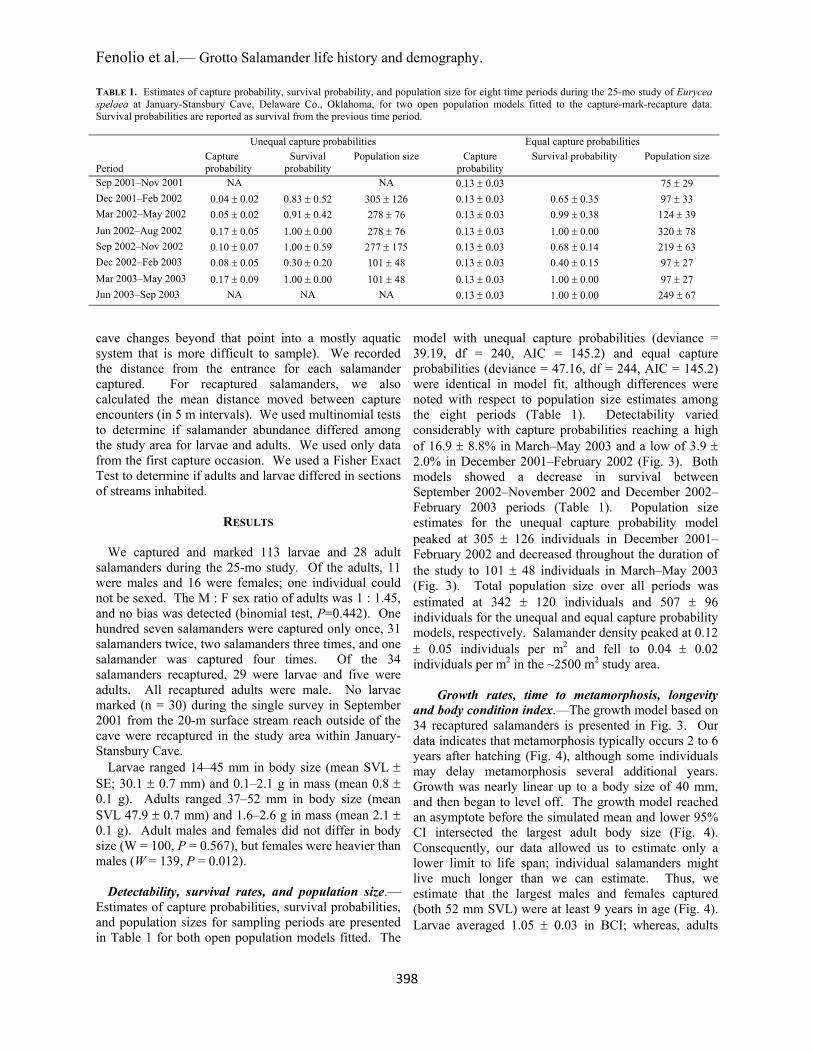
Estimates of capture probabilities, survival probabilities, and population sizes for sampling periods are presented in Table 1 for both open population models fitted. The
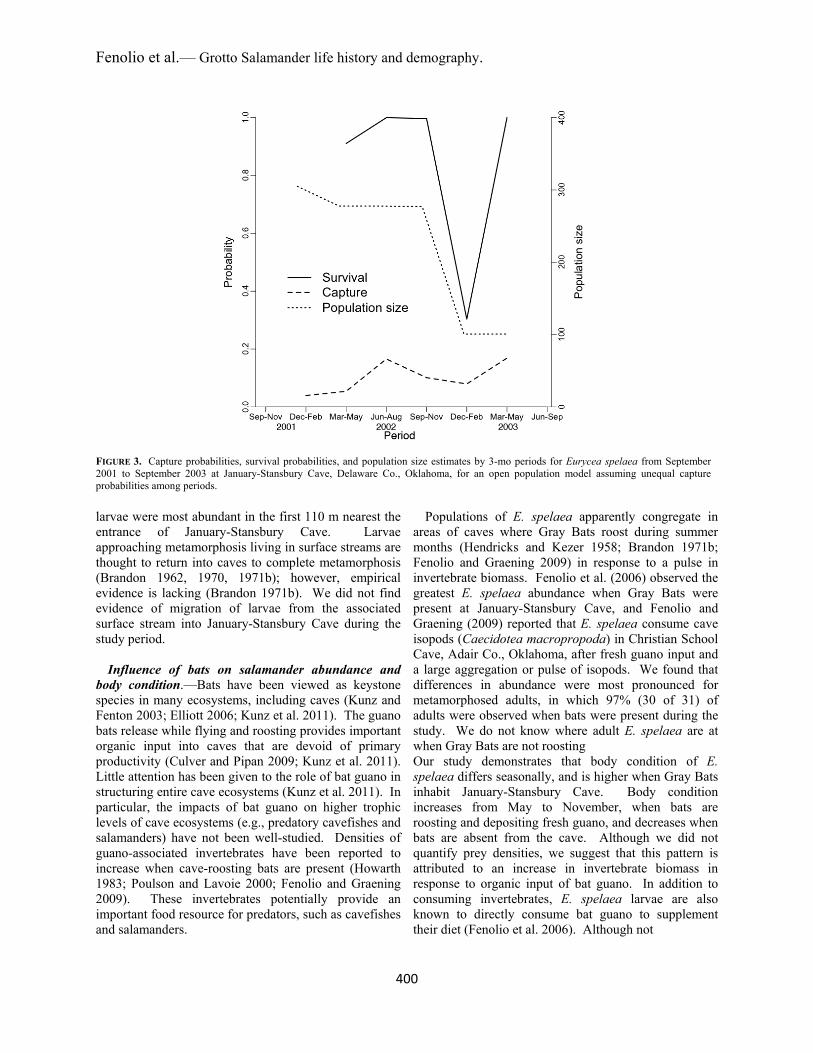
model with unequal capture probabilities (deviance = 39.19, df = 240, AIC = 145.2) and equal capture probabilities (deviance = 47.16, df = 244, AIC = 145.2) were identical in model fit, although differences were noted with respect to population size estimates among the eight periods (Table 1). Detectability varied considerably with capture probabilities reaching a high of 16.9 8.8% in March–May 2003 and a low of 3.9 2.0% in December 2001–February 2002 (Fig. 3). Both models showed a decrease in survival between September 2002–November 2002 and December 2002–February 2003 periods (Table 1). Population size estimates for the unequal capture probability model peaked at 305 126 individuals in December 2001–February 2002 and decreased throughout the duration of the study to 101 48 individuals in March–May 2003 (Fig. 3). Total population size over all periods was estimated at 342 120 individuals and 507 96 individuals for the unequal and equal capture probability models, respectively. Salamander density peaked at 0.12 0.05 individuals per m2 and fell to 0.04 0.02 individuals per m2 in the ~2500 m2 study area.
Growth rates, time to metamorphosis, longevity
and body condition index.—The growth model based on 34 recaptured salamanders is presented in Fig. 3. Our data indicates that metamorphosis typically occurs 2 to 6 years after hatching (Fig. 4), although some individuals may delay metamorphosis several additional years. Growth was nearly linear up to a body size of 40 mm, and then began to level off. The growth model reached an asymptote before the simulated mean and lower 95% CI intersected the largest adult body size (Fig. 4). Consequently, our data allowed us to estimate only a lower limit to life span; individual salamanders might live much longer than we can estimate. Thus, we estimate that the largest males and females captured (both 52 mm SVL) were at least 9 years in age (Fig. 4). Larvae averaged 1.05 0.03 in BCI; whereas, adults
TABLE 1. Estimates of capture probability, survival probability, and population size for eight time periods during the 25-mo study of Eurycea spelaea at January-Stansbury Cave, Delaware Co., Oklahoma, for two open population models fitted to the capture-mark-recapture data. Survival probabilities are reported as survival from the previous time period. Unequal capture probabilities Equal capture probabilities Period
Capture probability
Survival probability
Population size Capture probability
Survival probability Population size
Sep 2001–Nov 2001 NA NA 0.13 0.03 75 29
Dec 2001–Feb 2002 0.04 0.02 0.83 0.52 305 126 0.13 0.03 0.65 0.35 97 33
Mar 2002–May 2002 0.05 0.02 0.91 0.42 278 76 0.13 0.03 0.99 0.38 124 39
Jun 2002–Aug 2002 0.17 0.05 1.00 0.00 278 76 0.13 0.03 1.00 0.00 320 78
Sep 2002–Nov 2002 0.10 0.07 1.00 0.59 277 175 0.13 0.03 0.68 0.14 219 63
Dec 2002–Feb 2003 0.08 0.05 0.30 0.20 101 48 0.13 0.03 0.40 0.15 97 27
Mar 2003–May 2003 0.17 0.09 1.00 0.00 101 48 0.13 0.03 1.00 0.00 97 27
Jun 2003–Sep 2003 NA NA NA 0.13 0.03 1.00 0.00 249 67

Herpetological Conservation and Biology
399
averaged 0.96 0.04 in BCI. There was no difference in BCI between sexes of adults (W = 114, P = 0.208).
Salamander abundance and body condition index
associations with bats.—Larval salamander abundance was greatest from May–October, coincidental with Gray Bat inhabitation of January-Stansbury Cave (Fig. 5, W = 120.5, P = 0.021). Adult salamander abundance showed an even greater association with bats as 31 adults were found in the study area when bats were present versus one adult observed when bats were absent (Fig. 5, W = 146.5, P < 0.001). Salamander BCI also was greater when bats were present than when bats were absent (Fig. 5, W = 2358.5, P = 0.024). There was no relationship between mean monthly BCI and mean monthly stream flow in the study area (F = 0.385, df = 1.23, P = 0.54; Fig. 6).
Movement and distribution in the study area.—
Larvae were unevenly distributed across the 440-m study area (P < 0.001), with greatest abundance in the first 110 m from the entrance where 43% (49 individuals) of larvae were observed. Adults also were unevenly distributed (P = 0.005), but greatest abundance was found 220–330 m from the entrance where 50% (14 individuals) of adults were observed. The largest inputs of bat guano were in this region of the cave. Larvae and adults differed in abundance among the sections of study area (P = 0.012). Adults moved 9.8 1.7 m between recaptures; whereas, larvae moved 39.7 12.4 m between recaptures on average. One larva that was captured in the first 110 m from the cave entrance was recaptured as a metamorphosed adult 200 m deeper into the cave and 25 mo later; whereas, another larva was also captured and marked within the first 110 m from the cave entrance and it moved 300 m deeper into the cave within a 5 mo period. However, larvae were no more likely to move upstream into the cave versus downstream (P = 0.324).
DISCUSSION
Growth, metamorphosis, and longevity.—The length of the larval period in Eurycea spelaea has been reported as 2–3 years (Hendricks and Kezer 1958; Smith 1960; Brandon 1970; Rudolph 1978; Trauth et al. 2004), with metamorphosis occurring at 36–56 mm SVL (Petranka 1998; Trauth et al. 2004). Size at metamorphosis in the January-Stansbury Cave population falls within this reported size range (37–45 mm SVL). However, our growth estimates suggest a considerably greater age range at time of metamorphosis (2–6 years). Some larvae may take in excess of 6 years to metamorphose.
Many cave-dwelling organisms have evolved life spans longer than their surface relatives, probably in response to limited energy resources in their cave
habitats (Cooper 1975; Culver 1982; Niemiller and Poulson 2010; Venarsky et al. 2012). Life span of individuals in wild populations of E. spelaea is unknown, although a salamander in captivity lived for 12 years (Snider and Bowler 1992). Our estimate of a life span of at least 9 years for both males and females seems reasonable. Longevity in wild populations of other troglobiotic species of Eurycea is also unknown, but one captive Texas Blind Salamander (Eurycea rathbuni) lived at least 10 years (Snider and Bowler 1992).
Population size and dispersal.—Our study is the
first to estimate the population size and density of E. spelaea using capture-recapture data. Life history and demographic data are vital to comparative studies in ecology and evolution, and for instituting accurate and effective management strategies. Estimates of population size were similar between the two models and ranged from 75 to 320 individuals during each time period. However, confidence intervals around these estimates were large because of low number of individuals encountered for some time periods. Brandon (1971b) observed and removed 130 postmetamorphic adults and subadults from a cave in southeast Missouri during a 4-year period, and Hendricks and Kezer (1958) observed 106 adults from a cave in Laclede Co., Missouri during a single survey. Note that these two studies report postmetamorphic individuals only; whereas, our estimates include both metamorphosed adults and larvae. Also, adults composed 20% of all marked individuals during our study. Few other studies have estimated population sizes and densities of cave-dwelling salamanders from capture-recapture data. Huntsman et al. (2011) estimate population sizes of 215 (CI: 128–302) and 109 (CI: 77–141) for two populations of the Tennessee Cave Salamander (Gyrinophilus palleucus) in northeastern Alabama. Estimates of salamander density at January-Stansbury Cave (ranging from 0.04 to 0.12 individuals per m2) are similar to estimates for the two G. palleucus populations studied by Huntsman et al. (2011; 0.10 and 0.03 individuals per m2, respectively). However, their estimates of population size and density were based on closed population models that do not account for birth, death, immigration and emigration. Consequently, direct comparisons between this study and ours should be made with caution. Larval E. spelaea often are washed out or drift outside of caves into surface streams (Brandon 1971b; Rudolph 1978; Petranka 1998; Fenolio 2003; Trauth et al. 2004). Larval drift has been hypothesized to be important in dispersal into other cave systems (Brandon 1971b). Larvae do exit the January-Stansbury Cave system, as larvae are regularly observed in the surface stream fed by the cave (DBF, pers. obs.), thus violating an assumption of closed population models. In addition,
Fenolio et al.— Grotto Salamander life history and demography.
400
larvae were most abundant in the first 110 m nearest the entrance of January-Stansbury Cave. Larvae approaching metamorphosis living in surface streams are thought to return into caves to complete metamorphosis (Brandon 1962, 1970, 1971b); however, empirical evidence is lacking (Brandon 1971b). We did not find evidence of migration of larvae from the associated surface stream into January-Stansbury Cave during the study period.
Influence of bats on salamander abundance and
body condition.—Bats have been viewed as keystone species in many ecosystems, including caves (Kunz and Fenton 2003; Elliott 2006; Kunz et al. 2011). The guano bats release while flying and roosting provides important organic input into caves that are devoid of primary productivity (Culver and Pipan 2009; Kunz et al. 2011). Little attention has been given to the role of bat guano in structuring entire cave ecosystems (Kunz et al. 2011). In particular, the impacts of bat guano on higher trophic levels of cave ecosystems (e.g., predatory cavefishes and salamanders) have not been well-studied. Densities of guano-associated invertebrates have been reported to increase when cave-roosting bats are present (Howarth 1983; Poulson and Lavoie 2000; Fenolio and Graening 2009). These invertebrates potentially provide an important food resource for predators, such as cavefishes and salamanders.
Populations of E. spelaea apparently congregate in areas of caves where Gray Bats roost during summer months (Hendricks and Kezer 1958; Brandon 1971b; Fenolio and Graening 2009) in response to a pulse in invertebrate biomass. Fenolio et al. (2006) observed the greatest E. spelaea abundance when Gray Bats were present at January-Stansbury Cave, and Fenolio and Graening (2009) reported that E. spelaea consume cave isopods (Caecidotea macropropoda) in Christian School Cave, Adair Co., Oklahoma, after fresh guano input and a large aggregation or pulse of isopods. We found that differences in abundance were most pronounced for metamorphosed adults, in which 97% (30 of 31) of adults were observed when bats were present during the study. We do not know where adult E. spelaea are at when Gray Bats are not roosting Our study demonstrates that body condition of E. spelaea differs seasonally, and is higher when Gray Bats inhabit January-Stansbury Cave. Body condition increases from May to November, when bats are roosting and depositing fresh guano, and decreases when bats are absent from the cave. Although we did not quantify prey densities, we suggest that this pattern is attributed to an increase in invertebrate biomass in response to organic input of bat guano. In addition to consuming invertebrates, E. spelaea larvae are also known to directly consume bat guano to supplement their diet (Fenolio et al. 2006). Although not
FIGURE 3. Capture probabilities, survival probabilities, and population size estimates by 3-mo periods for Eurycea spelaea from September 2001 to September 2003 at January-Stansbury Cave, Delaware Co., Oklahoma, for an open population model assuming unequal capture probabilities among periods.

Herpetological Conservation and Biology
401
documented, perhaps terrestrial adults also ingest bat guano. Huntsman et al. (2011) hypothesize that variation in body condition of G. palleucus and invertebrate prey biomass are associated with seasonal variation in precipitation. They report that body condition of G. palleucus is highest from January through April, concurrent with increased seasonal precipitation, which washes larger amounts of organic matter and invertebrate prey into cave ecosystems. In contrast, seasonal variability in precipitation does not appear to be highly correlated to BCI at January-Stansbury Cave. As in the sites studied by Huntsman et al. (2011), the
wettest period of the year in northeastern Oklahoma is from January through April, yet body condition is greatest outside of this period and is observed during the driest period of the year, from May into November during 2002 and 2003. Body condition is considerably higher from September through November 2001, but with considerably greater variation among individuals. Higher BCI during this period may be related to greater precipitation in winter 2000–2001, a larger bat population that summer, or reflect small sample sizes during this time period. Conversely, the E. spelaea population appears to have experienced a population
FIGURE 4. Growth model for Eurycea spelaea based on body size (SVL in mm) and age (in years) from January-Stansbury Cave, Delaware Co., Oklahoma. Dashed lines are the upper and lower 95% confidence intervals. To the right is a density plot of body size for larvae and adults. The gray box is the body size range at metamorphosis bounded by the body size of the smallest metamorphosed adult and the largest larva observed. The solid horizontal line is the body size of the largest adult observed in the population (52 mm SVL).
FIGURE 5. Season patterns of body condition index (BCI; left y-axis) and salamander abundance (right y-axis) for Eurycea spelaea at January-Stansbury Cave, Delaware Co., Oklahoma. Data points are the mean 1 SE. Gray area represents when bats are present inside the cave and white area when bats are absent.

Fenolio et al.— Grotto Salamander life history and demography.
402
decline during winter 2002–2003. Survival and population size estimates were lowest during this period, which also coincides with the lowest monthly BCI for the entire study. This decline may be the result of several factors, including a smaller maternity colony the preceding summer, a prolonged period of drought beginning in July 2002, disease, or other unknown causes.
Because of the absence of primary producers and photosynthesis, food webs of subterranean ecosystems are narrowed at the base (Gibert and Deharveng 2002). This bottom-up control constrains higher trophic levels (Gibert and Deharveng 2002; Huntsman et al. 2011), such that there are few or no specialized predators at the top of subterranean food webs, and omnivory dominates in cave systems with low energy inputs. Our study indicates that bat guano may be an important, or even dominant, energy input in some cave food webs, and may affect the population structure and fitness of top predators, such as cave salamanders. With the continued spread of White Nose Syndrome (i.e., Pseudogymnoascus destructans infection) and a general decline in North American bat populations (e.g., Frick et al. 2010, Blehert et al. 2011), a collapse in bat populations could have far-reaching effects throughout many subterranean food webs. Perhaps fortunately, most caves are not home to large numbers of bats.
Acknowledgments.—Funding for this study was
provided in part by the Oklahoma Department of
Wildlife Conservation (Mark Howery, sponsor), NATURAE—Consultoria Ambiental Ltda., the University of Oklahoma Graduate Student Senate, the Oklahoma Biological Survey and the Department of Zoology (University of Oklahoma) and The Nature Conservancy. Steve Hensley, Shae Hammond, and Richard Stark (U.S. Fish and Wildlife Service) provided access to the cave (Ozark National Wildlife Refuge, Looney Unit) and assistance with fieldwork. The Ozark National Wildlife Refuge (Looney Unit) generously allowed researchers the use of facilities on that land throughout this study. Andy Harris, Nathan Harris, Brad Thomas, Sane Jones, Mark Walvoord, Cari Deen, Mike Gerber, John Malone, Mike Slay and Liz Bergey also assisted in the field. The following individuals provided feedback during the preparation of this manuscript: Liz Bergey, Jan Caldwell, Cari Deen, Steve Green, Vic Hutchison, Chris Leary, Julian Lee, Jim O’Reilly, Stephen Richter, Don Shepard, John Simmons, Leo Sternberg, Stan Trauth, Caryn Vaughn, and Mark Walvoord. The Texas Agricultural Experiment Station and Texas A&M University System supported Bret Collier’s contributions to this project. We captured animals under Oklahoma Department of Wildlife Conservation special license number 3086 and University of Oklahoma Animal Care and Use Committee assurance number A3240-01.
FIGURE 6. Seasonal patterns of mean monthly body condition index (BCI; left y-axis) of Eurycea spelaea and mean monthly stream flow (in cubic feet per second; right y-axis) at January-Stansbury Cave, Delaware Co., Oklahoma, from 2000–2003. Data points are the mean 1 SE. The study was conducted from September 2001 to September 2003.

Herpetological Conservation and Biology
403
LITERATURE CITED Baillargeon, S., and L. Rivest. 2007. Rcapture: loglinear
models for capture-recapture in R. Journal of Statistical Software 19:1–31.
Barr, T.C. 1968. Cave ecology and the evolution of troglobites. Evolutionary Biology 2:35–102.
Bishop, S.C. 1944. A new neotenic plethodont salamander, with notes on related species. Copeia 1944:1–5.
Blehert, D.S., J.M. Lorch, A.E. Ballmann, P.M. Cryan, and C.U. Meteyer. 2011. Bat white-nose syndrome in North America. Microbe 6:267–273.
Brandon, R.A. 1962. Summary of past investigations on Typhlotriton spelaeus, the Grotto Salamander. Cave Notes 4:9–12.
Brandon, R.A. 1966. A reevaluation of the status of the salamander, Typhlotriton nereus Bishop. Copeia 1966:555–561.
Brandon, R.A. 1970. Typhlotriton and T. spelaeus. Catalogue of American Amphibians and Reptiles 84:1–2.
Brandon, R.A. 1971a. North American troglobitic salamanders: some aspects of modification in cave habitats, with special reference to Gyrinophilus palleucus. Bulletin of the National Speleological Society 33:1–21.
Brandon, R.A. 1971b. Correlation of seasonal abundance with feeding and reproductive activity in the Grotto Salamander (Typhlotriton spelaeus). American Midland Naturalist 86:93–100.
Brandon, R.A., and J.H. Black. 1970. The taxonomic status of Typhlotriton braggi (Caudata, Plethodontidae). Copeia 1970:388–391.
Cooper, J.E. 1975. Ecological and behavioral studies in Shelta Cave, Alabama, with emphasis on decapod crustaceans. Ph.D. dissertation, University of Kentucky, Lexington, Kentucky, USA.
Culver, D.C. 1982. Cave Life: Evolution and Ecology. Harvard University Press, Cambridge, Massachusetts, USA.
Culver, D.C., and T. Pipan. 2009. The Biology of Caves and Other Subterranean Habitats. 2nd Edition. Oxford University Press, Oxford, United Kingdom.
Elliott, W.R. 2006. Critical issues in cave biology. Pp. 35–39 In Proceedings of the 2005 National Cave and Karst Management Symposium. Albany, New York, USA.
Fenolio, D.B. 2003. Ecology of the Grotto Salamander, Typhlotriton spelaeus. M.Sc. Thesis. University of Oklahoma, Department of Zoology, Norman, Oklahoma, USA. 94 p.
Fenolio, D.B., and G.O. Graening. 2009. Report of a mass aggregation of isopods in an Ozark cave of Oklahoma with considerations of population sizes of stygobionts. Speleobiology Notes 1:9–11.
Fenolio, D.B., G.O. Graening, B.A. Collier, and J.F. Stout. 2006. Coprophagy in a cave-adapted salamander: the importance of bat guano examined through nutritional and stable isotope analyses. Proceedings of the Royal Society of London Series B 273:439–443.
Frick, W.F., J.F. Pollock, A.C. Hicks, K.E. Langwig, D.S. Reynolds, G.G. Turner, C.M. Butchkoski, and T.H. Kunz. 2010. An emerging disease causes regional population collapse of a common North American bat species. Science 329:679–682.
Gargas, A., M.T. Trest, M. Christensen, T.J. Volk, and D.S. Blehert. 2009. Geomyces destructans sp. nov. associated with bat white-nose syndrome. Mycotaxon 108:147–154.
Gibert, J., and L. Deharveng. 2002. Subterranean ecosystems: a truncated functional biodiversity. BioScience 52:473–481.
Gnaspini, P., and E. Trajano. 2000. Guano communities in tropical caves. Pp. 251–268 In Ecosystems of the World: Subterranean Ecosystems. Volume 30. Wilkins, H., D.C. Culver, and W.F. Humphreys (Eds.). Elsevier, Amsterdam, Netherlands.
Goricki, S., M.L. Niemiller, and D.B. Fenolio. 2012. Salamanders. Pp. 665–676 In Encyclopedia of Caves. 2nd Edition. White, W.H., and D.C. Culver (Eds.). Elsevier, London, United Kingdom.
Graening, G. 2005. Trophic structure of Ozark cave streams containing endangered species. Journal of Oceanological and Hydrobiological Studies 34:3–17.
Hendricks, L.J., and J. Kezer. 1958. An unusual population of a blind cave salamander and its fluctuation during one year. Herpetologica 14:41–43.
Howarth, F.G. 1983. Ecology of cave arthropods. Annual Review of Entomology 28:365–389.
Huntsman, B.M., M.P. Venarsky, J.P. Benstead, and A.D. Huryn. 2011. Effects of organic matter availability on the life history and production of a top vertebrate predator (Plethodontidae: Gyrinophilus palleucus) in two cave streams. Freshwater Biology 56:1746–1760.
Hüppop, K. 2000. How do cave animals cope with the food scarcity in caves? Pp. 159–188 In Ecosystems of the World: Subterranean Ecosystems. Volume 30. Wilkins, H., D.C. Culver, and W.F. Humphreys (Eds.). Elsevier, Amsterdam, Netherlands.
Kunz, T.H., and M.B. Fenton. 2003. Bat Ecology. University of Chicago Press, Chicago, Illinois, USA.
Kunz, T.H., E. Braun de Torrez, D. Bauer, T. Lobova, and T.H. Fleming. 2011. Ecosystem services provided by bats. Annals of the New York Academy of Sciences 1223:1–38.
Looney, N., and B. Puckett. 1970. Caves in Oklahoma. Bulletin of the National Speleological Society 3:6–11.
Minnis, A.M., and D.L. Linder. 2013. Phylogenetic evaluation of Geomyces and allies reveals no close

Fenolio et al.— Grotto Salamander life history and demography.
404
relatives of Pseudogymnoascus destructans comb. nov., in bat hibernacula of eastern North America. Fungal Biology 117:638–649.
Mohr, C.E. 1950. Ozark cave life. Bulletin of the National Speleological Society 12:3–11.
Niemiller, M.L., and T.L. Poulson. 2010. Subterranean fishes of North America: Amblyopsidae. Pp. 169–280 In The Biology of Subterranean Fishes.
Trajano, M.E. Bichuette, and B.G. Kapoor (Eds.). Science Publishers, Enfield, New Hampshire, USA.
Petranka, J.W. 1998. Salamanders of the United States and Canada. Smithsonian Institution Press, Washington, DC, USA.
Poulson, T.L. 1972. Bat guano ecosystems. Bulletin of the National Speleological Society 34:55–59.
Poulson, T.L., and K.H. Lavoie. 2000. The trophic basis of subsurface ecosystems. Pp. 231–249 In Ecosystems of the World: Subterranean Ecosystems. Volume 30. Wilkins, H., D.C. Culver, and W.F. Humphreys (Eds.). Elsevier, Amsterdam, Netherlands.
Pyle, W.E. 1964. A population study of the Ozark Blind Cave Salamander, Typhlotriton spelaeus. M.S. Thesis, Central Missouri State College, Warrensburg, Missouri. 47 p.
R Developmental Core Team. 2012. R: a Language and Environment for Statistical Computing. R Foundation for S
tatistical Computing, Vienna, Austria.
Rudolph, D.C. 1978. Aspects of the larval ecology of five plethodontid salamanders of the western Ozarks. American Midland Naturalist 100:141–159.
Smith, C.C. 1960. Notes on the salamanders of Arkansas #1: life history of a neotenic stream-dwelling form. Proceedings of the Arkansas Academy of Science 14:66–74.
Snider, A.T., and J.K. Bowler. 1992. Longevity of reptiles and amphibians in North American collections. SSAR Herpetological Circular 21. 40 p.
Trauth, S.E., H.W. Robison, and M.V. Plummer. 2004. The Amphibians and Reptiles of Arkansas. The University of Arkansas Press, Fayetteville, Arkansas, USA.
Venarsky, M.P., A.D. Huryn, and J.P. Benstead. 2012. Re-examining extreme longevity of the cave crayfish Orconectes australis using new mark-recapture data: a lesson on the limitations of iterative size-at-age models. Freshwater Biology 57:1471–1481.
Whitmore, N., and A.D. Huryn. 1999. Life history and production of Paranephrops zealandicus in a forest stream, with comments about the sustainable harvest of a freshwater crayfish. Freshwater Biology 42:467–478.
DANTÉ B. FENOLIO directs the conservation and research program for the San Antonio Zoo. He received his B.S. in Biology and Environmental Studies from the University of California at Santa Cruz, his Master’s degree in Zoology from the University of Oklahoma, and his Ph.D. in Biology from the University of Miami, Florida. His research interests center on subterranean fauna, their biology, ecology, and conservation, with focal areas in North America and China. Fenolio is a coauthor on the Cave Life of Oklahoma and Arkansas as well as Cave Life of TAG. (Photographed by Matthew L. Niemiller).
MATTHEW L. NIEMILLER earned his Ph.D. from the University of Tennessee and is currently a postdoctoral researcher at the University of Illinois. His research and interests center on the evolution, ecology, and conservation of subterranean biodiversity as well as herpetofauna in the Southeastern United States. He is coeditor of The Amphibians of Tennessee and The Reptiles of Tennessee and lead author of Cave Life of TAG. (Photographed by Alfred Crabtree).

Herpetological Conservation and Biology
405
RONALD M. BONETT is an Associate Professor of Biological Science at the University of Tulsa. He received his Ph.D. from the University of Texas at Arlington. His research focuses on the biogeography, ecology, and evolution of alternative developmental patterns of salamanders. (Photograph by Ana Lilia Trujano Alvarez).
G.O. GRAENING is an environmental consultant and an Adjunct Professor at California State University, Sacramento. His research focuses on conservation biology, with emphasis on subterranean biodiversity. He is working on his second speleological book: the Cave Life of California and is lead author of the Cave Life of Oklahoma and Arkansas. (Photograph by G.O. Graening).
BRET A. COLLIER is an Assistant Professor in the School of Renewable Natural Resources at Louisiana State University where his work focuses on wildlife population dynamics. He received his Ph.D. from the Arkansas Cooperative Fish and Wildlife Research Unit at the University of Arkansas. (Photograph by Texas A & M University).
JIM F. STOUT has over 25 years of experience working at zoos and professional wildlife institutions, with over 10 years of experience working in Ozark caves. He is a Research Associate with the Oklahoma Biological Survey. (Photographed by Fran Stout).