Embed Size (px)
Citation preview


Dannel P. Malloy Governor
Office of Policy and Management
Benjamin Barnes, Secretary
Office of Finance
Robert S. Dakers, Executive Finance Officer
Municipal Finance Services Unit
Jean M. Gula William W. Plummer
Morgan M. Rice Lori A. Stevenson

INTRODUCTION “Municipal Fiscal Indicators” is an annual publication of the Office of Policy and Management (OPM). The publication consists of the most current financial information available for each of Connecticut's 169 municipalities. The majority of the data has been compiled from the audited financial reports of municipalities submitted annually to OPM and available at https://www.appsvcs.opm.ct.gov/Auditing/Home.aspx. The data extracted from these reports pertains primarily to each municipality's General Fund. Connecticut Municipalities are required to have their financial statements audited at least once annually under Chapter 111 of the Connecticut General Statutes. These financial statements must be presented in accordance with accounting principles generally accepted in the United States of America (GAAP). GAAP are uniform standards for financial accounting and reporting; however, these standards may be interpreted differently. This publication also includes selected demographic information relevant to, or having an impact upon, a municipality's financial condition. Some of the financial and demographic data has been calculated on a statewide basis to allow for comparisons between individual towns. Unique factors in a municipality may affect that municipality's statistics; such factors should be kept in mind when making comparisons among municipalities. Great care and diligence have been exercised to ensure the accuracy and timeliness of the data presented in this publication. Some of this information was compiled from outside sources; therefore, its quality and accuracy is dependent upon the source of origin. “Municipal Fiscal Indicators” is a collaborative effort on the part of all members of the Municipal Finance Services Unit of the Office of Finance within OPM. We would like to thank the various parties that have provided us information used in this publication.
NOTES TO USERS
Adjustments are not made in this publication for an auditor’s restatement of a prior year’s financial statements. Data for the City of Groton, which is a political subdivision of the Town of Groton, is included in this publication as it has been in previous editions. Certain financial and demographic information regarding the City of Groton is not available because separate statistics are not kept in all categories. The school enrollment data, net current expenditures (NCE) and NCE per pupil for fiscal year 2015-16 presented in this publication, is the latest data available from the State Dept. of Education (SDE) at the time of publication. The SDE has indicated that the figures have not been completely audited and are not considered final. The chart presented on pages B-18 to B-20 reflects the latest mill rates set by each municipality for FY 2017-18 at the time of this publication as reported by municipalities to OPM. However, the 2017-18 mill rates presented may undergo changes in a number of municipalities. As a result of the delay in the adoption of the FY 2018 and FY 2019 biennium State budget, a number of municipalities decided to set temporary mill rates until the State budget was adopted to determine the financial impact upon their finances for FY 2017-18. In addition, some municipalities were contemplating changes to their 2017-18 mill rates as the assumptions used in adopting their 2017-18 budgets were affected by the adopted FY 2018 and FY 2019 biennium State budget. Blank entries presented for a municipality indicates that the municipality did not report its FY 2017-18 mill rate to OPM at the time of this publication. Certain financial data for the Town of Plymouth for FYE 2016 is based upon a draft of Plymouth’s June 30, 2016 financial audit report. At the time of this publication the Town had not issued its June 30, 2016 audited financial statements.

TABLE OF CONTENTS Section A: General Information Page Section C: Statewide Rankings Page Glossary of Terms 1 Population, July 1, 2016 1 Connecticut Totals 8 Population Density per Sq. Mile, July 1, 2016 2 Connecticut Averages 9 Per Capita Income as a % of State Avg., 2016 3 Map of Connecticut 10 Bonded Debt per Capita, FYE 2016 6 Area in Square Miles 11 Net Pension Liability per Capita, FYE 2016 7 Bond Ratings as of November, 2017 12 Median Household Income as a % of State Median, 2016 8 Form of Government 14 Unemployment Rates, Calendar Year 2016 11 Pensions, Type and Number, FYE 2016 15 TANF Recipients as a % of Population 12 Funding Status of Defined Benefit Pension Plans 18 Net Current Education Expenditures Per Pupil, FYE 2016 14 Funding Status of Defined Benefit OPEB Plans 36 Current Year Tax Collection Rates, FYE 2016 16 Current Year Adjusted Tax Levy Per Capita, FYE 2016 17 Property Tax Revenue as a % of Total Revenue, FYE 2016 18 Intergovernmental Rev. as a % of Total Rev., FYE 2016 19 Section B: Current and Multi-Year Data Equalized Mill Rates, FYE 2016 20 Population, July 1, 2016 1 Equalized Net Grand List Per Capita, FYE 2016 21 Population Density, July 1, 2016 2 Per Capita Income as a % of State Avg., 2016 3 Section D: Individual Town Data Median Household Income as a % of State Median, 2016 5 Moody's Bond Ratings, November, 2017 7 Debt per Capita - Bonds / Pensions 9 Ratio of Bonded Debt to Grand List 11 Andover to Woodstock, Fiscal Years Ended 2012 – 2016 1 – 170 Net Current Educ. Expend. Per Pupil, FYE 2014 - 2016 12 Tax Collection Rates, FYE 2016 15 Unemployment Comparison, October 2016 and 2017 17 Mill Rates 18 Illustrative Data Chart or Map Revaluation Dates 21 Net Grand List, 2014 and 2015 Grand List Years 23 Tax Exempt Property, 2015 Grand List Year 25 Grand List Components 28 Grand List Components, as a % of 10/1/15 Assessment 29 Equalized Net Grand List 32 Copyright, Office of Policy and Management New Housing Authorizations, Calendar Year 2016 35 Median Values – Owner Occupied Homes - 2016 38
SECTION A
GENERAL INFORMATION

A - 1
GLOSSARY OF TERMS
ADJUSTED TAX LEVY (CURRENT YEAR) This data represents the property tax levy for the current fiscal year less any lawful adjustments as determined by the municipality. It does not include prior years’ tax levies. This data is derived from a municipality’s Tax Collector’s Report. AREA IN SQUARE MILES The United States Census Bureau implemented a computerized mapping system to determine the area in square miles of municipalities. This information was derived from the 2010 Census. DEBT SERVICE Debt service is the total of principal and interest paid annually on all the municipality's long-term bonds and notes. It does not include debt payments made by Proprietary Fund types. EQUALIZED MILL RATE The Equalized Mill Rate, or the Effective Tax Rate, is calculated by dividing the adjusted tax levy, as presented in the municipality’s Tax Collector's Report, by the Equalized Net Grand List. EQUALIZED NET GRAND LIST (ENGL) The Equalized Net Grand List is the estimate of the market value of all taxable property in a municipality. Municipalities revalue their Grand Lists based on schedules established by the Connecticut General Assembly (CGS 12-62). Thus, there can be a marked difference between the market value of all property and the assessed value. OPM calculates the ENGL from sales and assessment ratio information and grand list reports filed by the municipality.
FUND BALANCE The definition for this item is located on page A–5. FYE (FISCAL YEAR ENDED) Connecticut municipalities operate on the uniform fiscal year July 1 to June 30. A listing of “FYE 2016” means the fiscal year that began on July 1, 2015 and ended on June 30, 2016. FORM OF GOVERNMENT The Form of Government chart used in this report is compiled from annual reports submitted to the Secretary of the State by the municipality. The chart also identifies the election cycle for the Chief Executive Officer of each municipality. INCOME The median household income and per capita income presented in this publication are derived from the 2012-16 American Community Survey of the U.S. Census Bureau. The U.S. Census Bureau provides a detailed explanation on how the data is computed and the elements that make up the data. The web address for the Census Bureau is: http://www.census.gov/. LONG-TERM DEBT – BONDS / PENSIONS Long-Term Debt, as reported in this publication, includes long-term liabilities associated with governmental activities. Items included under the bonded long-term debt category includes bonds and notes for which the municipality has pledged its full faith and credit, capital lease obligations, and the portion of Regional School District debt, if any, for which the town is responsible. The pension related long-term debt presented in this publication on pages B-9 and B-10 is the net pension liability (NPL). See page A-6 for more information on the NPL.

A - 2
MILL RATE The mill rate is the rate of taxation levied on property subject to taxation under Connecticut General Statutes. One mill is equal to 1/1000 of a dollar. For example, a tax rate of 20 mills is equivalent to $20.00 per $1,000 of assessed value. Generally, the mill rates of special taxing districts located within the municipalities are not included in this publication. Due to the provisions of Section 12-71e of the General Statutes and Section 699 of P.A. 2017-2, mill rates are presented in this publication by real/personal property and motor vehicle, beginning for the 2015 and 2016 grand list years (FY 2016-17 and FY 2017-18 mill rates). MUNICIPAL BOND RATING A bond rating is an evaluation by credit-rating agencies of a municipality’s credit risk. Bonds covered by municipal bond insurance are frequently assigned a rating higher than what the rating would have been had bond insurance not been provided. A rating for municipalities with insured bonds only is not shown in this publication. A municipality's bonds may be rated by more than one rating agency. The three major rating agencies are Moody’s Investor Services, Standard and Poor’s Corporation, and Fitch Incorporated. The ratings from each of these respective rating agencies as of November, 2017, can be found on pages A-12 to A-13. The majority of CT municipalities have their bond issues rated by Moody's Investors Service. This rating is presented on the individual town page (Section D) and on page B-8. NET CURRENT EXPENDITURES (EDUCATION) Net Current Expenditures (NCE) represent the combination of local, state and federal dollars spent on public elementary and secondary education. NCE excludes expenditures for: regular education pupil transportation, debt service, land and capital costs, nonpublic expenditures, and expenditures supported by
tuition revenue. This data is published annually by the CT Department of Education. NET GRAND LIST The Net Grand List is the assessed value of all taxable property in a municipality net of exemptions allowed under state statutes as of October 1. NEW HOUSING AUTHORIZATIONS New housing authorizations are presented on pages B-35 to B-37. It represents increases or decreases in the authorized housing inventory and data on authorized demolitions. The data is derived from construction reports produced by the Dept. of Economic and Community Development (DECD) and refers to residential units only. For further information, see the DECD website at: http://www.ct.gov/ecd/site/default.asp. The median values of owner occupied housing units are presented on pages B-38 and B-39. The information is derived from the 2012-16 American Community Survey of the U.S. Census Bureau. The U.S. Census Bureau provides a detailed explanation on how the data is computed and the elements that make up the data. The web address for the Census Bureau is: http://www.census.gov/. POPULATION The FYE 2012 through 2016 population figures used in this publication are as of July 1 following the end of each fiscal year. For instance, for the fiscal year ended June 30, 2016, the population figures are as of July 1, 2016. The July 1 figures are published annually by the Department of Public Health, as “Estimated Population in Connecticut as of July 1”. POPULATION DENSITY This figure is computed by dividing a municipality’s population by its area in square miles.

A - 3
RATIO OF DEBT TO ENGL This ratio is calculated by dividing the long-term debt as of FYE 2016 by the October 1, 2014 equalized net grand list. RATIO OF DEBT TO NET GRAND LIST This ratio is calculated by dividing the long-term debt as of FYE 2016 by the October 1, 2014 net grand list. REVALUATION DATES The “Date of Last Revaluation” reflects the date that a municipality last implemented, or began the phased-in implementation of, a revaluation of real property as required by the Connecticut General Statutes (CGS). This data is taken from reports filed by the municipality with OPM. The “Date of Next Revaluation” is determined by CSG, section 12-62. SCHOOL ENROLLMENT School enrollment is the average daily membership, which represents pre-K through grade 12 resident students who are the educational and fiscal responsibility of the school district on October 1. This data is published annually by the CT Department of Education. TANF Temporary Assistance for Needy Families (TANF) is a federal program that was established as the successor to Aid to Families with Dependent Children (AFDC). This program represents the basic income assistance program for low-income families with children. The figures presented represent the monthly average number of recipients for the twelve months of the fiscal year; e.g., July 1, 2015, through June 30, 2016. TAX EXEMPT PROPERTY Page B-25 to B-27 of this publication provides information on the amount of tax exempt property in each municipality. The
information is based upon information filed by municipalities with OPM on forms M-13 and M-13a. UNEMPLOYMENT The unemployment figure listed with the individual town data is the calendar year average. The CT Department of Labor publishes the unemployment percentages monthly. TAX COLLECTION RATES The data from the three calculations listed below is derived from a municipality’s Tax Collector’s Report. These calculations do not include revenues derived from interest and lien fees.
CURRENT YEAR COLLECTED AS A % OF CURRENT LEVY This is a measure of the collection rate of taxes levied for the fiscal year. This percentage is calculated by dividing current tax collections by the adjusted tax levy for the fiscal year.
TOTAL COLLECTED AS A % OF CURRENT LEVY This is a measure of the rate of taxes collected on all outstanding grand lists compared to the amount levied for the current fiscal year. This percentage is calculated by dividing current and prior years tax collections by the adjusted tax levy for the current fiscal year.
TOTAL COLLECTED AS A % OF TOTAL OUTSTANDING This is a measure of the rate of taxes collected on all outstanding grand lists compared to the amount of all taxes still outstanding. This percentage is calculated by dividing current and prior years tax collections by the tax outstanding on all grand lists.

A - 4
The data listed below under “Operating Results” is derived from the General Fund of each municipality’s Operating Statement as reported in the audited financial statements. OPERATING RESULTS REVENUES
INTERGOVERNMENTAL REVENUES Intergovernmental revenues include all revenue received by a municipality from federal and state sources. PROPERTY TAX REVENUES Property tax revenues are the total revenues, including interest and lien fees, generated from real and personal property taxes. TOTAL REVENUES Total revenues are the revenues a municipality receives from all sources, as reported in the General Fund.
EXPENDITURES
EDUCATION EXPENDITURES Education expenditures represent amounts expended from the General Fund for education, including payments made to regional school districts.
OPERATING EXPENDITURES Operating expenditures consist of total expenditures less education expenditures. TOTAL EXPENDITURES Total expenditures are all expenditures as reported in the General Fund.
SOURCES AND USES (OTHER FINANCING)
OTHER FINANCING SOURCES (OFS)
An increase in the General Fund’s resources not classified as revenues. GAAP limits the use of this category to certain specified situations. A component of OFS is “transfers in”. Transfers In are interfund transactions received by the General Fund from other funds of the municipality. OTHER FINANCING USES (OFU) A decrease in the General Fund’s resources not classified as expenditures. GAAP limits the use of this category to certain specified situations. A component of OFU is “transfers out”. Transfers Out are interfund transactions received by other funds of the municipality from the General Fund. Further details on other financing sources and uses can be found in a municipality’s financial statements.
SPECIAL/EXTRAORDINARY ITEMS Special items are transactions or other events within the control of management that are either unusual in nature or infrequent in occurrence. Extraordinary items are transactions or other events that are both unusual in nature and infrequent in occurrence.
Special and extraordinary items are required under GAAP to be reported separately from other financing sources and uses and are reflected in this publication as a component of “net change in fund balance”.
NET CHANGE IN FUND BALANCE This is the difference between revenues (including other financing sources) and expenditures (including other financing uses), net of any special and extraordinary items reported by a municipality for the fiscal year.

A - 5
FUND BALANCE FUND BALANCE - TOTAL The total fund balance of the General Fund and its separate components are presented on each individual town page (Section D) of this publication. Fund balance is the excess of fund assets and deferred outflow of resources over fund liabilities and deferred inflow of resources. The data presented is derived from the General Fund of each municipality’s Balance Sheet as reported in its audited financial statements. In accordance with GASB Statement No. 54, municipalities report their General Fund, fund balance in one or more of the following five fund balance components:
NONSPENDABLE FUND BALANCE The portion of fund balance that cannot be spent either because the underlying resources are not in spendable form or because the municipality is legally or contractually required to maintain such resources intact. RESTRICTED FUND BALANCE The portion of fund balance that represents resources subject to externally enforceable constraints. These constraints would include restrictions imposed by parties outside of the municipal government such as creditors, grantors, contributors, and laws or regulations of other governments. The constraint may also result from constitutional provisions or enabling legislation. COMMITTED FUND BALANCE The portion of fund balance that represents resources whose use is subject to a legally binding constraint that is imposed by the municipality itself at its highest level of decision-making authority and that remains legally binding unless removed in the same manner.
ASSIGNED FUND BALANCE The portion of fund balance that represents resources set aside (“earmarked”) by the municipality for a particular purpose. UNASSIGNED FUND BALANCE The difference between total fund balance and its nonspendable, restricted, committed, and assigned components.
POST-EMPLOYMENT BENEFITS
Post-employment benefits are typically provided by municipalities to former employees or their beneficiaries as compensation for services rendered while these employees were still active. These benefits are generally divided into two broad categories – pension benefits (retirement income) and Other Post-employment Benefits (post-employment benefits other than pensions, referenced as OPEB). Forms of OPEB typically include healthcare benefits and benefits such as disability and life insurance provided outside of the pension plan. RETIREMENT AND OPEB PLANS Defined benefit and defined contribution plans are considered the two typical plan funding methods of providing for the income needs of former employees in retirement. Of these two types of retirement plans, defined benefit plans are the most common for municipalities in Connecticut as reflected in the chart on page A-15. However, in recent years there has been a shift away from defined benefit plans and towards defined contribution plans. In a defined contribution pension plan, a municipality and/or its employees contribute a fixed or defined amount of money to an individual employee’s retirement account each year while employed. Upon retirement, the amount of contributions

A - 6
accumulated, along with the investment earnings on such contributions, determine the benefit amount available to the retiree. In a defined benefit plan, employees are promised specific benefits upon their separation or retirement. The retirement plan may state this promised benefit as an exact dollar amount, or more commonly, it may calculate a benefit through a plan formula that considers such factors as salary and service. A key difference between the two types of plans is that a defined benefit plan offers a fixed income during retirement for which the municipality is normally responsible for, whereas a defined contribution plan provides a fixed contribution toward the employee’s retirement plan. The State of Connecticut administers a cost-sharing defined benefit plan, the Connecticut Municipal Employees Retirement System (CMERS), for which a number of municipalities participate in and are required to contribute towards the retirement benefits of their employees. In addition, the State of Connecticut also administers the Connecticut Teachers’ Retirement System (CTRS) which provides retirement benefits to teachers and other certified education staff employed by municipalities and school districts. However, municipalities and school districts are not required to contribute towards the CTRS, as the State of Connecticut makes contributions on behalf of each municipality and school district. Municipalities that offer post-employment benefits other than pensions typically offer these benefits through a defined benefit plan arrangement. For this reason a chart is not presented to indicate the type of plan from which OPEB are provided. FUNDING STATUS DATA FOR DEFINED BENEFIT PLANS The benefits promised by a municipality in a defined benefit plan are typically based on a predetermined benefit formula that takes into account certain factors such as an individual employee’s years of service and salary level. The estimated present value of the benefits promised to employees based on service already rendered is known as the actuarial accrued liability (AAL). The annual required contribution (ARC) is
the amount the municipal employer would be required to contribute to the defined benefit plan for the year, calculated by an actuary in accordance with certain parameters, in order to fund the actuarial accrued liability over time. GASB No. 67 became effective over the past several years, thus eliminating the reporting of the AAL and ARC for pension plans. In its place, municipalities now report each of their defined benefit plan’s Total Pension Liability (TPL) and Annual Determined Contribution (ADC). The TPL is similar to the AAL, but is calculated based upon specific requirements provided in GASB No. 67. The ADC is similar to the ARC but an ADC may not be reported for each pension plan. GASB No. 67 also requires the reporting of the Fiduciary Net Position of each defined benefit pension plan, which represents the net fair market value of pension plan assets that have been set aside in a trust to pay pension benefits. The Net Pension Liability (NPL) is a pension plan’s TPL net of the plan’s fiduciary net position.
Information related to both the AAL and ARC is typically considered important in assessing the financial health of a defined benefit OPEB plan. For retirement plans, although GASB Statement No. 67 focuses more on accounting for pensions, the information presented (TPL, ADC, NPL, etc.) can still provide useful information on the funding status of such defined benefit pension plans for municipalities. The charts beginning on pages A-18 and A-36 provides funding information for defined benefit plans related to pensions and OPEB, respectively. The information was derived from the notes to the financial statements or required supplementary information included in each municipality’s financial audit report. Please note that for municipal employers that participate in the CMERS, funding information for CMERS specific to each participating municipality is not provided in this publication. However, information regarding CMERS as a whole and its participating municipal employers can be found at the web address below. http://www.osc.ct.gov/rbsd/cmers/plandoc/index.html.

A - 7
Unique factors, such as the issuance of pension obligation bonds, contribution methods and requirements provided under State Law that are unique to certain municipalities, or other funding practices regarding a municipality’s defined benefit plan, may affect the funding information reported for a particular plan; such factors may only be apparent through a detailed review of the pension or OPEB plan.

CONNECTICUT TOTALS *
Population (State Dept. of Public Health)
Equalized Net Grand List
Total Revenues
Intergovernmental Revenues
Total Expenditures
Education Expenditures
School Enrollment (State Dept. of Education)
Total Expenditures and Other Financing Uses
Total Revenues and Other Financing Sources
Grand List and Property Tax Data
Property Tax Revenues
Bonded Long-Term Debt
Annual Debt Service
Debt Measures
Equalized Mill Rate
Unemployment (Statewide Annual Average)
TANF Recipients (State Dept. of Social Services)
as a % of Total Population
Per Capita
Net Current Expenditures (State Dept. of Education)
Per Capita
Per Capita
Per Pupil
as a % of Total Revenues (including transfers in)
as a % of Total Revenues (including transfers in)
Operating Expenditures
as a % of Total Expenditures (including transfers out)
as a % of Total Expenditures (including transfers out)
Current Year Adjusted Tax Levy
2012-13Economic Data
Labor Force (Statewide, State Dept. of Labor)
General Fund Revenues
General Fund Expenditures
Per Capita
2015-16
Current Year Property Tax Collection %
2013-14
3,596,677
2014-15
528,428
$8,020,895,470
$15,179
1.0%
$517,172,671,125
$143,792
18.8
$9,733,726,252
$2,70698.4%
$9,769,167,146
70.8%
$3,358,155,104
24.3%
$13,711,324,148
$14,133,530,418
$8,143,380,093
58.6%
$5,349,323,307
38.5%
$13,492,703,400
$14,044,326,360
$8,358,473,968
$2,324
$1,007,715,857
$280
3,590,886
523,185
$8,224,250,311
$15,720
5.7%
1.0%
$532,281,768,560
$148,231
18.8
$10,016,548,067
$2,78998.5%
$10,056,447,602
71.8%
$3,281,546,350
23.4%
$13,924,249,328
$14,461,617,687
$8,199,719,124
58.1%
$5,401,631,504
38.3%
$13,601,350,628
$14,378,449,325
$8,720,990,041
$2,429
$1,043,506,196
$291
3,590,347
538,197
$7,609,734,872
$14,139
1.0%
$517,790,019,666
$144,217
17.8
$9,202,016,372
$2,56398.3%
$9,222,577,320
70.6%
$3,233,235,388
24.8%
$12,990,900,288
$13,393,452,903
$7,695,590,164
59.1%
$4,972,630,066
38.2%
$12,668,220,230
$13,334,756,508
$8,058,935,531
$2,245
$983,018,967
$274
3,596,080
533,198
$7,747,368,704
$14,530
1.0%
$508,639,697,273
$141,443
18.6
$9,465,030,969
$2,63298.4%
$9,501,435,466
71.1%
$3,248,049,255
24.3%
$13,298,061,773
$13,798,801,453
$7,837,878,955
58.9%
$5,052,242,794
38.0%
$12,890,121,749
$13,680,132,964
$8,185,991,435
$2,276
$998,099,760
$278
2011-12
36,26734,458 37,52736,337
8.3%7.8%6.6%
1,868,843 1,887,4241,890,518 1,883,750
3,576,452
517,912
0.9%
$541,141,691,309
$151,307
19.0
$10,270,370,801
$2,872
$10,303,953,462
72.0%
$3,326,921,032
23.2%
$14,247,127,832
$14,796,285,116
58.8%
$5,468,737,908
38.2%
$14,710,848,512
$8,870,695,412
$2,480
$1,108,223,996
$310
5.1%
98.6%
$8,407,383,368
$13,876,121,276
30,611
$8,413,632,746
$16,245
1,891,792
* The totals presented are for the 169 municipalities (not including the City of Groton). A - 8

CONNECTICUT AVERAGES
2015-2016
*
Population Range
Population (State Dept. of Public Health)
School Enrollment (State Dept. of Education)
Unemployment (annual average)
30,000 to 70,000 10,000 to 30,000 Under 10,000
Net Current Expenditures (State Dept. of Education)
Per Pupil
TANF Recipients (FYE Average, State Dept. of Social Serv.)
As a % of Population
Grand List and Property Tax Data
Equalized Net Grand List
Per Capita
Equalized Mill Rate
General Fund Revenues
Property Tax Revenues
as a % of Total Revenues (including transfers in)
Intergovernmental Revenues
as a % of Total Revenues (including transfers in)
Total Revenues
Total Revenues and Other Financing Sources
General Fund Expenditures
Education Expenditures
Total Expenditures
Total Expenditures and Other Financing Uses
Debt Measures
Bonded Long-Term Debt
Per Capita
Annual Debt Service
Per Capita
All Municipalities
4,99418,66047,949110,311 21,162
18.98
$3,202,021,842$11,800,739,883
5.1%4.2%4.5%5.0%6.5%
18010663242,247
0.9%0.2%0.4%0.7%2.0%
$811,168,915$3,203,870,930$7,690,266,480
$151,307$162,435$171,695$160,383$106,977
18.1618.2818.0622.77
$60,970,139$14,834,940$58,942,900$138,887,883$268,898,139
72.0%78.2%76.5%73.4%61.1%
$19,685,923$3,430,115$14,761,903$40,904,350$145,608,394
23.2%18.1%19.2%21.6%33.1%
$84,302,532$18,872,184$76,794,316$187,611,154$438,106,147
$87,551,983$19,479,656$79,689,446$193,152,723$461,466,727
$13,188,678$49,175,868$106,776,311
$18,195,937$75,031,665$183,509,709
$87,046,441$19,254,647$79,087,906$192,494,890$459,666,202
$52,489,322$7,359,435$38,362,347$104,877,539$424,589,721
$2,480$1,474$2,056$2,187$3,849
$6,557,538$869,014$5,228,183$13,850,000$47,755,613
$310$174$280$289$433
Operating Expenditures $204,608,059 $76,733,398 $25,855,797 $5,007,259 $32,359,396
as a % of Total Expenditures (including transfers out) 50.0% 56.6% 63.8% 70.0% 58.8%
as a % of Total Expenditures (including transfers out) 46.6% 40.6% 33.6% 26.6% 38.2%
Current Year Property Tax Collection %
Over 70,000
98.1% 98.5% 98.9% 98.7% 98.6%
Total Population within Range 882,486 1,102,834 1,231,578 359,554 3,576,452
Current Year Adjusted Tax Levy Per Capita
Number of Municipalities 7266238 169
Economic Data
$2,436 $2,897 $3,138 $2,950 $2,872
$219,542,017
$424,150,076
$49,747,831
$82,107,226
3,0656992,8046,66016,166
$49,784,809$12,307,240$45,614,051$104,439,506$264,359,439
$16,245$17,603$16,267$15,682$16,353
A - 9* Averages of the municipalities grouped within each population range (City of Groton is not included)


Area In Square Miles *
Fairfield
BETHEL 16.89BRIDGEPORT 15.97BROOKFIELD 19.77DANBURY 41.89DARIEN 12.66EASTON 27.42FAIRFIELD 29.90GREENWICH 47.62MONROE 26.07NEW CANAAN 22.20NEW FAIRFIELD 20.44NEWTOWN 57.66NORWALK 22.86REDDING 31.50RIDGEFIELD 34.52SHELTON 30.63SHERMAN 21.89STAMFORD 37.64STRATFORD 17.48TRUMBULL 23.32WESTON 19.80WESTPORT 19.96WILTON 26.81
624.89County Area:
Hartford
AVON 23.15BERLIN 26.32BLOOMFIELD 26.09BRISTOL 26.41BURLINGTON 29.74CANTON 24.59EAST GRANBY 17.56EAST HARTFORD 18.00EAST WINDSOR 26.25ENFIELD 33.27FARMINGTON 28.02GLASTONBURY 51.27
GRANBY 40.68HARTFORD 17.38HARTLAND 33.08MANCHESTER 27.40MARLBOROUGH 23.35NEW BRITAIN 13.39NEWINGTON 13.14PLAINVILLE 9.71ROCKY HILL 13.45SIMSBURY 33.92SOUTH WINDSOR 28.06SOUTHINGTON 35.91SUFFIELD 42.26WEST HARTFORD 21.84WETHERSFIELD 12.31WINDSOR 29.50WINDSOR LOCKS 9.02
735.10County Area:
Litchfield
BARKHAMSTED 36.25BETHLEHEM 19.38BRIDGEWATER 16.40CANAAN 32.91COLEBROOK 31.53CORNWALL 46.06GOSHEN 43.63HARWINTON 30.79KENT 48.55LITCHFIELD 56.10MORRIS 17.35NEW HARTFORD 37.04NEW MILFORD 61.57NORFOLK 45.32NORTH CANAAN 19.47PLYMOUTH 21.89ROXBURY 26.30SALISBURY 57.24SHARON 58.77
THOMASTON 11.97TORRINGTON 39.75WARREN 26.31WASHINGTON 38.07WATERTOWN 29.01WINCHESTER 32.51WOODBURY 36.40
920.56County Area:
Middlesex
CHESTER 16.05CLINTON 16.21CROMWELL 12.45DEEP RIVER 13.51DURHAM 23.66EAST HADDAM 54.25EAST HAMPTON 35.65ESSEX 10.40HADDAM 43.94KILLINGWORTH 35.33MIDDLEFIELD 12.65MIDDLETOWN 41.02OLD SAYBROOK 15.04PORTLAND 23.35WESTBROOK 15.78
369.30County Area:
New Haven
ANSONIA 6.02BEACON FALLS 9.67BETHANY 21.13BRANFORD 21.84CHESHIRE 33.07DERBY 5.06EAST HAVEN 12.31GUILFORD 47.12HAMDEN 32.65MADISON 36.15MERIDEN 23.79
MIDDLEBURY 17.75MILFORD 22.18NAUGATUCK 16.31NEW HAVEN 18.68NORTH BRANFORD 24.76NORTH HAVEN 20.84ORANGE 17.18OXFORD 32.74PROSPECT 14.23SEYMOUR 14.52SOUTHBURY 38.99WALLINGFORD 39.04WATERBURY 28.52WEST HAVEN 10.75WOLCOTT 20.44WOODBRIDGE 18.81
604.51County Area:
New London
BOZRAH 19.97COLCHESTER 48.98EAST LYME 34.00FRANKLIN 19.49GRISWOLD 34.71GROTON 31.03LEBANON 54.10LEDYARD 38.22LISBON 16.29LYME 31.84MONTVILLE 41.95NEW LONDON 5.62NORTH STONINGTON 54.25NORWICH 28.06OLD LYME 23.02PRESTON 30.82SALEM 28.92SPRAGUE 13.25STONINGTON 38.66VOLUNTOWN 38.96
WATERFORD 32.77
664.88County Area:
Tolland
ANDOVER 15.45BOLTON 14.41COLUMBIA 21.37COVENTRY 37.57ELLINGTON 34.06HEBRON 36.94MANSFIELD 44.60SOMERS 28.37STAFFORD 58.04TOLLAND 39.63UNION 28.80VERNON 17.70WILLINGTON 33.29
410.21County Area:
Windham
ASHFORD 38.76BROOKLYN 29.09CANTERBURY 39.95CHAPLIN 19.43EASTFORD 28.92HAMPTON 25.09KILLINGLY 48.31PLAINFIELD 42.36POMFRET 40.33PUTNAM 20.30SCOTLAND 18.63STERLING 27.22THOMPSON 46.90WINDHAM 26.97WOODSTOCK 60.65
512.91County Area:
Total Sq. Miles - All Municipalities: 4,842.36
* Municipalities grouped by county. Source: U.S. Census (2010)
A - 11

Bond Ratings as of November, 2017
Standard and Poor's FitchMoody's
ANDOVER AA+
ANSONIA AAAa3
ASHFORD Aa3
AVON AAAAaa
BARKHAMSTED AA
BEACON FALLS AA
BERLIN AA+Aa2
BETHANY Aa2
BETHEL AAA AAA
BETHLEHEM
BLOOMFIELD AA+Aa2
BOLTON Aa3
BOZRAH
BRANFORD AAA
BRIDGEPORT ABaa1 A
BRIDGEWATER
BRISTOL AA+Aa2 AAA
BROOKFIELD AAAAa2
BROOKLYN
BURLINGTON
CANAAN
CANTERBURY
CANTON AAAAa2
CHAPLIN
CHESHIRE AAAAa1 AAA
CHESTER
CLINTON Aa2
COLCHESTER Aa3
COLEBROOK
COLUMBIA Aa2
CORNWALL Aa2
COVENTRY Aa2
CROMWELL AAA
DANBURY AA+Aa1 AAA
DARIEN Aaa
Standard and Poor's FitchMoody's
DEEP RIVER
DERBY
DURHAM
EAST GRANBY Aa2
EAST HADDAM AA+
EAST HAMPTON AAA
EAST HARTFORD Aa3
EAST HAVEN A+A3
EAST LYME Aa2
EAST WINDSOR Aa2
EASTFORD
EASTON AAA
ELLINGTON Aa3
ENFIELD AAAa2
ESSEX AA+Aa2
FAIRFIELD AAAAaa AAA
FARMINGTON Aaa
FRANKLIN
GLASTONBURY AAAAaa
GOSHEN
GRANBY AA+
GREENWICH AAAAaa AAA
GRISWOLD AA
GROTON AA+Aa2 AA
GROTON (City of) AA-Aa3
GUILFORD AAAAa2 AAA
HADDAM AAAAa3
HAMDEN A+Baa2 BBB+
HAMPTON
HARTFORD CCCCaa3
HARTLAND A1
HARWINTON
HEBRON AAA
KENT AA+Aa2
KILLINGLY AAAa3
KILLINGWORTH
Standard and Poor's FitchMoody's
LEBANON
LEDYARD AAAa2
LISBON Aa3
LITCHFIELD Aa2
LYME
MADISON Aaa AAA
MANCHESTER AA+Aa1 AAA
MANSFIELD Aa2
MARLBOROUGH Aa2
MERIDEN AA AA-
MIDDLEBURY Aa2
MIDDLEFIELD
MIDDLETOWN AAAAa2
MILFORD AA+Aa1 AAA
MONROE Aa2
MONTVILLE Aa3
MORRIS
NAUGATUCK AAAa3 AA
NEW BRITAIN A+Baa2 A-
NEW CANAAN Aaa
NEW FAIRFIELD AAAAa1
NEW HARTFORD AAAa3
NEW HAVEN A-Baa1 A-
NEW LONDON A+ A+
NEW MILFORD AA+Aa1
NEWINGTON AA+
NEWTOWN AAAAa1
NORFOLK
NORTH BRANFORD Aa2
NORTH CANAAN
NORTH HAVEN AAAAa1
NORTH STONINGTON
NORWALK AAAAaa AAA
NORWICH AAAa2 AA
OLD LYME
OLD SAYBROOK Aa2
A - 12

Bond Ratings as of November, 2017
Standard and Poor's FitchMoody's
ORANGE AAAAa1
OXFORD Aa2
PLAINFIELD Aa3
PLAINVILLE AA+Aa3
PLYMOUTH A+
POMFRET
PORTLAND Aa3
PRESTON AA+
PROSPECT
PUTNAM AA
REDDING AAAAa1
RIDGEFIELD AAAAaa AAA
ROCKY HILL AA+
ROXBURY
SALEM A1
SALISBURY
SCOTLAND A2
SEYMOUR AA+
SHARON Aa2
SHELTON AA+Aa2
SHERMAN Aa2
SIMSBURY AAAAaa
SOMERS Aa2
SOUTH WINDSOR AA+Aa2
SOUTHBURY Aa2
SOUTHINGTON AA+
SPRAGUE Baa1
STAFFORD A1
STAMFORD AAAAa1 AAA
STERLING A1
STONINGTON AA+Aa1
STRATFORD AAA1
SUFFIELD AA+
THOMASTON AAAa3
THOMPSON A1
TOLLAND AAA AAA
Standard and Poor's FitchMoody's
TORRINGTON AA-Aa3
TRUMBULL AA+Aa2 AA+
UNION
VERNON Aa2
VOLUNTOWN
WALLINGFORD AA+Aaa
WARREN Aa2
WASHINGTON
WATERBURY AA-A1 AA-
WATERFORD AAAa2
WATERTOWN AA+Aa2
WEST HARTFORD AAAAaa
WEST HAVEN BBBBaa3
WESTBROOK Aa2
WESTON Aaa
WESTPORT Aaa
WETHERSFIELD AA+Aa2
WILLINGTON Aa3
WILTON Aaa
WINCHESTER
WINDHAM AAAa3
WINDSOR AAA
WINDSOR LOCKS AA+Aa1
WOLCOTT AAA1
WOODBRIDGE Aaa
WOODBURY Aa2
WOODSTOCK Aa3
Regional S.D.1
Regional S.D.4 Aa3
Regional S.D.5 Aa1 AA+
Regional S.D.6 Aa3
Regional S.D.7
Regional S.D.8 AA+Aa3
Regional S.D.9 AAA
Regional S.D.10 AAAa2
Regional S.D.11
Standard and Poor's FitchMoody's
Regional S.D.12
Regional S.D.13 Aa3
Regional S.D.14
Regional S.D.15 Aa2
Regional S.D.16 AA-
Regional S.D.17 Aa3
Regional S.D.18 Aa2
Regional S.D.19 Aa3
INVESTMENT
GRADE Moody's
Aaa
Aa1
A1
Baa1
AAA
AA+
A
BBB
Aa2 Aa3
A+A2 A3
Baa2 Baa3
AA AA-
A-
BBB+ BBB-
Best
High
Upper Medium
Lower Medium
S & P / Fitch
Lower Medium
RATINGS DESCRIPTION*
* The above table provides a general description of the rating scales for each rating agency. A more specific and detailed description can be found on each of the rating agency's website. Ratings for Hamden, Hartford, Plymouth and Scotland were updated in December 2017.
NON-INVESTMENT
GRADE
Speculative
Highly Speculative
Ba / B BB / B
Caa / Ca / C CCC / CC / C
A - 13

-------------------- SELECTMAN - TOWN MEETING -------------------- COUNCIL - MANAGER MAYOR - COUNCIL OTHER
Form of Government
AVON
BERLIN
BLOOMFIELD
CHESHIRE
COVENTRY
CROMWELL
EAST HAMPTON
ENFIELD
FARMINGTON
GLASTONBURY
GROTON
KILLINGLY
MANSFIELD
MERIDEN
NEWINGTON
NORTH BRANFORD
NORWICH (4)
PLAINVILLE
ROCKY HILL
SOUTH WINDSOR
SOUTHINGTON
TOLLAND
WATERTOWN
WEST HARTFORD
WETHERSFIELD
WINCHESTER
WINDHAM
WINDSOR
ANDOVER (4) ASHFORD BARKHAMSTED
BEACON FALLS BETHANY BETHEL
BETHLEHEM BOLTON BOZRAH
BRIDGEWATER (4) BROOKFIELD BROOKLYN
BURLINGTON CANAAN CANTERBURY
CANTON CHAPLIN CHESTER
CLINTON COLCHESTER COLEBROOK
COLUMBIA (4) CORNWALL DEEP RIVER
DURHAM (4) EAST GRANBY EAST HADDAM
EAST LYME EAST WINDSOR (4) EASTFORD
EASTON ELLINGTON ESSEX
FRANKLIN GOSHEN GRANBY
GRISWOLD GUILFORD HADDAM
HAMPTON HARTLAND HARWINTON
HEBRON (4) KENT KILLINGWORTH
LEBANON LISBON LITCHFIELD
LYME MADISON MARLBOROUGH (4)
MIDDLEBURY MIDDLEFIELD MONROE
MORRIS NEW FAIRFIELD NEW HARTFORD
NEWTOWN NORFOLK NORTH CANAAN
NORTH HAVEN NORTH STONINGTON OLD LYME
OLD SAYBROOK ORANGE OXFORD
PLAINFIELD POMFRET PORTLAND
PRESTON PUTNAM REDDING
RIDGEFIELD (4) ROXBURY (4) SALEM
SALISBURY SCOTLAND SEYMOUR
SHARON SHERMAN SIMSBURY
SOMERS SOUTHBURY SPRAGUE
STAFFORD STERLING (4) STONINGTON
SUFFIELD THOMASTON THOMPSON
UNION VOLUNTOWN WARREN
WASHINGTON WESTBROOK WESTON
WILLINGTON WILTON WINDSOR LOCKS
WOODBRIDGE WOODBURY WOODSTOCK
ANSONIA
BRIDGEPORT (4)
BRISTOL
DANBURY
DERBY
EAST HARTFORD
EAST HAVEN
HAMDEN
HARTFORD (4)
LEDYARD (4)
MIDDLETOWN
MILFORD
MONTVILLE (4)
NAUGATUCK
NEW BRITAIN
NEW HAVEN
NEW LONDON
NEW MILFORD
NORWALK
PLYMOUTH
PROSPECT
SHELTON
STRATFORD (4)
TORRINGTON
VERNON
WALLINGFORD
WATERBURY
WEST HAVEN
WOLCOTT
MANCHESTER G.M.-BD. of DIRS.
STAMFORD (4) MAYOR-REPS.
NEW CANAAN SEL.-CNCL.
TRUMBULL SEL.-CNCL.
BRANFORD SEL.-RTM.
DARIEN SEL.-RTM.
FAIRFIELD (4) SEL.-RTM.
GREENWICH SEL.-RTM.
WATERFORD SEL.-RTM.
WESTPORT (4) SEL.-RTM.
G.M.- BD. of DIRS. = General Manager - Board of Directors
SEL.-CNCL. = Selectmen - Council; SEL.-RTM. = Selectmen - Representative Town MeetingMAYOR-REPS. = Mayor - Board of Representatives; MAYOR-TN. MTG. = Mayor - Town Meeting
A - 14
Note: (4) represents those municipalities whose Chief Elected Official (CEO) is elected on a 4 year cycle. All other municipalities have a 2 year CEO election cycle.

A - 15 DB = Defined Benefit, DC = Defined Contribution
0
50
100
150
200
250
FY 2011‐12 FY 2012‐13 FY 2013‐14 FY 2014‐15 FY 2015‐16
Number of Defined Benefit and Defined Contribution Plans for CT Municipalities
# of Single‐Employer DB Plans
# of DC Plans
# of Closed Single‐Employer DB Plans

PENSIONS: Type and Number of Plans *
DefinedBenefit
DefinedContribution
Cost Sharing (CMERS)*
ANDOVER 1
ANSONIA 2 1
ASHFORD 1
AVON 2 2
BARKHAMSTED 1
BEACON FALLS 1
BERLIN 1 2
BETHANY 1 2 1
BETHEL 2 1
BETHLEHEM 1 1
BLOOMFIELD 2
BOLTON 1
BOZRAH 1
BRANFORD 2 1 1
BRIDGEPORT 4 1
BRIDGEWATER 1
BRISTOL 3
BROOKFIELD 1
BROOKLYN 2
BURLINGTON 2
CANAAN 2
CANTERBURY 1
CANTON 2 2
CHAPLIN
CHESHIRE 3 2
CHESTER 2
CLINTON 2 1
COLCHESTER 1 1
DefinedBenefit
DefinedContribution
Cost Sharing (CMERS)*
COLEBROOK 1
COLUMBIA 1
CORNWALL 1
COVENTRY 1
CROMWELL 1 1
DANBURY 7 1
DARIEN 2
DEEP RIVER 2 1
DERBY 1 1
DURHAM 1
EAST GRANBY 2
EAST HADDAM 1 2 1
EAST HAMPTON 1 1
EAST HARTFORD 1 1
EAST HAVEN 1
EAST LYME 1 1
EAST WINDSOR 1
EASTFORD 1
EASTON 1 1
ELLINGTON 1 1
ENFIELD 2
ESSEX 3
FAIRFIELD 2 1
FARMINGTON 1
FRANKLIN
GLASTONBURY 1 1
GOSHEN 1 1
GRANBY 1
GREENWICH 1 1
DefinedBenefit
DefinedContribution
Cost Sharing (CMERS)*
GRISWOLD 1
GROTON 1
GROTON (City of) 1
GUILFORD 3
HADDAM 2
HAMDEN 1 1
HAMPTON 1
HARTFORD 2 1
HARTLAND 1
HARWINTON 1
HEBRON 1
KENT 1
KILLINGLY 1
KILLINGWORTH 2
LEBANON 1
LEDYARD 1 1
LISBON 1
LITCHFIELD 2 1
LYME 2
MADISON 3 1
MANCHESTER 1 1 1
MANSFIELD 1
MARLBOROUGH
MERIDEN 3 1
MIDDLEBURY 1 1
MIDDLEFIELD 1
MIDDLETOWN 1
MILFORD 1
MONROE 1 1
* Based on pension data provided in the June 30, 2016 financial audit reports of municipalities.
A - 16
* If the municipality participates in the CT Municipal Employees Retirement System, a "1" figure is denoted.

PENSIONS: Type and Number of Plans *
DefinedBenefit
DefinedContribution
Cost Sharing (CMERS)*
MONTVILLE 1
MORRIS 2
NAUGATUCK 2 4
NEW BRITAIN 3 1
NEW CANAAN 1 1
NEW FAIRFIELD 2 1
NEW HARTFORD 1 1
NEW HAVEN 2
NEW LONDON 2 1 1
NEW MILFORD 1
NEWINGTON 4 1
NEWTOWN 1 2
NORFOLK 1 1
NORTH BRANFORD 3 1
NORTH CANAAN
NORTH HAVEN 5 1
NORTH STONINGTON 3
NORWALK 4 1
NORWICH 2
OLD LYME 2
OLD SAYBROOK 2
ORANGE 2 1
OXFORD 1
PLAINFIELD 1
PLAINVILLE 2 1
PLYMOUTH 2 1
POMFRET 1
PORTLAND 2 1
PRESTON 1
DefinedBenefit
DefinedContribution
Cost Sharing (CMERS)*
PROSPECT 1 1
PUTNAM 1
REDDING 1
RIDGEFIELD 3 1
ROCKY HILL 4 1
ROXBURY 2
SALEM
SALISBURY 1 1
SCOTLAND
SEYMOUR 1
SHARON 1
SHELTON 1 1
SHERMAN 1 1
SIMSBURY 3
SOMERS 3
SOUTH WINDSOR 2 1
SOUTHBURY 1 1
SOUTHINGTON 1
SPRAGUE
STAFFORD 1 2
STAMFORD 4
STERLING 1
STONINGTON 1 1
STRATFORD 1 1
SUFFIELD 1
THOMASTON 1
THOMPSON 1 1
TOLLAND 1
TORRINGTON 2 1
DefinedBenefit
DefinedContribution
Cost Sharing (CMERS)*
TRUMBULL 2
UNION
VERNON 3
VOLUNTOWN 1
WALLINGFORD 2
WARREN 1 1
WASHINGTON 1 1
WATERBURY 1
WATERFORD 1 1
WATERTOWN 2 1
WEST HARTFORD 1
WEST HAVEN 2 1
WESTBROOK 3
WESTON 1
WESTPORT 5 2
WETHERSFIELD 1
WILLINGTON 1
WILTON 1 1
WINCHESTER 1 1
WINDHAM 4
WINDSOR 1 1
WINDSOR LOCKS 1
WOLCOTT 2 1
WOODBRIDGE 1
WOODBURY 1
WOODSTOCK 1
** Total ** 210 96 48
* Based on pension data provided in the June 30, 2016 financial audit reports of municipalities.
A - 17
* If the municipality participates in the CT Municipal Employees Retirement System, a "1" figure is denoted.

Sponsoring
Entity T O
Total
Pension
Liability
(TPL)
FYE 2016
Plan
Fiduciary
Net Position
As a % of
TPLPlan Name
Group(s) CoveredDate of
Last
Valuation# of
Members
Pension Funding Information For Defined Benefit Pension Plans of Connecticut Municipalities
**
PSAll
Contributions Made as a %
of ADC
FY 2015-16
Municipal
Actuarially
Determined
Contribution
(ADC)
Closed
Plan *
ANSONIA
City Employees' Retirement Plan 7/1/201561 $4,731,927 35.7%X $327,571 109.0%
Police Retirement Plan X 7/1/201523 $4,589,521 21.2% $315,777 100.0%
AVON
Retirement Plan for Town Employees 7/1/201596 $41,442,083 39.5%X $2,718,922 100.0%
Retirement Plan For Board of Education of Town of Avon
X 7/1/2015192 $10,384,367 77.7% $504,392 100.8%
BERLIN
Town of Berlin Defined Benefit Plan 7/1/201547 $6,055,118 6.0%X $918,862 76.2%
BETHEL
Town of Bethel Town Retirement Plan 7/1/2015243 $31,810,462 85.4%X $2,013,334 136.7%
Town of Bethel Police Retirement Plan X 7/1/201549 $15,450,508 59.4% $612,450 83.8%
BLOOMFIELD
The Town of Bloomfield Retirement Income Plan
1/1/2015391 $60,448,194 70.1%X $2,571,995 100.0%
The Town of Bloomfield Police Retirement Income Plan
X 1/1/201587 $42,917,279 59.6% $2,051,665 100.0%
BRANFORD
Branford Police Employees Retirement Plan X 7/1/201584 $29,788,646 71.8% $897,106 101.5%
A - 18
Note: For municipalities with multiple defined benefit plans, the data is sorted by TPL (highest to lowest).
** All = All Eligible, T = Town Employees, PS = Public Safety (Police or Fire, etc.), O = Other (Other specified groups not listed above) See Page A-35 for plans denoted with "***" N/A = Not Applicable
* A checkmark for "closed plan" indicate that the pension plan is closed and does not accept new entrants.

Sponsoring
Entity T O
Total
Pension
Liability
(TPL)
FYE 2016
Plan
Fiduciary
Net Position
As a % of
TPLPlan Name
Group(s) CoveredDate of
Last
Valuation# of
Members
Pension Funding Information For Defined Benefit Pension Plans of Connecticut Municipalities
**
PSAll
Contributions Made as a %
of ADC
FY 2015-16
Municipal
Actuarially
Determined
Contribution
(ADC)
Closed
Plan *
BRIDGEPORT
Public Safety Plan A X 6/30/2016711 $327,252,219 23.4%*** $15,488,000 100.0%
Police Retirement Plan B - post 6/3/81 employees
X 6/30/2016134 $120,239,065 47.0% $2,002,000 0.0%
Firefighters' Retirement Plan B - post 12/31/83 employees
X 6/30/201678 $45,528,031 78.4% $310,000 0.0%
Janitors And Engineers Retirement Fund X 6/30/201630 $9,365,998 0.0% $818,000 97.3%
BRISTOL
City of Bristol Retirement System X X 7/1/20151,308 $204,245,167 95.4% $352,543 12.5%
City of Bristol Police Benefit Fund X 7/1/2015244 $115,955,470 163.3% $0 N/A
City of Bristol Firefighter's Benefit Fund X 7/1/2015183 $71,680,982 246.6% $0 N/A
BROOKFIELD
Town of Brookfield Pension Plan 1/1/2015263 $48,406,938 89.6%X $1,224,455 74.8%
BROOKLYN
Retirement Plan For Town of Brooklyn 6/30/2015112 $5,595,645 72.7%X $295,082 100.0%
BURLINGTON
Town of Burlington Employees Pension Plan 7/1/201525 $2,507,166 77.5%X $202,326 93.4%
Town of Burlington Constables Plan X 7/1/20155 $734,312 86.0% $66,575 91.9%
CANTON
Town of Canton Employee Retirement Plan 1/1/2016126 $22,448,055 66.2%X $1,056,295 100.0%
A - 19
Note: For municipalities with multiple defined benefit plans, the data is sorted by TPL (highest to lowest).
** All = All Eligible, T = Town Employees, PS = Public Safety (Police or Fire, etc.), O = Other (Other specified groups not listed above) See Page A-35 for plans denoted with "***" N/A = Not Applicable
* A checkmark for "closed plan" indicate that the pension plan is closed and does not accept new entrants.

Sponsoring
Entity T O
Total
Pension
Liability
(TPL)
FYE 2016
Plan
Fiduciary
Net Position
As a % of
TPLPlan Name
Group(s) CoveredDate of
Last
Valuation# of
Members
Pension Funding Information For Defined Benefit Pension Plans of Connecticut Municipalities
**
PSAll
Contributions Made as a %
of ADC
FY 2015-16
Municipal
Actuarially
Determined
Contribution
(ADC)
Closed
Plan *
CHESHIRE
Town of Cheshire Pension Plan 7/1/2014520 $55,935,983 70.6%X $1,821,202 100.0%
Town of Cheshire Pension Plan For Police Personnel
X 7/1/201486 $43,270,938 55.8% $1,342,563 85.9%
CHESTER
Town of Chester Employee Retirement Plan 1/1/201628 $2,199,424 66.5%X $161,804 100.0%
CLINTON
Police Employees' Retirement Plan X 6/30/201544 $19,450,802 58.7% $904,253 100.0%
Board of Education Noncertified Personnel Pension Plan
X 6/30/2016117 $7,046,749 69.4% $348,370 100.0%
COLCHESTER
Town of Colchester Police Pension Plan X 7/1/201410 $2,187,320 75.7% $119,514 88.5%
COVENTRY
Retirement Plan For Employees of The Town of Coventry
7/1/2015181 $16,309,584 79.1%X $565,362 100.0%
CROMWELL
Town of Cromwell Pension Plan 7/1/2014276 $24,699,381 84.1%X $688,375 100.0%
A - 20
Note: For municipalities with multiple defined benefit plans, the data is sorted by TPL (highest to lowest).
** All = All Eligible, T = Town Employees, PS = Public Safety (Police or Fire, etc.), O = Other (Other specified groups not listed above) See Page A-35 for plans denoted with "***" N/A = Not Applicable
* A checkmark for "closed plan" indicate that the pension plan is closed and does not accept new entrants.

Sponsoring
Entity T O
Total
Pension
Liability
(TPL)
FYE 2016
Plan
Fiduciary
Net Position
As a % of
TPLPlan Name
Group(s) CoveredDate of
Last
Valuation# of
Members
Pension Funding Information For Defined Benefit Pension Plans of Connecticut Municipalities
**
PSAll
Contributions Made as a %
of ADC
FY 2015-16
Municipal
Actuarially
Determined
Contribution
(ADC)
Closed
Plan *
DANBURY
General Employees' Pension Plan 7/1/20151,187 $147,793,970 66.8%X $3,846,000 100.0%
Post 1967 Fire Pension Plan X 7/1/2014193 $92,085,519 72.1% $2,473,000 134.5%
Post 1967 Police Pension Plan X 7/1/201499 $57,667,341 71.3% $841,000 137.0%
Post 1983 Police Pension Plan X 7/1/2014167 $50,136,766 59.7% $2,417,000 98.7%
Pre 1967 Police Pension Plan X 7/1/201326 $7,189,465 27.8% $655,000 100.0%
Pre 1967 Fire Pension Plan X 7/1/201519 $6,121,256 38.7% $415,000 100.0%
Post 2011 Fire Pension Plan X 7/1/201414 $258,632 94.6% $42,000 153.5%
DARIEN
Town of Darien Town Pension Fund 7/1/2016569 $65,567,886 103.3%X $1,628,802 100.0%
Town of Darien Police Pension Fund X 7/1/2016105 $42,468,356 108.9% $588,454 100.0%
DEEP RIVER
Town of Deep River Employee's Retirement Plan
7/1/201534 $3,558,248 61.1%X $239,778 123.9%
DERBY
City of Derby Public Employee Retirement System
7/1/2015186 $19,006,164 68.5%X $849,200 67.4%
DURHAM
Retirement Plan For Employees of The Town of Durham
7/1/201546 $3,709,395 68.2%X $202,591 100.0%
EAST HAMPTON
East Hampton Employees' Retirement Plan 7/1/2015369 $37,581,271 72.2%X $957,490 100.3%
A - 21
Note: For municipalities with multiple defined benefit plans, the data is sorted by TPL (highest to lowest).
** All = All Eligible, T = Town Employees, PS = Public Safety (Police or Fire, etc.), O = Other (Other specified groups not listed above) See Page A-35 for plans denoted with "***" N/A = Not Applicable
* A checkmark for "closed plan" indicate that the pension plan is closed and does not accept new entrants.

Sponsoring
Entity T O
Total
Pension
Liability
(TPL)
FYE 2016
Plan
Fiduciary
Net Position
As a % of
TPLPlan Name
Group(s) CoveredDate of
Last
Valuation# of
Members
Pension Funding Information For Defined Benefit Pension Plans of Connecticut Municipalities
**
PSAll
Contributions Made as a %
of ADC
FY 2015-16
Municipal
Actuarially
Determined
Contribution
(ADC)
Closed
Plan *
EAST HARTFORD
East Hartford Employees' Retirement Plan 7/1/20151,278 $389,116,000 53.5%X $11,879,000 99.8%
EAST LYME
Employee Pension Plan Ga-1006 1/1/2016252 $24,382,345 73.0%X $926,720 101.3%
EAST WINDSOR
Town of East Windsor Pension Plan 7/1/2015237 $27,191,862 79.8%X $862,350 105.8%
EASTON
Town of Easton Retirement Plans I and II X X 7/1/2015177 $19,371,008 83.4% $409,886 103.4%
ENFIELD
Town of Enfield Pension Plan Gr-1663 7/1/2015962 $70,685,000 89.5%X $2,099,000 100.0%
Town of Enfield Police Department Pension Plan - Gr2299
X 7/1/2015170 $65,584,000 83.2% $1,966,000 100.0%
ESSEX
Town of Essex Employees' Retirement Plan 7/1/201471 $4,251,302 68.7%X $230,516 100.5%
Town of Essex Police Retirement Plan X 7/1/20147 $1,624,326 39.1% $123,060 100.0%
FAIRFIELD
Town of Fairfield Town Employees Retirement Plan
X X 7/1/20151,127 $203,788,000 87.8% $4,056,000 100.0%
Town of Fairfield Police and Fire Retirement Plan
X 7/1/2015416 $191,231,000 87.0% $3,341,000 100.0%
FARMINGTON
Town of Farmington Retirement Income Plan 7/1/2015655 $111,372,098 70.3%X $3,040,676 102.3%
A - 22
Note: For municipalities with multiple defined benefit plans, the data is sorted by TPL (highest to lowest).
** All = All Eligible, T = Town Employees, PS = Public Safety (Police or Fire, etc.), O = Other (Other specified groups not listed above) See Page A-35 for plans denoted with "***" N/A = Not Applicable
* A checkmark for "closed plan" indicate that the pension plan is closed and does not accept new entrants.

Sponsoring
Entity T O
Total
Pension
Liability
(TPL)
FYE 2016
Plan
Fiduciary
Net Position
As a % of
TPLPlan Name
Group(s) CoveredDate of
Last
Valuation# of
Members
Pension Funding Information For Defined Benefit Pension Plans of Connecticut Municipalities
**
PSAll
Contributions Made as a %
of ADC
FY 2015-16
Municipal
Actuarially
Determined
Contribution
(ADC)
Closed
Plan *
GLASTONBURY
Town of Glastonbury Pension Plan 7/1/2015846 $175,930,957 68.5%X $6,118,624 100.0%
GOSHEN
Town of Goshen Pension Plan 7/1/20154 $95,101 0.0%X $11,510 101.5%
GRANBY
Town of Granby Pension Plan 7/1/2015116 $18,869,539 78.9%X $470,130 100.0%
GREENWICH
Retirement System of The Town of Greenwich 7/1/20152,311 $548,971,246 70.2%X $21,610,634 100.0%
GROTON
Town of Groton - Retirement System 7/1/2015619 $117,313,592 82.7%X $2,553,991 100.0%
GROTON (CITY OF)
City of Groton Retirement Plan 7/1/2014335 $80,049,431 92.2%X $1,054,700 115.1%
GUILFORD
Town of Guilford Employees Pension Plan 7/1/2015148 $24,790,058 84.6%X $1,014,989 94.3%
Town of Guilford Police Retirement Fund X 7/1/201574 $24,712,984 87.0% $437,809 179.4%
Town of Guilford Public School Employees (Non-Certified) Pension Plan
X 7/1/2015211 $14,918,709 81.1% $758,694 50.7%
HADDAM
Town of Haddam Employee Pension Plan 1/1/201647 $5,307,228 81.1%X $255,222 100.5%
A - 23
Note: For municipalities with multiple defined benefit plans, the data is sorted by TPL (highest to lowest).
** All = All Eligible, T = Town Employees, PS = Public Safety (Police or Fire, etc.), O = Other (Other specified groups not listed above) See Page A-35 for plans denoted with "***" N/A = Not Applicable
* A checkmark for "closed plan" indicate that the pension plan is closed and does not accept new entrants.

Sponsoring
Entity T O
Total
Pension
Liability
(TPL)
FYE 2016
Plan
Fiduciary
Net Position
As a % of
TPLPlan Name
Group(s) CoveredDate of
Last
Valuation# of
Members
Pension Funding Information For Defined Benefit Pension Plans of Connecticut Municipalities
**
PSAll
Contributions Made as a %
of ADC
FY 2015-16
Municipal
Actuarially
Determined
Contribution
(ADC)
Closed
Plan *
HAMDEN
Retirement Plan of The Town of Hamden 7/1/20151,154 $441,521,657 35.1%X*** $21,998,113 55.0%
HARTFORD
City MERF 7/1/20155,509 $1,389,617,000 71.9%X $43,891,000 100.0%
RAF/PBF/FRF pre 5/1/1947 PLAN 7/1/201487 $4,851,000 0.0%X $659,000 100.0%
HARWINTON
Town of Harwinton Pension Trust 7/1/201521 $3,082,456 93.8%X $106,829 187.2%
KILLINGLY
Town of Killingly Retirement Income Plan 7/1/2015157 $5,580,114 101.1%X $122,206 100.0%
KILLINGWORTH
Town of Killingworth Defined Benefit Plan 7/1/201322 $2,648,163 78.9%X
LEDYARD
Town of Ledyard Pension Plan 7/1/2015216 $26,296,131 75.2%X $1,026,595 108.1%
LITCHFIELD
Town of Litchfield Municipal Employees Retirement Plan
7/1/2014177 $16,343,434 73.4%X $669,000 101.9%
MADISON
Retirement Plan For The Employees of The Town of Madison
7/1/2015350 $23,004,078 72.1%X $890,486 100.0%
Town of Madison Police Department Retirement Plan
X 7/1/201571 $18,227,172 68.8% $514,887 102.2%
A - 24
Note: For municipalities with multiple defined benefit plans, the data is sorted by TPL (highest to lowest).
** All = All Eligible, T = Town Employees, PS = Public Safety (Police or Fire, etc.), O = Other (Other specified groups not listed above) See Page A-35 for plans denoted with "***" N/A = Not Applicable
* A checkmark for "closed plan" indicate that the pension plan is closed and does not accept new entrants.

Sponsoring
Entity T O
Total
Pension
Liability
(TPL)
FYE 2016
Plan
Fiduciary
Net Position
As a % of
TPLPlan Name
Group(s) CoveredDate of
Last
Valuation# of
Members
Pension Funding Information For Defined Benefit Pension Plans of Connecticut Municipalities
**
PSAll
Contributions Made as a %
of ADC
FY 2015-16
Municipal
Actuarially
Determined
Contribution
(ADC)
Closed
Plan *
MANCHESTER
Town of Manchester Retirement Plan 7/1/20151,380 $213,095,000 70.5%X $5,244,000 100.0%
MERIDEN
Meriden Employees' Retirement Plan 6/30/20161,150 $182,654,326 72.2%X $3,218,884 101.4%
Meriden Police Pension Plan X 6/30/2016194 $113,372,222 49.8% $4,441,422 100.0%
Meriden Firemen's Pension Plan X 6/30/2016171 $86,688,597 51.5% $3,040,690 100.0%
MIDDLEBURY
Town of Middlebury Retirement Plan 7/1/201593 $20,021,277 72.9%X $512,913 100.0%
MIDDLETOWN
City of Middletown Retirement System 7/1/20151,024 $339,922,000 107.8%X $2,630,000 100.0%
MILFORD
City of Milford Retirement System 7/1/20151,487 $390,270,000 80.7%X $6,348,000 71.3%
MONROE
Town of Monroe Retirement Income Plan 7/1/2014300 $25,611,640 80.1%X $758,944 98.9%
MORRIS
Town of Morris Pension Plan 7/1/201413 $1,465,181 64.9%X $37,317 130.7%
NAUGATUCK
The Borough of Naugatuck Employee Pension Plan
7/1/2014835 $133,517,267 70.6%X*** $4,524,800 92.3%
The Borough of Naugatuck Fire Plan X 7/1/201473 $39,110,807 83.8%*** $1,016,600 100.7%
A - 25
Note: For municipalities with multiple defined benefit plans, the data is sorted by TPL (highest to lowest).
** All = All Eligible, T = Town Employees, PS = Public Safety (Police or Fire, etc.), O = Other (Other specified groups not listed above) See Page A-35 for plans denoted with "***" N/A = Not Applicable
* A checkmark for "closed plan" indicate that the pension plan is closed and does not accept new entrants.

Sponsoring
Entity T O
Total
Pension
Liability
(TPL)
FYE 2016
Plan
Fiduciary
Net Position
As a % of
TPLPlan Name
Group(s) CoveredDate of
Last
Valuation# of
Members
Pension Funding Information For Defined Benefit Pension Plans of Connecticut Municipalities
**
PSAll
Contributions Made as a %
of ADC
FY 2015-16
Municipal
Actuarially
Determined
Contribution
(ADC)
Closed
Plan *
NEW BRITAIN
New Britain Firemen's Pension Fund X 7/1/2014221 $99,070,000 74.3%X*** $1,459,000 60.9%
New Britain Policemen's Pension Fund X 7/1/2014256 $86,496,000 72.7%*** $1,413,000 96.2%
NEW CANAAN
Town of New Canaan Retirement Plan 7/1/2014818 $118,741,550 104.8%X $781,558 100.0%
NEW FAIRFIELD
Town of New Fairfield Town Employees Retirement Plan
7/1/201488 $8,284,809 85.4%X $302,287 100.0%
New Fairfield Board of Education Retirement Income Plan
X 7/1/2014178 $7,119,330 98.8% $293,885 100.0%
NEW HARTFORD
Town of New Hartford Pension Plan 7/1/201598 $4,705,584 64.8%X $257,906 102.2%
NEW HAVEN
Pension Fund For New Haven Policemen And Firemen
X 7/1/20141,916 $701,102,039 43.2% $26,297,294 100.0%
City Employees' Retirement Fund of New Haven
X X 7/1/20142,090 $459,456,387 33.4% $19,514,619 100.2%
NEW LONDON
City of New London Contributory Pension Program
7/1/2014369 $47,366,176 65.1%X $903,000 58.2%
City of New London Noncontributory Pension Program
7/1/201438 $7,285,337 0.0%X $819,000 87.5%
NEW MILFORD
Town of New Milford Pension Plan 7/1/2014692 $69,030,772 73.1%X $2,303,221 101.0%
A - 26
Note: For municipalities with multiple defined benefit plans, the data is sorted by TPL (highest to lowest).
** All = All Eligible, T = Town Employees, PS = Public Safety (Police or Fire, etc.), O = Other (Other specified groups not listed above) See Page A-35 for plans denoted with "***" N/A = Not Applicable
* A checkmark for "closed plan" indicate that the pension plan is closed and does not accept new entrants.

Sponsoring
Entity T O
Total
Pension
Liability
(TPL)
FYE 2016
Plan
Fiduciary
Net Position
As a % of
TPLPlan Name
Group(s) CoveredDate of
Last
Valuation# of
Members
Pension Funding Information For Defined Benefit Pension Plans of Connecticut Municipalities
**
PSAll
Contributions Made as a %
of ADC
FY 2015-16
Municipal
Actuarially
Determined
Contribution
(ADC)
Closed
Plan *
NEWINGTON
Town of Newington Police Officers' Pension Plan
X 7/1/2015126 $61,189,000 58.3% $3,338,000 100.0%
Town of Newington Municipal Employees' Pension Plan
7/1/2015300 $44,032,000 49.2%X $1,623,000 100.0%
Town of Newington Administrative Employees' Pension Plan
7/1/201543 $11,766,000 44.3%X $449,000 100.0%
NEWTOWN
Town of Newtown Retirement System 6/30/2016543 $48,064,172 72.0%X $1,422,737 100.0%
NORFOLK
Town of Norfolk Pension Plan 7/1/201530 $1,460,698 131.4%X $11,857 1478.9%
NORTH BRANFORD
Retirement Plan For Employees of The Town of North Branford - Police
X 7/1/201536 $11,743,061 53.4% $788,048 100.0%
Retirement Plan For Employees of The Town of North Branford - Municipal Employees
7/1/201593 $9,126,496 50.2%X $318,927 100.0%
NORTH HAVEN
Pension Plan For General Employees of The Town of North Haven
X X 7/1/2015376 $67,417,464 73.4% $2,521,308 91.3%
Town of North Haven Police Department Pension Plan
X 7/1/201492 $35,269,042 63.5% $1,470,085 91.5%
Town of North Haven Firefighters' Pension Plan
X 7/1/201457 $22,093,089 65.7% $874,354 94.7%
Town of North Haven Pension Plan - Elected Officials
X 7/1/20156 $2,260,184 0.0% $180,734 88.7%
A - 27
Note: For municipalities with multiple defined benefit plans, the data is sorted by TPL (highest to lowest).
** All = All Eligible, T = Town Employees, PS = Public Safety (Police or Fire, etc.), O = Other (Other specified groups not listed above) See Page A-35 for plans denoted with "***" N/A = Not Applicable
* A checkmark for "closed plan" indicate that the pension plan is closed and does not accept new entrants.

Sponsoring
Entity T O
Total
Pension
Liability
(TPL)
FYE 2016
Plan
Fiduciary
Net Position
As a % of
TPLPlan Name
Group(s) CoveredDate of
Last
Valuation# of
Members
Pension Funding Information For Defined Benefit Pension Plans of Connecticut Municipalities
**
PSAll
Contributions Made as a %
of ADC
FY 2015-16
Municipal
Actuarially
Determined
Contribution
(ADC)
Closed
Plan *
NORWALK
Employees' Pension Plan X X 7/1/20151,315 $233,213,616 76.4% $4,776,855 102.5%
Police Benefit Fund X 7/1/2015378 $148,610,777 69.2% $4,314,628 100.0%
Fire Benefit Fund X 7/1/2015291 $122,595,072 77.3% $2,565,634 100.0%
Food Service Employees' Plan X 7/1/2015116 $3,236,711 62.5% $127,765 100.0%
NORWICH
City of Norwich Employees' Retirement Fund 7/1/20151,223 $264,347,000 57.5%X $9,740,000 77.8%
OLD SAYBROOK
Town of Old Saybrook Retirement Plan 7/1/2015200 $36,414,570 52.6%X $802,803 59.2%
ORANGE
Retirement Plan For Police Officers of Town of Orange
X 1/1/201649 $23,772,327 61.9% $758,092 100.0%
Town of Orange Employee Pension And Retirement Income Plan
1/1/201684 $10,686,272 68.2%X $275,185 100.0%
PLAINFIELD
Town of Plainfield Employees' Retirement Plan 6/30/2016399 $23,415,665 76.6%X $1,472,606 76.4%
PLAINVILLE
Town of Plainville Retirement Plan For Policemen
X 7/1/201571 $16,794,381 80.4% $486,658 100.0%
Town of Plainville Retirement Plan - Municipal Employees
7/1/2015117 $15,443,963 77.8%X $388,078 100.0%
A - 28
Note: For municipalities with multiple defined benefit plans, the data is sorted by TPL (highest to lowest).
** All = All Eligible, T = Town Employees, PS = Public Safety (Police or Fire, etc.), O = Other (Other specified groups not listed above) See Page A-35 for plans denoted with "***" N/A = Not Applicable
* A checkmark for "closed plan" indicate that the pension plan is closed and does not accept new entrants.

Sponsoring
Entity T O
Total
Pension
Liability
(TPL)
FYE 2016
Plan
Fiduciary
Net Position
As a % of
TPLPlan Name
Group(s) CoveredDate of
Last
Valuation# of
Members
Pension Funding Information For Defined Benefit Pension Plans of Connecticut Municipalities
**
PSAll
Contributions Made as a %
of ADC
FY 2015-16
Municipal
Actuarially
Determined
Contribution
(ADC)
Closed
Plan *
PLYMOUTH
Town of Plymouth Pension Plan 7/1/201485 $14,626,975 30.4%X $655,422 77.2%
Town of Plymouth Board of Education Pension Plan
X 7/1/201471 $7,208,947 65.5% $293,169 105.1%
PORTLAND
Town of Portland Defined Benefit Plan 7/1/2015151 $26,807,223 63.1%X $943,254 96.8%
PUTNAM
Town of Putnam Pension Plan 7/1/2015224 $10,724,584 110.1%X $185,420 100.0%
RIDGEFIELD
Retirement Plan of Ridgefield-Town X X 7/1/2015695 $53,638,291 96.7% $1,693,900 100.9%
Retirement Plan of Ridgefield-Police Plan X 7/1/201573 $29,605,280 94.0% $655,614 100.9%
Retirement Plan of Ridgefield-Fire Plan X 7/1/201549 $18,106,143 95.2% $353,931 100.0%
ROCKY HILL
Town of Rocky Hill General Employees Pension Plan
X X 9/1/2014324 $41,687,915 83.9% $1,414,908 94.7%
Town of Rocky Hill: Police Officer Pension Plan
X 9/1/201455 $22,374,654 96.4% $499,336 112.1%
SALISBURY
Town of Salisbury Pension Plan 1/1/20156 $1,092,481 86.0%X $44,278 100.0%
SHERMAN
Town of Sherman Pension Plan 7/1/201632 $940,477 101.4%X $18,716 358.0%
A - 29
Note: For municipalities with multiple defined benefit plans, the data is sorted by TPL (highest to lowest).
** All = All Eligible, T = Town Employees, PS = Public Safety (Police or Fire, etc.), O = Other (Other specified groups not listed above) See Page A-35 for plans denoted with "***" N/A = Not Applicable
* A checkmark for "closed plan" indicate that the pension plan is closed and does not accept new entrants.

Sponsoring
Entity T O
Total
Pension
Liability
(TPL)
FYE 2016
Plan
Fiduciary
Net Position
As a % of
TPLPlan Name
Group(s) CoveredDate of
Last
Valuation# of
Members
Pension Funding Information For Defined Benefit Pension Plans of Connecticut Municipalities
**
PSAll
Contributions Made as a %
of ADC
FY 2015-16
Municipal
Actuarially
Determined
Contribution
(ADC)
Closed
Plan *
SIMSBURY
General Government Retirement Income Plan X 7/1/2015239 $27,795,511 76.0% $888,277 115.2%
Board of Education Retirement Income Plan X 7/1/2015367 $27,028,848 68.9% $1,110,353 116.1%
Police Retirement Income Plan X 7/1/201569 $19,611,721 74.6% $631,023 115.2%
SOMERS
Town of Somers Board of Education Plan X 7/1/201690 $5,236,186 78.0% $331,755 100.9%
Town of Somers Town Plan 7/1/201544 $3,295,661 97.7%X $137,126 100.0%
SOUTH WINDSOR
South Windsor Town Plan 7/1/2015186 $42,448,680 54.5%X $1,727,470 100.0%
South Windsor Board of Education Plan X 7/1/2015158 $16,067,007 74.2% $535,965 100.0%
SOUTHBURY
Town of Southbury Retirement Income Plan 7/1/2015196 $22,227,333 75.8%X $988,541 100.0%
STAFFORD
Town of Stafford Pension Plan 1/1/2015300 $21,670,618 61.8%X $1,109,486 101.8%
STAMFORD
Classified Employees Retirement Trust Fund X 7/1/20141,498 $256,606,003 74.3% $6,387,000 100.0%
Police Pension Trust Fund X 7/1/2014580 $251,230,382 74.4% $7,158,000 100.0%
Firefighter's Pension Trust Fund X 7/1/2014480 $177,745,053 65.7% $4,342,000 100.0%
Custodian And Mechanics Retirement Trust Fund
X 7/1/2014694 $73,065,686 75.4% $1,840,000 101.8%
A - 30
Note: For municipalities with multiple defined benefit plans, the data is sorted by TPL (highest to lowest).
** All = All Eligible, T = Town Employees, PS = Public Safety (Police or Fire, etc.), O = Other (Other specified groups not listed above) See Page A-35 for plans denoted with "***" N/A = Not Applicable
* A checkmark for "closed plan" indicate that the pension plan is closed and does not accept new entrants.

Sponsoring
Entity T O
Total
Pension
Liability
(TPL)
FYE 2016
Plan
Fiduciary
Net Position
As a % of
TPLPlan Name
Group(s) CoveredDate of
Last
Valuation# of
Members
Pension Funding Information For Defined Benefit Pension Plans of Connecticut Municipalities
**
PSAll
Contributions Made as a %
of ADC
FY 2015-16
Municipal
Actuarially
Determined
Contribution
(ADC)
Closed
Plan *
STONINGTON
Town of Stonington Retirement Plan 6/30/2014351 $34,071,356 85.7%X $1,044,301 98.6%
STRATFORD
Town of Stratford Employees' Retirement Plan 7/1/2014936 $307,931,115 77.8%X*** $5,212,079 103.5%
SUFFIELD
Town of Suffield Retirement Plan 7/1/2015338 $37,769,165 73.1%X $1,333,075 100.0%
THOMASTON
Town of Thomaston Retirement Plan 6/30/2016156 $20,251,046 72.3%X $741,209 107.9%
THOMPSON
Town of Thompson Board of Education Retirement System
X 7/1/201572 $5,815,150 93.9% $138,070 100.0%
TORRINGTON
City of Torrington Police And Firemen's Retirement Fund
X 7/1/2014281 $87,109,682 59.6% $3,690,619 102.8%
City of Torrington Municipal Employees' Retirement Fund
X X 7/1/2014265 $46,336,750 76.1% $1,349,133 112.8%
TRUMBULL
Town of Trumbull Retirement Plan X X 7/1/2015784 $93,152,672 30.7% $4,144,000 100.0%
Town of Trumbull Police Benefit Retirement Plan
X 7/1/2015122 $76,862,339 67.8% $2,907,000 100.0%
VERNON
Town Pension Plan X X 1/1/2016777 $74,529,518 51.5% $2,383,370 100.0%
Police Pension Plan X 1/1/2016102 $41,058,435 46.9% $1,639,455 100.0%
A - 31
Note: For municipalities with multiple defined benefit plans, the data is sorted by TPL (highest to lowest).
** All = All Eligible, T = Town Employees, PS = Public Safety (Police or Fire, etc.), O = Other (Other specified groups not listed above) See Page A-35 for plans denoted with "***" N/A = Not Applicable
* A checkmark for "closed plan" indicate that the pension plan is closed and does not accept new entrants.

Sponsoring
Entity T O
Total
Pension
Liability
(TPL)
FYE 2016
Plan
Fiduciary
Net Position
As a % of
TPLPlan Name
Group(s) CoveredDate of
Last
Valuation# of
Members
Pension Funding Information For Defined Benefit Pension Plans of Connecticut Municipalities
**
PSAll
Contributions Made as a %
of ADC
FY 2015-16
Municipal
Actuarially
Determined
Contribution
(ADC)
Closed
Plan *
WALLINGFORD
Town of Wallingford Consolidated Pension Plan
7/1/20151,207 $237,561,000 72.4%X $8,411,000 100.0%
WARREN
Town of Warren Pension Plan 7/1/201513 $821,041 59.5%X $42,072 90.7%
WASHINGTON
Town of Washington Retirement Plan 1/1/201551 $3,594,301 85.8%X $128,579 108.9%
WATERBURY
City of Waterbury Retirement Fund 7/1/20144,034 $611,580,000 63.8%X*** $17,003,000 100.0%
WATERFORD
Town of Waterford Pension Trust Fund Plan 7/1/201517 $1,126,510 51.1%X $83,367 100.0%
WATERTOWN
Town of Watertown-Police Employees X 1/1/201566 $26,105,796 72.8% $875,571 100.0%
Town of Watertown-General Town Employees 1/1/2015245 $22,920,114 86.6%X $411,648 100.0%
WEST HARTFORD
Town of West Hartford Pension Fund 7/1/20152,014 $414,550,000 42.3%X $17,917,000 100.0%
WEST HAVEN
City of West Haven Police Pension Fund X 1/1/2014242 $137,450,796 79.3% $1,848,528 100.1%
City of West Haven Allingtown Fire District Plan
X 7/1/201549 $28,283,670 20.3% $1,597,526 97.6%
A - 32
Note: For municipalities with multiple defined benefit plans, the data is sorted by TPL (highest to lowest).
** All = All Eligible, T = Town Employees, PS = Public Safety (Police or Fire, etc.), O = Other (Other specified groups not listed above) See Page A-35 for plans denoted with "***" N/A = Not Applicable
* A checkmark for "closed plan" indicate that the pension plan is closed and does not accept new entrants.

Sponsoring Entity
T O
Total Pension Liability
(TPL)
FYE 2016 Plan
Fiduciary Net Position
As a % of TPL
Plan Name
Group(s) Covered Date of Last
Valuation# of
Members
Pension Funding Information For Defined Benefit Pension Plans of Connecticut Municipalities
**
PSAll
Contributions Made as a %
of ADC
FY 2015-16MunicipalActuarially
Determined Contribution
(ADC)Closed Plan *
WESTBROOK
Westbrook Retirement Plan 7/1/2015137 $9,232,225 86.8%X $401,327 100.0%
Constables Plan X 7/1/20158 $284,577 33.6% $23,547 100.0%
WESTPORT
Town of Westport - Police Pension Plan X 7/1/2015143 $100,712,936 81.9% $2,725,575 100.0%
Town of Westport Fire Pension Fund X 7/1/2015124 $79,913,995 84.9% $2,239,366 100.0%
Town of Westport Municipal Interim Pension Fund
X X 7/1/2015583 $68,082,616 95.5% $2,099,055 100.0%
Town of Westport - Non Union Pension Plan X 7/1/2015160 $41,491,990 79.3% $1,416,354 100.0%
Town of Westport Public Works Pension Plan X 7/1/201556 $17,384,245 100.5% $247,130 100.0%
WETHERSFIELD
Town of Wethersfield Pension Plan 7/1/2015579 $105,688,078 77.2%X $2,393,435 100.0%
WILLINGTON
Town of Willington Pension Fund 6/30/20163 $647,305 80.2%X $25,801 108.2%
WILTON
Wilton Employees' Retirement Plan 7/1/2015547 $110,269,574 91.0%X $2,851,154 110.0%
WINCHESTER
Town of Winchester Employees' Retirement Plan
1/1/2015100 $16,598,760 43.8%X $460,938 129.8%
A - 33
Note: For municipalities with multiple defined benefit plans, the data is sorted by TPL (highest to lowest).
** All = All Eligible, T = Town Employees, PS = Public Safety (Police or Fire, etc.), O = Other (Other specified groups not listed above) See Page A-35 for plans denoted with "***" N/A = Not Applicable
* A checkmark for "closed plan" indicate that the pension plan is closed and does not accept new entrants.

Sponsoring
Entity T O
Total
Pension
Liability
(TPL)
FYE 2016
Plan
Fiduciary
Net Position
As a % of
TPLPlan Name
Group(s) CoveredDate of
Last
Valuation# of
Members
Pension Funding Information For Defined Benefit Pension Plans of Connecticut Municipalities
**
PSAll
Contributions Made as a %
of ADC
FY 2015-16
Municipal
Actuarially
Determined
Contribution
(ADC)
Closed
Plan *
WINDHAM
Town of Windham Retirement Income Plan-Police
X 7/1/201476 $21,507,530 91.0% $790,769 0.0%
Town of Windham Retirement Income Plan-Municipal
X 1/1/2014183 $15,550,740 87.5% $518,719 100.0%
Town of Windham Retirement Income Plan-Fire
X 7/1/201461 $13,601,571 83.8% $714,062 0.0%
Town of Windham Retirement Income Plan-Board of Education
X 7/1/2014244 $9,762,054 90.3% $411,800 100.0%
WINDSOR
Town of Windsor Connecticut Retirement Plan X 7/1/2015533 $76,623,899 79.9%X $1,026,539 100.0%
WOLCOTT
Town of Wolcott Town and Police Plan X X 1/1/2015162 $28,619,153 62.0% $1,158,247 100.0%
Town of Wolcott Board of Education X 9/1/2014194 $14,512,550 83.0% $642,343 95.1%
WOODBURY
Town of Woodbury Pension Plan 98 $11,416,155 48.9%X $469,632 100.0%
Total:$14,565,508,523
68.8%
$441,238,768
96.0%
A - 34
Note: For municipalities with multiple defined benefit plans, the data is sorted by TPL (highest to lowest).
** All = All Eligible, T = Town Employees, PS = Public Safety (Police or Fire, etc.), O = Other (Other specified groups not listed above) See Page A-35 for plans denoted with "***" N/A = Not Applicable
* A checkmark for "closed plan" indicate that the pension plan is closed and does not accept new entrants.

Sponsoring
Entity T O
Total
Pension
Liability
(TPL)
FYE 2016
Plan
Fiduciary
Net Position
As a % of
TPLPlan Name
Group(s) CoveredDate of
Last
Valuation# of
Members
Pension Funding Information For Defined Benefit Pension Plans of Connecticut Municipalities
**
PSAll
Contributions Made as a %
of ADC
FY 2015-16
Municipal
Actuarially
Determined
Contribution
(ADC)
Closed
Plan *
This chart beginning on page A-18 is derived from a database of information compiled from the June 30, 2016 audit reports of Connecticut municipalities. The database includes information for those entities which sponsor or participate in single-employer or agent defined benefit pension plans and whose audit reports include sufficient information regarding the Total Pension Liability and Pension Fiduciary Net Position to determine the funding status of the pension plan.
The following is a list of municipalities and their related pension plans for which pension bonds have been issued as of June 30, 2016
Municipality Name of Plan
Amount of Bond IssuedDate Bond Issued
Bridgeport Public Safety Plan A August 2000 $350,000,000
Naugatuck Employee Plan, Fire Plan October 2003 $49,000,000
New Britain Policemen's Fund, Firemen's Fund February 1998 $105,000,000
Stratford Stratford Employees Retirement Plan August 1998 $95,000,000
Waterbury Waterbury Retirement Fund September 2009 $313,000,000
***
West Haven West Haven Police Pension Fund September 2002 $67,000,000
October 2013 $161,000,000
Hamden Hamden Employee Retirement Plan February 2015 $125,000,000
A - 35
Note: For municipalities with multiple defined benefit plans, the data is sorted by TPL (highest to lowest).
** All = All Eligible, T = Town Employees, PS = Public Safety (Police or Fire, etc.), O = Other (Other specified groups not listed above) See Page A-35 for plans denoted with "***" N/A = Not Applicable
* A checkmark for "closed plan" indicate that the pension plan is closed and does not accept new entrants.

# of
ParticipantsDate of Last
Valuation
Other Post-Employment Benefits Data
Sponsoring Entity/
Plan Name Insurance Other
Types of
Benefits Provided*
Health T O
Group(s) Covered **
PSAllPay-As-You-
Go Funding% of AAL
Funded
Actuarial
Accrued
Liabilty
(AAL)
FY 2015-16
Municipal
Annual
Required
Contribution
% of
Contribution
MadeBd of
Ed
ANDOVER
Town of Andover OPEB Plan
7/1/2014 $634,000 $61,0000.0% 47.5%X
ANSONIA
City of Ansonia OPEB Plan
459 7/1/2013 $27,766,684 $2,714,289X 0.0% 32.3%
ASHFORD
Town of Ashford Post Retirement Healthcare Plan
7/1/2014 $452,000 $53,0000.0% 40.0%X
AVON
Town of Avon OPEB Plan
624 7/1/2014 $30,661,111 $3,144,039X 11.1% 75.7%
BEACON FALLS
Town of Beacon Falls OPEB Plan
7/1/2013 $1,195,490 $88,170X 0.0% 85.9%
BERLIN
Town of Berlin Post-Retirement Medical Program
447 7/1/2014 $5,468,687 $530,261X 0.0% 38.9%
BETHANY
Bethany Public Schools OPEB Plan
61 7/1/2013 $1,108,800 $118,8000.0% 8.7%X
A - 36

# of
ParticipantsDate of Last
Valuation
Other Post-Employment Benefits Data
Sponsoring Entity/
Plan Name Insurance Other
Types of
Benefits Provided*
Health T O
Group(s) Covered **
PSAllPay-As-You-
Go Funding% of AAL
Funded
Actuarial
Accrued
Liabilty
(AAL)
FY 2015-16
Municipal
Annual
Required
Contribution
% of
Contribution
MadeBd of
Ed
BETHEL
Town of Bethel OPEB Plan - Police
39 7/1/2013 $5,291,619 $563,103X 0.0% 0.8%
Town of Bethel OPEB Plan-Board of Education
313 7/1/2013 $4,125,282 $605,6010.0% 63.4%X
Town of Bethel OPEB Plan-Town
96 7/1/2013 $7,581,613 $580,811X 0.0% 32.3%
BLOOMFIELD
Town of Bloomfield OPEB Plan
7/1/2014 $64,892,076 $8,016,863X X 3.7% 43.4%X
BOLTON
Town of Bolton OPEB Plan
7/1/2015 $2,900,000 $224,500X 0.0% 31.6%
BOZRAH
Bozrah Public Schools OPEB Program
48 6/30/2016 $1,153,978 $135,2900.0% 7.5%X
BRANFORD
Town of Branford Retirement Health Plan
713 7/1/2014 $22,798,733 $1,847,900X 41.7% 84.4%
A - 37

# of
ParticipantsDate of Last
Valuation
Other Post-Employment Benefits Data
Sponsoring Entity/
Plan Name Insurance Other
Types of
Benefits Provided*
Health T O
Group(s) Covered **
PSAllPay-As-You-
Go Funding% of AAL
Funded
Actuarial
Accrued
Liabilty
(AAL)
FY 2015-16
Municipal
Annual
Required
Contribution
% of
Contribution
MadeBd of
Ed
BRIDGEPORT
City of Bridgeport OPEB Plan
7,076 7/1/2014 $1,003,337,378 $71,905,518X 0.0% 44.4%
BRISTOL
Bristol Retiree Health Plan
2,013 7/1/2014 $60,732,614 $7,308,579X 7.3% 54.2%
BROOKFIELD
Town of Brookfield OPEB Plan
7/1/2014 $26,493,390 $2,632,868X 0.0% 12.1%
BROOKLYN
Brooklyn Public Schools OPEB Plan
7/1/2013 $2,374,700 $225,2000.0% 3.1%X
BURLINGTON
Town of Burlington Post-Retirement Medical Insurance Program
30 7/1/2014 $191,639 $26,170X 0.0% 84.3%
CANAAN
Town of Canaan OPEB Plan
7/1/2015 $97,884 $11,4140.0% 14.8%X
CANTERBURY
Town of Canterbury OPEB Plan
121 7/1/2014 $1,321,593 $147,208X 0.0% 59.7%
A - 38

# of
ParticipantsDate of Last
Valuation
Other Post-Employment Benefits Data
Sponsoring Entity/
Plan Name Insurance Other
Types of
Benefits Provided*
Health T O
Group(s) Covered **
PSAllPay-As-You-
Go Funding% of AAL
Funded
Actuarial
Accrued
Liabilty
(AAL)
FY 2015-16
Municipal
Annual
Required
Contribution
% of
Contribution
MadeBd of
Ed
CANTON
Town of Canton OPEB Plan
7/1/2014 $2,071,201 $242,91825.4% 100.0%X
CHAPLIN
Chaplin Public Schools OPEB Program
6/30/2016 $797,979 $74,7280.0% 19.8%X
CHESHIRE
Town of Cheshire OPEB Plan - BOE
460 7/1/2013 $17,488,790 $1,054,8742.6% 60.5%X
Town of Cheshire OPEB Plan - Police
75 7/1/2013 $8,459,756 $732,922X 8.6% 55.2%
Town of Cheshire OPEB Plan - Town
131 7/1/2013 $2,259,585 $94,993X 2.6% 220.8%
CHESTER
Chester Public Schools OPEB Program
6/30/2016 $93,484 $12,6140.0% 0.0%X
Town of Chester OPEB Program
7/1/2015 $34,753 $4,169X 0.0% 212.3%
CLINTON
Town of Clinton Post-Retirement Medical Program - Bd. of Ed
317 7/1/2013 $8,150,872 $752,4990.0% 33.5%X
A - 39

# of
ParticipantsDate of Last
Valuation
Other Post-Employment Benefits Data
Sponsoring Entity/
Plan Name Insurance Other
Types of
Benefits Provided*
Health T O
Group(s) Covered **
PSAllPay-As-You-
Go Funding% of AAL
Funded
Actuarial
Accrued
Liabilty
(AAL)
FY 2015-16
Municipal
Annual
Required
Contribution
% of
Contribution
MadeBd of
Ed
Town of Clinton Post-Retirement Medical Program - Town Employees
115 7/1/2014 $2,254,800 $172,700X 0.0% 60.4%
COLCHESTER
Town of Colchester OPEB Plan
425 7/1/2013 $6,178,930 $594,221X 0.0% 35.9%
COLUMBIA
Town of Columbia Post-Retirement Medical Insurance Program
108 7/1/2015 $568,600 $53,600X 0.0% 49.3%
COVENTRY
Town of Coventry OPEB Plan
377 7/1/2014 $5,140,000 $594,125X 0.0% 26.7%
CROMWELL
Town of Cromwell OPEB Plan
426 7/1/2015 $6,405,000 $608,500X 6.4% 64.2%
DANBURY
City of Danbury Post Employment Retirement Plan
1,233 7/1/2014 $259,259,700 $24,193,000X 0.5% 38.2%
A - 40

# of
ParticipantsDate of Last
Valuation
Other Post-Employment Benefits Data
Sponsoring Entity/
Plan Name Insurance Other
Types of
Benefits Provided*
Health T O
Group(s) Covered **
PSAllPay-As-You-
Go Funding% of AAL
Funded
Actuarial
Accrued
Liabilty
(AAL)
FY 2015-16
Municipal
Annual
Required
Contribution
% of
Contribution
MadeBd of
Ed
DARIEN
Town of Darien OPEB Plan - Non-Police
586 7/1/2015 $5,331,179 $606,153X 47.5% 100.0%
Town OF Darien OPEB Plan - Police
58 7/1/2015 $5,378,051 $733,556X 61.5% 87.7%
DERBY
City of Derby OPEB Plan
410 7/1/2014 $25,953,329 $3,271,609X 0.0% 37.2%
DURHAM
Town of Durham Medical Benefit Plan
31 7/1/2014 $56,000 $7,400X 0.0% 0.0%
EAST GRANBY
East Granby Retirees OPEB Plan
120 7/1/2014 $2,674,432 $300,1010.0% 31.0%XX
EAST HADDAM
Town of East Haddam Post-Retirement Medical Program
182 7/1/2015 $798,540 $73,657X 0.0% 100.0%
EAST HAMPTON
Town of East Hampton OPEB Plan-Board of Education
212 7/1/2014 $6,226,339 $520,0260.0% 42.0%X
A - 41

# of
ParticipantsDate of Last
Valuation
Other Post-Employment Benefits Data
Sponsoring Entity/
Plan Name Insurance Other
Types of
Benefits Provided*
Health T O
Group(s) Covered **
PSAllPay-As-You-
Go Funding% of AAL
Funded
Actuarial
Accrued
Liabilty
(AAL)
FY 2015-16
Municipal
Annual
Required
Contribution
% of
Contribution
MadeBd of
Ed
EAST HARTFORD
Town of East Hartford OPEB Plan
2,420 7/1/2015 $134,043,000 $13,747,000X 1.8% 41.5%
EAST HAVEN
Town of East Haven Board of Education Post Retirement Healthcare Plan
7/1/2015 $47,101,378 $4,732,0070.0% 48.3%X
Town of East Haven Town Post Retirement Healthcare Plan
7/1/2015 $69,082,589 $4,583,188X 0.0% 41.1%
EAST LYME
Town of East Lyme OPEB Plan
489 7/1/2014 $10,485,000 $939,400X 0.0% 12.0%
EAST WINDSOR
Town of East Windsor Post-Retirement Medical Program
7/1/2014 $3,472,085 $285,282X 13.1% 125.9%
EASTFORD
Eastford Public Schools OPEB Program
7/1/2015 $483,000 $55,6000.0% 0.0%X
A - 42

# of
ParticipantsDate of Last
Valuation
Other Post-Employment Benefits Data
Sponsoring Entity/
Plan Name Insurance Other
Types of
Benefits Provided*
Health T O
Group(s) Covered **
PSAllPay-As-You-
Go Funding% of AAL
Funded
Actuarial
Accrued
Liabilty
(AAL)
FY 2015-16
Municipal
Annual
Required
Contribution
% of
Contribution
MadeBd of
Ed
EASTON
Town of Easton OPEB Plan
184 7/1/2014 $1,850,910 $173,637X 0.0% 425.1%
ELLINGTON
Town of Ellington Retirement Healthcare Plan
7/1/2014 $4,620,616 $361,660X 0.0% 55.8%
ENFIELD
Town of Enfield OPEB Plan
1,130 7/1/2015 $33,082,000 $2,356,000X 13.0% 58.9%
ESSEX
Town of Essex Employees' OPEB Plan
7/1/2014 $1,963,390 $117,464X 0.0% 70.3%
FAIRFIELD
Town of Fairfield OPEB Plan-Board of Education
1,586 7/1/2014 $29,635,000 $1,850,0000.0% 70.1%X
Town of Fairfield OPEB Plan-Police & Fire
473 7/1/2014 $65,258,000 $4,549,000X 15.2% 104.4%
Town of Fairfield OPEB Plan-Town
547 7/1/2014 $57,304,000 $4,282,000X 19.0% 105.9%
A - 43
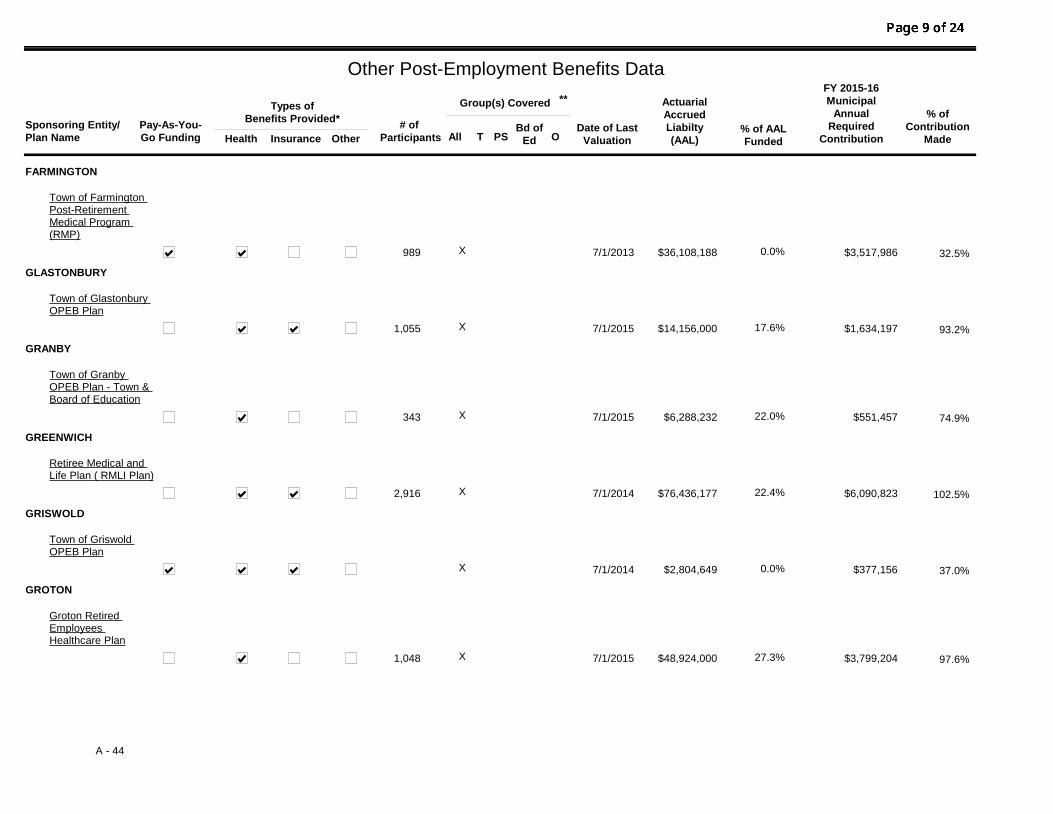
# of
ParticipantsDate of Last
Valuation
Other Post-Employment Benefits Data
Sponsoring Entity/
Plan Name Insurance Other
Types of
Benefits Provided*
Health T O
Group(s) Covered **
PSAllPay-As-You-
Go Funding% of AAL
Funded
Actuarial
Accrued
Liabilty
(AAL)
FY 2015-16
Municipal
Annual
Required
Contribution
% of
Contribution
MadeBd of
Ed
FARMINGTON
Town of Farmington Post-Retirement Medical Program (RMP)
989 7/1/2013 $36,108,188 $3,517,986X 0.0% 32.5%
GLASTONBURY
Town of Glastonbury OPEB Plan
1,055 7/1/2015 $14,156,000 $1,634,197X 17.6% 93.2%
GRANBY
Town of Granby OPEB Plan - Town & Board of Education
343 7/1/2015 $6,288,232 $551,457X 22.0% 74.9%
GREENWICH
Retiree Medical and Life Plan ( RMLI Plan)
2,916 7/1/2014 $76,436,177 $6,090,823X 22.4% 102.5%
GRISWOLD
Town of Griswold OPEB Plan
7/1/2014 $2,804,649 $377,156X 0.0% 37.0%
GROTON
Groton Retired Employees Healthcare Plan
1,048 7/1/2015 $48,924,000 $3,799,204X 27.3% 97.6%
A - 44

# of
ParticipantsDate of Last
Valuation
Other Post-Employment Benefits Data
Sponsoring Entity/
Plan Name Insurance Other
Types of
Benefits Provided*
Health T O
Group(s) Covered **
PSAllPay-As-You-
Go Funding% of AAL
Funded
Actuarial
Accrued
Liabilty
(AAL)
FY 2015-16
Municipal
Annual
Required
Contribution
% of
Contribution
MadeBd of
Ed
GROTON (City)
City of Groton OPEB Plan
226 7/1/2014 $13,687,417 $1,302,875X 25.2% 135.2%
GUILFORD
Town of Guilford Retiree Benefit Program
575 7/1/2014 $28,564,000 $1,424,200X 0.0% 54.7%
HAMDEN
Town of Hamden OPEB Plan
2,132 7/1/2014 $451,966,876 $39,778,717X 0.0% 46.2%
HAMPTON
Hampton Public Schools OPEB Program
6/30/2013 $1,028,489 $62,2210.0% 19.0%X
HARTFORD
City of Hartford OPEB Plan
6,537 7/1/2015 $313,061,000 $24,394,000X 5.7% 138.1%
HEBRON
Town of Hebron OPEB Plan
7/1/2014 $1,586,000 $162,000X 0.0% 58.0%
KILLINGLY
Town of Killingly OPEB Plan
7/1/2015 $6,913,000 $824,500X 0.0% 66.2%
A - 45

# of
ParticipantsDate of Last
Valuation
Other Post-Employment Benefits Data
Sponsoring Entity/
Plan Name Insurance Other
Types of
Benefits Provided*
Health T O
Group(s) Covered **
PSAllPay-As-You-
Go Funding% of AAL
Funded
Actuarial
Accrued
Liabilty
(AAL)
FY 2015-16
Municipal
Annual
Required
Contribution
% of
Contribution
MadeBd of
Ed
KILLINGWORTH
Killingworth OPEB Plan
6 6/30/2014 $149,972 $15,509X 0.0% 0.0%
LEBANON
Lebanon Board of Education OPEB Plan
7/1/2014 $2,779,300 $221,3000.0% 32.1%X
LEDYARD
Town of Ledyard OPEB Plan
344 7/1/2015 $12,569,506 $929,8760.0% 39.2%X
LISBON
Lisbon Public Schools OPEB Program
7/1/2015 $1,502,602 $180,0970.0% 10.0%X
LITCHFIELD
Town of Litchfield OPEB Plan - Teacher and Administrators
149 7/1/2014 $2,570,923 $206,92134.5% 63.4%X
MADISON
Town of Madison OPEB Plan
538 1/1/2015 $17,046,172 $1,222,583X 0.0% 49.8%
A - 46

# of
ParticipantsDate of Last
Valuation
Other Post-Employment Benefits Data
Sponsoring Entity/
Plan Name Insurance Other
Types of
Benefits Provided*
Health T O
Group(s) Covered **
PSAllPay-As-You-
Go Funding% of AAL
Funded
Actuarial
Accrued
Liabilty
(AAL)
FY 2015-16
Municipal
Annual
Required
Contribution
% of
Contribution
MadeBd of
Ed
MANCHESTER
Town of Manchester - OPEB Plan
2,784 7/1/2014 $169,347,000 $16,016,000X 0.2% 60.6%
MANSFIELD
Town of Mansfield Postemployment Healthcare Plan
398 7/1/2014 $2,872,658 $331,431X 15.9% 100.1%
MARLBOROUGH
Town of Marlborough OPEB Plan
53 7/1/2014 $783,000 $71,0000.0% 40.8%X
MERIDEN
Meriden Postemployment Healthcare Plan
1,902 7/1/2014 $89,516,332 $7,513,565X 23.3% 62.3%
MIDDLEBURY
Town of Middlebury OPEB Plan
42 7/1/2015 $10,911,703 $652,901X 0.0% 44.2%
MIDDLETOWN
The City of Middletown Plan
1,778 7/1/2014 $183,479,000 $15,164,000X 4.8% 70.4%
A - 47

# of
ParticipantsDate of Last
Valuation
Other Post-Employment Benefits Data
Sponsoring Entity/
Plan Name Insurance Other
Types of
Benefits Provided*
Health T O
Group(s) Covered **
PSAllPay-As-You-
Go Funding% of AAL
Funded
Actuarial
Accrued
Liabilty
(AAL)
FY 2015-16
Municipal
Annual
Required
Contribution
% of
Contribution
MadeBd of
Ed
MILFORD
Board of Education Retiree Medical Benefit -City of Milford OPEB
1,541 7/1/2014 $145,420,000 $13,680,0000.0% 36.3%X
City of Milford Retiree Medical
1,040 7/1/2014 $126,084,000 $12,103,000X X 3.2% 58.5%
MONROE
Town of Monroe - Police OPEB Plan
39 7/1/2014 $998,000 $106,000X 23.2% 89.1%
Town of Monroe Board of Education OPEB Plan
568 7/1/2014 $10,703,353 $722,5720.0% 79.9%X
MONTVILLE
Town of Montville OPEB Plan
7/1/2014 $1,500,164 $115,3360.0% 99.8%X
NAUGATUCK
Naugatuck OPEB Plan
1,340 7/1/2014 $147,865,000 $13,287,000X 3.4% 63.8%
NEW BRITAIN
The City of New Britain OPEB Plan
2,357 7/1/2014 $70,370,000 $6,052,000X 4.6% 97.4%
A - 48

# of
ParticipantsDate of Last
Valuation
Other Post-Employment Benefits Data
Sponsoring Entity/
Plan Name Insurance Other
Types of
Benefits Provided*
Health T O
Group(s) Covered **
PSAllPay-As-You-
Go Funding% of AAL
Funded
Actuarial
Accrued
Liabilty
(AAL)
FY 2015-16
Municipal
Annual
Required
Contribution
% of
Contribution
MadeBd of
Ed
NEW CANAAN
Town of New Canaan OPEB Plan
764 7/1/2014 $27,626,684 $2,505,269X 29.7% 54.2%
NEW FAIRFIELD
Town of New Fairfield OPEB Plan
7/1/2013 $6,818,066 $571,103X 17.3% 100.0%
NEW HAVEN
City of New Haven OPEB Plan
6,161 7/1/2015 $557,227,000 $37,673,000X 0.1% 75.1%
NEW LONDON
City of New London OPEB Plan
7/1/2014 $25,888,384 $2,017,079X 1.0% 67.6%
NEW MILFORD
Town of New Milford OPEB Plan
478 7/1/2014 $11,099,078 $1,077,895X 2.1% 60.1%
NEWINGTON
Town of Newington OPEB Plan
805 7/1/2015 $20,561,000 $1,970,000X 25.7% 98.8%
NEWTOWN
Town of Newtown OPEB Plan
7/1/2014 $7,388,197 $793,865X 17.4% 50.1%
A - 49

# of
ParticipantsDate of Last
Valuation
Other Post-Employment Benefits Data
Sponsoring Entity/
Plan Name Insurance Other
Types of
Benefits Provided*
Health T O
Group(s) Covered **
PSAllPay-As-You-
Go Funding% of AAL
Funded
Actuarial
Accrued
Liabilty
(AAL)
FY 2015-16
Municipal
Annual
Required
Contribution
% of
Contribution
MadeBd of
Ed
NORTH BRANFORD
Town of North Branford OPEB Plan
354 7/1/2014 $7,197,759 $548,295X 26.1% 100.0%
NORTH HAVEN
Town of North Haven OPEB Plan
834 6/30/2015 $71,472,207 $5,651,126X 0.0% 32.3%
NORTH STONINGTON
Town of North Stonington OPEB Plan
138 7/1/2014 $5,779,313 $283,9200.0% 48.5%X
NORWALK
City of Norwalk OPEB Plan
2,811 7/1/2015 $264,676,000 $20,217,000X 20.7% 77.5%
NORWICH
The City of Norwich, Retiree Health Plan
1,299 7/1/2015 $57,409,000 $5,566,000X 23.7% 100.0%
OLD SAYBROOK
Town of Old Saybrook OPEB Plan
344 7/1/2014 $9,241,000 $868,836X 0.0% 50.5%
ORANGE
Town of Orange OPEB Plan-Retirees
344 7/1/2014 $30,453,882 $2,510,778X 0.0% 38.0%
A - 50

# of
ParticipantsDate of Last
Valuation
Other Post-Employment Benefits Data
Sponsoring Entity/
Plan Name Insurance Other
Types of
Benefits Provided*
Health T O
Group(s) Covered **
PSAllPay-As-You-
Go Funding% of AAL
Funded
Actuarial
Accrued
Liabilty
(AAL)
FY 2015-16
Municipal
Annual
Required
Contribution
% of
Contribution
MadeBd of
Ed
OXFORD
Town of Oxford OPEB Plan
287 7/1/2015 $1,290,000 $140,000X 0.0% 42.9%
PLAINFIELD
Town of Plainfield OPEB Plan - Board of Education
7/1/2014 $14,122,809 $1,092,6000.0% 36.2%X
PLAINVILLE
Town of Plainville Healthcare Plan
527 7/1/2014 $12,117,589 $1,277,963X 0.0% 8.2%
PLYMOUTH
Town of Plymouth OPEB Plan
367 7/1/2014 $21,188,903 $1,535,717X 0.0% 63.5%
POMFRET
Town of Pomfret Public Schools OPEB Program
6/30/2015 $3,422,352 $308,7150.0% 13.7%X
PORTLAND
Town of Portland OPEB Plan
7/1/2014 $2,351,989 $200,564X 0.0% 43.6%
PRESTON
Town of Preston OPEB Plan - Public Schools
49 7/1/2014 $2,355,000 $157,0000.0% 48.2%X
A - 51

# of
ParticipantsDate of Last
Valuation
Other Post-Employment Benefits Data
Sponsoring Entity/
Plan Name Insurance Other
Types of
Benefits Provided*
Health T O
Group(s) Covered **
PSAllPay-As-You-
Go Funding% of AAL
Funded
Actuarial
Accrued
Liabilty
(AAL)
FY 2015-16
Municipal
Annual
Required
Contribution
% of
Contribution
MadeBd of
Ed
PROSPECT
Town of Prospect-OPEB
6/30/2016 $589,594 $70,029X 0.0% 25.1%
PUTNAM
Town of Putnam Medical Benefit Plan
7/1/2014 $6,061,400 $552,700X 0.0% 12.9%
REDDING
Town of Redding OPEB Plan
231 7/1/2014 $2,751,153 $299,947X 0.0% 29.6%
RIDGEFIELD
Town of Ridgefield OPEB Plan
977 7/1/2015 $25,057,000 $1,942,000X 10.9% 111.2%
ROCKY HILL
Town of Rocky Hill OPEB Plan - Board of Education
309 7/1/2014 $1,471,384 $188,3800.0% 32.0%X
Town of Rocky Hill OPEB Plan - Town
149 7/1/2014 $16,225,361 $1,725,195X 4.4% 40.2%
ROXBURY
Town of Roxbury Post Retirement Health Plan
7/1/2015 $198,455 $48,033X 0.0% 9.0%
A - 52

# of
ParticipantsDate of Last
Valuation
Other Post-Employment Benefits Data
Sponsoring Entity/
Plan Name Insurance Other
Types of
Benefits Provided*
Health T O
Group(s) Covered **
PSAllPay-As-You-
Go Funding% of AAL
Funded
Actuarial
Accrued
Liabilty
(AAL)
FY 2015-16
Municipal
Annual
Required
Contribution
% of
Contribution
MadeBd of
Ed
SALEM
Town of Salem Public Schools OPEB Program
6/30/2016 $1,811,113 $193,4590.0% 7.4%X
SCOTLAND
Town of Scotland Board of Education OPEB Plan
6/30/2016 $169,891 $24,1260.0% 54.9%X
SEYMOUR
Town of Seymour Medical Benefit Plan
382 7/1/2015 $36,935,842 $3,143,092X 0.0% 46.2%
SIMSBURY
Town of Simsbury OPEB Plan
915 7/1/2015 $18,372,000 $1,047,953X 66.9% 114.1%
SOMERS
Town of Somers OPEB Plan - Town and Board of Education
7/1/2014 $4,585,470 $342,702X 0.0% 35.3%
SOUTH WINDSOR
Town of South Windsor OPEB Plan
936 7/1/2013 $9,510,000 $1,007,276X 8.8% 101.8%
A - 53

# of
ParticipantsDate of Last
Valuation
Other Post-Employment Benefits Data
Sponsoring Entity/
Plan Name Insurance Other
Types of
Benefits Provided*
Health T O
Group(s) Covered **
PSAllPay-As-You-
Go Funding% of AAL
Funded
Actuarial
Accrued
Liabilty
(AAL)
FY 2015-16
Municipal
Annual
Required
Contribution
% of
Contribution
MadeBd of
Ed
SOUTHINGTON
Town of Andover OPEB Plan
1,347 7/1/2015 $39,963,000 $2,864,000X 0.0% 39.5%
SPRAGUE
Sprague Public Schools OPEB Plan
37 7/1/2015 $685,020 $62,7960.0% 26.8%X
STAFFORD
Stafford Board of Education OPEB Plan
279 1/1/2015 $5,215,300 $417,2000.0% 4.3%X
STAMFORD
City of Stamford OPEB Plan
4,320 7/1/2015 $294,239,000 $27,078,000X 19.5% 79.9%
STERLING
Sterling Public Schools OPEB Program
6/30/2016 $5,119,770 $412,3200.0% 15.5%X
STONINGTON
Town of Stonington OPEB Plan
7/1/2013 $5,200,625 $431,821X 13.1% 80.9%
STRATFORD
Stratford OBEP Plan
2,222 7/1/2014 $239,827,000 $19,699,700X 1.4% 41.3%
A - 54

# of
ParticipantsDate of Last
Valuation
Other Post-Employment Benefits Data
Sponsoring Entity/
Plan Name Insurance Other
Types of
Benefits Provided*
Health T O
Group(s) Covered **
PSAllPay-As-You-
Go Funding% of AAL
Funded
Actuarial
Accrued
Liabilty
(AAL)
FY 2015-16
Municipal
Annual
Required
Contribution
% of
Contribution
MadeBd of
Ed
SUFFIELD
Town of Suffield OPEB Plan
541 7/1/2014 $19,616,888 $1,797,680X 35.7% -106.2%
THOMASTON
Town of Thomaston OPEB Plan - Board of Education
7/1/2015 $5,298,411 $444,5150.0% 38.3%X
Town of Thomaston OPEB Plan -Town
7/1/2015 $20,242,358 $1,558,534X X 0.7% 44.0%X
THOMPSON
Town of Thompson OPEB Plan
201 1/1/2016 $4,165,000 $274,300X 0.0% 40.8%
TOLLAND
Town of Tolland OPEB Plan
352 7/1/2014 $4,623,714 $447,781X 13.6% 102.2%
TORRINGTON
City of Torrington OPEB Plan
1,528 7/1/2014 $102,954,000 $10,828,600X 0.0% 30.3%
TRUMBULL
Town of Trumbull OPEB Plan
973 7/1/2014 $32,052,498 $1,757,696X 0.1% 51.2%
A - 55
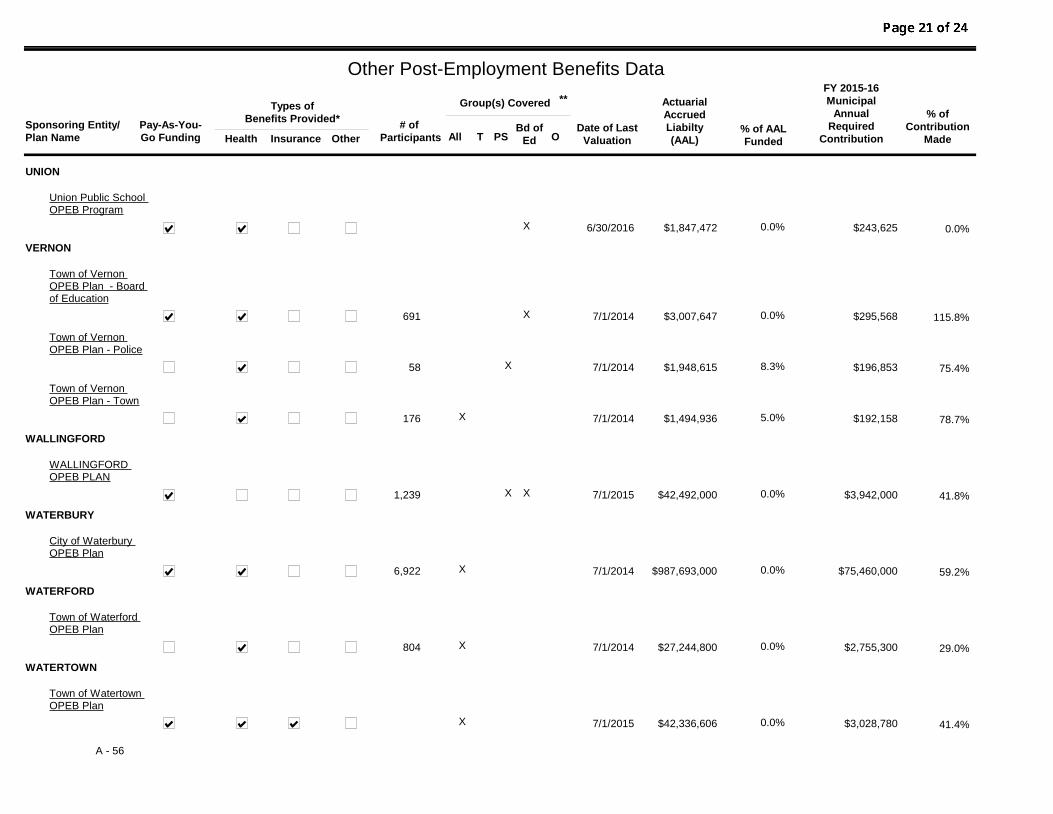
# of
ParticipantsDate of Last
Valuation
Other Post-Employment Benefits Data
Sponsoring Entity/
Plan Name Insurance Other
Types of
Benefits Provided*
Health T O
Group(s) Covered **
PSAllPay-As-You-
Go Funding% of AAL
Funded
Actuarial
Accrued
Liabilty
(AAL)
FY 2015-16
Municipal
Annual
Required
Contribution
% of
Contribution
MadeBd of
Ed
UNION
Union Public School OPEB Program
6/30/2016 $1,847,472 $243,6250.0% 0.0%X
VERNON
Town of Vernon OPEB Plan - Board of Education
691 7/1/2014 $3,007,647 $295,5680.0% 115.8%X
Town of Vernon OPEB Plan - Police
58 7/1/2014 $1,948,615 $196,853X 8.3% 75.4%
Town of Vernon OPEB Plan - Town
176 7/1/2014 $1,494,936 $192,158X 5.0% 78.7%
WALLINGFORD
WALLINGFORD OPEB PLAN
1,239 7/1/2015 $42,492,000 $3,942,000X 0.0% 41.8%X
WATERBURY
City of Waterbury OPEB Plan
6,922 7/1/2014 $987,693,000 $75,460,000X 0.0% 59.2%
WATERFORD
Town of Waterford OPEB Plan
804 7/1/2014 $27,244,800 $2,755,300X 0.0% 29.0%
WATERTOWN
Town of Watertown OPEB Plan
7/1/2015 $42,336,606 $3,028,780X 0.0% 41.4%
A - 56

# of
ParticipantsDate of Last
Valuation
Other Post-Employment Benefits Data
Sponsoring Entity/
Plan Name Insurance Other
Types of
Benefits Provided*
Health T O
Group(s) Covered **
PSAllPay-As-You-
Go Funding% of AAL
Funded
Actuarial
Accrued
Liabilty
(AAL)
FY 2015-16
Municipal
Annual
Required
Contribution
% of
Contribution
MadeBd of
Ed
WEST HARTFORD
Town of West Hartford OPEB Plan
2,203 7/1/2015 $147,594,000 $11,251,000X 0.5% 96.1%
WEST HAVEN
City of West Haven Allingtown Fire District Plan
80 7/1/2013 $19,201,569 $1,533,359X 0.0% 45.1%
City of West Haven OPEB Plan
1,777 7/1/2013 $188,688,760 $13,677,829X 0.0% 61.4%
WESTBROOK
Town of Westbrook OPEB Plan - Board of Education
165 7/1/2014 $1,430,011 $92,5760.0% 26.0%X
Town of Westbrook OPEB Plan - Town
41 7/1/2014 $418,404 $48,581X 0.0% 34.6%
WESTON
Town of Weston OPEB Plan
542 7/1/2015 $10,916,000 $1,067,000X 63.8% 80.4%
WESTPORT
Town of Westport OPEB Plan
1,651 7/1/2014 $105,369,932 $9,656,580X 26.8% 100.0%
A - 57

# of
ParticipantsDate of Last
Valuation
Other Post-Employment Benefits Data
Sponsoring Entity/
Plan Name Insurance Other
Types of
Benefits Provided*
Health T O
Group(s) Covered **
PSAllPay-As-You-
Go Funding% of AAL
Funded
Actuarial
Accrued
Liabilty
(AAL)
FY 2015-16
Municipal
Annual
Required
Contribution
% of
Contribution
MadeBd of
Ed
WETHERSFIELD
Town of Wethersfield OPEB Plan
945 7/1/2015 $49,268,000 $5,002,811X 23.0% 62.3%
WILLINGTON
Town of Willington OPEB Plan - Teachers
42 6/30/2014 $1,075,973 $61,5930.0% 62.6%X
WILTON
Town of Wilton OPEB Plan
757 7/1/2014 $7,665,302 $570,912X 57.4% 100.0%
WINCHESTER
Town of Winchester OPEB Plan
7/1/2014 $5,662,846 $369,733X 0.0% 64.0%
WINDHAM
Town of Windham OPEB Plan
7/1/2014 $12,259,100 $1,254,200X 0.0% 2.6%
WINDSOR
Town of Windsor OPEB Plan
929 7/1/2013 $71,595,156 $6,762,112X 0.0% 38.4%
WINDSOR LOCKS
Town of Windsor Locks OPEB Plan
393 7/1/2015 $4,798,725 $360,756X 43.6% 96.3%
A - 58

# of
ParticipantsDate of Last
Valuation
Other Post-Employment Benefits Data
Sponsoring Entity/
Plan Name Insurance Other
Types of
Benefits Provided*
Health T O
Group(s) Covered **
PSAllPay-As-You-
Go Funding% of AAL
Funded
Actuarial
Accrued
Liabilty
(AAL)
FY 2015-16
Municipal
Annual
Required
Contribution
% of
Contribution
MadeBd of
Ed
WOLCOTT
Town of Wolcott OPEB Plan
598 7/1/2014 $19,045,930 $1,981,348X 0.0% 40.1%
WOODBRIDGE
Town of Woodbridge OPEB Plan
233 7/1/2015 $18,908,708 $1,811,158X 15.2% 63.5%
WOODBURY
Town of Woodbury OPEB Plan
7/1/2016 $6,846,302 $497,543X 0.0% 36.2%
WOODSTOCK
Town of Woodstock OPEB Plan - Public Schools
6/30/2014 $8,435,837 $550,3130.0% 12.4%X
$7,942,407,362 4.9%Totals
# of Towns/
Plans161
143
$654,471,862 60.8%
Data based upon information provided in the June 30, 2016 financial audit reports of municipalities.
Notes
* Health benefits = medical, dental, vision, prescriptions, etc.; Insurance = Insurance other than health, including life, disability, etc.
** Groups covered: All = All Eligible Participants; T =Town; PS = Public Safety (Police and/or Fire, etc); Bd. of Ed = Board of Education (certified and/or noncertified); O = Other
A - 59

SECTION B
CURRENT AND MULTI-YEAR DATA

Population
as of July 1, 2016 *
ANDOVER 3,252
ANSONIA 18,732
ASHFORD 4,236
AVON 18,364
BARKHAMSTED 3,664
BEACON FALLS 6,095
BERLIN 20,499
BETHANY 5,488
BETHEL 19,627
BETHLEHEM 3,447
BLOOMFIELD 20,642
BOLTON 4,930
BOZRAH 2,578
BRANFORD 28,028
BRIDGEPORT 145,936
BRIDGEWATER 1,648
BRISTOL 60,147
BROOKFIELD 17,098
BROOKLYN 8,205
BURLINGTON 9,614
CANAAN 1,177
CANTERBURY 5,065
CANTON 10,287
CHAPLIN 2,246
CHESHIRE 29,282
CHESTER 4,255
CLINTON 12,961
COLCHESTER 16,061
COLEBROOK 1,430
COLUMBIA 5,433
CORNWALL 1,380
COVENTRY 12,433
CROMWELL 13,960
DANBURY 84,992
DARIEN 21,744
DEEP RIVER 4,482
DERBY 12,631
DURHAM 7,255
EAST GRANBY 5,170
EAST HADDAM 9,023
EAST HAMPTON 12,869
EAST HARTFORD 50,237
EAST HAVEN 28,807
EAST LYME 18,886
EAST WINDSOR 11,355
EASTFORD 1,750
EASTON 7,561
ELLINGTON 16,071
ENFIELD 44,368
ESSEX 6,539
FAIRFIELD 61,160
FARMINGTON 25,524
FRANKLIN 1,955
GLASTONBURY 34,584
GOSHEN 2,891
GRANBY 11,247
GREENWICH 62,359
GRISWOLD 11,719
GROTON 39,261
GUILFORD 22,277
HADDAM 8,260
HAMDEN 61,125
HAMPTON 1,837
HARTFORD 123,243
HARTLAND 2,117
HARWINTON 5,466
HEBRON 9,529
KENT 2,819
KILLINGLY 17,069
KILLINGWORTH 6,419
LEBANON 7,197
LEDYARD 14,911
LISBON 4,281
LITCHFIELD 8,175
LYME 2,355
MADISON 18,151
MANCHESTER 57,873
MANSFIELD 25,969
MARLBOROUGH 6,402
MERIDEN 59,622
MIDDLEBURY 7,641
MIDDLEFIELD 4,387
MIDDLETOWN 46,544
MILFORD 54,054
MONROE 19,658
MONTVILLE 19,231
MORRIS 2,279
NAUGATUCK 31,392
NEW BRITAIN 72,558
NEW CANAAN 20,280
NEW FAIRFIELD 14,005
NEW HARTFORD 6,733
NEW HAVEN 129,934
NEW LONDON 26,984
NEW MILFORD 27,151
NEWINGTON 30,423
NEWTOWN 27,865
NORFOLK 1,632
NORTH BRANFORD 14,198
NORTH CANAAN 3,186
NORTH HAVEN 23,709
NORTH STONINGTON 5,271
NORWALK 88,438
NORWICH 39,556
OLD LYME 7,469
OLD SAYBROOK 10,093
ORANGE 13,912
OXFORD 12,984
PLAINFIELD 15,067
PLAINVILLE 17,677
PLYMOUTH 11,749
POMFRET 4,149
PORTLAND 9,349
PRESTON 4,685
PROSPECT 9,755
PUTNAM 9,333
REDDING 9,216
RIDGEFIELD 25,063
ROCKY HILL 20,119
ROXBURY 2,176
SALEM 4,167
SALISBURY 3,618
SCOTLAND 1,678
SEYMOUR 16,553
SHARON 2,714
SHELTON 41,334
SHERMAN 3,641
SIMSBURY 24,407
SOMERS 11,092
SOUTH WINDSOR 25,737
SOUTHBURY 19,572
SOUTHINGTON 43,685
SPRAGUE 2,921
STAFFORD 11,758
STAMFORD 129,113
STERLING 3,741
STONINGTON 18,647
STRATFORD 52,148
SUFFIELD 15,625
THOMASTON 7,595
THOMPSON 9,266
TOLLAND 14,791
TORRINGTON 34,646
TRUMBULL 36,237
UNION 840
VERNON 29,148
VOLUNTOWN 2,565
WALLINGFORD 44,660
WARREN 1,408
WASHINGTON 3,452
WATERBURY 108,272
WATERFORD 19,101
WATERTOWN 21,790
WEST HARTFORD 62,903
WEST HAVEN 54,516
WESTBROOK 6,933
WESTON 10,302
WESTPORT 27,840
WETHERSFIELD 26,195
WILLINGTON 5,872
WILTON 18,560
WINCHESTER 10,754
WINDHAM 24,727
WINDSOR 28,875
WINDSOR LOCKS 12,512
WOLCOTT 16,643
WOODBRIDGE 8,842
WOODBURY 9,591
WOODSTOCK 7,823
Total: 3,576,452
B - 1
* Source: State Dept. of Public Health

Population Density per Sq. Mile
as of July 1, 2016
ANDOVER 210.5ANSONIA 3,112.1ASHFORD 109.3AVON 793.1BARKHAMSTED 101.1BEACON FALLS 630.4BERLIN 778.7BETHANY 259.7BETHEL 1,162.1BETHLEHEM 177.9BLOOMFIELD 791.3BOLTON 342.2BOZRAH 129.1BRANFORD 1,283.6BRIDGEPORT 9,135.8BRIDGEWATER 100.5BRISTOL 2,277.3BROOKFIELD 864.7BROOKLYN 282.0BURLINGTON 323.3CANAAN 35.8CANTERBURY 126.8CANTON 418.4CHAPLIN 115.6CHESHIRE 885.5CHESTER 265.1CLINTON 799.7COLCHESTER 327.9COLEBROOK 45.4COLUMBIA 254.2CORNWALL 30.0COVENTRY 330.9CROMWELL 1,121.0DANBURY 2,028.8DARIEN 1,718.2
DEEP RIVER 331.7DERBY 2,498.7DURHAM 306.6EAST GRANBY 294.4EAST HADDAM 166.3EAST HAMPTON 361.0EAST HARTFORD 2,791.6EAST HAVEN 2,341.1EAST LYME 555.5EAST WINDSOR 432.6EASTFORD 60.5EASTON 275.8ELLINGTON 471.8ENFIELD 1,333.6ESSEX 628.6FAIRFIELD 2,045.3FARMINGTON 911.1FRANKLIN 100.3GLASTONBURY 674.5GOSHEN 66.3GRANBY 276.5GREENWICH 1,309.5GRISWOLD 337.7GROTON 1,265.2GUILFORD 472.8HADDAM 188.0HAMDEN 1,872.4HAMPTON 73.2HARTFORD 7,090.7HARTLAND 64.0HARWINTON 177.5HEBRON 258.0KENT 58.1KILLINGLY 353.4KILLINGWORTH 181.7
LEBANON 133.0LEDYARD 390.1LISBON 262.8LITCHFIELD 145.7LYME 74.0MADISON 502.1MANCHESTER 2,111.9MANSFIELD 582.3MARLBOROUGH 274.2MERIDEN 2,505.9MIDDLEBURY 430.5MIDDLEFIELD 346.8MIDDLETOWN 1,134.7MILFORD 2,437.6MONROE 754.0MONTVILLE 458.4MORRIS 131.4NAUGATUCK 1,924.9NEW BRITAIN 5,417.6NEW CANAAN 913.7NEW FAIRFIELD 685.1NEW HARTFORD 181.8NEW HAVEN 6,956.2NEW LONDON 4,805.7NEW MILFORD 441.0NEWINGTON 2,315.1NEWTOWN 483.3NORFOLK 36.0NORTH BRANFORD 573.5NORTH CANAAN 163.7NORTH HAVEN 1,137.7NORTH STONINGTON 97.2NORWALK 3,868.7NORWICH 1,409.6OLD LYME 324.5
OLD SAYBROOK 670.9ORANGE 809.7OXFORD 396.6PLAINFIELD 355.7PLAINVILLE 1,820.3PLYMOUTH 536.7POMFRET 102.9PORTLAND 400.4PRESTON 152.0PROSPECT 685.8PUTNAM 459.7REDDING 292.6RIDGEFIELD 726.1ROCKY HILL 1,495.4ROXBURY 82.7SALEM 144.1SALISBURY 63.2SCOTLAND 90.1SEYMOUR 1,140.2SHARON 46.2SHELTON 1,349.6SHERMAN 166.3SIMSBURY 719.5SOMERS 391.0SOUTH WINDSOR 917.1SOUTHBURY 501.9SOUTHINGTON 1,216.4SPRAGUE 220.5STAFFORD 202.6STAMFORD 3,430.3STERLING 137.4STONINGTON 482.4STRATFORD 2,983.1SUFFIELD 369.7THOMASTON 634.6
THOMPSON 197.6TOLLAND 373.3TORRINGTON 871.5TRUMBULL 1,553.7UNION 29.2VERNON 1,646.9VOLUNTOWN 65.8WALLINGFORD 1,144.0WARREN 53.5WASHINGTON 90.7WATERBURY 3,796.5WATERFORD 582.9WATERTOWN 751.2WEST HARTFORD 2,880.6WEST HAVEN 5,072.7WESTBROOK 439.3WESTON 520.3WESTPORT 1,394.9WETHERSFIELD 2,127.9WILLINGTON 176.4WILTON 692.4WINCHESTER 330.8WINDHAM 916.8WINDSOR 978.7WINDSOR LOCKS 1,386.5WOLCOTT 814.4WOODBRIDGE 470.0WOODBURY 263.5WOODSTOCK 129.0
Average:
Median: 459.7
738.6
B - 2

2016 Per Capita Income *
Per Capita
Income
% of State
Average
ANDOVER $41,514 104.0%
ANSONIA $23,937 60.0%
ASHFORD $36,237 90.8%
AVON $67,430 169.0%
BARKHAMSTED $41,218 103.3%
BEACON FALLS $37,459 93.9%
BERLIN $43,536 109.1%
BETHANY $48,496 121.5%
BETHEL $44,782 112.2%
BETHLEHEM $43,639 109.4%
BLOOMFIELD $40,162 100.6%
BOLTON $49,577 124.2%
BOZRAH $36,951 92.6%
BRANFORD $44,298 111.0%
BRIDGEPORT $21,816 54.7%
BRIDGEWATER $66,977 167.8%
BRISTOL $32,374 81.1%
BROOKFIELD $46,949 117.6%
BROOKLYN $28,950 72.5%
BURLINGTON $49,997 125.3%
CANAAN $44,684 112.0%
CANTERBURY $31,856 79.8%
CANTON $49,098 123.0%
CHAPLIN $32,911 82.5%
CHESHIRE $45,164 113.2%
CHESTER $43,323 108.6%
CLINTON $39,178 98.2%
COLCHESTER $41,535 104.1%
Per Capita
Income
% of State
Average
COLEBROOK $34,196 85.7%
COLUMBIA $40,835 102.3%
CORNWALL $48,926 122.6%
COVENTRY $41,516 104.0%
CROMWELL $43,171 108.2%
DANBURY $31,940 80.0%
DARIEN $101,827 255.2%
DEEP RIVER $42,427 106.3%
DERBY $28,846 72.3%
DURHAM $55,752 139.7%
EAST GRANBY $40,309 101.0%
EAST HADDAM $41,148 103.1%
EAST HAMPTON $41,065 102.9%
EAST HARTFORD $25,303 63.4%
EAST HAVEN $32,145 80.6%
EAST LYME $42,997 107.7%
EAST WINDSOR $35,979 90.2%
EASTFORD $36,479 91.4%
EASTON $60,963 152.8%
ELLINGTON $42,602 106.8%
ENFIELD $31,387 78.7%
ESSEX $51,481 129.0%
FAIRFIELD $60,505 151.6%
FARMINGTON $53,899 135.1%
FRANKLIN $41,253 103.4%
GLASTONBURY $58,216 145.9%
GOSHEN $38,776 97.2%
GRANBY $49,999 125.3%
GREENWICH $93,194 233.5%
Per Capita
Income
% of State
Average
GRISWOLD $30,486 76.4%
GROTON $35,810 89.7%
GUILFORD $55,566 139.2%
HADDAM $46,509 116.5%
HAMDEN $35,963 90.1%
HAMPTON $35,327 88.5%
HARTFORD $18,365 46.0%
HARTLAND $39,054 97.9%
HARWINTON $43,034 107.8%
HEBRON $45,072 112.9%
KENT $38,010 95.2%
KILLINGLY $28,911 72.4%
KILLINGWORTH $47,236 118.4%
LEBANON $37,369 93.6%
LEDYARD $40,751 102.1%
LISBON $36,369 91.1%
LITCHFIELD $45,524 114.1%
LYME $57,180 143.3%
MADISON $52,847 132.4%
MANCHESTER $32,919 82.5%
MANSFIELD $20,245 50.7%
MARLBOROUGH $45,136 113.1%
MERIDEN $30,580 76.6%
MIDDLEBURY $45,674 114.5%
MIDDLEFIELD $46,405 116.3%
MIDDLETOWN $35,074 87.9%
MILFORD $41,520 104.0%
MONROE $50,195 125.8%
* Source: U.S. Census Bureau 2012-16 American Community Survey
B - 3

2016 Per Capita Income *
Per Capita
Income
% of State
Average
MONTVILLE $30,669 76.9%
MORRIS $48,291 121.0%
NAUGATUCK $33,551 84.1%
NEW BRITAIN $22,087 55.3%
NEW CANAAN $112,516 282.0%
NEW FAIRFIELD $45,268 113.4%
NEW HARTFORD $38,472 96.4%
NEW HAVEN $23,976 60.1%
NEW LONDON $21,638 54.2%
NEW MILFORD $38,056 95.4%
NEWINGTON $38,255 95.9%
NEWTOWN $49,603 124.3%
NORFOLK $47,128 118.1%
NORTH BRANFORD $42,804 107.3%
NORTH CANAAN $31,390 78.7%
NORTH HAVEN $40,952 102.6%
NORTH STONINGTON $35,713 89.5%
NORWALK $45,387 113.7%
NORWICH $27,825 69.7%
OLD LYME $49,018 122.8%
OLD SAYBROOK $45,791 114.7%
ORANGE $50,659 126.9%
OXFORD $39,670 99.4%
PLAINFIELD $28,422 71.2%
PLAINVILLE $32,839 82.3%
PLYMOUTH $32,522 81.5%
POMFRET $42,246 105.9%
PORTLAND $47,409 118.8%
PRESTON $33,182 83.2%
Per Capita
Income
% of State
Average
PROSPECT $40,031 100.3%
PUTNAM $27,675 69.4%
REDDING $63,762 159.8%
RIDGEFIELD $77,230 193.5%
ROCKY HILL $43,921 110.1%
ROXBURY $81,485 204.2%
SALEM $45,930 115.1%
SALISBURY $55,331 138.7%
SCOTLAND $33,206 83.2%
SEYMOUR $35,632 89.3%
SHARON $66,126 165.7%
SHELTON $43,810 109.8%
SHERMAN $69,917 175.2%
SIMSBURY $54,177 135.8%
SOMERS $35,120 88.0%
SOUTH WINDSOR $46,758 117.2%
SOUTHBURY $43,742 109.6%
SOUTHINGTON $40,761 102.1%
SPRAGUE $31,157 78.1%
STAFFORD $31,606 79.2%
STAMFORD $49,443 123.9%
STERLING $26,903 67.4%
STONINGTON $47,422 118.8%
STRATFORD $35,175 88.1%
SUFFIELD $42,204 105.8%
THOMASTON $31,367 78.6%
THOMPSON $32,669 81.9%
TOLLAND $46,614 116.8%
TORRINGTON $29,455 73.8%
Per Capita
Income
% of State
Average
TRUMBULL $46,622 116.8%
UNION $40,982 102.7%
VERNON $35,137 88.0%
VOLUNTOWN $32,940 82.5%
WALLINGFORD $38,989 97.7%
WARREN $52,380 131.3%
WASHINGTON $65,029 163.0%
WATERBURY $20,762 52.0%
WATERFORD $40,449 101.4%
WATERTOWN $38,530 96.6%
WEST HARTFORD $51,556 129.2%
WEST HAVEN $26,197 65.6%
WESTBROOK $57,737 144.7%
WESTON $93,133 233.4%
WESTPORT $100,501 251.8%
WETHERSFIELD $39,368 98.7%
WILLINGTON $39,056 97.9%
WILTON $82,791 207.5%
WINCHESTER $30,643 76.8%
WINDHAM $18,748 47.0%
WINDSOR $37,228 93.3%
WINDSOR LOCKS $36,587 91.7%
WOLCOTT $34,681 86.9%
WOODBRIDGE $55,644 139.4%
WOODBURY $46,321 116.1%
WOODSTOCK $38,203 95.7%
** State Average ** $39,906 100.0%
* Source: U.S. Census Bureau 2012-16 American Community Survey
B - 4

2016 Median Household Income *
Median
Household
Income
% of State
Median
ANDOVER $100,724 140.4%
ANSONIA $43,386 60.5%
ASHFORD $78,313 109.1%
AVON $124,608 173.7%
BARKHAMSTED $104,899 146.2%
BEACON FALLS $84,570 117.9%
BERLIN $93,750 130.7%
BETHANY $106,058 147.8%
BETHEL $94,292 131.4%
BETHLEHEM $87,056 121.3%
BLOOMFIELD $74,107 103.3%
BOLTON $91,087 126.9%
BOZRAH $84,698 118.0%
BRANFORD $71,619 99.8%
BRIDGEPORT $43,137 60.1%
BRIDGEWATER $103,393 144.1%
BRISTOL $61,551 85.8%
BROOKFIELD $106,278 148.1%
BROOKLYN $74,375 103.7%
BURLINGTON $117,069 163.2%
CANAAN $72,174 100.6%
CANTERBURY $81,496 113.6%
CANTON $87,404 121.8%
CHAPLIN $80,000 111.5%
CHESHIRE $108,559 151.3%
CHESTER $76,648 106.8%
CLINTON $74,022 103.2%
COLCHESTER $99,257 138.3%
Median
Household
Income
% of State
Median
COLEBROOK $81,184 113.1%
COLUMBIA $92,981 129.6%
CORNWALL $74,107 103.3%
COVENTRY $88,967 124.0%
CROMWELL $83,739 116.7%
DANBURY $67,430 94.0%
DARIEN $208,125 290.0%
DEEP RIVER $69,861 97.4%
DERBY $55,316 77.1%
DURHAM $114,491 159.6%
EAST GRANBY $88,559 123.4%
EAST HADDAM $79,668 111.0%
EAST HAMPTON $95,923 133.7%
EAST HARTFORD $50,750 70.7%
EAST HAVEN $63,137 88.0%
EAST LYME $85,872 119.7%
EAST WINDSOR $74,784 104.2%
EASTFORD $78,309 109.1%
EASTON $133,356 185.8%
ELLINGTON $79,917 111.4%
ENFIELD $71,526 99.7%
ESSEX $89,950 125.4%
FAIRFIELD $122,135 170.2%
FARMINGTON $95,158 132.6%
FRANKLIN $93,438 130.2%
GLASTONBURY $108,600 151.3%
GOSHEN $95,219 132.7%
GRANBY $109,901 153.2%
GREENWICH $134,223 187.1%
Median
Household
Income
% of State
Median
GRISWOLD $57,312 79.9%
GROTON $64,074 89.3%
GUILFORD $102,199 142.4%
HADDAM $99,258 138.3%
HAMDEN $71,665 99.9%
HAMPTON $73,684 102.7%
HARTFORD $32,095 44.7%
HARTLAND $89,438 124.6%
HARWINTON $93,770 130.7%
HEBRON $110,739 154.3%
KENT $61,875 86.2%
KILLINGLY $60,548 84.4%
KILLINGWORTH $103,295 144.0%
LEBANON $88,125 122.8%
LEDYARD $84,821 118.2%
LISBON $86,833 121.0%
LITCHFIELD $80,951 112.8%
LYME $89,643 124.9%
MADISON $105,673 147.3%
MANCHESTER $65,592 91.4%
MANSFIELD $63,391 88.3%
MARLBOROUGH $103,276 143.9%
MERIDEN $55,547 77.4%
MIDDLEBURY $103,235 143.9%
MIDDLEFIELD $103,262 143.9%
MIDDLETOWN $63,828 89.0%
MILFORD $81,844 114.1%
MONROE $113,333 157.9%
* Source: U.S. Census Bureau 2012-16 American Community Survey
B - 5

2016 Median Household Income *
Median
Household
Income
% of State
Median
MONTVILLE $73,160 102.0%
MORRIS $82,031 114.3%
NAUGATUCK $59,522 83.0%
NEW BRITAIN $41,844 58.3%
NEW CANAAN $176,601 246.1%
NEW FAIRFIELD $101,392 141.3%
NEW HARTFORD $92,970 129.6%
NEW HAVEN $38,126 53.1%
NEW LONDON $35,357 49.3%
NEW MILFORD $81,350 113.4%
NEWINGTON $80,315 111.9%
NEWTOWN $110,036 153.3%
NORFOLK $73,804 102.9%
NORTH BRANFORD $85,357 119.0%
NORTH CANAAN $75,690 105.5%
NORTH HAVEN $93,696 130.6%
NORTH STONINGTON $75,091 104.6%
NORWALK $80,896 112.7%
NORWICH $51,758 72.1%
OLD LYME $87,971 122.6%
OLD SAYBROOK $75,237 104.9%
ORANGE $106,475 148.4%
OXFORD $99,311 138.4%
PLAINFIELD $65,254 90.9%
PLAINVILLE $61,907 86.3%
PLYMOUTH $70,635 98.4%
POMFRET $88,906 123.9%
PORTLAND $81,589 113.7%
PRESTON $69,439 96.8%
Median
Household
Income
% of State
Median
PROSPECT $103,659 144.5%
PUTNAM $52,224 72.8%
REDDING $129,643 180.7%
RIDGEFIELD $145,014 202.1%
ROCKY HILL $81,988 114.3%
ROXBURY $110,625 154.2%
SALEM $104,732 146.0%
SALISBURY $74,853 104.3%
SCOTLAND $86,397 120.4%
SEYMOUR $79,734 111.1%
SHARON $82,714 115.3%
SHELTON $87,277 121.6%
SHERMAN $111,667 155.6%
SIMSBURY $110,099 153.4%
SOMERS $94,765 132.1%
SOUTH WINDSOR $100,122 139.5%
SOUTHBURY $85,068 118.6%
SOUTHINGTON $88,214 122.9%
SPRAGUE $65,861 91.8%
STAFFORD $63,681 88.7%
STAMFORD $81,634 113.8%
STERLING $68,776 95.8%
STONINGTON $78,274 109.1%
STRATFORD $69,336 96.6%
SUFFIELD $99,098 138.1%
THOMASTON $65,901 91.8%
THOMPSON $68,869 96.0%
TOLLAND $109,382 152.4%
TORRINGTON $58,717 81.8%
Median
Household
Income
% of State
Median
TRUMBULL $112,674 157.0%
UNION $88,125 122.8%
VERNON $61,099 85.1%
VOLUNTOWN $81,023 112.9%
WALLINGFORD $75,942 105.8%
WARREN $92,083 128.3%
WASHINGTON $82,418 114.9%
WATERBURY $39,681 55.3%
WATERFORD $78,382 109.2%
WATERTOWN $76,175 106.2%
WEST HARTFORD $91,875 128.0%
WEST HAVEN $50,831 70.8%
WESTBROOK $92,721 129.2%
WESTON $218,152 304.0%
WESTPORT $166,307 231.8%
WETHERSFIELD $78,371 109.2%
WILLINGTON $72,237 100.7%
WILTON $179,844 250.6%
WINCHESTER $57,429 80.0%
WINDHAM $40,603 56.6%
WINDSOR $82,707 115.3%
WINDSOR LOCKS $66,494 92.7%
WOLCOTT $83,828 116.8%
WOODBRIDGE $136,786 190.6%
WOODBURY $79,387 110.6%
WOODSTOCK $84,700 118.0%
** State Median ** $71,755 100.0%
* Source: U.S. Census Bureau 2012-16 American Community Survey
B - 6

Ratings for the 111 municipalities rated by Moody's Investment Services as of November, 2017. Hamden and Scotland rating updated in December, 2017.
B - 7
1
1
2
3
1
1
8
21
43
13
17
0 5 10 15 20 25 30 35 40 45 50
Caa3 Rating
Baa3 Rating
Baa2 Rating
Baa1 Rating
A3 Rating
A2 Rating
A1 Rating
Aa3 Rating
Aa2 Rating
Aa1 Rating
Aaa Rating
Number of Municipalities Within Rating
Moody's Bond Ratings

Moody's Bond Ratings by Rating Categories, November, 2017
Aaa Rated Municipalities Aa Rated Municipalities
(17) (77)
A Rated Municipalities
(10)
Baa Rated Municipalities
(6)
(1)
Caa Rated Municipalities
CHESHIRE Aa1
DANBURY Aa1
MANCHESTER Aa1
MILFORD Aa1
NEW FAIRFIELD Aa1
NEW MILFORD Aa1
NEWTOWN Aa1
NORTH HAVEN Aa1
ORANGE Aa1
REDDING Aa1
STAMFORD Aa1
STONINGTON Aa1
WINDSOR LOCKS Aa1
BERLIN Aa2
BETHANY Aa2
BLOOMFIELD Aa2
BRISTOL Aa2
BROOKFIELD Aa2
CANTON Aa2
CLINTON Aa2
COLUMBIA Aa2
CORNWALL Aa2
COVENTRY Aa2
EAST GRANBY Aa2
EAST LYME Aa2
EAST WINDSOR Aa2
ENFIELD Aa2
ESSEX Aa2
GROTON Aa2
GUILFORD Aa2
KENT Aa2
LEDYARD Aa2
LITCHFIELD Aa2
MANSFIELD Aa2
MARLBOROUGH Aa2
MIDDLEBURY Aa2
MIDDLETOWN Aa2
MONROE Aa2
NORTH BRANFORD Aa2
NORWICH Aa2
OLD SAYBROOK Aa2
OXFORD Aa2
SHARON Aa2
SHELTON Aa2
SHERMAN Aa2
SOMERS Aa2
SOUTH WINDSOR Aa2
SOUTHBURY Aa2
TRUMBULL Aa2
VERNON Aa2
WARREN Aa2
WATERFORD Aa2
WATERTOWN Aa2
WESTBROOK Aa2
WETHERSFIELD Aa2
WOODBURY Aa2
ANSONIA Aa3
ASHFORD Aa3
BOLTON Aa3
COLCHESTER Aa3
EAST HARTFORD Aa3
ELLINGTON Aa3
GROTON (City of) Aa3
HADDAM Aa3
KILLINGLY Aa3
LISBON Aa3
MONTVILLE Aa3
NAUGATUCK Aa3
NEW HARTFORD Aa3
PLAINFIELD Aa3
PLAINVILLE Aa3
PORTLAND Aa3
THOMASTON Aa3
TORRINGTON Aa3
WILLINGTON Aa3
WINDHAM Aa3
WOODSTOCK Aa3
A1HARTLAND
A1SALEM
A1STAFFORD
A1STERLING
A1STRATFORD
A1THOMPSON
A1WATERBURY
A1WOLCOTT
A2SCOTLAND
A3EAST HAVEN
HARTFORD Caa3
BRIDGEPORT Baa1
NEW HAVEN Baa1
SPRAGUE Baa1
HAMDEN Baa2
NEW BRITAIN Baa2
WEST HAVEN Baa3
AVON Aaa
DARIEN Aaa
FAIRFIELD Aaa
FARMINGTON Aaa
GLASTONBURY Aaa
GREENWICH Aaa
MADISON Aaa
NEW CANAAN Aaa
NORWALK Aaa
RIDGEFIELD Aaa
SIMSBURY Aaa
WALLINGFORD Aaa
WEST HARTFORD Aaa
WESTON Aaa
WESTPORT Aaa
WILTON Aaa
WOODBRIDGE Aaa
B - 8 See page A - 13 for an explanation of Moody's Bond Ratings. Moody's Rating for Hamden and Scotland were updated in December, 2017.

Debt per Capita - Bonds / Pensions - FYE 2016
Debt per Capita by Source:
Bonds Pension* Total
ANDOVER $925 $171 $1,096ANSONIA $350 $364 $713ASHFORD $744 $0 $744AVON $1,350 $1,492 $2,842BARKHAMSTED $1,013 $0 $1,013BEACON FALLS $3,532 $123 $3,655BERLIN $4,094 $278 $4,372BETHANY $1,969 $83 $2,052BETHEL $1,479 $541 $2,019BETHLEHEM $0 $0 $0BLOOMFIELD $2,572 $1,715 $4,286BOLTON $2,291 $0 $2,291BOZRAH $1,132 $157 $1,289BRANFORD $1,326 $540 $1,866BRIDGEPORT $4,299 $2,499 $6,798BRIDGEWATER $169 $0 $169BRISTOL $1,001 $157 $1,158BROOKFIELD $1,921 $294 $2,216BROOKLYN $642 $302 $944BURLINGTON $1,644 $69 $1,714CANAAN $2,616 $0 $2,616CANTERBURY $65 $52 $117CANTON $1,714 $755 $2,469CHAPLIN $44 $0 $44CHESHIRE $2,318 $1,291 $3,610CHESTER $813 $196 $1,009CLINTON $3,444 $914 $4,358COLCHESTER $786 $33 $819COLEBROOK $471 $0 $471COLUMBIA $147 $0 $147CORNWALL $1,251 $0 $1,251COVENTRY $1,616 $275 $1,890CROMWELL $1,494 $432 $1,926DANBURY $1,767 $1,417 $3,185
Debt per Capita by Source:
Bonds Pension* Total
DARIEN $3,291 $0 $3,291DEEP RIVER $764 $382 $1,147DERBY $1,181 $665 $1,847DURHAM $835 $162 $997EAST GRANBY $1,120 $0 $1,120EAST HADDAM $1,721 $54 $1,775EAST HAMPTON $2,242 $812 $3,054EAST HARTFORD $1,158 $3,601 $4,759EAST HAVEN $932 $57 $989EAST LYME $2,780 $348 $3,128EAST WINDSOR $560 $484 $1,044EASTFORD $87 $0 $87EASTON $3,370 $628 $3,997ELLINGTON $1,272 $178 $1,450ENFIELD $1,353 $415 $1,768ESSEX $1,882 $450 $2,332FAIRFIELD $3,202 $811 $4,013FARMINGTON $1,545 $1,297 $2,841FRANKLIN $726 $0 $726GLASTONBURY $2,113 $1,604 $3,717GOSHEN $517 $33 $550GRANBY $2,024 $354 $2,378GREENWICH $2,425 $2,625 $5,050GRISWOLD $1,264 $243 $1,507GROTON $1,269 $516 $1,785GUILFORD $3,843 $441 $4,284HADDAM $979 $182 $1,161HAMDEN $4,781 $4,815 $9,596HAMPTON $0 $0 $0HARTFORD $5,669 $3,343 $9,012HARTLAND $291 $0 $291HARWINTON $1,081 $35 $1,117HEBRON $1,573 $0 $1,573KENT $1,375 $0 $1,375
Debt per Capita by Source:
Bonds Pension* Total
KILLINGLY $1,994 $0 $1,994KILLINGWORTH $1,203 $218 $1,421LEBANON $317 $91 $408LEDYARD $1,322 $427 $1,749LISBON $655 $0 $655LITCHFIELD $2,612 $614 $3,227LYME $4,237 $0 $4,237MADISON $1,423 $696 $2,119MANCHESTER $1,591 $986 $2,577MANSFIELD $171 $236 $407MARLBOROUGH $2,855 $0 $2,855MERIDEN $1,842 $2,511 $4,352MIDDLEBURY $1,349 $711 $2,060MIDDLEFIELD $1,232 $100 $1,332MIDDLETOWN $1,855 $0 $1,855MILFORD $2,830 $1,390 $4,220MONROE $2,089 $395 $2,484MONTVILLE $1,844 $319 $2,164MORRIS $597 $250 $847NAUGATUCK $3,236 $1,453 $4,688NEW BRITAIN $3,340 $948 $4,288NEW CANAAN $5,936 $0 $5,936NEW FAIRFIELD $1,624 $119 $1,743NEW HARTFORD $1,395 $246 $1,641NEW HAVEN $4,593 $5,421 $10,014NEW LONDON $1,837 $882 $2,720NEW MILFORD $527 $656 $1,182NEWINGTON $206 $1,822 $2,028NEWTOWN $2,479 $484 $2,963NORFOLK $1,016 $0 $1,016NORTH BRANFORD $2,593 $818 $3,410NORTH CANAAN $642 $0 $642NORTH HAVEN $3,054 $1,715 $4,770NORTH STONINGTON $57 $0 $57NORWALK $2,396 $1,468 $3,864
B - 9
* Pension Debt based upon the Net Pension Liability reported in municipal audit reports as of June 30, 2016

Debt per Capita - Bonds / Pensions - FYE 2016
Debt per Capita by Source:
Bonds Pension* Total
NORWICH $1,245 $1,977 $3,222OLD LYME $4,011 $0 $4,011OLD SAYBROOK $3,495 $1,826 $5,321ORANGE $3,054 $895 $3,949OXFORD $1,612 $300 $1,912PLAINFIELD $641 $363 $1,004PLAINVILLE $2,470 $381 $2,851PLYMOUTH $1,865 $1,225 $3,091POMFRET $1,777 $0 $1,777PORTLAND $1,350 $1,160 $2,510PRESTON $1,149 $103 $1,253PROSPECT $2,279 $39 $2,319PUTNAM $69 $0 $69REDDING $2,134 $485 $2,619RIDGEFIELD $3,176 $177 $3,353ROCKY HILL $1,316 $390 $1,706ROXBURY $208 $0 $208SALEM $1,131 $0 $1,131SALISBURY $901 $42 $943SCOTLAND $1,472 $0 $1,472SEYMOUR $2,135 $124 $2,259SHARON $2,425 $0 $2,425SHELTON $1,108 $48 $1,156SHERMAN $2,060 $0 $2,060SIMSBURY $1,298 $821 $2,120SOMERS $1,351 $110 $1,461SOUTH WINDSOR $2,523 $912 $3,435SOUTHBURY $781 $275 $1,055SOUTHINGTON $2,996 $235 $3,231SPRAGUE $3,086 $0 $3,086STAFFORD $3,260 $683 $3,943STAMFORD $3,247 $1,594 $4,841STERLING $1,950 $0 $1,950STONINGTON $2,093 $262 $2,355STRATFORD $5,390 $1,310 $6,700
Debt per Capita by Source:
Bonds Pension* Total
SUFFIELD $943 $649 $1,592THOMASTON $3,209 $739 $3,948THOMPSON $1,062 $140 $1,202TOLLAND $3,112 $0 $3,112TORRINGTON $635 $1,336 $1,971TRUMBULL $2,491 $2,464 $4,955UNION $3,063 $0 $3,063VERNON $1,581 $1,878 $3,459VOLUNTOWN $0 $0 $0WALLINGFORD $768 $361 $1,129WARREN $1,978 $236 $2,214WASHINGTON $179 $148 $327WATERBURY $4,158 $1,945 $6,104WATERFORD $4,487 $643 $5,131WATERTOWN $2,361 $479 $2,839WEST HARTFORD $2,364 $3,747 $6,110WEST HAVEN $2,208 $936 $3,144WESTBROOK $2,738 $302 $3,040WESTON $3,826 $726 $4,552WESTPORT $3,626 $1,508 $5,134WETHERSFIELD $2,082 $920 $3,002WILLINGTON $635 $22 $657WILTON $4,510 $534 $5,044WINCHESTER $323 $954 $1,277WINDHAM $677 $284 $961WINDSOR $1,334 $532 $1,867WINDSOR LOCKS $1,684 $471 $2,156WOLCOTT $1,733 $802 $2,534WOODBRIDGE $3,548 $547 $4,095WOODBURY $705 $609 $1,314WOODSTOCK $474 $134 $608
$2,480 $1,350** Average ** $3,831
B - 10
* Pension Debt based upon the Net Pension Liability reported in municipal audit reports as of June 30, 2016

Ratio of Bonded Debt to
Equalized Net Grand List and
Net Grand List*
Debt as a % of:
ENGL Net GL
ANDOVER 0.8% 1.1%ANSONIA 0.5% 0.7%ASHFORD 0.7% 1.1%AVON 0.7% 1.0%BARKHAMSTED 0.8% 1.1%BEACON FALLS 3.3% 4.5%BERLIN 2.7% 3.9%BETHANY 1.3% 2.0%BETHEL 1.0% 1.5%BETHLEHEM 0.0% 0.0%BLOOMFIELD 1.8% 2.6%BOLTON 1.8% 2.6%BOZRAH 1.0% 1.3%BRANFORD 0.7% 1.1%BRIDGEPORT 7.1% 8.8%BRIDGEWATER 0.1% 0.1%BRISTOL 1.1% 1.6%BROOKFIELD 1.0% 1.5%BROOKLYN 0.7% 1.0%BURLINGTON 1.2% 1.8%CANAAN 1.3% 1.8%CANTERBURY 0.1% 0.1%CANTON 1.1% 1.6%CHAPLIN 0.0% 0.1%CHESHIRE 1.6% 2.5%CHESTER 0.6% 0.8%CLINTON 2.1% 3.0%COLCHESTER 0.7% 1.1%COLEBROOK 0.3% 0.4%COLUMBIA 0.1% 0.2%CORNWALL 0.4% 0.4%COVENTRY 1.5% 2.2%CROMWELL 1.1% 1.6%DANBURY 1.5% 2.2%
Debt as a % of:
ENGL Net GL
DARIEN 0.5% 0.9%DEEP RIVER 0.5% 0.7%DERBY 1.5% 2.0%DURHAM 0.6% 0.8%EAST GRANBY 0.6% 1.0%EAST HADDAM 1.3% 1.8%EAST HAMPTON 1.7% 2.5%EAST HARTFORD 1.5% 2.2%EAST HAVEN 1.0% 1.3%EAST LYME 1.7% 2.5%EAST WINDSOR 0.5% 0.7%EASTFORD 0.1% 0.1%EASTON 1.3% 1.9%ELLINGTON 1.1% 1.6%ENFIELD 1.4% 2.1%ESSEX 0.8% 1.2%FAIRFIELD 1.2% 1.8%FARMINGTON 0.8% 1.1%FRANKLIN 0.5% 0.7%GLASTONBURY 1.2% 1.9%GOSHEN 0.2% 0.3%GRANBY 1.6% 2.4%GREENWICH 0.3% 0.5%GRISWOLD 1.5% 2.1%GROTON 0.9% 1.3%GUILFORD 1.9% 2.8%HADDAM 0.6% 0.9%HAMDEN 5.2% 7.2%HAMPTON 0.0% 0.0%HARTFORD 10.8% 19.3%HARTLAND 0.2% 0.3%HARWINTON 0.8% 1.1%HEBRON 1.4% 1.9%KENT 0.5% 0.7%
Debt as a % of:
ENGL Net GL
KILLINGLY 2.1% 3.1%KILLINGWORTH 0.7% 1.1%LEBANON 0.3% 0.4%LEDYARD 1.3% 1.7%LISBON 0.5% 0.8%LITCHFIELD 1.5% 2.1%LYME 1.4% 1.9%MADISON 0.6% 0.9%MANCHESTER 1.6% 2.3%MANSFIELD 0.3% 0.4%MARLBOROUGH 2.2% 3.2%MERIDEN 2.4% 3.4%MIDDLEBURY 0.8% 1.1%MIDDLEFIELD 0.9% 1.3%MIDDLETOWN 1.8% 2.6%MILFORD 1.7% 2.4%MONROE 1.3% 1.9%MONTVILLE 1.9% 2.8%MORRIS 0.3% 0.5%NAUGATUCK 4.5% 6.4%NEW BRITAIN 6.6% 9.9%NEW CANAAN 1.0% 1.5%NEW FAIRFIELD 1.0% 1.4%NEW HARTFORD 1.0% 1.4%NEW HAVEN 6.1% 9.8%NEW LONDON 2.7% 4.0%NEW MILFORD 0.3% 0.5%NEWINGTON 0.2% 0.2%NEWTOWN 1.5% 2.2%NORFOLK 0.4% 0.6%NORTH BRANFORD 2.0% 2.9%NORTH CANAAN 0.5% 0.6%NORTH HAVEN 1.8% 2.6%NORTH STONINGTON 0.0% 0.1%NORWALK 1.2% 1.8%
Debt as a % of:
ENGL Net GL
NORWICH 1.8% 2.7%OLD LYME 1.3% 1.9%OLD SAYBROOK 1.1% 1.6%ORANGE 1.5% 2.2%OXFORD 1.0% 1.5%PLAINFIELD 0.7% 1.1%PLAINVILLE 2.3% 3.2%PLYMOUTH 2.1% 2.9%POMFRET 1.6% 2.0%PORTLAND 1.1% 1.6%PRESTON 1.0% 1.4%PROSPECT 1.8% 2.7%PUTNAM 0.1% 0.1%REDDING 0.9% 1.2%RIDGEFIELD 1.1% 1.7%ROCKY HILL 0.8% 1.3%ROXBURY 0.0% 0.1%SALEM 0.9% 1.3%SALISBURY 0.2% 0.3%SCOTLAND 1.6% 2.2%SEYMOUR 2.1% 2.9%SHARON 0.7% 0.9%SHELTON 0.7% 1.0%SHERMAN 0.8% 1.1%SIMSBURY 0.9% 1.4%SOMERS 1.2% 1.7%SOUTH WINDSOR 1.8% 2.6%SOUTHBURY 0.5% 0.7%SOUTHINGTON 2.3% 3.4%SPRAGUE 3.5% 5.3%STAFFORD 3.5% 5.0%STAMFORD 1.3% 2.2%STERLING 2.3% 3.2%STONINGTON 1.0% 1.5%STRATFORD 4.4% 6.3%
Debt as a % of:
ENGL Net GL
SUFFIELD 0.7% 1.1%THOMASTON 3.2% 4.5%THOMPSON 1.2% 1.7%TOLLAND 2.6% 3.7%TORRINGTON 0.8% 1.1%TRUMBULL 1.3% 2.0%UNION 2.2% 2.9%VERNON 1.8% 2.6%VOLUNTOWN 0.0% 0.0%WALLINGFORD 0.6% 0.8%WARREN 0.5% 0.8%WASHINGTON 0.0% 0.1%WATERBURY 8.1% 11.0%WATERFORD 1.8% 2.7%WATERTOWN 2.0% 3.0%WEST HARTFORD 1.6% 2.5%WEST HAVEN 3.0% 4.2%WESTBROOK 1.1% 1.6%WESTON 1.1% 1.7%WESTPORT 0.6% 1.0%WETHERSFIELD 1.8% 2.5%WILLINGTON 0.6% 0.8%WILTON 1.3% 1.9%WINCHESTER 0.4% 0.5%WINDHAM 1.3% 1.9%WINDSOR 0.9% 1.4%WINDSOR LOCKS 1.2% 1.8%WOLCOTT 1.6% 2.3%WOODBRIDGE 1.9% 2.7%WOODBURY 0.4% 0.6%WOODSTOCK 0.4% 0.5%
1.6% 2.4%** Average **** Median ** 1.1% 1.6%
B - 11
* Based upon the 10/1/14 Grand list

0
10
20
30
40
50
60
70
FY 2013‐14 FY 2014‐15 FY 2015‐16$13,000 and Under 15 6 2
$13,000 ‐ $14,000 27 23 17
$14,000 ‐ $16,000 65 59 49
$16,000 ‐ $18,000 35 48 49
$18,000 ‐ $20,000 15 19 33
$20,000 and Over 12 14 19
Education Spending LevelsNum
ber o
f Mun
icipalities
B - 12 Data based upon the Net Current Expenditures per Pupil as provided by the State Dept. of Education

Net Current Education Expenditures per Pupil
FYE 2014-2016 *
2015-16 2013-142014-15
ANDOVER $14,038$16,040 $14,735
ANSONIA $12,984$13,972 $13,217
ASHFORD $16,803$19,089 $17,817
AVON $14,340$15,726 $15,389
BARKHAMSTED $14,016$16,782 $14,627
BEACON FALLS $14,011$15,391 $15,129
BERLIN $14,760$15,776 $14,964
BETHANY $15,843$17,428 $16,690
BETHEL $14,932$15,775 $15,707
BETHLEHEM $17,455$19,603 $18,713
BLOOMFIELD $20,055$21,160 $19,742
BOLTON $15,900$17,490 $16,738
BOZRAH $15,383$17,519 $17,195
BRANFORD $15,610$17,233 $16,305
BRIDGEPORT $13,879$14,344 $13,920
BRIDGEWATER $26,137$29,202 $28,271
BRISTOL $13,089$13,894 $13,625
BROOKFIELD $13,649$14,125 $13,943
BROOKLYN $13,206$14,483 $13,818
BURLINGTON $13,141$14,440 $13,676
CANAAN $24,951$28,947 $25,910
CANTERBURY $17,077$17,525 $17,393
CANTON $14,325$15,729 $15,275
CHAPLIN $19,033$20,128 $19,939
CHESHIRE $13,565$15,237 $14,342
CHESTER $16,884$18,272 $17,385
CLINTON $15,074$16,793 $15,947
COLCHESTER $13,788$14,716 $14,253
2015-16 2013-142014-15
COLEBROOK $16,224$18,331 $17,621
COLUMBIA $17,095$17,475 $17,251
CORNWALL $25,698$30,193 $30,364
COVENTRY $14,636$15,502 $14,904
CROMWELL $13,264$13,928 $13,488
DANBURY $12,683$12,794 $12,728
DARIEN $17,510$19,314 $18,546
DEEP RIVER $16,422$17,678 $16,992
DERBY $12,990$15,376 $16,605
DURHAM $17,176$19,463 $17,973
EAST GRANBY $16,463$18,921 $17,552
EAST HADDAM $15,637$17,907 $16,966
EAST HAMPTON $14,105$14,705 $14,633
EAST HARTFORD $12,784$13,437 $13,132
EAST HAVEN $14,468$15,849 $15,064
EAST LYME $14,989$15,631 $15,235
EAST WINDSOR $15,820$19,093 $17,273
EASTFORD $17,779$20,643 $19,388
EASTON $17,153$19,233 $17,645
ELLINGTON $12,192$12,984 $12,617
ENFIELD $13,572$13,894 $13,732
ESSEX $15,958$19,087 $17,143
FAIRFIELD $15,187$16,561 $15,920
FARMINGTON $15,132$16,237 $15,831
FRANKLIN $14,701$15,319 $15,312
GLASTONBURY $14,233$15,729 $15,132
GOSHEN $18,007$19,685 $19,280
GRANBY $13,268$14,547 $14,332
GREENWICH $20,747$21,238 $21,687
2015-16 2013-142014-15
GRISWOLD $13,058$13,898 $14,185
GROTON $14,698$15,530 $15,230
GUILFORD $15,359$16,865 $16,458
HADDAM $15,070$17,165 $16,147
HAMDEN $16,245$18,366 $17,343
HAMPTON $20,471$21,926 $21,327
HARTFORD $18,731$19,313 $19,360
HARTLAND $18,268$18,480 $17,392
HARWINTON $13,141$14,440 $13,676
HEBRON $13,282$15,336 $14,522
KENT $20,212$23,589 $22,643
KILLINGLY $15,838$16,732 $16,690
KILLINGWORTH $15,070$17,165 $16,147
LEBANON $16,019$17,705 $16,552
LEDYARD $13,352$15,146 $14,515
LISBON $15,070$17,042 $15,902
LITCHFIELD $16,717$18,526 $17,328
LYME $18,104$19,634 $19,033
MADISON $14,979$16,955 $15,917
MANCHESTER $14,905$16,249 $15,379
MANSFIELD $16,271$17,513 $17,161
MARLBOROUGH $12,072$13,628 $12,720
MERIDEN $13,051$13,956 $13,325
MIDDLEBURY $14,645$16,619 $15,722
MIDDLEFIELD $17,176$19,463 $17,973
MIDDLETOWN $15,001$16,453 $15,669
MILFORD $16,964$18,431 $17,645
MONROE $15,066$16,371 $15,629
B - 13
* The data for FY 2015-16 is the latest available from the State Dept. of Education at the time of this publication; however, it is not considered the final figures.

Net Current Education Expenditures per Pupil
FYE 2014-2016 *
2015-16 2013-142014-15
MONTVILLE $14,225$15,320 $14,520
MORRIS $18,007$19,685 $19,280
NAUGATUCK $14,079$15,068 $14,762
NEW BRITAIN $12,918$13,196 $13,034
NEW CANAAN $18,173$19,576 $19,171
NEW FAIRFIELD $13,418$14,994 $14,441
NEW HARTFORD $14,604$16,473 $15,940
NEW HAVEN $17,060$18,367 $17,283
NEW LONDON $14,840$16,730 $15,298
NEW MILFORD $12,985$14,017 $13,680
NEWINGTON $15,064$16,294 $15,533
NEWTOWN $14,919$15,871 $15,428
NORFOLK $19,613$20,763 $20,148
NORTH BRANFORD $13,424$15,076 $14,269
NORTH CANAAN $19,256$22,236 $21,665
NORTH HAVEN $14,039$15,345 $14,741
NORTH STONINGTON $15,312$16,027 $15,462
NORWALK $16,531$17,094 $16,867
NORWICH $15,056$16,260 $15,587
OLD LYME $18,104$19,634 $19,033
OLD SAYBROOK $16,767$18,835 $17,249
ORANGE $15,755$17,266 $16,382
OXFORD $13,423$13,883 $13,846
PLAINFIELD $13,384$14,522 $13,857
PLAINVILLE $15,023$15,104 $14,784
PLYMOUTH $13,315$14,370 $13,679
POMFRET $16,079$16,902 $16,793
PORTLAND $13,434$14,539 $14,319
PRESTON $17,109$16,613 $17,032
2015-16 2013-142014-15
PROSPECT $14,011$15,391 $15,129
PUTNAM $15,947$16,911 $16,670
REDDING $19,576$21,233 $20,431
RIDGEFIELD $15,756$17,013 $16,523
ROCKY HILL $14,292$14,522 $14,497
ROXBURY $26,137$29,202 $28,271
SALEM $17,299$17,215 $16,916
SALISBURY $22,044$23,568 $24,067
SCOTLAND $20,087$22,800 $21,015
SEYMOUR $13,097$14,385 $13,708
SHARON $25,886$28,608 $27,751
SHELTON $12,940$13,401 $13,249
SHERMAN $15,248$17,224 $16,514
SIMSBURY $15,086$16,036 $15,423
SOMERS $13,732$15,122 $14,286
SOUTH WINDSOR $15,680$16,835 $16,051
SOUTHBURY $14,645$16,619 $15,722
SOUTHINGTON $12,962$13,811 $13,370
SPRAGUE $13,652$13,391 $13,393
STAFFORD $16,466$17,180 $16,562
STAMFORD $17,104$18,063 $17,409
STERLING $12,669$13,470 $13,042
STONINGTON $14,452$16,128 $15,262
STRATFORD $13,190$14,631 $14,092
SUFFIELD $14,161$15,698 $14,646
THOMASTON $15,043$14,958 $14,103
THOMPSON $14,879$16,657 $16,328
TOLLAND $12,992$14,495 $13,567
TORRINGTON $15,651$16,283 $15,899
2015-16 2013-142014-15
TRUMBULL $14,504$15,417 $15,078
UNION $15,969$17,216 $17,816
VERNON $14,301$15,707 $15,010
VOLUNTOWN $15,830$19,440 $16,001
WALLINGFORD $16,983$16,831 $15,440
WARREN $18,007$19,685 $19,280
WASHINGTON $26,137$29,202 $28,271
WATERBURY $14,801$15,219 $15,014
WATERFORD $15,153$15,871 $15,649
WATERTOWN $13,221$14,243 $13,928
WEST HARTFORD $13,972$15,022 $14,579
WEST HAVEN $12,454$13,825 $12,983
WESTBROOK $19,226$22,590 $19,870
WESTON $19,414$20,759 $19,995
WESTPORT $18,864$19,800 $19,748
WETHERSFIELD $14,215$15,097 $14,704
WILLINGTON $16,686$18,017 $17,645
WILTON $17,568$19,337 $18,490
WINCHESTER $17,015$18,343 $17,738
WINDHAM $16,852$18,977 $18,865
WINDSOR $16,444$17,286 $17,113
WINDSOR LOCKS $17,707$19,086 $18,532
WOLCOTT $12,031$13,377 $12,967
WOODBRIDGE $16,467$17,736 $16,213
WOODBURY $17,455$19,603 $18,713
WOODSTOCK $12,220$13,677 $12,444
** Average **
** Median ** $15,917$16,657
$15,179$16,245 $15,720
$15,074
B - 14
* The data for FY 2015-16 is the latest available from the State Dept. of Education at the time of this publication; however, it is not considered the final figures.

Tax Collection Rates FYE 2016 *
Current Yr
Collected
as a % of
Curr Levy
Total
Collected
as a %
of Total
Outstanding
Total
Collected
as a % of
Curr Levy
98.5% 98.0%99.4%ANDOVER
96.7% 92.6%98.3%ANSONIA
98.2% 93.4%99.9%ASHFORD
99.7% 99.5%100.0%AVON
97.3% 91.8%98.8%BARKHAMSTED
97.4% 93.5%99.5%BEACON FALLS
98.9% 97.8%99.6%BERLIN
98.8% 98.0%100.2%BETHANY
98.8% 98.2%99.8%BETHEL
98.1% 94.1%100.7%BETHLEHEM
98.7% 98.0%99.8%BLOOMFIELD
98.9% 98.7%99.5%BOLTON
97.9% 95.2%100.4%BOZRAH
98.5% 96.3%99.7%BRANFORD
98.3% 86.3%98.9%BRIDGEPORT
99.7% 99.5%99.9%BRIDGEWATER
98.1% 97.0%99.4%BRISTOL
99.2% 98.7%100.1%BROOKFIELD
98.6% 97.8%100.2%BROOKLYN
99.3% 98.4%100.5%BURLINGTON
98.1% 96.8%100.2%CANAAN
98.9% 98.0%101.2%CANTERBURY
99.3% 98.2%100.6%CANTON
98.6% 98.0%100.0%CHAPLIN
99.8% 99.7%99.9%CHESHIRE
98.8% 97.7%99.7%CHESTER
99.3% 98.3%99.8%CLINTON
98.8% 97.0%100.2%COLCHESTER
98.4% 97.1%100.4%COLEBROOK
Current Yr
Collected
as a % of
Curr Levy
Total
Collected
as a %
of Total
Outstanding
Total
Collected
as a % of
Curr Levy
98.8% 98.0%99.6%COLUMBIA
97.9% 93.6%100.0%CORNWALL
98.8% 98.0%100.7%COVENTRY
99.1% 98.5%99.4%CROMWELL
98.7% 96.5%100.1%DANBURY
99.6% 99.3%99.9%DARIEN
98.6% 97.6%100.3%DEEP RIVER
97.9% 95.9%99.7%DERBY
99.1% 98.4%100.7%DURHAM
99.0% 97.9%100.4%EAST GRANBY
98.9% 98.6%100.3%EAST HADDAM
98.0% 94.4%99.3%EAST HAMPTON
97.3% 96.4%99.2%EAST HARTFORD
97.9% 94.9%99.5%EAST HAVEN
98.9% 97.1%100.0%EAST LYME
98.8% 96.4%100.2%EAST WINDSOR
97.9% 96.4%99.7%EASTFORD
98.7% 97.4%100.8%EASTON
99.4% 98.6%100.7%ELLINGTON
98.1% 94.3%99.8%ENFIELD
99.1% 98.1%100.2%ESSEX
98.7% 97.3%99.7%FAIRFIELD
99.8% 99.5%100.1%FARMINGTON
98.3% 97.7%99.5%FRANKLIN
99.6% 99.4%100.1%GLASTONBURY
99.7% 99.4%100.2%GOSHEN
99.1% 98.3%99.9%GRANBY
99.3% 98.1%99.7%GREENWICH
97.5% 95.0%99.8%GRISWOLD
98.6% 97.3%99.8%GROTON
Current Yr
Collected
as a % of
Curr Levy
Total
Collected
as a %
of Total
Outstanding
Total
Collected
as a % of
Curr Levy
99.5% 99.3%99.9%GUILFORD
99.0% 96.1%99.7%HADDAM
98.7% 97.0%99.7%HAMDEN
98.7% 98.2%99.6%HAMPTON
95.7% 85.7%98.4%HARTFORD
98.4% 94.8%98.9%HARTLAND
99.4% 98.9%99.7%HARWINTON
97.9% 94.5%98.5%HEBRON
99.3% 98.8%100.3%KENT
97.8% 95.7%99.6%KILLINGLY
99.5% 99.3%100.0%KILLINGWORTH
97.9% 96.7%99.5%LEBANON
98.8% 98.0%99.7%LEDYARD
98.4% 97.2%100.0%LISBON
98.7% 97.9%99.8%LITCHFIELD
99.1% 97.9%100.2%LYME
99.6% 98.8%99.9%MADISON
98.3% 96.7%99.9%MANCHESTER
98.8% 97.5%99.6%MANSFIELD
99.3% 98.9%100.0%MARLBOROUGH
97.8% 93.4%99.8%MERIDEN
98.4% 96.7%99.5%MIDDLEBURY
98.2% 97.0%99.4%MIDDLEFIELD
97.6% 94.9%99.2%MIDDLETOWN
98.0% 95.1%99.2%MILFORD
99.1% 98.5%99.9%MONROE
97.7% 93.9%99.2%MONTVILLE
98.1% 96.6%98.7%MORRIS
93.4% 84.1%96.9%NAUGATUCK
* Derived from municipal tax collectors' reports included in the annual audits filed with the OPM
B - 15

Tax Collection Rates FYE 2016 *
Current Yr
Collected
as a % of
Curr Levy
Total
Collected
as a %
of Total
Outstanding
Total
Collected
as a % of
Curr Levy
96.6% 89.7%99.4%NEW BRITAIN
99.7% 99.4%99.8%NEW CANAAN
99.4% 99.0%99.7%NEW FAIRFIELD
98.5% 96.9%99.5%NEW HARTFORD
98.0% 95.9%97.7%NEW HAVEN
97.7% 94.7%98.8%NEW LONDON
98.4% 97.8%99.9%NEW MILFORD
99.3% 98.9%100.1%NEWINGTON
99.3% 98.3%100.0%NEWTOWN
99.2% 97.6%100.3%NORFOLK
98.6% 97.0%99.5%NORTH BRANFORD
97.0% 94.3%98.6%NORTH CANAAN
98.8% 97.1%99.8%NORTH HAVEN
97.4% 95.0%98.9%NORTH STONINGTON
98.9% 98.0%99.7%NORWALK
96.8% 95.0%101.5%NORWICH
98.7% 97.6%99.7%OLD LYME
99.1% 98.7%99.9%OLD SAYBROOK
99.4% 99.3%100.0%ORANGE
98.4% 94.7%99.9%OXFORD
97.8% 95.0%100.0%PLAINFIELD
97.9% 94.9%99.7%PLAINVILLE
97.9% 96.3%99.3%PLYMOUTH
99.1% 98.7%100.3%POMFRET
98.7% 97.2%100.1%PORTLAND
98.1% 97.2%99.6%PRESTON
99.1% 98.7%100.1%PROSPECT
97.8% 93.7%100.5%PUTNAM
98.6% 94.4%99.2%REDDING
98.9% 96.9%100.3%RIDGEFIELD
Current Yr
Collected
as a % of
Curr Levy
Total
Collected
as a %
of Total
Outstanding
Total
Collected
as a % of
Curr Levy
99.3% 98.9%99.9%ROCKY HILL
99.4% 99.2%99.9%ROXBURY
98.7% 97.4%100.0%SALEM
99.4% 98.8%100.0%SALISBURY
97.9% 96.6%100.0%SCOTLAND
98.3% 96.6%100.5%SEYMOUR
97.8% 94.0%99.8%SHARON
99.0% 97.8%100.3%SHELTON
99.7% 99.5%100.4%SHERMAN
99.5% 98.9%99.8%SIMSBURY
98.7% 98.2%99.6%SOMERS
98.9% 96.4%100.3%SOUTH WINDSOR
99.3% 98.8%99.7%SOUTHBURY
98.9% 97.7%99.7%SOUTHINGTON
90.7% 86.7%93.5%SPRAGUE
97.2% 94.3%101.1%STAFFORD
98.7% 98.1%99.1%STAMFORD
97.1% 96.6%100.2%STERLING
98.7% 98.6%99.8%STONINGTON
97.5% 95.1%99.5%STRATFORD
99.1% 97.9%100.1%SUFFIELD
98.8% 98.1%100.5%THOMASTON
98.2% 94.4%100.0%THOMPSON
99.2% 98.9%100.1%TOLLAND
100.0% 100.0%100.0%TORRINGTON @
99.1% 98.5%100.1%TRUMBULL
98.6% 96.8%99.1%UNION
98.9% 97.8%100.3%VERNON
98.3% 96.0%99.6%VOLUNTOWN
98.6% 96.6%100.2%WALLINGFORD
Current Yr
Collected
as a % of
Curr Levy
Total
Collected
as a %
of Total
Outstanding
Total
Collected
as a % of
Curr Levy
99.7% 99.6%101.1%WARREN
99.2% 98.3%100.3%WASHINGTON
98.4% 96.5%99.3%WATERBURY
99.2% 97.8%99.6%WATERFORD
98.6% 97.6%99.5%WATERTOWN
99.3% 98.8%99.9%WEST HARTFORD
98.5% 96.4%99.5%WEST HAVEN
99.4% 98.8%100.0%WESTBROOK
98.7% 96.6%99.2%WESTON
98.7% 94.5%100.2%WESTPORT
99.1% 97.7%99.6%WETHERSFIELD
99.6% 99.2%100.1%WILLINGTON
99.3% 98.2%99.8%WILTON
98.1% 97.5%100.6%WINCHESTER
98.8% 98.2%100.3%WINDHAM
98.8% 98.2%99.6%WINDSOR
98.3% 96.5%98.8%WINDSOR LOCKS
98.1% 96.8%99.5%WOLCOTT
99.6% 99.6%100.0%WOODBRIDGE
98.1% 94.9%99.7%WOODBURY
98.4% 97.5%99.7%WOODSTOCK
** Average ** 98.6% 99.6% 96.4%
** Median ** 98.7% 99.8% 97.6%
@ A special legislative act allows this municipality's tax collection services to be contracted to an outside firm. This firm charges a commission which is not reflected in the tax collection rates presented.
* Derived from municipal tax collectors' reports included in the annual audits filed with the OPM
B - 16

Unemployment Comparison
October 2017 and 2016
*
2017
Oct
2016
Oct
ANDOVER 3.2% 3.3%
ANSONIA 6.1% 6.0%
ASHFORD 3.5% 3.1%
AVON 3.2% 2.8%
BARKHAMSTED 3.8% 3.2%
BEACON FALLS 3.5% 3.9%
BERLIN 3.5% 3.1%
BETHANY 3.3% 3.1%
BETHEL 3.5% 3.6%
BETHLEHEM 3.8% 3.3%
BLOOMFIELD 5.2% 4.7%
BOLTON 3.2% 2.9%
BOZRAH 4.0% 3.7%
BRANFORD 3.8% 3.7%
BRIDGEPORT 6.4% 6.6%
BRIDGEWATER 3.6% 2.8%
BRISTOL 4.9% 4.7%
BROOKFIELD 3.3% 3.4%
BROOKLYN 4.2% 4.3%
BURLINGTON 3.2% 3.2%
CANAAN 2.7% 2.1%
CANTERBURY 3.7% 4.1%
CANTON 3.2% 3.0%
CHAPLIN 4.2% 4.8%
CHESHIRE 3.1% 2.8%
CHESTER 3.3% 2.8%
CLINTON 3.6% 3.2%
COLCHESTER 3.2% 3.4%
COLEBROOK 3.8% 3.5%
COLUMBIA 3.2% 3.2%
CORNWALL 3.0% 2.4%
COVENTRY 3.4% 3.0%
CROMWELL 3.7% 3.5%
DANBURY 3.4% 3.3%
2017
Oct
2016
Oct
DARIEN 3.7% 3.5%
DEEP RIVER 3.1% 2.9%
DERBY 5.6% 5.8%
DURHAM 2.8% 2.7%
EAST GRANBY 3.1% 3.4%
EAST HADDAM 3.9% 3.5%
EAST HAMPTON 3.4% 3.5%
EAST HARTFORD 5.4% 5.4%
EAST HAVEN 4.9% 4.9%
EAST LYME 3.7% 3.6%
EAST WINDSOR 4.3% 4.4%
EASTFORD 3.5% 2.9%
EASTON 3.5% 3.1%
ELLINGTON 3.4% 3.2%
ENFIELD 4.4% 4.7%
ESSEX 3.5% 3.0%
FAIRFIELD 4.0% 3.6%
FARMINGTON 3.5% 3.0%
FRANKLIN 2.8% 3.9%
GLASTONBURY 3.1% 2.9%
GOSHEN 2.6% 3.1%
GRANBY 2.9% 2.9%
GREENWICH 3.5% 3.2%
GRISWOLD 4.9% 5.0%
GROTON 3.7% 3.7%
GUILFORD 2.9% 2.9%
HADDAM 3.4% 2.7%
HAMDEN 3.9% 3.9%
HAMPTON 4.8% 4.1%
HARTFORD 7.8% 7.9%
HARTLAND 3.3% 3.1%
HARWINTON 3.1% 3.2%
HEBRON 3.1% 2.8%
KENT 3.8% 2.7%
2017
Oct
2016
Oct
KILLINGLY 4.7% 5.0%
KILLINGWORTH 2.6% 2.6%
LEBANON 3.9% 3.3%
LEDYARD 3.4% 3.4%
LISBON 4.1% 4.8%
LITCHFIELD 3.3% 3.0%
LYME 3.1% 2.9%
MADISON 3.2% 3.0%
MANCHESTER 4.4% 4.2%
MANSFIELD 3.5% 3.4%
MARLBOROUGH 3.3% 3.5%
MERIDEN 5.2% 5.2%
MIDDLEBURY 3.9% 3.5%
MIDDLEFIELD 3.1% 3.7%
MIDDLETOWN 4.2% 4.2%
MILFORD 4.0% 4.0%
MONROE 4.1% 3.8%
MONTVILLE 4.3% 4.3%
MORRIS 3.4% 3.0%
NAUGATUCK 4.8% 4.9%
NEW BRITAIN 6.0% 5.8%
NEW CANAAN 3.8% 3.3%
NEW FAIRFIELD 3.7% 3.5%
NEW HARTFORD 3.6% 3.2%
NEW HAVEN 5.7% 5.6%
NEW LONDON 6.1% 6.0%
NEW MILFORD 3.4% 3.4%
NEWINGTON 3.7% 3.6%
NEWTOWN 3.4% 3.5%
NORFOLK 2.6% 2.9%
NORTH BRANFORD 3.4% 3.6%
NORTH CANAAN 2.8% 3.6%
NORTH HAVEN 3.6% 3.7%
NORTH STONINGTON 3.2% 3.1%
NORWALK 3.8% 3.6%
2017
Oct
2016
Oct
NORWICH 4.8% 5.1%
OLD LYME 3.5% 3.0%
OLD SAYBROOK 3.8% 3.7%
ORANGE 3.1% 3.1%
OXFORD 3.4% 3.3%
PLAINFIELD 4.6% 4.7%
PLAINVILLE 4.2% 3.9%
PLYMOUTH 4.7% 4.8%
POMFRET 2.5% 2.6%
PORTLAND 3.7% 3.8%
PRESTON 4.5% 4.1%
PROSPECT 3.6% 3.0%
PUTNAM 5.2% 4.9%
REDDING 3.5% 3.6%
RIDGEFIELD 3.5% 3.1%
ROCKY HILL 3.4% 3.2%
ROXBURY 2.9% 2.6%
SALEM 4.3% 4.2%
SALISBURY 3.1% 2.5%
SCOTLAND 3.9% 3.1%
SEYMOUR 4.2% 4.4%
SHARON 2.6% 2.3%
SHELTON 4.2% 4.0%
SHERMAN 3.4% 3.2%
SIMSBURY 3.0% 2.8%
SOMERS 3.7% 3.6%
SOUTH WINDSOR 3.4% 3.4%
SOUTHBURY 4.2% 4.2%
SOUTHINGTON 3.6% 3.3%
SPRAGUE 4.3% 4.5%
STAFFORD 3.8% 4.1%
STAMFORD 3.7% 3.5%
STERLING 5.1% 4.9%
STONINGTON 3.4% 3.3%
STRATFORD 5.0% 5.0%
2017
Oct
2016
Oct
SUFFIELD 3.3% 3.1%
THOMASTON 3.4% 3.3%
THOMPSON 4.2% 4.0%
TOLLAND 3.0% 2.7%
TORRINGTON 4.9% 4.7%
TRUMBULL 3.7% 3.5%
UNION 3.3% 4.5%
VERNON 4.1% 4.0%
VOLUNTOWN 4.3% 3.8%
WALLINGFORD 3.7% 3.6%
WARREN 3.9% 3.0%
WASHINGTON 2.9% 2.6%
WATERBURY 7.1% 7.0%
WATERFORD 3.7% 3.8%
WATERTOWN 3.4% 3.6%
WEST HARTFORD 3.3% 3.1%
WEST HAVEN 5.2% 5.0%
WESTBROOK 3.7% 3.8%
WESTON 4.1% 3.3%
WESTPORT 3.6% 3.1%
WETHERSFIELD 4.2% 3.8%
WILLINGTON 3.2% 2.9%
WILTON 3.5% 3.4%
WINCHESTER 4.2% 4.1%
WINDHAM 5.1% 4.8%
WINDSOR 4.6% 4.2%
WINDSOR LOCKS 4.0% 4.2%
WOLCOTT 3.5% 3.6%
WOODBRIDGE 3.0% 2.9%
WOODBURY 3.1% 3.1%
WOODSTOCK 3.8% 3.6%
** State Average **
** Median **
4.2%
3.5%
4.3%
3.6%
B - 17
* Source: State of CT, Dept. of Labor Note: Data not seasonally adjusted

Mill Rates by Property Type
AllReal &
PersonalMotor Vehicle
** Fiscal Year 2016-17 **
AllReal &
PersonalMotor Vehicle
** Fiscal Year 2017-18 **
ANDOVER 30.72 32.50
ANSONIA 37.32 37.00 37.32
ASHFORD 32.37 32.00
AVON 29.52 30.59
BARKHAMSTED 28.36 29.37
BEACON FALLS 32.90 32.00 35.90 32.00
BERLIN 30.81 31.61
BETHANY 35.50 36.90 32.00
BETHEL 32.17 32.00 32.88 32.00
BETHLEHEM 23.41 25.38
BLOOMFIELD 36.65 37.56 32.00
BOLTON 37.50 37.00 39.74 39.00
BOZRAH 27.50 28.50
BRANFORD 27.41 28.47
BRIDGEPORT 54.37 37.00 54.37 37.00
BRIDGEWATER 16.45 17.20
BRISTOL 36.03 36.03 32.00
BROOKFIELD 26.40 27.29
BROOKLYN 26.34 27.09
BURLINGTON 31.60 32.00
CANAAN 24.00 24.95
CANTERBURY 24.50
CANTON 29.76 30.49
CHAPLIN 35.05 35.05 32.00
CHESHIRE 31.19 31.94
CHESTER 25.57 26.36
CLINTON 27.14 29.91
COLCHESTER 30.91 32.37
COLEBROOK 29.30 30.90
COLUMBIA 27.44 28.88
CORNWALL 15.31 16.12
COVENTRY 31.20 32.00
AllReal &
PersonalMotor Vehicle
** Fiscal Year 2016-17 **
AllReal &
PersonalMotor Vehicle
** Fiscal Year 2017-18 **
CROMWELL 31.38 31.68
DANBURY 28.68 28.95
DARIEN 15.77 16.16
DEEP RIVER 27.53 28.92
DERBY 39.37 37.00 39.37 39.00
DURHAM 35.31 39.50 32.00
EAST GRANBY 31.10 32.40 32.00
EAST HADDAM 29.35 29.58
EAST HAMPTON 29.44 31.32
EAST HARTFORD 45.86 37.00 47.05 32.00
EAST HAVEN 31.55 31.55
EAST LYME 25.36 26.16
EAST WINDSOR 30.93 32.77 32.00
EASTFORD 25.11 26.11
EASTON 30.81 33.38 32.00
ELLINGTON 30.50 31.70
ENFIELD 30.86 28.80 31.43
ESSEX 21.58 21.96
FAIRFIELD 25.45 25.85
FARMINGTON 25.78 26.68
FRANKLIN 25.22
GLASTONBURY 36.40 34.60 37.45 32.00
GOSHEN 18.70 19.60
GRANBY 36.94 37.94 32.00
GREENWICH 11.20 11.37
GRISWOLD 27.06 27.61
GROTON 21.73 23.63
GUILFORD 28.67 29.36
HADDAM 31.20 31.69
HAMDEN 45.36 37.00 45.26 37.00
HAMPTON 28.50 28.50
HARTFORD 74.29 37.00 74.29 32.00
B - 18
Mill rates are presented by property type when motor vehicle mill rate is different from real and personal property mill rate.
Mill rates for FY 2017-18 were not final for all municipalities at the time of this publication.

Mill Rates by Property Type
AllReal &
PersonalMotor Vehicle
** Fiscal Year 2016-17 **
AllReal &
PersonalMotor Vehicle
** Fiscal Year 2017-18 **
HARTLAND 25.50 26.50
HARWINTON 27.80 28.80
HEBRON 35.64 37.00
KENT 18.33 18.61
KILLINGLY 27.31 27.31
KILLINGWORTH 25.89 27.47
LEBANON 28.90 28.90
LEDYARD 31.90 32.54
LISBON 20.50 22.50
LITCHFIELD 26.70 27.60
LYME 18.25 18.25
MADISON 26.49 27.30
MANCHESTER 39.68 37.00 34.85 32.00
MANSFIELD 29.87 30.63
MARLBOROUGH 34.15 35.46 32.00
MERIDEN 37.47 37.00 39.92 37.00
MIDDLEBURY 31.01 31.49
MIDDLEFIELD 32.84 32.00 36.61 32.00
MIDDLETOWN 33.30 33.90 33.90
MILFORD 27.84 27.79
MONROE 35.00 32.00 35.76 32.00
MONTVILLE 30.61 31.70
MORRIS 27.83
NAUGATUCK 47.67 37.00 48.55 37.00
NEW BRITAIN 50.50 37.00 50.50 37.00
NEW CANAAN 16.31 16.67
NEW FAIRFIELD 28.68 29.82
NEW HARTFORD 29.52
NEW HAVEN 41.55 37.00 38.68 32.00
NEW LONDON 40.46 37.00 44.26 37.00
NEW MILFORD 26.77 27.25
NEWINGTON 35.75 36.59 32.00
NEWTOWN 33.60 33.87 32.00
AllReal &
PersonalMotor Vehicle
** Fiscal Year 2016-17 **
AllReal &
PersonalMotor Vehicle
** Fiscal Year 2017-18 **
NORFOLK 22.09 22.45
NORTH BRANFORD 31.98 33.51 32.00
NORTH CANAAN 27.50 27.50
NORTH HAVEN 30.53 30.53
NORTH STONINGTON 27.00 27.00
NORWALK 25.00 28.91 25.26 29.34
NORWICH 41.22 37.00 40.52 39.00
OLD LYME 21.20 21.75
OLD SAYBROOK 19.26 19.66
ORANGE 32.20 32.00 33.28
OXFORD 24.21 22.21
PLAINFIELD 29.05 29.92
PLAINVILLE 31.99 32.68
PLYMOUTH 36.02 39.69 32.00
POMFRET 25.43 25.86 27.93
PORTLAND 32.51 32.98 32.00
PRESTON 23.75 24.00
PROSPECT 29.91 31.25
PUTNAM 17.04 20.00
REDDING 29.24 29.62
RIDGEFIELD 26.69 27.21
ROCKY HILL 31.00 31.60
ROXBURY 13.70 14.20
SALEM 31.70 32.20
SALISBURY 10.70 11.10
SCOTLAND 38.68 37.00 38.68 32.00
SEYMOUR 36.00 36.00
SHARON 14.40 14.70
SHELTON 22.31 22.21
SHERMAN 20.33 20.33
SIMSBURY 37.12 36.00 38.76 31.00
SOMERS 24.22 25.47
SOUTH WINDSOR 37.34 37.00 38.08 37.00
B - 19
Mill rates are presented by property type when motor vehicle mill rate is different from real and personal property mill rate.
Mill rates for FY 2017-18 were not final for all municipalities at the time of this publication.

Mill Rates by Property Type
AllReal &
PersonalMotor Vehicle
** Fiscal Year 2016-17 **
AllReal &
PersonalMotor Vehicle
** Fiscal Year 2017-18 **
SOUTHBURY 28.80 29.30
SOUTHINGTON 29.64 30.48
SPRAGUE 31.50 32.00
STAFFORD 33.51 33.93
STAMFORD 26.12 27.25 26.89 27.25
STERLING 31.60 31.80
STONINGTON 22.31 22.98
STRATFORD 38.99 37.00
SUFFIELD 28.20 28.89
THOMASTON 34.07 35.05
THOMPSON 26.06 27.00
TOLLAND 34.19 34.48
TORRINGTON 45.75 37.00 45.75 39.00
TRUMBULL 32.74 33.39 32.00
UNION 30.27 30.84
VERNON 38.03 37.00 38.71 37.00
VOLUNTOWN 28.06 28.06
WALLINGFORD 27.89 28.55
WARREN 14.35 14.50
WASHINGTON 14.25 14.25
WATERBURY 60.21 37.00 60.21 37.00
WATERFORD 26.78 27.03
WATERTOWN 30.89 31.88
WEST HARTFORD 39.51 37.00 41.04 32.00
WEST HAVEN 35.26 37.00 35.26 37.00
WESTBROOK 23.14 24.37
WESTON 28.56 28.91
WESTPORT 16.86 16.86
WETHERSFIELD 38.54 37.00 39.77
WILLINGTON 27.73 30.09
WILTON 27.34 27.77
WINCHESTER 33.54 32.00 33.54
WINDHAM 35.35 37.00 36.65
AllReal &
PersonalMotor Vehicle
** Fiscal Year 2016-17 **
AllReal &
PersonalMotor Vehicle
** Fiscal Year 2017-18 **
WINDSOR 31.52
WINDSOR LOCKS 26.66 26.66
WOLCOTT 28.91 31.27
WOODBRIDGE 38.54 37.00 39.44 32.00
WOODBURY 26.29 27.16
WOODSTOCK 24.04 24.30
B - 20
Mill rates are presented by property type when motor vehicle mill rate is different from real and personal property mill rate.
Mill rates for FY 2017-18 were not final for all municipalities at the time of this publication.

Revaluation Dates **
Date of Last
Revaluation
Date of Next
Revaluation
10/1/2016 10/1/2021ANDOVER
10/1/2017 10/1/2022ANSONIA
10/1/2016 10/1/2021ASHFORD
10/1/2013 10/1/2018AVON
10/1/2013 10/1/2018BARKHAMSTED
10/1/2016 10/1/2021BEACON FALLS
10/1/2017 10/1/2022BERLIN
10/1/2013 10/1/2018BETHANY
10/1/2017 10/1/2022BETHEL
10/1/2013 10/1/2018BETHLEHEM
10/1/2014 10/1/2019BLOOMFIELD
10/1/2013 10/1/2018BOLTON
10/1/2017 10/1/2022BOZRAH
10/1/2014 10/1/2019BRANFORD
10/1/2015 10/1/2020BRIDGEPORT
10/1/2016 10/1/2021BRIDGEWATER
10/1/2017 10/1/2022BRISTOL
10/1/2016 10/1/2021BROOKFIELD
10/1/2015 10/1/2020BROOKLYN
10/1/2013 10/1/2018BURLINGTON
10/1/2017 10/1/2022CANAAN
10/1/2015 10/1/2020CANTERBURY
10/1/2013 10/1/2018CANTON
10/1/2013 10/1/2018CHAPLIN
10/1/2013 10/1/2018CHESHIRE
10/1/2013 10/1/2018CHESTER
10/1/2015 10/1/2020CLINTON
10/1/2016 10/1/2021COLCHESTER
10/1/2015 10/1/2020COLEBROOK
Date of Last
Revaluation
Date of Next
Revaluation
10/1/2016 10/1/2021COLUMBIA
10/1/2016 10/1/2021CORNWALL
10/1/2014 10/1/2019COVENTRY
10/1/2017 10/1/2022CROMWELL
10/1/2017 10/1/2022DANBURY
10/1/2013 10/1/2018DARIEN
10/1/2015 10/1/2020DEEP RIVER
10/1/2015 10/1/2020DERBY
10/1/2015 10/1/2020DURHAM
10/1/2013 10/1/2018EAST GRANBY
10/1/2017 10/1/2022EAST HADDAM
10/1/2015 10/1/2020EAST HAMPTON
10/1/2016 10/1/2021EAST HARTFORD
10/1/2016 10/1/2021EAST HAVEN
10/1/2016 10/1/2021EAST LYME
10/1/2017 10/1/2022EAST WINDSOR
10/1/2013 10/1/2018EASTFORD
10/1/2016 10/1/2021EASTON
10/1/2015 10/1/2020ELLINGTON
10/1/2016 10/1/2021ENFIELD
10/1/2013 10/1/2018ESSEX
10/1/2015 10/1/2020FAIRFIELD
10/1/2017 10/1/2022FARMINGTON
10/1/2013 10/1/2018FRANKLIN
10/1/2017 10/1/2022GLASTONBURY
10/1/2017 10/1/2022GOSHEN
10/1/2017 10/1/2022GRANBY
10/1/2015 10/1/2020GREENWICH
10/1/2016 10/1/2021GRISWOLD
10/1/2016 10/1/2021GROTON
Date of Last
Revaluation
Date of Next
Revaluation
10/1/2017 10/1/2022GUILFORD
10/1/2015 10/1/2020HADDAM
10/1/2015 10/1/2020HAMDEN
10/1/2013 10/1/2018HAMPTON
10/1/2016 10/1/2021HARTFORD
10/1/2015 10/1/2020HARTLAND
10/1/2013 10/1/2018HARWINTON
10/1/2016 10/1/2021HEBRON
10/1/2013 10/1/2018KENT
10/1/2013 10/1/2018KILLINGLY
10/1/2016 10/1/2021KILLINGWORTH
10/1/2013 10/1/2018LEBANON
10/1/2015 10/1/2020LEDYARD
10/1/2016 10/1/2021LISBON
10/1/2013 10/1/2018LITCHFIELD
10/1/2013 10/1/2018LYME
10/1/2013 10/1/2018MADISON
10/1/2016 10/1/2021MANCHESTER
10/1/2014 10/1/2019MANSFIELD
10/1/2015 10/1/2020MARLBOROUGH
10/1/2016 10/1/2021MERIDEN
10/1/2016 10/1/2021MIDDLEBURY
10/1/2016 10/1/2021MIDDLEFIELD
10/1/2017 10/1/2022MIDDLETOWN
10/1/2016 10/1/2021MILFORD
10/1/2014 10/1/2019MONROE
10/1/2016 10/1/2021MONTVILLE
10/1/2014 10/1/2019MORRIS
10/1/2012 10/1/2018NAUGATUCK
** As of the 2017 Grand List Year
B - 21

Revaluation Dates **
Date of Last
Revaluation
Date of Next
Revaluation
10/1/2017 10/1/2022NEW BRITAIN
10/1/2013 10/1/2018NEW CANAAN
10/1/2014 10/1/2019NEW FAIRFIELD
10/1/2013 10/1/2018NEW HARTFORD
10/1/2016 10/1/2021NEW HAVEN
10/1/2013 10/1/2018NEW LONDON
10/1/2015 10/1/2020NEW MILFORD
10/1/2015 10/1/2020NEWINGTON
10/1/2017 10/1/2022NEWTOWN
10/1/2013 10/1/2018NORFOLK
10/1/2015 10/1/2020NORTH BRANFORD
10/1/2017 10/1/2022NORTH CANAAN
10/1/2014 10/1/2019NORTH HAVEN
10/1/2015 10/1/2020NORTH STONINGTON
10/1/2013 10/1/2018NORWALK
10/1/2013 10/1/2018NORWICH
10/1/2014 10/1/2019OLD LYME
10/1/2013 10/1/2018OLD SAYBROOK
10/1/2017 10/1/2022ORANGE
10/1/2015 10/1/2020OXFORD
10/1/2017 10/1/2022PLAINFIELD
10/1/2016 10/1/2021PLAINVILLE
10/1/2016 10/1/2021PLYMOUTH
10/1/2015 10/1/2020POMFRET
10/1/2016 10/1/2021PORTLAND
10/1/2017 10/1/2022PRESTON
10/1/2015 10/1/2020PROSPECT
10/1/2014 10/1/2019PUTNAM
10/1/2017 10/1/2022REDDING
10/1/2017 10/1/2022RIDGEFIELD
Date of Last
Revaluation
Date of Next
Revaluation
10/1/2013 10/1/2018ROCKY HILL
10/1/2017 10/1/2022ROXBURY
10/1/2016 10/1/2021SALEM
10/1/2015 10/1/2020SALISBURY
10/1/2013 10/1/2018SCOTLAND
10/1/2015 10/1/2020SEYMOUR
10/1/2013 10/1/2018SHARON
10/1/2016 10/1/2021SHELTON
10/1/2013 10/1/2018SHERMAN
10/1/2017 10/1/2022SIMSBURY
10/1/2015 10/1/2020SOMERS
10/1/2017 10/1/2022SOUTH WINDSOR
10/1/2017 10/1/2022SOUTHBURY
10/1/2015 10/1/2020SOUTHINGTON
10/1/2017 10/1/2022SPRAGUE
10/1/2015 10/1/2020STAFFORD
10/1/2017 10/1/2022STAMFORD
10/1/2017 10/1/2022STERLING
10/1/2017 10/1/2022STONINGTON
10/1/2014 10/1/2019STRATFORD
10/1/2013 10/1/2018SUFFIELD
10/1/2016 10/1/2021THOMASTON
10/1/2014 10/1/2019THOMPSON
10/1/2014 10/1/2019TOLLAND
10/1/2014 10/1/2019TORRINGTON
10/1/2015 10/1/2020TRUMBULL
10/1/2013 10/1/2018UNION
10/1/2016 10/1/2021VERNON
10/1/2015 10/1/2020VOLUNTOWN
10/1/2015 10/1/2020WALLINGFORD
Date of Last
Revaluation
Date of Next
Revaluation
10/1/2017 10/1/2022WARREN
10/1/2013 10/1/2018WASHINGTON
10/1/2017 10/1/2022WATERBURY
10/1/2017 10/1/2022WATERFORD
10/1/2013 10/1/2018WATERTOWN
10/1/2016 10/1/2021WEST HARTFORD
10/1/2015 10/1/2020WEST HAVEN
10/1/2016 10/1/2021WESTBROOK
10/1/2013 10/1/2018WESTON
10/1/2015 10/1/2020WESTPORT
10/1/2013 10/1/2018WETHERSFIELD
10/1/2013 10/1/2018WILLINGTON
10/1/2017 10/1/2022WILTON
10/1/2017 10/1/2022WINCHESTER
10/1/2013 10/1/2018WINDHAM
10/1/2013 10/1/2018WINDSOR
10/1/2013 10/1/2018WINDSOR LOCKS
10/1/2016 10/1/2021WOLCOTT
10/1/2014 10/1/2019WOODBRIDGE
10/1/2013 10/1/2018WOODBURY
10/1/2016 10/1/2021WOODSTOCK
** As of the 2017 Grand List Year
B - 22

Net Grand List *
Oct. 1 '14 for
FY 2015-2016
Oct. 1 '15 for
FY 2016-2017
ANDOVER $263,133,905$266,151,700
ANSONIA $894,098,985$901,633,007
ASHFORD $297,466,704$298,906,823
AVON $2,577,798,250$2,617,788,690
BARKHAMSTED $341,699,965$352,039,550
BEACON FALLS $479,221,588$493,230,489
BERLIN $2,177,154,828$2,266,952,900
BETHANY $551,306,171$555,905,598
BETHEL $1,890,122,000$1,942,406,740
BETHLEHEM $367,532,967$369,821,650
BLOOMFIELD $2,033,984,990$2,151,822,445
BOLTON $428,519,803$431,860,588
BOZRAH $220,073,977$232,776,004
BRANFORD $3,485,684,401$3,524,242,936
BRIDGEPORT $7,136,523,574$6,104,127,266
BRIDGEWATER $390,634,084$391,423,072
BRISTOL $3,821,929,916$4,075,430,792
BROOKFIELD $2,240,023,646$2,284,199,893
BROOKLYN $554,246,087$543,580,574
BURLINGTON $899,396,283$907,750,161
CANAAN $172,486,100$172,401,570
CANTERBURY $392,665,406$358,857,502
CANTON $1,100,809,533$1,108,358,059
CHAPLIN $157,184,170$161,567,780
CHESHIRE $2,726,793,817$2,812,739,101
CHESTER $443,038,190$452,972,190
CLINTON $1,509,702,057$1,526,941,989
COLCHESTER $1,201,873,865$1,218,343,150
Oct. 1 '14 for
FY 2015-2016
Oct. 1 '15 for
FY 2016-2017
COLEBROOK $184,066,533$182,148,042
COLUMBIA $471,633,257$480,524,160
CORNWALL $403,060,810$404,816,100
COVENTRY $930,610,730$950,765,238
CROMWELL $1,289,926,800$1,333,134,015
DANBURY $6,947,001,073$7,204,514,925
DARIEN $8,356,198,215$8,448,105,974
DEEP RIVER $499,546,159$500,730,142
DERBY $748,833,439$719,013,485
DURHAM $747,833,507$713,023,389
EAST GRANBY $581,485,097$629,309,586
EAST HADDAM $852,756,014$858,297,662
EAST HAMPTON $1,141,219,493$1,091,414,586
EAST HARTFORD $2,689,464,641$3,013,515,931
EAST HAVEN $1,995,443,160$2,019,250,061
EAST LYME $2,086,779,308$2,135,566,823
EAST WINDSOR $951,587,151$991,557,710
EASTFORD $141,728,950$149,050,912
EASTON $1,330,424,935$1,339,632,114
ELLINGTON $1,311,375,929$1,343,212,952
ENFIELD $2,877,277,903$2,931,984,658
ESSEX $1,036,820,170$1,055,984,031
FAIRFIELD $10,975,624,915$10,784,936,174
FARMINGTON $3,532,450,005$3,622,191,213
FRANKLIN $191,400,520$204,996,510
GLASTONBURY $3,871,305,346$3,930,333,289
GOSHEN $523,351,320$525,125,460
GRANBY $965,474,890$973,106,360
GREENWICH $31,086,586,390$32,352,040,666
Oct. 1 '14 for
FY 2015-2016
Oct. 1 '15 for
FY 2016-2017
GRISWOLD $705,810,105$708,229,248
GROTON $3,820,151,399$3,961,564,580
GUILFORD $3,051,805,195$3,089,299,255
HADDAM $912,861,548$906,451,465
HAMDEN $4,075,516,582$3,878,039,867
HAMPTON $125,742,991$137,754,581
HARTFORD $3,619,341,714$3,738,332,533
HARTLAND $196,621,980$198,192,769
HARWINTON $537,388,702$545,036,639
HEBRON $782,001,450$786,175,320
KENT $594,416,601$596,101,109
KILLINGLY $1,106,789,534$1,204,312,190
KILLINGWORTH $722,716,487$724,370,089
LEBANON $607,415,900$630,891,385
LEDYARD $1,126,986,721$1,111,190,850
LISBON $371,049,512$370,584,306
LITCHFIELD $1,026,912,873$1,032,480,728
LYME $517,214,463$519,831,150
MADISON $2,861,223,204$2,873,029,061
MANCHESTER $3,922,977,390$4,020,811,909
MANSFIELD $1,026,856,306$1,073,973,769
MARLBOROUGH $575,072,075$576,524,986
MERIDEN $3,216,495,723$3,286,531,750
MIDDLEBURY $937,282,374$946,791,709
MIDDLEFIELD $408,734,287$426,475,260
MIDDLETOWN $3,291,420,748$3,504,785,641
MILFORD $6,407,742,833$6,567,967,455
MONROE $2,146,111,708$2,166,565,472
B - 23
* Source: Municipal form M-13 filed with OPM
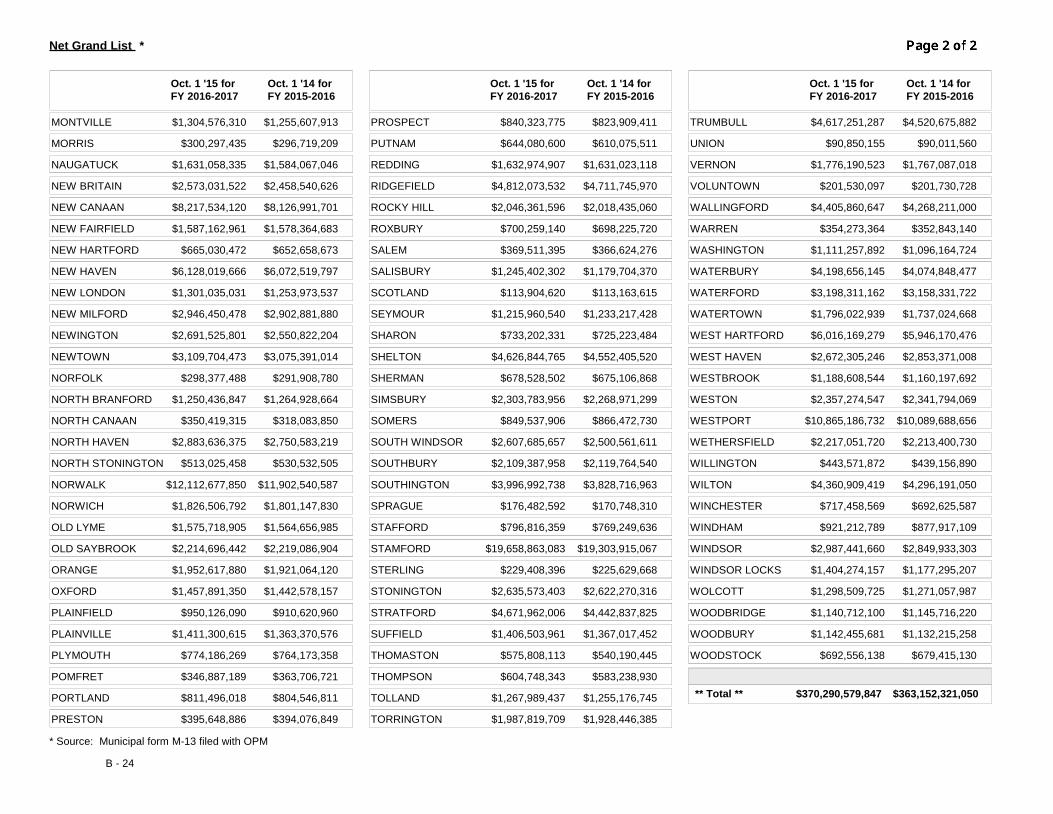
Net Grand List *
Oct. 1 '14 for
FY 2015-2016
Oct. 1 '15 for
FY 2016-2017
MONTVILLE $1,255,607,913$1,304,576,310
MORRIS $296,719,209$300,297,435
NAUGATUCK $1,584,067,046$1,631,058,335
NEW BRITAIN $2,458,540,626$2,573,031,522
NEW CANAAN $8,126,991,701$8,217,534,120
NEW FAIRFIELD $1,578,364,683$1,587,162,961
NEW HARTFORD $652,658,673$665,030,472
NEW HAVEN $6,072,519,797$6,128,019,666
NEW LONDON $1,253,973,537$1,301,035,031
NEW MILFORD $2,902,881,880$2,946,450,478
NEWINGTON $2,550,822,204$2,691,525,801
NEWTOWN $3,075,391,014$3,109,704,473
NORFOLK $291,908,780$298,377,488
NORTH BRANFORD $1,264,928,664$1,250,436,847
NORTH CANAAN $318,083,850$350,419,315
NORTH HAVEN $2,750,583,219$2,883,636,375
NORTH STONINGTON $530,532,505$513,025,458
NORWALK $11,902,540,587$12,112,677,850
NORWICH $1,801,147,830$1,826,506,792
OLD LYME $1,564,656,985$1,575,718,905
OLD SAYBROOK $2,219,086,904$2,214,696,442
ORANGE $1,921,064,120$1,952,617,880
OXFORD $1,442,578,157$1,457,891,350
PLAINFIELD $910,620,960$950,126,090
PLAINVILLE $1,363,370,576$1,411,300,615
PLYMOUTH $764,173,358$774,186,269
POMFRET $363,706,721$346,887,189
PORTLAND $804,546,811$811,496,018
PRESTON $394,076,849$395,648,886
Oct. 1 '14 for
FY 2015-2016
Oct. 1 '15 for
FY 2016-2017
PROSPECT $823,909,411$840,323,775
PUTNAM $610,075,511$644,080,600
REDDING $1,631,023,118$1,632,974,907
RIDGEFIELD $4,711,745,970$4,812,073,532
ROCKY HILL $2,018,435,060$2,046,361,596
ROXBURY $698,225,720$700,259,140
SALEM $366,624,276$369,511,395
SALISBURY $1,179,704,370$1,245,402,302
SCOTLAND $113,163,615$113,904,620
SEYMOUR $1,233,217,428$1,215,960,540
SHARON $725,223,484$733,202,331
SHELTON $4,552,405,520$4,626,844,765
SHERMAN $675,106,868$678,528,502
SIMSBURY $2,268,971,299$2,303,783,956
SOMERS $866,472,730$849,537,906
SOUTH WINDSOR $2,500,561,611$2,607,685,657
SOUTHBURY $2,119,764,540$2,109,387,958
SOUTHINGTON $3,828,716,963$3,996,992,738
SPRAGUE $170,748,310$176,482,592
STAFFORD $769,249,636$796,816,359
STAMFORD $19,303,915,067$19,658,863,083
STERLING $225,629,668$229,408,396
STONINGTON $2,622,270,316$2,635,573,403
STRATFORD $4,442,837,825$4,671,962,006
SUFFIELD $1,367,017,452$1,406,503,961
THOMASTON $540,190,445$575,808,113
THOMPSON $583,238,930$604,748,343
TOLLAND $1,255,176,745$1,267,989,437
TORRINGTON $1,928,446,385$1,987,819,709
Oct. 1 '14 for
FY 2015-2016
Oct. 1 '15 for
FY 2016-2017
TRUMBULL $4,520,675,882$4,617,251,287
UNION $90,011,560$90,850,155
VERNON $1,767,087,018$1,776,190,523
VOLUNTOWN $201,730,728$201,530,097
WALLINGFORD $4,268,211,000$4,405,860,647
WARREN $352,843,140$354,273,364
WASHINGTON $1,096,164,724$1,111,257,892
WATERBURY $4,074,848,477$4,198,656,145
WATERFORD $3,158,331,722$3,198,311,162
WATERTOWN $1,737,024,668$1,796,022,939
WEST HARTFORD $5,946,170,476$6,016,169,279
WEST HAVEN $2,853,371,008$2,672,305,246
WESTBROOK $1,160,197,692$1,188,608,544
WESTON $2,341,794,069$2,357,274,547
WESTPORT $10,089,688,656$10,865,186,732
WETHERSFIELD $2,213,400,730$2,217,051,720
WILLINGTON $439,156,890$443,571,872
WILTON $4,296,191,050$4,360,909,419
WINCHESTER $692,625,587$717,458,569
WINDHAM $877,917,109$921,212,789
WINDSOR $2,849,933,303$2,987,441,660
WINDSOR LOCKS $1,177,295,207$1,404,274,157
WOLCOTT $1,271,057,987$1,298,509,725
WOODBRIDGE $1,145,716,220$1,140,712,100
WOODBURY $1,132,215,258$1,142,455,681
WOODSTOCK $679,415,130$692,556,138
** Total ** $370,290,579,847 $363,152,321,050
B - 24
* Source: Municipal form M-13 filed with OPM

Tax Exempt Property - October 1, 2015 Assessed Valuation *
2015 Grand List -Tax Exempt Property
2015 Net Grand List
(FY 2016-17)
Total Assessed Value - 2015 Grand List
Tax Exempt Property as a % of 2015 Grand List
ANDOVER $12,852,200$266,151,700 $279,003,900 4.6%
ANSONIA $122,600,300$901,633,007 $1,024,233,307 12.0%
ASHFORD $3,007,300$298,906,823 $301,914,123 1.0%
AVON $240,552,120$2,617,788,690 $2,858,340,810 8.4%
BARKHAMSTED $18,540,060$352,039,550 $370,579,610 5.0%
BEACON FALLS $41,172,290$493,230,489 $534,402,779 7.7%
BERLIN $150,766,175$2,266,952,900 $2,417,719,075 6.2%
BETHANY $38,686,030$555,905,598 $594,591,628 6.5%
BETHEL $97,692,700$1,942,406,740 $2,040,099,440 4.8%
BETHLEHEM $29,163,730$369,821,650 $398,985,380 7.3%
BLOOMFIELD $175,714,100$2,151,822,445 $2,327,536,545 7.5%
BOLTON $29,361,090$431,860,588 $461,221,678 6.4%
BOZRAH $13,717,770$232,776,004 $246,493,774 5.6%
BRANFORD $249,238,920$3,524,242,936 $3,773,481,856 6.6%
BRIDGEPORT $2,211,151,829$6,104,127,266 $8,315,279,095 26.6%
BRIDGEWATER $41,812,140$391,423,072 $433,235,212 9.7%
BRISTOL $416,707,270$4,075,430,792 $4,492,138,062 9.3%
BROOKFIELD $122,823,510$2,284,199,893 $2,407,023,403 5.1%
BROOKLYN $44,486,340$543,580,574 $588,066,914 7.6%
BURLINGTON $46,345,830$907,750,161 $954,095,991 4.9%
CANAAN $57,929,640$172,401,570 $230,331,210 25.2%
CANTERBURY $16,835,500$358,857,502 $375,693,002 4.5%
CANTON $78,699,140$1,108,358,059 $1,187,057,199 6.6%
CHAPLIN $20,413,300$161,567,780 $181,981,080 11.2%
CHESHIRE $388,147,150$2,812,739,101 $3,200,886,251 12.1%
CHESTER $25,389,140$452,972,190 $478,361,330 5.3%
CLINTON $103,753,360$1,526,941,989 $1,630,695,349 6.4%
COLCHESTER $104,992,310$1,218,343,150 $1,323,335,460 7.9%
2015 Grand List -Tax Exempt Property
2015 Net Grand List
(FY 2016-17)
Total Assessed Value - 2015 Grand List
Tax Exempt Property as a % of 2015 Grand List
COLEBROOK $17,328,440$182,148,042 $199,476,482 8.7%
COLUMBIA $28,596,840$480,524,160 $509,121,000 5.6%
CORNWALL $26,193,870$404,816,100 $431,009,970 6.1%
COVENTRY $60,986,600$950,765,238 $1,011,751,838 6.0%
CROMWELL $87,526,830$1,333,134,015 $1,420,660,845 6.2%
DANBURY $1,426,783,900$7,204,514,925 $8,631,298,825 16.5%
DARIEN $593,102,020$8,448,105,974 $9,041,207,994 6.6%
DEEP RIVER $121,318,330$500,730,142 $622,048,472 19.5%
DERBY $154,558,430$719,013,485 $873,571,915 17.7%
DURHAM $36,731,590$713,023,389 $749,754,979 4.9%
EAST GRANBY $172,828,800$629,309,586 $802,138,386 21.5%
EAST HADDAM $63,790,750$858,297,662 $922,088,412 6.9%
EAST HAMPTON $92,591,413$1,091,414,586 $1,184,005,999 7.8%
EAST HARTFORD $445,744,088$3,013,515,931 $3,459,260,019 12.9%
EAST HAVEN $210,902,940$2,019,250,061 $2,230,153,001 9.5%
EAST LYME $260,585,140$2,135,566,823 $2,396,151,963 10.9%
EAST WINDSOR $87,531,210$991,557,710 $1,079,088,920 8.1%
EASTFORD $13,931,580$149,050,912 $162,982,492 8.5%
EASTON $87,033,600$1,339,632,114 $1,426,665,714 6.1%
ELLINGTON $73,181,230$1,343,212,952 $1,416,394,182 5.2%
ENFIELD $353,166,350$2,931,984,658 $3,285,151,008 10.8%
ESSEX $46,438,500$1,055,984,031 $1,102,422,531 4.2%
FAIRFIELD $1,136,151,210$10,784,936,174 $11,921,087,384 9.5%
FARMINGTON $930,016,440$3,622,191,213 $4,552,207,653 20.4%
FRANKLIN $12,947,970$204,996,510 $217,944,480 5.9%
GLASTONBURY $249,941,240$3,930,333,289 $4,180,274,529 6.0%
GOSHEN $27,897,130$525,125,460 $553,022,590 5.0%
GRANBY $64,457,790$973,106,360 $1,037,564,150 6.2%
GREENWICH $3,431,362,410$32,352,040,666 $35,783,403,076 9.6%
B - 25
* Source: Municipal form M-13 filed with OPM

Tax Exempt Property - October 1, 2015 Assessed Valuation *
2015 Grand List -Tax Exempt Property
2015 Net Grand List
(FY 2016-17)
Total Assessed Value - 2015 Grand List
Tax Exempt Property as a % of 2015 Grand List
GRISWOLD $81,552,320$708,229,248 $789,781,568 10.3%
GROTON $987,271,000$3,961,564,580 $4,948,835,580 19.9%
GUILFORD $184,530,080$3,089,299,255 $3,273,829,335 5.6%
HADDAM $65,251,490$906,451,465 $971,702,955 6.7%
HAMDEN $711,688,520$3,878,039,867 $4,589,728,387 15.5%
HAMPTON $13,459,460$137,754,581 $151,214,041 8.9%
HARTFORD $3,788,702,569$3,738,332,533 $7,527,035,102 50.3%
HARTLAND $27,736,530$198,192,769 $225,929,299 12.3%
HARWINTON $13,917,158$545,036,639 $558,953,797 2.5%
HEBRON $63,501,780$786,175,320 $849,677,100 7.5%
KENT $125,943,100$596,101,109 $722,044,209 17.4%
KILLINGLY $180,492,100$1,204,312,190 $1,384,804,290 13.0%
KILLINGWORTH $53,153,680$724,370,089 $777,523,769 6.8%
LEBANON $50,145,860$630,891,385 $681,037,245 7.4%
LEDYARD $266,864,780$1,111,190,850 $1,378,055,630 19.4%
LISBON $22,485,442$370,584,306 $393,069,748 5.7%
LITCHFIELD $150,594,930$1,032,480,728 $1,183,075,658 12.7%
LYME $41,157,692$519,831,150 $560,988,842 7.3%
MADISON $278,422,900$2,873,029,061 $3,151,451,961 8.8%
MANCHESTER $451,795,160$4,020,811,909 $4,472,607,069 10.1%
MANSFIELD $1,326,930,773$1,073,973,769 $2,400,904,542 55.3%
MARLBOROUGH $26,733,640$576,524,986 $603,258,626 4.4%
MERIDEN $552,266,335$3,286,531,750 $3,838,798,085 14.4%
MIDDLEBURY $85,480,360$946,791,709 $1,032,272,069 8.3%
MIDDLEFIELD $27,092,400$426,475,260 $453,567,660 6.0%
MIDDLETOWN $1,283,289,994$3,504,785,641 $4,788,075,635 26.8%
MILFORD $534,922,000$6,567,967,455 $7,102,889,455 7.5%
MONROE $131,074,700$2,166,565,472 $2,297,640,172 5.7%
2015 Grand List -Tax Exempt Property
2015 Net Grand List
(FY 2016-17)
Total Assessed Value - 2015 Grand List
Tax Exempt Property as a % of 2015 Grand List
MONTVILLE $299,692,690$1,304,576,310 $1,604,269,000 18.7%
MORRIS $14,539,090$300,297,435 $314,836,525 4.6%
NAUGATUCK $129,312,540$1,631,058,335 $1,760,370,875 7.3%
NEW BRITAIN $1,122,062,650$2,573,031,522 $3,695,094,172 30.4%
NEW CANAAN $567,712,810$8,217,534,120 $8,785,246,930 6.5%
NEW FAIRFIELD $62,900,000$1,587,162,961 $1,650,062,961 3.8%
NEW HARTFORD $38,473,125$665,030,472 $703,503,597 5.5%
NEW HAVEN $6,004,861,621$6,128,019,666 $12,132,881,287 49.5%
NEW LONDON $859,847,472$1,301,035,031 $2,160,882,503 39.8%
NEW MILFORD $248,778,260$2,946,450,478 $3,195,228,738 7.8%
NEWINGTON $392,315,050$2,691,525,801 $3,083,840,851 12.7%
NEWTOWN $281,359,680$3,109,704,473 $3,391,064,153 8.3%
NORFOLK $60,871,559$298,377,488 $359,249,047 16.9%
NORTH BRANFORD $104,648,631$1,250,436,847 $1,355,085,478 7.7%
NORTH CANAAN $47,686,780$350,419,315 $398,106,095 12.0%
NORTH HAVEN $308,553,910$2,883,636,375 $3,192,190,285 9.7%
NORTH STONINGTON $38,801,235$513,025,458 $551,826,693 7.0%
NORWALK $1,367,148,830$12,112,677,850 $13,479,826,680 10.1%
NORWICH $558,020,000$1,826,506,792 $2,384,526,792 23.4%
OLD LYME $103,199,970$1,575,718,905 $1,678,918,875 6.1%
OLD SAYBROOK $164,229,171$2,214,696,442 $2,378,925,613 6.9%
ORANGE $158,228,930$1,952,617,880 $2,110,846,810 7.5%
OXFORD $105,616,200$1,457,891,350 $1,563,507,550 6.8%
PLAINFIELD $120,375,490$950,126,090 $1,070,501,580 11.2%
PLAINVILLE $120,296,720$1,411,300,615 $1,531,597,335 7.9%
PLYMOUTH $50,748,350$774,186,269 $824,934,619 6.2%
POMFRET $93,085,760$346,887,189 $439,972,949 21.2%
PORTLAND $51,336,920$811,496,018 $862,832,938 5.9%
PRESTON $73,910,491$395,648,886 $469,559,377 15.7%
B - 26
* Source: Municipal form M-13 filed with OPM
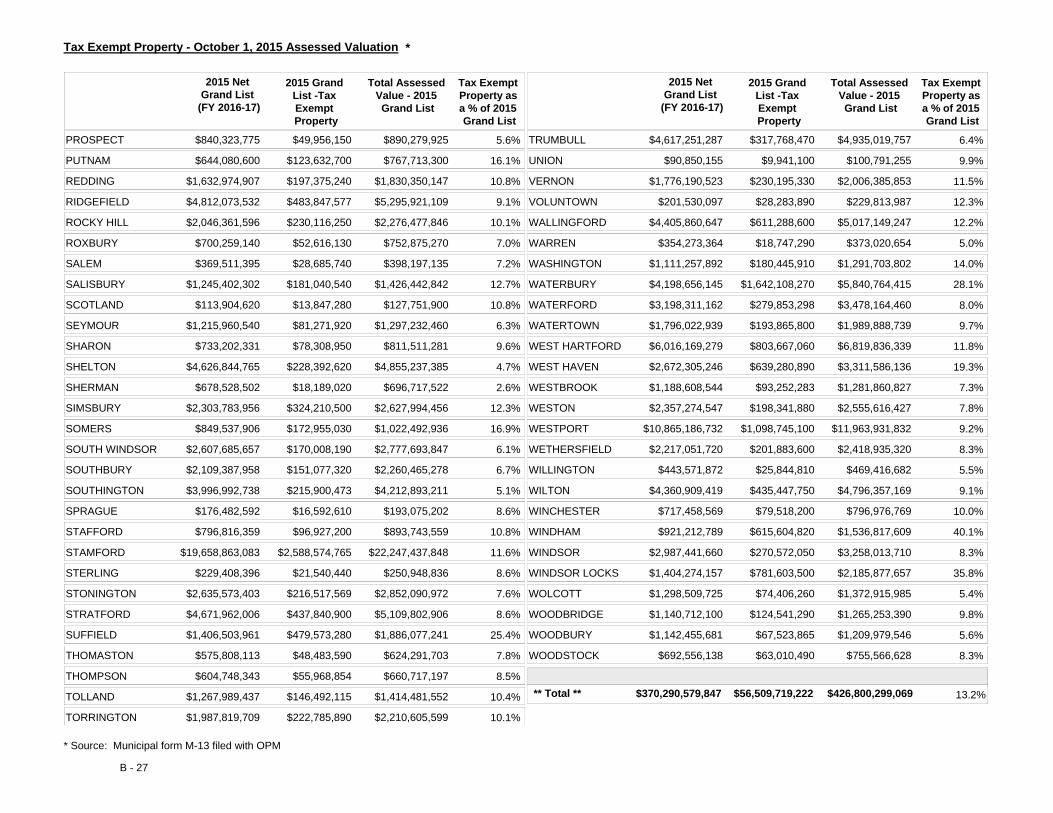
Tax Exempt Property - October 1, 2015 Assessed Valuation *
2015 Grand List -Tax Exempt Property
2015 Net Grand List
(FY 2016-17)
Total Assessed Value - 2015 Grand List
Tax Exempt Property as a % of 2015 Grand List
PROSPECT $49,956,150$840,323,775 $890,279,925 5.6%
PUTNAM $123,632,700$644,080,600 $767,713,300 16.1%
REDDING $197,375,240$1,632,974,907 $1,830,350,147 10.8%
RIDGEFIELD $483,847,577$4,812,073,532 $5,295,921,109 9.1%
ROCKY HILL $230,116,250$2,046,361,596 $2,276,477,846 10.1%
ROXBURY $52,616,130$700,259,140 $752,875,270 7.0%
SALEM $28,685,740$369,511,395 $398,197,135 7.2%
SALISBURY $181,040,540$1,245,402,302 $1,426,442,842 12.7%
SCOTLAND $13,847,280$113,904,620 $127,751,900 10.8%
SEYMOUR $81,271,920$1,215,960,540 $1,297,232,460 6.3%
SHARON $78,308,950$733,202,331 $811,511,281 9.6%
SHELTON $228,392,620$4,626,844,765 $4,855,237,385 4.7%
SHERMAN $18,189,020$678,528,502 $696,717,522 2.6%
SIMSBURY $324,210,500$2,303,783,956 $2,627,994,456 12.3%
SOMERS $172,955,030$849,537,906 $1,022,492,936 16.9%
SOUTH WINDSOR $170,008,190$2,607,685,657 $2,777,693,847 6.1%
SOUTHBURY $151,077,320$2,109,387,958 $2,260,465,278 6.7%
SOUTHINGTON $215,900,473$3,996,992,738 $4,212,893,211 5.1%
SPRAGUE $16,592,610$176,482,592 $193,075,202 8.6%
STAFFORD $96,927,200$796,816,359 $893,743,559 10.8%
STAMFORD $2,588,574,765$19,658,863,083 $22,247,437,848 11.6%
STERLING $21,540,440$229,408,396 $250,948,836 8.6%
STONINGTON $216,517,569$2,635,573,403 $2,852,090,972 7.6%
STRATFORD $437,840,900$4,671,962,006 $5,109,802,906 8.6%
SUFFIELD $479,573,280$1,406,503,961 $1,886,077,241 25.4%
THOMASTON $48,483,590$575,808,113 $624,291,703 7.8%
THOMPSON $55,968,854$604,748,343 $660,717,197 8.5%
TOLLAND $146,492,115$1,267,989,437 $1,414,481,552 10.4%
TORRINGTON $222,785,890$1,987,819,709 $2,210,605,599 10.1%
2015 Grand List -Tax Exempt Property
2015 Net Grand List
(FY 2016-17)
Total Assessed Value - 2015 Grand List
Tax Exempt Property as a % of 2015 Grand List
TRUMBULL $317,768,470$4,617,251,287 $4,935,019,757 6.4%
UNION $9,941,100$90,850,155 $100,791,255 9.9%
VERNON $230,195,330$1,776,190,523 $2,006,385,853 11.5%
VOLUNTOWN $28,283,890$201,530,097 $229,813,987 12.3%
WALLINGFORD $611,288,600$4,405,860,647 $5,017,149,247 12.2%
WARREN $18,747,290$354,273,364 $373,020,654 5.0%
WASHINGTON $180,445,910$1,111,257,892 $1,291,703,802 14.0%
WATERBURY $1,642,108,270$4,198,656,145 $5,840,764,415 28.1%
WATERFORD $279,853,298$3,198,311,162 $3,478,164,460 8.0%
WATERTOWN $193,865,800$1,796,022,939 $1,989,888,739 9.7%
WEST HARTFORD $803,667,060$6,016,169,279 $6,819,836,339 11.8%
WEST HAVEN $639,280,890$2,672,305,246 $3,311,586,136 19.3%
WESTBROOK $93,252,283$1,188,608,544 $1,281,860,827 7.3%
WESTON $198,341,880$2,357,274,547 $2,555,616,427 7.8%
WESTPORT $1,098,745,100$10,865,186,732 $11,963,931,832 9.2%
WETHERSFIELD $201,883,600$2,217,051,720 $2,418,935,320 8.3%
WILLINGTON $25,844,810$443,571,872 $469,416,682 5.5%
WILTON $435,447,750$4,360,909,419 $4,796,357,169 9.1%
WINCHESTER $79,518,200$717,458,569 $796,976,769 10.0%
WINDHAM $615,604,820$921,212,789 $1,536,817,609 40.1%
WINDSOR $270,572,050$2,987,441,660 $3,258,013,710 8.3%
WINDSOR LOCKS $781,603,500$1,404,274,157 $2,185,877,657 35.8%
WOLCOTT $74,406,260$1,298,509,725 $1,372,915,985 5.4%
WOODBRIDGE $124,541,290$1,140,712,100 $1,265,253,390 9.8%
WOODBURY $67,523,865$1,142,455,681 $1,209,979,546 5.6%
WOODSTOCK $63,010,490$692,556,138 $755,566,628 8.3%
** Total ** $370,290,579,847 $56,509,719,222 $426,800,299,069 13.2%
B - 27
* Source: Municipal form M-13 filed with OPM

Based on the 10/1/2015 grand list (without exemptions) and its components.
B - 28
Residential$253,554,113,062 ; 67.9%
Comm'l/Indust'l/Pub Util$65,382,897,159 ; 17.5%
Motor Vehicle$24,388,754,813 ; 6.5%
Personal$25,183,960,233 ; 6.7% Other
$4,745,075,230 ; 1.3%
Grand List Components

Grand List Components
Oct. 1, 2015
Grand List
Assessment
*** % of 10/1/15 Grand List Assessment ***
Residen
tial
Comm'l/
Indust'l/
Pub UtilMotor
Vehicle Personal Other
ANDOVER $268,205,450 81.8% 2.9% 10.4% 2.7% 2.2%
ANSONIA $906,600,896 71.8% 11.7% 10.8% 5.7% 0.0%
ASHFORD $302,492,018 75.0% 7.3% 10.3% 3.5% 4.0%
AVON $2,622,997,710 76.4% 12.4% 6.8% 4.3% 0.2%
BARKHAMSTED $353,657,530 70.5% 5.2% 9.2% 4.7% 10.4%
BEACON FALLS $497,214,449 74.0% 9.1% 8.7% 5.5% 2.6%
BERLIN $2,280,712,805 61.5% 16.9% 8.9% 11.2% 1.5%
BETHANY $558,071,117 81.4% 5.4% 8.6% 3.9% 0.6%
BETHEL $1,947,380,390 67.0% 15.3% 7.3% 8.2% 2.2%
BETHLEHEM $373,577,708 79.7% 6.6% 9.1% 2.3% 2.3%
BLOOMFIELD $2,160,579,780 46.9% 27.4% 7.1% 18.5% 0.2%
BOLTON $434,870,028 80.0% 5.7% 9.3% 2.7% 2.3%
BOZRAH $234,145,694 59.8% 14.6% 10.0% 12.0% 3.5%
BRANFORD $3,534,071,689 73.5% 14.7% 6.6% 4.7% 0.5%
BRIDGEPORT $6,181,551,520 50.2% 26.2% 7.6% 14.6% 1.3%
BRIDGEWATER $392,556,662 87.5% 1.1% 4.6% 1.1% 5.8%
BRISTOL $4,131,663,366 57.1% 20.5% 9.0% 12.6% 0.8%
BROOKFIELD $2,289,759,563 70.0% 16.0% 6.3% 5.9% 1.7%
BROOKLYN $547,417,969 65.9% 13.0% 10.4% 7.9% 2.8%
BURLINGTON $909,069,801 81.9% 2.0% 9.5% 1.6% 4.9%
CANAAN $173,358,780 75.5% 10.8% 4.8% 7.5% 1.4%
CANTERBURY $363,447,792 75.8% 6.0% 11.0% 3.1% 4.0%
CANTON $1,110,154,879 74.4% 13.5% 7.6% 4.0% 0.6%
CHAPLIN $162,459,310 70.1% 6.0% 10.7% 12.1% 1.1%
CHESHIRE $2,834,996,944 70.4% 13.3% 8.5% 7.2% 0.7%
CHESTER $455,006,850 70.2% 17.0% 6.2% 5.2% 1.3%
CLINTON $1,533,138,129 75.2% 13.0% 6.4% 4.4% 1.0%
COLCHESTER $1,224,948,480 73.9% 10.0% 9.9% 3.7% 2.5%
Oct. 1, 2015
Grand List
Assessment
*** % of 10/1/15 Grand List Assessment ***
Residen
tial
Comm'l/
Indust'l/
Pub UtilMotor
Vehicle Personal Other
COLEBROOK $183,557,262 72.4% 16.0% 6.9% 3.3% 1.4%
COLUMBIA $482,764,340 79.3% 4.5% 9.2% 4.8% 2.2%
CORNWALL $405,826,770 84.8% 3.1% 3.5% 2.5% 6.1%
COVENTRY $957,241,178 82.1% 3.8% 10.5% 3.5% 0.1%
CROMWELL $1,338,804,270 64.7% 16.8% 8.4% 9.3% 0.7%
DANBURY $7,247,289,895 54.4% 28.1% 7.3% 8.2% 1.9%
DARIEN $8,449,073,710 85.5% 8.2% 2.9% 1.9% 1.5%
DEEP RIVER $502,231,402 73.7% 10.4% 7.2% 6.8% 1.8%
DERBY $723,601,738 64.7% 17.8% 9.7% 5.9% 1.8%
DURHAM $717,914,824 64.3% 5.3% 9.1% 7.5% 13.7%
EAST GRANBY $634,774,077 56.4% 14.8% 9.7% 18.8% 0.3%
EAST HADDAM $862,677,310 81.6% 4.8% 8.2% 2.6% 2.8%
EAST HAMPTON $1,129,036,956 79.8% 5.8% 8.6% 2.9% 2.9%
EAST HARTFORD $3,028,888,231 48.6% 24.1% 8.8% 17.7% 0.8%
EAST HAVEN $2,030,341,781 71.3% 16.1% 8.2% 3.2% 1.3%
EAST LYME $2,139,317,223 80.1% 8.9% 6.1% 2.7% 2.1%
EAST WINDSOR $995,878,230 50.4% 29.2% 10.0% 9.4% 1.0%
EASTFORD $153,332,307 71.1% 5.9% 9.8% 9.9% 3.2%
EASTON $1,340,772,789 89.6% 2.7% 5.8% 1.3% 0.7%
ELLINGTON $1,352,174,852 71.6% 13.3% 9.7% 4.7% 0.8%
ENFIELD $2,946,578,445 61.1% 20.5% 8.9% 8.5% 1.0%
ESSEX $1,057,863,491 75.5% 13.6% 6.3% 4.5% 0.1%
FAIRFIELD $10,822,330,914 81.1% 10.3% 4.9% 2.8% 0.9%
FARMINGTON $3,638,401,715 62.2% 23.1% 6.4% 7.5% 0.8%
FRANKLIN $205,992,390 53.2% 18.4% 10.4% 12.4% 5.5%
GLASTONBURY $3,941,294,775 71.8% 15.2% 7.4% 4.4% 1.2%
GOSHEN $527,770,710 81.8% 3.7% 5.8% 2.0% 6.7%
GRANBY $976,454,600 82.0% 4.9% 9.2% 2.6% 1.3%
GREENWICH $32,373,787,086 77.1% 18.1% 2.4% 2.1% 0.3%
Note: For purposes of this chart, commercial property ("comm'l") includes apartments. "Other" consists of vacant land, use assessment property and 10 mill forest land.
B - 29

Grand List Components
Oct. 1, 2015
Grand List
Assessment
*** % of 10/1/15 Grand List Assessment ***
Residen
tial
Comm'l/
Indust'l/
Pub UtilMotor
Vehicle Personal Other
GRISWOLD $716,459,555 76.2% 7.4% 10.5% 3.1% 2.8%
GROTON $3,997,813,425 56.0% 26.4% 5.6% 10.3% 1.8%
GUILFORD $3,097,760,155 83.1% 7.6% 6.0% 2.7% 0.6%
HADDAM $909,024,735 74.1% 6.4% 7.5% 8.5% 3.6%
HAMDEN $3,909,737,345 65.8% 21.3% 8.2% 4.4% 0.2%
HAMPTON $140,802,206 72.1% 1.4% 11.3% 11.9% 3.3%
HARTFORD $3,760,381,487 21.8% 48.4% 8.5% 20.6% 0.8%
HARTLAND $198,664,089 73.5% 12.5% 8.4% 3.6% 2.1%
HARWINTON $547,375,809 77.9% 2.4% 10.0% 4.4% 5.3%
HEBRON $790,092,170 83.4% 3.4% 9.4% 2.1% 1.7%
KENT $597,261,461 78.8% 6.5% 4.3% 2.6% 7.8%
KILLINGLY $1,858,754,115 32.0% 20.6% 6.2% 39.1% 2.1%
KILLINGWORTH $728,970,345 86.2% 2.9% 7.8% 2.1% 1.1%
LEBANON $634,737,445 72.5% 3.5% 9.1% 12.1% 2.8%
LEDYARD $1,120,731,280 74.4% 6.2% 9.4% 7.2% 2.8%
LISBON $386,924,464 57.9% 21.5% 7.9% 8.9% 3.7%
LITCHFIELD $1,035,746,278 75.8% 10.5% 7.0% 3.2% 3.5%
LYME $521,012,001 90.1% 0.9% 4.0% 1.3% 3.6%
MADISON $2,882,649,641 85.0% 6.2% 5.6% 2.1% 1.1%
MANCHESTER $4,082,952,599 52.6% 28.8% 8.3% 10.4% 0.0%
MANSFIELD $1,080,047,527 64.0% 21.5% 7.3% 6.8% 0.3%
MARLBOROUGH $577,884,466 83.6% 5.3% 9.0% 2.0% 0.2%
MERIDEN $3,308,087,740 60.6% 21.3% 9.4% 8.4% 0.3%
MIDDLEBURY $949,399,249 72.5% 11.7% 6.8% 5.5% 3.5%
MIDDLEFIELD $428,557,080 75.8% 8.5% 8.3% 7.1% 0.3%
MIDDLETOWN $3,534,088,366 49.8% 24.5% 8.1% 16.6% 1.0%
MILFORD $6,592,727,637 65.3% 20.8% 5.8% 7.0% 1.1%
MONROE $2,170,608,614 75.5% 11.2% 7.7% 4.2% 1.5%
Oct. 1, 2015
Grand List
Assessment
*** % of 10/1/15 Grand List Assessment ***
Residen
tial
Comm'l/
Indust'l/
Pub UtilMotor
Vehicle Personal Other
MONTVILLE $1,319,539,853 65.5% 13.4% 9.2% 11.7% 0.2%
MORRIS $300,831,865 83.5% 2.3% 6.5% 2.1% 5.6%
NAUGATUCK $1,641,196,105 65.3% 14.2% 11.3% 7.7% 1.7%
NEW BRITAIN $2,615,629,520 55.3% 23.2% 10.8% 10.3% 0.5%
NEW CANAAN $8,220,881,950 89.2% 5.5% 3.2% 0.9% 1.2%
NEW FAIRFIELD $1,592,842,951 88.8% 2.8% 7.2% 1.2% 0.0%
NEW HARTFORD $669,122,762 77.0% 4.9% 8.7% 4.6% 4.7%
NEW HAVEN $6,339,095,670 43.4% 38.6% 6.0% 11.3% 0.6%
NEW LONDON $1,310,351,181 47.0% 35.6% 7.8% 8.7% 0.9%
NEW MILFORD $2,959,808,880 67.6% 13.2% 7.4% 7.2% 4.6%
NEWINGTON $2,702,302,216 60.9% 22.3% 8.2% 8.0% 0.6%
NEWTOWN $3,133,778,404 77.8% 8.3% 7.6% 4.0% 2.2%
NORFOLK $299,098,658 83.3% 5.0% 4.7% 2.4% 4.6%
NORTH BRANFORD $1,254,433,296 72.6% 12.4% 9.3% 4.5% 1.2%
NORTH CANAAN $351,715,115 49.6% 26.0% 6.3% 16.6% 1.4%
NORTH HAVEN $2,907,899,055 60.5% 21.9% 7.6% 9.8% 0.2%
NORTH STONINGTON $518,737,375 70.1% 9.8% 8.6% 5.6% 5.9%
NORWALK $12,160,971,005 62.8% 24.1% 5.2% 6.7% 1.2%
NORWICH $1,849,982,102 55.4% 23.7% 10.6% 8.0% 2.3%
OLD LYME $1,580,113,825 86.3% 5.1% 4.5% 2.4% 1.7%
OLD SAYBROOK $2,227,806,290 76.9% 13.5% 4.7% 3.4% 1.5%
ORANGE $1,958,077,360 63.1% 20.6% 6.8% 7.5% 2.0%
OXFORD $1,463,102,350 74.7% 6.8% 8.0% 7.5% 3.0%
PLAINFIELD $970,375,120 53.6% 19.9% 9.4% 14.6% 2.6%
PLAINVILLE $1,417,749,527 57.8% 22.4% 10.0% 8.2% 1.6%
PLYMOUTH $780,253,179 71.6% 8.2% 11.0% 4.6% 4.6%
POMFRET $350,167,749 73.3% 7.4% 9.2% 6.9% 3.2%
PORTLAND $814,564,421 73.4% 9.6% 8.8% 4.7% 3.5%
PRESTON $398,518,626 73.3% 6.8% 9.1% 6.8% 4.0%
Note: For purposes of this chart, commercial property ("comm'l") includes apartments. "Other" consists of vacant land, use assessment property and 10 mill forest land.
B - 30

Grand List Components
Oct. 1, 2015
Grand List
Assessment
*** % of 10/1/15 Grand List Assessment ***
Residen
tial
Comm'l/
Indust'l/
Pub UtilMotor
Vehicle Personal Other
PROSPECT $844,986,725 77.6% 7.0% 10.0% 4.4% 1.0%
PUTNAM $648,764,380 49.2% 24.2% 10.0% 14.2% 2.4%
REDDING $1,633,632,017 80.1% 7.8% 5.6% 4.3% 2.2%
RIDGEFIELD $4,874,245,358 79.5% 10.8% 5.0% 3.7% 1.0%
ROCKY HILL $2,051,039,897 56.8% 28.6% 8.1% 6.3% 0.2%
ROXBURY $701,069,430 87.7% 0.4% 3.9% 1.1% 6.9%
SALEM $372,166,741 79.1% 4.9% 9.2% 3.5% 3.3%
SALISBURY $1,246,933,977 85.9% 4.6% 2.9% 1.9% 4.7%
SCOTLAND $114,746,550 81.5% 1.3% 10.5% 3.3% 3.4%
SEYMOUR $1,221,995,580 72.0% 10.6% 9.3% 6.3% 1.8%
SHARON $735,826,631 82.1% 5.7% 3.5% 2.4% 6.3%
SHELTON $4,638,002,575 64.5% 19.3% 7.0% 9.0% 0.2%
SHERMAN $681,080,692 91.7% 0.7% 5.0% 1.3% 1.4%
SIMSBURY $2,309,019,114 73.3% 12.9% 8.0% 4.7% 1.1%
SOMERS $855,527,496 77.3% 5.3% 9.3% 5.2% 2.9%
SOUTH WINDSOR $2,648,375,495 62.4% 17.7% 8.2% 10.3% 1.4%
SOUTHBURY $2,141,452,308 70.8% 14.5% 7.2% 5.8% 1.8%
SOUTHINGTON $4,016,803,386 68.9% 13.6% 9.4% 6.5% 1.6%
SPRAGUE $178,125,122 62.9% 10.0% 10.6% 11.3% 5.2%
STAFFORD $815,173,959 68.7% 8.4% 10.6% 9.3% 3.0%
STAMFORD $19,779,393,103 54.9% 33.9% 4.7% 6.6% 0.0%
STERLING $231,999,365 65.0% 5.8% 11.0% 7.8% 10.4%
STONINGTON $2,652,017,400 73.1% 14.8% 5.3% 4.1% 2.6%
STRATFORD $4,706,793,516 63.3% 18.1% 7.1% 10.0% 1.4%
SUFFIELD $1,412,503,271 76.3% 7.6% 8.0% 7.2% 0.9%
THOMASTON $580,659,626 62.4% 12.5% 10.0% 11.8% 3.4%
THOMPSON $613,391,623 74.0% 5.7% 11.4% 5.7% 3.2%
TOLLAND $1,275,802,952 79.2% 7.5% 10.1% 2.8% 0.4%
TORRINGTON $2,005,392,659 60.5% 17.7% 10.7% 10.2% 0.9%
Oct. 1, 2015
Grand List
Assessment
*** % of 10/1/15 Grand List Assessment ***
Residen
tial
Comm'l/
Indust'l/
Pub UtilMotor
Vehicle Personal Other
TRUMBULL $4,640,117,467 67.5% 19.6% 6.1% 6.2% 0.6%
UNION $91,270,195 74.3% 6.1% 8.8% 5.3% 5.5%
VERNON $1,784,795,803 64.2% 20.7% 10.1% 4.6% 0.4%
VOLUNTOWN $204,206,237 78.5% 4.6% 9.7% 3.7% 3.5%
WALLINGFORD $4,447,362,022 60.2% 20.3% 8.0% 10.7% 0.7%
WARREN $355,174,194 85.1% 1.1% 3.4% 1.2% 9.2%
WASHINGTON $1,113,578,802 84.4% 4.6% 3.7% 2.1% 5.2%
WATERBURY $4,364,715,568 47.6% 26.7% 9.5% 15.0% 1.2%
WATERFORD $3,259,069,000 43.3% 26.4% 4.6% 24.3% 1.5%
WATERTOWN $1,805,071,346 68.6% 12.8% 10.2% 8.3% 0.0%
WEST HARTFORD $6,044,386,440 73.4% 15.5% 7.0% 3.6% 0.5%
WEST HAVEN $2,678,007,999 67.2% 17.0% 10.0% 5.1% 0.8%
WESTBROOK $1,212,126,023 73.0% 12.4% 4.7% 6.5% 3.3%
WESTON $2,358,621,287 92.9% 1.2% 4.9% 1.0% 0.0%
WESTPORT $10,873,204,725 80.6% 12.2% 3.0% 2.6% 1.6%
WETHERSFIELD $2,230,717,470 75.5% 12.8% 8.1% 3.5% 0.0%
WILLINGTON $444,214,602 66.7% 15.9% 9.9% 4.6% 2.9%
WILTON $4,363,350,769 74.5% 14.3% 4.6% 5.8% 0.8%
WINCHESTER $719,291,325 68.8% 11.8% 9.6% 7.3% 2.4%
WINDHAM $933,233,550 48.6% 24.9% 10.9% 12.6% 3.1%
WINDSOR $3,012,456,381 47.4% 27.4% 6.7% 17.4% 1.0%
WINDSOR LOCKS $1,418,125,902 39.8% 21.0% 15.7% 22.4% 1.2%
WOLCOTT $1,306,637,885 77.7% 6.6% 10.1% 3.6% 2.0%
WOODBRIDGE $1,142,745,930 80.3% 6.7% 7.3% 4.4% 1.3%
WOODBURY $1,145,159,150 78.5% 8.9% 7.5% 2.7% 2.3%
WOODSTOCK $701,961,203 78.8% 4.6% 9.2% 4.5% 2.9%
$373,254,800,497 67.9% 17.5% 6.5% 6.7% 1.3%** Total **
Note: For purposes of this chart, commercial property ("comm'l") includes apartments. "Other" consists of vacant land, use assessment property and 10 mill forest land.
B - 31

B - 32
$300
$320
$340
$360
$380
$400
$420
$440
$460
$480
$500
$520
$540
$560
$580
$600
2016‐17 2015‐16 2014‐15 2013‐14 2012‐13 2011‐12 2010‐11 2009‐10 2008‐09 2007‐08
Equa
lized
Net Grand
List (billion
s)
Statewide Ten Year Comparison
Equalized Net Grand List

Equalized Net Grand List
Oct. 1 '15 for
FY 2016-2017
Oct. 1 '14 for
FY 2015-2016
ANDOVER $371,631,557 $360,162,930
ANSONIA $1,376,772,795 $1,312,183,325
ASHFORD $442,599,628 $420,881,941
AVON $3,687,550,800 $3,738,989,796
BARKHAMSTED $502,811,081 $494,116,946
BEACON FALLS $675,139,685 $652,767,965
BERLIN $3,282,737,376 $3,116,476,402
BETHANY $835,493,141 $830,045,629
BETHEL $2,795,820,302 $2,824,194,298
BETHLEHEM $489,510,704 $518,047,233
BLOOMFIELD $3,020,013,610 $2,906,211,229
BOLTON $623,371,566 $615,311,148
BOZRAH $335,663,370 $299,941,184
BRANFORD $5,185,659,055 $4,981,495,540
BRIDGEPORT $8,675,714,411 $8,791,072,383
BRIDGEWATER $547,995,101 $508,540,109
BRISTOL $5,566,370,035 $5,414,806,061
BROOKFIELD $3,334,293,606 $3,155,246,251
BROOKLYN $775,936,749 $744,968,939
BURLINGTON $1,296,612,791 $1,307,588,291
CANAAN $227,108,759 $242,191,014
CANTERBURY $511,511,717 $519,471,944
CANTON $1,607,651,531 $1,537,052,180
CHAPLIN $231,600,714 $227,120,155
CHESHIRE $4,007,441,337 $4,154,525,678
CHESTER $653,799,037 $609,028,103
CLINTON $2,175,563,971 $2,136,348,483
COLCHESTER $1,697,800,704 $1,686,095,860
Oct. 1 '15 for
FY 2016-2017
Oct. 1 '14 for
FY 2015-2016
COLEBROOK $260,426,299 $225,255,646
COLUMBIA $698,989,199 $732,773,607
CORNWALL $535,527,005 $487,020,993
COVENTRY $1,425,790,912 $1,329,903,900
CROMWELL $1,942,145,341 $1,881,010,741
DANBURY $10,377,904,867 $10,072,276,173
DARIEN $13,441,534,266 $13,560,177,773
DEEP RIVER $700,774,863 $706,233,946
DERBY $1,027,004,776 $975,413,503
DURHAM $992,588,484 $1,046,399,211
EAST GRANBY $859,087,879 $895,211,928
EAST HADDAM $1,228,377,310 $1,205,467,439
EAST HAMPTON $1,605,563,611 $1,649,862,986
EAST HARTFORD $3,903,976,521 $3,798,403,109
EAST HAVEN $2,913,405,600 $2,668,818,625
EAST LYME $3,157,522,071 $3,067,459,765
EAST WINDSOR $1,352,524,745 $1,390,247,741
EASTFORD $221,338,839 $194,982,983
EASTON $1,900,955,421 $1,953,053,185
ELLINGTON $1,897,496,889 $1,881,408,137
ENFIELD $4,062,151,475 $4,163,607,597
ESSEX $1,484,198,508 $1,561,401,317
FAIRFIELD $15,395,112,106 $16,170,416,830
FARMINGTON $5,329,528,757 $5,115,009,589
FRANKLIN $313,054,323 $302,603,372
GLASTONBURY $5,953,139,268 $5,895,699,482
GOSHEN $747,908,439 $747,314,239
GRANBY $1,448,556,777 $1,397,925,266
GREENWICH $46,177,528,894 $50,031,483,545
Oct. 1 '15 for
FY 2016-2017
Oct. 1 '14 for
FY 2015-2016
GRISWOLD $977,864,767 $963,919,193
GROTON $4,914,736,072 $5,265,116,792
GUILFORD $4,478,517,998 $4,434,076,490
HADDAM $1,295,235,844 $1,270,545,275
HAMDEN $5,521,880,061 $5,578,004,424
HAMPTON $212,505,192 $179,533,474
HARTFORD $7,050,499,019 $6,496,073,222
HARTLAND $283,255,541 $280,259,620
HARWINTON $746,402,313 $772,997,339
HEBRON $1,071,376,676 $1,102,908,486
KENT $825,204,802 $838,582,024
KILLINGLY $1,772,252,233 $1,657,995,334
KILLINGWORTH $1,018,704,217 $1,031,946,948
LEBANON $898,645,327 $874,191,847
LEDYARD $1,557,080,423 $1,558,015,973
LISBON $541,196,238 $555,793,822
LITCHFIELD $1,422,154,129 $1,467,022,228
LYME $695,103,048 $707,481,511
MADISON $4,209,286,504 $4,211,167,689
MANCHESTER $5,549,612,279 $5,623,494,750
MANSFIELD $1,536,756,457 $1,467,364,553
MARLBOROUGH $823,378,394 $837,524,933
MERIDEN $4,482,937,775 $4,573,660,720
MIDDLEBURY $1,354,921,070 $1,365,404,875
MIDDLEFIELD $597,503,926 $582,193,266
MIDDLETOWN $4,904,971,237 $4,729,929,178
MILFORD $9,595,765,061 $9,096,188,398
MONROE $3,114,308,719 $3,066,526,011
B - 33

Equalized Net Grand List
Oct. 1 '15 for
FY 2016-2017
Oct. 1 '14 for
FY 2015-2016
MONTVILLE $1,779,326,759 $1,901,263,919
MORRIS $428,473,618 $423,916,013
NAUGATUCK $2,309,625,442 $2,248,544,821
NEW BRITAIN $3,659,454,405 $3,648,566,782
NEW CANAAN $12,102,749,021 $12,377,454,660
NEW FAIRFIELD $2,375,448,377 $2,255,766,433
NEW HARTFORD $929,942,157 $923,271,139
NEW HAVEN $10,248,531,793 $9,723,396,015
NEW LONDON $1,850,395,191 $1,858,962,622
NEW MILFORD $4,102,917,657 $4,150,983,903
NEWINGTON $3,732,257,306 $3,863,277,039
NEWTOWN $4,507,343,813 $4,558,435,297
NORFOLK $369,963,681 $390,375,013
NORTH BRANFORD $1,759,467,896 $1,868,349,731
NORTH CANAAN $434,299,950 $423,613,307
NORTH HAVEN $4,058,639,886 $3,931,374,956
NORTH STONINGTON $732,984,049 $718,244,997
NORWALK $19,278,296,085 $17,956,313,819
NORWICH $2,707,000,525 $2,670,158,201
OLD LYME $2,257,046,618 $2,235,564,264
OLD SAYBROOK $3,284,001,676 $3,181,508,486
ORANGE $2,821,921,301 $2,891,806,320
OXFORD $2,066,309,614 $2,121,407,917
PLAINFIELD $1,340,096,639 $1,315,005,038
PLAINVILLE $1,903,145,342 $1,936,585,287
PLYMOUTH $1,044,566,376 $1,052,827,086
POMFRET $490,571,570 $469,782,177
PORTLAND $1,216,996,256 $1,124,230,415
PRESTON $561,386,148 $538,805,849
Oct. 1 '15 for
FY 2016-2017
Oct. 1 '14 for
FY 2015-2016
PROSPECT $1,194,661,789 $1,212,916,005
PUTNAM $917,122,082 $873,806,123
REDDING $2,448,565,997 $2,302,598,148
RIDGEFIELD $7,178,046,688 $7,212,648,901
ROCKY HILL $3,059,763,412 $3,193,390,993
ROXBURY $993,373,056 $944,561,939
SALEM $525,692,171 $496,154,901
SALISBURY $1,776,854,716 $1,644,012,796
SCOTLAND $153,419,903 $151,789,305
SEYMOUR $1,707,622,371 $1,702,581,361
SHARON $1,041,780,156 $926,930,282
SHELTON $6,807,601,488 $6,691,388,869
SHERMAN $1,010,075,818 $993,367,439
SIMSBURY $3,600,147,476 $3,586,049,744
SOMERS $1,208,933,114 $1,243,529,110
SOUTH WINDSOR $3,793,497,465 $3,624,125,847
SOUTHBURY $3,110,267,822 $3,186,299,045
SOUTHINGTON $5,582,080,126 $5,705,132,586
SPRAGUE $248,829,842 $254,681,402
STAFFORD $1,101,222,496 $1,101,177,516
STAMFORD $32,919,448,013 $32,163,709,171
STERLING $338,381,572 $320,149,040
STONINGTON $4,024,424,141 $3,994,188,057
STRATFORD $6,666,989,582 $6,353,037,221
SUFFIELD $2,007,892,425 $1,994,576,433
THOMASTON $763,493,537 $773,308,066
THOMPSON $944,526,861 $834,528,271
TOLLAND $1,815,100,661 $1,793,859,607
TORRINGTON $2,798,903,684 $2,760,539,379
Oct. 1 '15 for
FY 2016-2017
Oct. 1 '14 for
FY 2015-2016
TRUMBULL $6,564,257,539 $6,760,747,989
UNION $130,349,340 $118,614,798
VERNON $2,514,856,753 $2,546,983,355
VOLUNTOWN $288,676,721 $275,601,575
WALLINGFORD $6,012,104,553 $6,194,564,722
WARREN $522,128,521 $535,161,654
WASHINGTON $1,797,628,194 $1,735,039,846
WATERBURY $5,805,276,093 $5,554,511,500
WATERFORD $4,530,813,120 $4,639,975,435
WATERTOWN $2,613,640,810 $2,612,679,887
WEST HARTFORD $9,251,991,620 $9,323,512,094
WEST HAVEN $3,761,443,254 $3,964,415,227
WESTBROOK $1,797,325,216 $1,714,853,284
WESTON $3,542,264,876 $3,584,903,135
WESTPORT $15,522,449,617 $16,602,814,905
WETHERSFIELD $3,174,823,747 $3,104,460,582
WILLINGTON $614,961,716 $615,677,862
WILTON $6,590,104,067 $6,535,481,935
WINCHESTER $1,035,239,070 $931,621,000
WINDHAM $1,327,764,697 $1,256,841,394
WINDSOR $4,440,057,842 $4,259,039,357
WINDSOR LOCKS $1,902,931,359 $1,699,667,421
WOLCOTT $1,866,134,566 $1,821,732,370
WOODBRIDGE $1,650,627,062 $1,637,008,171
WOODBURY $1,540,777,617 $1,548,752,497
WOODSTOCK $1,026,593,476 $972,558,229
** Total ** $541,657,442,965 $541,141,691,309
B - 34

New Housing Authorizations - by Unit Type with
Demolition Data, Calendar Year 2016
1 -
Unit
2 -
Unit
5 or
More
Units
2016
Total
UnitsDemo
litions
3 and
4 Units
2015
Total
Units
---------------------2016 Data------------------------
ANDOVER 3 0 03 0 04
ANSONIA 0 0 30 0 00
ASHFORD 5 2 27 0 02
AVON 19 0 319 0 031
BARKHAMSTED 0 0 00 0 03
BEACON FALLS 19 4 023 0 021
BERLIN 11 0 111 0 028
BETHANY 3 0 03 0 03
BETHEL 66 2 068 0 0118
BETHLEHEM 2 0 02 0 02
BLOOMFIELD 28 0 11411 0 38316
BOLTON 4 0 24 0 05
BOZRAH 1 0 01 0 00
BRANFORD 27 0 1327 0 025
BRIDGEPORT 4 10 7469 0 55119
BRIDGEWATER 0 0 20 0 00
BRISTOL 37 0 1337 0 030
BROOKFIELD 28 0 128 0 050
BROOKLYN 10 0 410 0 08
BURLINGTON 20 0 020 0 017
CANAAN 0 0 10 0 00
CANTERBURY 10 0 510 0 00
CANTON 5 0 05 0 010
CHAPLIN 1 0 01 0 01
CHESHIRE 29 0 729 0 041
CHESTER 4 0 14 0 00
CLINTON 13 0 813 0 06
COLCHESTER 29 34 063 0 032
1 -
Unit
2 -
Unit
5 or
More
Units
2016
Total
UnitsDemo
litions
3 and
4 Units
2015
Total
Units
---------------------2016 Data------------------------
COLEBROOK 0 0 00 0 01
COLUMBIA 7 0 67 0 013
CORNWALL 2 0 02 0 01
COVENTRY 19 0 619 0 032
CROMWELL 18 0 018 0 019
DANBURY 57 2 5482 3 20551
DARIEN 30 0 3630 0 064
DEEP RIVER 2 0 02 0 01
DERBY 2 0 02 0 05
DURHAM 6 0 06 0 06
EAST GRANBY 4 0 04 0 01
EAST HADDAM 14 0 017 3 06
EAST HAMPTON 24 0 324 0 048
EAST HARTFORD 1 0 31 0 03
EAST HAVEN 6 0 16 0 019
EAST LYME 24 0 2228 4 0106
EAST WINDSOR 20 0 920 0 013
EASTFORD 3 0 03 0 03
EASTON 6 0 36 0 05
ELLINGTON 40 0 490 0 50112
ENFIELD 3 0 1103 0 10016
ESSEX 10 0 232 0 224
FAIRFIELD 70 16 86258 7 16598
FARMINGTON 21 0 641 20 031
FRANKLIN 2 0 02 0 00
GLASTONBURY 30 4 434 0 041
GOSHEN 4 0 04 0 03
GRANBY 13 0 149 0 367
GREENWICH 128 0 107128 0 0138
B - 35
Data is for residential housing only and is based on housing permit and demolition data from the Dept. of Economic and Community Development.

New Housing Authorizations - by Unit Type with
Demolition Data, Calendar Year 2016
1 -
Unit
2 -
Unit
5 or
More
Units
2016
Total
UnitsDemo
litions
3 and
4 Units
2015
Total
Units
---------------------2016 Data------------------------
GRISWOLD 11 0 511 0 04
GROTON 21 0 421 0 022
GUILFORD 12 0 012 0 021
HADDAM 9 0 19 0 012
HAMDEN 5 0 1431 0 2633
HAMPTON 0 0 00 0 00
HARTFORD 5 0 85 0 06
HARTLAND 1 0 01 0 01
HARWINTON 5 0 05 0 05
HEBRON 10 0 010 0 014
KENT 2 2 07 3 01
KILLINGLY 45 0 445 0 020
KILLINGWORTH 3 0 13 0 04
LEBANON 11 0 619 0 82
LEDYARD 18 2 220 0 013
LISBON 6 0 06 0 05
LITCHFIELD 12 0 012 0 09
LYME 5 0 35 0 03
MADISON 23 0 1223 0 018
MANCHESTER 12 2 914 0 0118
MANSFIELD 4 0 34 0 08
MARLBOROUGH 3 0 03 0 04
MERIDEN 1 0 364 0 630
MIDDLEBURY 27 0 1727 0 021
MIDDLEFIELD 9 0 19 0 06
MIDDLETOWN 22 0 025 3 0123
MILFORD 29 0 33178 0 149358
MONROE 10 0 610 0 05
1 -
Unit
2 -
Unit
5 or
More
Units
2016
Total
UnitsDemo
litions
3 and
4 Units
2015
Total
Units
---------------------2016 Data------------------------
MONTVILLE 5 4 59 0 08
MORRIS 1 0 01 0 01
NAUGATUCK 8 0 58 0 018
NEW BRITAIN 32 0 032 0 06
NEW CANAAN 26 0 5826 0 041
NEW FAIRFIELD 10 0 210 0 012
NEW HARTFORD 9 0 09 0 05
NEW HAVEN 7 0 47227 7 213262
NEW LONDON 39 0 039 0 041
NEW MILFORD 10 0 348 0 3822
NEWINGTON 10 0 110 0 014
NEWTOWN 22 0 342 0 2029
NORFOLK 5 0 05 0 01
NORTH BRANFORD 10 0 010 0 04
NORTH CANAAN 0 0 50 0 01
NORTH HAVEN 9 0 59 0 08
NORTH STONINGTON 12 0 012 0 07
NORWALK 21 8 21199 9 161350
NORWICH 2 0 222 0 204
OLD LYME 8 0 18 0 015
OLD SAYBROOK 18 2 035 0 1513
ORANGE 25 0 325 0 020
OXFORD 19 4 123 0 016
PLAINFIELD 11 0 1111 0 015
PLAINVILLE 7 0 57 0 08
PLYMOUTH 5 0 05 0 05
POMFRET 7 0 07 0 05
PORTLAND 8 0 28 0 06
PRESTON 6 0 36 0 011
B - 36
Data is for residential housing only and is based on housing permit and demolition data from the Dept. of Economic and Community Development.

New Housing Authorizations - by Unit Type with
Demolition Data, Calendar Year 2016
1 -
Unit
2 -
Unit
5 or
More
Units
2016
Total
UnitsDemo
litions
3 and
4 Units
2015
Total
Units
---------------------2016 Data------------------------
PROSPECT 19 0 022 3 029
PUTNAM 14 0 614 0 03
REDDING 5 0 15 0 05
RIDGEFIELD 9 0 552 0 4326
ROCKY HILL 15 0 020 0 5110
ROXBURY 3 0 03 0 02
SALEM 9 0 09 0 09
SALISBURY 4 0 34 0 06
SCOTLAND 0 0 00 0 00
SEYMOUR 3 0 03 0 078
SHARON 3 0 93 0 07
SHELTON 46 0 846 0 0191
SHERMAN 2 0 52 0 05
SIMSBURY 17 0 3250 3 23093
SOMERS 16 0 016 0 015
SOUTH WINDSOR 57 6 10141 0 7843
SOUTHBURY 12 0 712 0 016
SOUTHINGTON 99 0 099 0 068
SPRAGUE 1 0 11 0 00
STAFFORD 36 0 185 0 492
STAMFORD 50 6 67720 0 664639
STERLING 4 0 14 0 04
STONINGTON 26 0 026 0 0236
STRATFORD 25 0 025 0 037
SUFFIELD 34 0 034 0 033
THOMASTON 12 2 014 0 011
THOMPSON 8 0 48 0 013
TOLLAND 7 0 27 0 07
TORRINGTON 0 0 60 0 04
1 -
Unit
2 -
Unit
5 or
More
Units
2016
Total
UnitsDemo
litions
3 and
4 Units
2015
Total
Units
---------------------2016 Data------------------------
TRUMBULL 8 0 68 0 08
UNION 0 0 00 0 01
VERNON 5 10 5111 4 92175
VOLUNTOWN 5 0 05 0 05
WALLINGFORD 22 0 022 0 021
WARREN 1 0 11 0 01
WASHINGTON 4 0 04 0 06
WATERBURY 40 0 6740 0 071
WATERFORD 17 0 517 0 08
WATERTOWN 20 0 320 0 09
WEST HARTFORD 10 0 151 0 41104
WEST HAVEN 8 0 2475 0 6722
WESTBROOK 4 6 815 0 548
WESTON 14 0 014 0 07
WESTPORT 66 0 7466 0 091
WETHERSFIELD 0 0 00 0 00
WILLINGTON 4 0 028 0 240
WILTON 9 0 39 0 09
WINCHESTER 0 0 00 0 00
WINDHAM 3 0 83 0 09
WINDSOR 18 0 518 0 017
WINDSOR LOCKS 21 0 221 0 023
WOLCOTT 13 0 317 4 027
WOODBRIDGE 0 0 00 0 04
WOODBURY 8 0 08 0 06
WOODSTOCK 8 0 28 0 010
B - 37
Data is for residential housing only and is based on housing permit and demolition data from the Dept. of Economic and Community Development.

2016 Median Values - Owner Occupied
Homes*
Median
Value
Margin of
Error
ANDOVER $281,700 $15,616+/-
ANSONIA $214,800 $7,879+/-
ASHFORD $237,600 $15,394+/-
AVON $374,300 $14,993+/-
BARKHAMSTED $251,400 $19,933+/-
BEACON FALLS $231,800 $19,691+/-
BERLIN $288,000 $7,338+/-
BETHANY $343,500 $21,985+/-
BETHEL $335,800 $9,592+/-
BETHLEHEM $351,200 $22,837+/-
BLOOMFIELD $211,800 $8,794+/-
BOLTON $292,900 $17,195+/-
BOZRAH $232,900 $14,034+/-
BRANFORD $293,600 $9,452+/-
BRIDGEPORT $168,200 $2,736+/-
BRIDGEWATER $505,200 $52,291+/-
BRISTOL $192,500 $4,549+/-
BROOKFIELD $358,500 $11,262+/-
BROOKLYN $224,200 $9,843+/-
BURLINGTON $324,100 $18,121+/-
CANAAN $278,700 $29,911+/-
CANTERBURY $224,000 $17,458+/-
CANTON $297,400 $15,177+/-
CHAPLIN $200,500 $12,854+/-
CHESHIRE $330,600 $7,714+/-
CHESTER $354,300 $23,714+/-
CLINTON $286,200 $8,581+/-
COLCHESTER $268,500 $8,696+/-
Median
Value
Margin of
Error
COLEBROOK $270,700 $19,253+/-
COLUMBIA $242,300 $12,854+/-
CORNWALL $420,100 $46,284+/-
COVENTRY $252,600 $14,532+/-
CROMWELL $245,100 $11,069+/-
DANBURY $286,400 $5,437+/-
DARIEN $1,248,200 $69,247+/-
DEEP RIVER $275,100 $12,946+/-
DERBY $199,400 $14,560+/-
DURHAM $345,400 $16,596+/-
EAST GRANBY $296,000 $19,986+/-
EAST HADDAM $279,500 $11,334+/-
EAST HAMPTON $258,900 $12,815+/-
EAST HARTFORD $163,300 $3,464+/-
EAST HAVEN $207,000 $6,185+/-
EAST LYME $298,600 $9,715+/-
EAST WINDSOR $205,900 $13,972+/-
EASTFORD $244,800 $16,950+/-
EASTON $629,200 $24,652+/-
ELLINGTON $264,100 $18,609+/-
ENFIELD $184,000 $2,914+/-
ESSEX $363,600 $22,637+/-
FAIRFIELD $589,500 $11,676+/-
FARMINGTON $329,900 $12,031+/-
FRANKLIN $239,900 $9,884+/-
GLASTONBURY $343,600 $6,351+/-
GOSHEN $362,600 $21,804+/-
GRANBY $288,500 $13,088+/-
GREENWICH $1,205,600 $40,637+/-
Median
Value
Margin of
Error
GRISWOLD $192,500 $18,871+/-
GROTON $247,100 $9,628+/-
GUILFORD $385,500 $11,057+/-
HADDAM $297,300 $17,142+/-
HAMDEN $228,200 $5,410+/-
HAMPTON $224,500 $10,580+/-
HARTFORD $159,100 $3,499+/-
HARTLAND $266,300 $12,362+/-
HARWINTON $282,900 $14,549+/-
HEBRON $299,700 $15,906+/-
KENT $365,800 $33,700+/-
KILLINGLY $187,300 $6,496+/-
KILLINGWORTH $372,800 $23,098+/-
LEBANON $255,500 $15,725+/-
LEDYARD $243,000 $10,489+/-
LISBON $220,900 $15,327+/-
LITCHFIELD $312,400 $17,465+/-
LYME $497,300 $78,307+/-
MADISON $440,600 $16,238+/-
MANCHESTER $183,000 $3,697+/-
MANSFIELD $235,500 $9,783+/-
MARLBOROUGH $303,600 $27,812+/-
MERIDEN $174,800 $3,846+/-
MIDDLEBURY $353,800 $12,511+/-
MIDDLEFIELD $304,100 $24,708+/-
MIDDLETOWN $228,500 $4,998+/-
MILFORD $306,000 $6,839+/-
MONROE $374,500 $13,018+/-
* Source: U.S. Census Bureau 2012-16 American Community Survey
B - 38

2016 Median Values - Owner Occupied
Homes*
Median
Value
Margin of
Error
MONTVILLE $191,700 $5,898+/-
MORRIS $344,000 $19,991+/-
NAUGATUCK $178,800 $6,500+/-
NEW BRITAIN $157,300 $3,149+/-
NEW CANAAN $1,373,100 $122,251+/-
NEW FAIRFIELD $356,300 $11,360+/-
NEW HARTFORD $294,600 $19,424+/-
NEW HAVEN $190,700 $6,538+/-
NEW LONDON $183,900 $6,633+/-
NEW MILFORD $288,200 $9,570+/-
NEWINGTON $228,000 $4,252+/-
NEWTOWN $402,200 $12,464+/-
NORFOLK $310,900 $38,548+/-
NORTH BRANFORD $282,600 $8,952+/-
NORTH CANAAN $212,100 $18,369+/-
NORTH HAVEN $295,500 $6,950+/-
NORTH STONINGTON $290,000 $16,489+/-
NORWALK $416,800 $10,179+/-
NORWICH $169,600 $5,562+/-
OLD LYME $408,100 $22,255+/-
OLD SAYBROOK $373,600 $14,246+/-
ORANGE $382,300 $7,436+/-
OXFORD $346,500 $10,665+/-
PLAINFIELD $169,900 $4,920+/-
PLAINVILLE $204,000 $10,618+/-
PLYMOUTH $188,900 $5,228+/-
POMFRET $273,900 $16,452+/-
PORTLAND $244,500 $11,356+/-
PRESTON $249,500 $21,588+/-
Median
Value
Margin of
Error
PROSPECT $295,300 $14,971+/-
PUTNAM $182,800 $10,639+/-
REDDING $603,300 $22,737+/-
RIDGEFIELD $673,900 $21,110+/-
ROCKY HILL $254,400 $13,183+/-
ROXBURY $638,400 $37,279+/-
SALEM $268,700 $14,101+/-
SALISBURY $433,800 $82,755+/-
SCOTLAND $240,600 $21,889+/-
SEYMOUR $255,800 $9,418+/-
SHARON $385,500 $45,310+/-
SHELTON $338,200 $5,045+/-
SHERMAN $472,000 $33,863+/-
SIMSBURY $328,600 $6,800+/-
SOMERS $306,700 $13,985+/-
SOUTH WINDSOR $276,200 $6,050+/-
SOUTHBURY $318,600 $14,760+/-
SOUTHINGTON $267,800 $6,183+/-
SPRAGUE $227,700 $26,860+/-
STAFFORD $193,400 $10,354+/-
STAMFORD $504,200 $14,242+/-
STERLING $196,600 $15,193+/-
STONINGTON $315,300 $18,655+/-
STRATFORD $249,600 $4,794+/-
SUFFIELD $295,200 $13,761+/-
THOMASTON $205,100 $14,333+/-
THOMPSON $195,700 $11,575+/-
TOLLAND $277,900 $15,015+/-
TORRINGTON $162,300 $3,430+/-
Median
Value
Margin of
Error
TRUMBULL $392,800 $7,448+/-
UNION $275,000 $20,836+/-
VERNON $205,900 $6,947+/-
VOLUNTOWN $229,100 $15,224+/-
WALLINGFORD $264,800 $6,018+/-
WARREN $371,000 $24,360+/-
WASHINGTON $449,500 $49,096+/-
WATERBURY $129,500 $3,783+/-
WATERFORD $253,800 $8,583+/-
WATERTOWN $241,100 $8,846+/-
WEST HARTFORD $318,800 $6,047+/-
WEST HAVEN $193,800 $5,047+/-
WESTBROOK $374,000 $34,380+/-
WESTON $857,700 $32,830+/-
WESTPORT $1,087,700 $53,428+/-
WETHERSFIELD $246,200 $4,050+/-
WILLINGTON $228,800 $12,818+/-
WILTON $812,100 $28,321+/-
WINCHESTER $171,500 $10,225+/-
WINDHAM $158,900 $8,062+/-
WINDSOR $217,500 $5,707+/-
WINDSOR LOCKS $190,700 $5,116+/-
WOLCOTT $243,400 $8,697+/-
WOODBRIDGE $484,300 $21,531+/-
WOODBURY $331,800 $17,419+/-
WOODSTOCK $246,600 $15,077+/-
** Statewide Median ** $269,300 +/- $1,149
* Source: U.S. Census Bureau 2012-16 American Community Survey
B - 39

SECTION C
STATEWIDE RANKINGS

Population
as of July 1, 2016 *
BRIDGEPORT 145,9361
NEW HAVEN 129,9342
STAMFORD 129,1133
HARTFORD 123,2434
WATERBURY 108,2725
NORWALK 88,4386
DANBURY 84,9927
NEW BRITAIN 72,5588
WEST HARTFORD 62,9039
GREENWICH 62,35910
FAIRFIELD 61,16011
HAMDEN 61,12512
BRISTOL 60,14713
MERIDEN 59,62214
MANCHESTER 57,87315
WEST HAVEN 54,51616
MILFORD 54,05417
STRATFORD 52,14818
EAST HARTFORD 50,23719
MIDDLETOWN 46,54420
WALLINGFORD 44,66021
ENFIELD 44,36822
SOUTHINGTON 43,68523
SHELTON 41,33424
NORWICH 39,55625
GROTON 39,26126
TRUMBULL 36,23727
TORRINGTON 34,64628
GLASTONBURY 34,58429
NAUGATUCK 31,39230
NEWINGTON 30,42331
CHESHIRE 29,28232
VERNON 29,14833
WINDSOR 28,87534
EAST HAVEN 28,80735
BRANFORD 28,02836
NEWTOWN 27,86537
WESTPORT 27,84038
NEW MILFORD 27,15139
NEW LONDON 26,98440
WETHERSFIELD 26,19541
MANSFIELD 25,96942
SOUTH WINDSOR 25,73743
FARMINGTON 25,52444
RIDGEFIELD 25,06345
WINDHAM 24,72746
SIMSBURY 24,40747
NORTH HAVEN 23,70948
GUILFORD 22,27749
WATERTOWN 21,79050
DARIEN 21,74451
BLOOMFIELD 20,64252
BERLIN 20,49953
NEW CANAAN 20,28054
ROCKY HILL 20,11955
MONROE 19,65856
BETHEL 19,62757
SOUTHBURY 19,57258
MONTVILLE 19,23159
WATERFORD 19,10160
EAST LYME 18,88661
ANSONIA 18,73262
STONINGTON 18,64763
WILTON 18,56064
AVON 18,36465
MADISON 18,15166
PLAINVILLE 17,67767
BROOKFIELD 17,09868
KILLINGLY 17,06969
WOLCOTT 16,64370
SEYMOUR 16,55371
ELLINGTON 16,07172
COLCHESTER 16,06173
SUFFIELD 15,62574
PLAINFIELD 15,06775
LEDYARD 14,91176
TOLLAND 14,79177
NORTH BRANFORD 14,19878
NEW FAIRFIELD 14,00579
CROMWELL 13,96080
ORANGE 13,91281
OXFORD 12,98482
CLINTON 12,96183
EAST HAMPTON 12,86984
DERBY 12,63185
WINDSOR LOCKS 12,51286
COVENTRY 12,43387
STAFFORD 11,75888
PLYMOUTH 11,74989
GRISWOLD 11,71990
EAST WINDSOR 11,35591
GRANBY 11,24792
SOMERS 11,09293
WINCHESTER 10,75494
WESTON 10,30295
CANTON 10,28796
OLD SAYBROOK 10,09397
PROSPECT 9,75598
BURLINGTON 9,61499
WOODBURY 9,591100
HEBRON 9,529101
PORTLAND 9,349102
PUTNAM 9,333103
THOMPSON 9,266104
REDDING 9,216105
EAST HADDAM 9,023106
WOODBRIDGE 8,842107
HADDAM 8,260108
BROOKLYN 8,205109
LITCHFIELD 8,175110
WOODSTOCK 7,823111
MIDDLEBURY 7,641112
THOMASTON 7,595113
EASTON 7,561114
OLD LYME 7,469115
DURHAM 7,255116
LEBANON 7,197117
WESTBROOK 6,933118
NEW HARTFORD 6,733119
ESSEX 6,539120
KILLINGWORTH 6,419121
MARLBOROUGH 6,402122
BEACON FALLS 6,095123
WILLINGTON 5,872124
BETHANY 5,488125
HARWINTON 5,466126
COLUMBIA 5,433127
NORTH STONINGTON 5,271128
EAST GRANBY 5,170129
CANTERBURY 5,065130
BOLTON 4,930131
PRESTON 4,685132
DEEP RIVER 4,482133
MIDDLEFIELD 4,387134
LISBON 4,281135
CHESTER 4,255136
ASHFORD 4,236137
SALEM 4,167138
POMFRET 4,149139
STERLING 3,741140
BARKHAMSTED 3,664141
SHERMAN 3,641142
SALISBURY 3,618143
WASHINGTON 3,452144
BETHLEHEM 3,447145
ANDOVER 3,252146
NORTH CANAAN 3,186147
SPRAGUE 2,921148
GOSHEN 2,891149
KENT 2,819150
SHARON 2,714151
BOZRAH 2,578152
VOLUNTOWN 2,565153
LYME 2,355154
MORRIS 2,279155
CHAPLIN 2,246156
ROXBURY 2,176157
HARTLAND 2,117158
FRANKLIN 1,955159
HAMPTON 1,837160
EASTFORD 1,750161
SCOTLAND 1,678162
BRIDGEWATER 1,648163
NORFOLK 1,632164
COLEBROOK 1,430165
WARREN 1,408166
CORNWALL 1,380167
CANAAN 1,177168
UNION 840169
Total: 3,576,452
C - 1
* Source: State Dept. of Public Health

Population Density per Sq. Mile
July 1, 2016
BRIDGEPORT1 9,135.8
HARTFORD2 7,090.7
NEW HAVEN3 6,956.2
NEW BRITAIN4 5,417.6
WEST HAVEN5 5,072.7
NEW LONDON6 4,805.7
NORWALK7 3,868.7
WATERBURY8 3,796.5
STAMFORD9 3,430.3
ANSONIA10 3,112.1
STRATFORD11 2,983.1
WEST HARTFORD12 2,880.6
EAST HARTFORD13 2,791.6
MERIDEN14 2,505.9
DERBY15 2,498.7
MILFORD16 2,437.6
EAST HAVEN17 2,341.1
NEWINGTON18 2,315.1
BRISTOL19 2,277.3
WETHERSFIELD20 2,127.9
MANCHESTER21 2,111.9
FAIRFIELD22 2,045.3
DANBURY23 2,028.8
NAUGATUCK24 1,924.9
HAMDEN25 1,872.4
PLAINVILLE26 1,820.3
DARIEN27 1,718.2
VERNON28 1,646.9
TRUMBULL29 1,553.7
ROCKY HILL30 1,495.4
NORWICH31 1,409.6
WESTPORT32 1,394.9
WINDSOR LOCKS33 1,386.5
SHELTON34 1,349.6
ENFIELD35 1,333.6
GREENWICH36 1,309.5
BRANFORD37 1,283.6
GROTON38 1,265.2
SOUTHINGTON39 1,216.4
BETHEL40 1,162.1
WALLINGFORD41 1,144.0
SEYMOUR42 1,140.2
NORTH HAVEN43 1,137.7
MIDDLETOWN44 1,134.7
CROMWELL45 1,121.0
WINDSOR46 978.7
SOUTH WINDSOR47 917.1
WINDHAM48 916.8
NEW CANAAN49 913.7
FARMINGTON50 911.1
CHESHIRE51 885.5
TORRINGTON52 871.5
BROOKFIELD53 864.7
WOLCOTT54 814.4
ORANGE55 809.7
CLINTON56 799.7
AVON57 793.1
BLOOMFIELD58 791.3
BERLIN59 778.7
MONROE60 754.0
WATERTOWN61 751.2
RIDGEFIELD62 726.1
SIMSBURY63 719.5
WILTON64 692.4
PROSPECT65 685.8
NEW FAIRFIELD66 685.1
GLASTONBURY67 674.5
OLD SAYBROOK68 670.9
THOMASTON69 634.6
BEACON FALLS70 630.4
ESSEX71 628.6
WATERFORD72 582.9
MANSFIELD73 582.3
NORTH BRANFORD74 573.5
EAST LYME75 555.5
PLYMOUTH76 536.7
WESTON77 520.3
MADISON78 502.1
SOUTHBURY79 501.9
NEWTOWN80 483.3
STONINGTON81 482.4
GUILFORD82 472.8
ELLINGTON83 471.8
WOODBRIDGE84 470.0
PUTNAM85 459.7
MONTVILLE86 458.4
NEW MILFORD87 441.0
WESTBROOK88 439.3
EAST WINDSOR89 432.6
MIDDLEBURY90 430.5
CANTON91 418.4
PORTLAND92 400.4
OXFORD93 396.6
SOMERS94 391.0
LEDYARD95 390.1
TOLLAND96 373.3
SUFFIELD97 369.7
EAST HAMPTON98 361.0
PLAINFIELD99 355.7
KILLINGLY100 353.4
MIDDLEFIELD101 346.8
BOLTON102 342.2
GRISWOLD103 337.7
DEEP RIVER104 331.7
COVENTRY105 330.9
WINCHESTER106 330.8
COLCHESTER107 327.9
OLD LYME108 324.5
BURLINGTON109 323.3
DURHAM110 306.6
EAST GRANBY111 294.4
REDDING112 292.6
BROOKLYN113 282.0
GRANBY114 276.5
EASTON115 275.8
MARLBOROUGH116 274.2
CHESTER117 265.1
WOODBURY118 263.5
LISBON119 262.8
BETHANY120 259.7
HEBRON121 258.0
COLUMBIA122 254.2
SPRAGUE123 220.5
ANDOVER124 210.5
STAFFORD125 202.6
THOMPSON126 197.6
HADDAM127 188.0
NEW HARTFORD128 181.8
KILLINGWORTH129 181.7
BETHLEHEM130 177.9
HARWINTON131 177.5
WILLINGTON132 176.4
SHERMAN133 166.3
EAST HADDAM134 166.3
NORTH CANAAN135 163.7
PRESTON136 152.0
LITCHFIELD137 145.7
SALEM138 144.1
STERLING139 137.4
LEBANON140 133.0
MORRIS141 131.4
BOZRAH142 129.1
WOODSTOCK143 129.0
CANTERBURY144 126.8
CHAPLIN145 115.6
ASHFORD146 109.3
POMFRET147 102.9
BARKHAMSTED148 101.1
BRIDGEWATER149 100.5
FRANKLIN150 100.3
NORTH STONINGTON151 97.2
WASHINGTON152 90.7
SCOTLAND153 90.1
ROXBURY154 82.7
LYME155 74.0
HAMPTON156 73.2
GOSHEN157 66.3
VOLUNTOWN158 65.8
HARTLAND159 64.0
SALISBURY160 63.2
EASTFORD161 60.5
KENT162 58.1
WARREN163 53.5
SHARON164 46.2
COLEBROOK165 45.4
NORFOLK166 36.0
CANAAN167 35.8
CORNWALL168 30.0
UNION169 29.2
Average:
Median: 459.7
738.6
C - 2


2016 Per Capita Income *
Per Capita
Income
% of State-
wide PCI
NEW CANAAN $112,516 282.0%1
DARIEN $101,827 255.2%2
WESTPORT $100,501 251.8%3
GREENWICH $93,194 233.5%4
WESTON $93,133 233.4%5
WILTON $82,791 207.5%6
ROXBURY $81,485 204.2%7
RIDGEFIELD $77,230 193.5%8
SHERMAN $69,917 175.2%9
AVON $67,430 169.0%10
BRIDGEWATER $66,977 167.8%11
SHARON $66,126 165.7%12
WASHINGTON $65,029 163.0%13
REDDING $63,762 159.8%14
EASTON $60,963 152.8%15
FAIRFIELD $60,505 151.6%16
GLASTONBURY $58,216 145.9%17
WESTBROOK $57,737 144.7%18
LYME $57,180 143.3%19
DURHAM $55,752 139.7%20
WOODBRIDGE $55,644 139.4%21
GUILFORD $55,566 139.2%22
SALISBURY $55,331 138.7%23
SIMSBURY $54,177 135.8%24
FARMINGTON $53,899 135.1%25
MADISON $52,847 132.4%26
WARREN $52,380 131.3%27
WEST HARTFORD $51,556 129.2%28
Per Capita
Income
% of State-
wide PCI
ESSEX $51,481 129.0%29
ORANGE $50,659 126.9%30
MONROE $50,195 125.8%31
GRANBY $49,999 125.3%32
BURLINGTON $49,997 125.3%33
NEWTOWN $49,603 124.3%34
BOLTON $49,577 124.2%35
STAMFORD $49,443 123.9%36
CANTON $49,098 123.0%37
OLD LYME $49,018 122.8%38
CORNWALL $48,926 122.6%39
BETHANY $48,496 121.5%40
MORRIS $48,291 121.0%41
STONINGTON $47,422 118.8%42
PORTLAND $47,409 118.8%43
KILLINGWORTH $47,236 118.4%44
NORFOLK $47,128 118.1%45
BROOKFIELD $46,949 117.6%46
SOUTH WINDSOR $46,758 117.2%47
TRUMBULL $46,622 116.8%48
TOLLAND $46,614 116.8%49
HADDAM $46,509 116.5%50
MIDDLEFIELD $46,405 116.3%51
WOODBURY $46,321 116.1%52
SALEM $45,930 115.1%53
OLD SAYBROOK $45,791 114.7%54
MIDDLEBURY $45,674 114.5%55
LITCHFIELD $45,524 114.1%56
NORWALK $45,387 113.7%57
Per Capita
Income
% of State-
wide PCI
NEW FAIRFIELD $45,268 113.4%58
CHESHIRE $45,164 113.2%59
MARLBOROUGH $45,136 113.1%60
HEBRON $45,072 112.9%61
BETHEL $44,782 112.2%62
CANAAN $44,684 112.0%63
BRANFORD $44,298 111.0%64
ROCKY HILL $43,921 110.1%65
SHELTON $43,810 109.8%66
SOUTHBURY $43,742 109.6%67
BETHLEHEM $43,639 109.4%68
BERLIN $43,536 109.1%69
CHESTER $43,323 108.6%70
CROMWELL $43,171 108.2%71
HARWINTON $43,034 107.8%72
EAST LYME $42,997 107.7%73
NORTH BRANFORD $42,804 107.3%74
ELLINGTON $42,602 106.8%75
DEEP RIVER $42,427 106.3%76
POMFRET $42,246 105.9%77
SUFFIELD $42,204 105.8%78
COLCHESTER $41,535 104.1%79
MILFORD $41,520 104.0%80
COVENTRY $41,516 104.0%81
ANDOVER $41,514 104.0%82
FRANKLIN $41,253 103.4%83
BARKHAMSTED $41,218 103.3%84
EAST HADDAM $41,148 103.1%85
EAST HAMPTON $41,065 102.9%86
* Source: U.S. Census Bureau 2012-16 American Community Survey
C - 4

2016 Per Capita Income *
Per Capita
Income
% of State-
wide PCI
UNION $40,982 102.7%87
NORTH HAVEN $40,952 102.6%88
COLUMBIA $40,835 102.3%89
SOUTHINGTON $40,761 102.1%90
LEDYARD $40,751 102.1%91
WATERFORD $40,449 101.4%92
EAST GRANBY $40,309 101.0%93
BLOOMFIELD $40,162 100.6%94
PROSPECT $40,031 100.3%95
OXFORD $39,670 99.4%96
WETHERSFIELD $39,368 98.7%97
CLINTON $39,178 98.2%98
WILLINGTON $39,056 97.9%99
HARTLAND $39,054 97.9%100
WALLINGFORD $38,989 97.7%101
GOSHEN $38,776 97.2%102
WATERTOWN $38,530 96.6%103
NEW HARTFORD $38,472 96.4%104
NEWINGTON $38,255 95.9%105
WOODSTOCK $38,203 95.7%106
NEW MILFORD $38,056 95.4%107
KENT $38,010 95.2%108
BEACON FALLS $37,459 93.9%109
LEBANON $37,369 93.6%110
WINDSOR $37,228 93.3%111
BOZRAH $36,951 92.6%112
WINDSOR LOCKS $36,587 91.7%113
EASTFORD $36,479 91.4%114
LISBON $36,369 91.1%115
Per Capita
Income
% of State-
wide PCI
ASHFORD $36,237 90.8%116
EAST WINDSOR $35,979 90.2%117
HAMDEN $35,963 90.1%118
GROTON $35,810 89.7%119
NORTH STONINGTON $35,713 89.5%120
SEYMOUR $35,632 89.3%121
HAMPTON $35,327 88.5%122
STRATFORD $35,175 88.1%123
VERNON $35,137 88.0%124
SOMERS $35,120 88.0%125
MIDDLETOWN $35,074 87.9%126
WOLCOTT $34,681 86.9%127
COLEBROOK $34,196 85.7%128
NAUGATUCK $33,551 84.1%129
SCOTLAND $33,206 83.2%130
PRESTON $33,182 83.2%131
VOLUNTOWN $32,940 82.5%132
MANCHESTER $32,919 82.5%133
CHAPLIN $32,911 82.5%134
PLAINVILLE $32,839 82.3%135
THOMPSON $32,669 81.9%136
PLYMOUTH $32,522 81.5%137
BRISTOL $32,374 81.1%138
EAST HAVEN $32,145 80.6%139
DANBURY $31,940 80.0%140
CANTERBURY $31,856 79.8%141
STAFFORD $31,606 79.2%142
NORTH CANAAN $31,390 78.7%143
ENFIELD $31,387 78.7%144
Per Capita
Income
% of State-
wide PCI
THOMASTON $31,367 78.6%145
SPRAGUE $31,157 78.1%146
MONTVILLE $30,669 76.9%147
WINCHESTER $30,643 76.8%148
MERIDEN $30,580 76.6%149
GRISWOLD $30,486 76.4%150
TORRINGTON $29,455 73.8%151
BROOKLYN $28,950 72.5%152
KILLINGLY $28,911 72.4%153
DERBY $28,846 72.3%154
PLAINFIELD $28,422 71.2%155
NORWICH $27,825 69.7%156
PUTNAM $27,675 69.4%157
STERLING $26,903 67.4%158
WEST HAVEN $26,197 65.6%159
EAST HARTFORD $25,303 63.4%160
NEW HAVEN $23,976 60.1%161
ANSONIA $23,937 60.0%162
NEW BRITAIN $22,087 55.3%163
BRIDGEPORT $21,816 54.7%164
NEW LONDON $21,638 54.2%165
WATERBURY $20,762 52.0%166
MANSFIELD $20,245 50.7%167
WINDHAM $18,748 47.0%168
HARTFORD $18,365 46.0%169
** Statewide PCI ** $39,906 100.0%
* Source: U.S. Census Bureau 2012-16 American Community Survey
C - 5

Bonded Debt per Capita
FYE 2016
1 NEW CANAAN $5,936
2 HARTFORD $5,669
3 STRATFORD $5,390
4 HAMDEN $4,781
5 NEW HAVEN $4,593
6 WILTON $4,510
7 WATERFORD $4,487
8 BRIDGEPORT $4,299
9 LYME $4,237
10 WATERBURY $4,158
11 BERLIN $4,094
12 OLD LYME $4,011
13 GUILFORD $3,843
14 WESTON $3,826
15 WESTPORT $3,626
16 WOODBRIDGE $3,548
17 BEACON FALLS $3,532
18 OLD SAYBROOK $3,495
19 CLINTON $3,444
20 EASTON $3,370
21 NEW BRITAIN $3,340
22 DARIEN $3,291
23 STAFFORD $3,260
24 STAMFORD $3,247
25 NAUGATUCK $3,236
26 THOMASTON $3,209
27 FAIRFIELD $3,202
28 RIDGEFIELD $3,176
29 TOLLAND $3,112
30 SPRAGUE $3,086
31 UNION $3,063
32 NORTH HAVEN $3,054
33 ORANGE $3,054
34 SOUTHINGTON $2,996
35 MARLBOROUGH $2,855
36 MILFORD $2,830
37 EAST LYME $2,780
38 WESTBROOK $2,738
39 CANAAN $2,616
40 LITCHFIELD $2,612
41 NORTH BRANFORD $2,593
42 BLOOMFIELD $2,572
43 SOUTH WINDSOR $2,523
44 TRUMBULL $2,491
45 NEWTOWN $2,479
46 PLAINVILLE $2,470
47 SHARON $2,425
48 GREENWICH $2,425
49 NORWALK $2,396
50 WEST HARTFORD $2,364
51 WATERTOWN $2,361
52 CHESHIRE $2,318
53 BOLTON $2,291
54 PROSPECT $2,279
55 EAST HAMPTON $2,242
56 WEST HAVEN $2,208
57 SEYMOUR $2,135
58 REDDING $2,134
59 GLASTONBURY $2,113
60 STONINGTON $2,093
61 MONROE $2,089
62 WETHERSFIELD $2,082
63 SHERMAN $2,060
64 GRANBY $2,024
65 KILLINGLY $1,994
66 WARREN $1,978
67 BETHANY $1,969
68 STERLING $1,950
69 BROOKFIELD $1,921
70 ESSEX $1,882
71 PLYMOUTH $1,865
72 MIDDLETOWN $1,855
73 MONTVILLE $1,844
74 MERIDEN $1,842
75 NEW LONDON $1,837
76 POMFRET $1,777
77 DANBURY $1,767
78 WOLCOTT $1,733
79 EAST HADDAM $1,721
80 CANTON $1,714
81 WINDSOR LOCKS $1,684
82 BURLINGTON $1,644
83 NEW FAIRFIELD $1,624
84 COVENTRY $1,616
85 OXFORD $1,612
86 MANCHESTER $1,591
87 VERNON $1,581
88 HEBRON $1,573
89 FARMINGTON $1,545
90 CROMWELL $1,494
91 BETHEL $1,479
92 SCOTLAND $1,472
93 MADISON $1,423
94 NEW HARTFORD $1,395
95 KENT $1,375
96 ENFIELD $1,353
97 SOMERS $1,351
98 PORTLAND $1,350
99 AVON $1,350
100 MIDDLEBURY $1,349
101 WINDSOR $1,334
102 BRANFORD $1,326
103 LEDYARD $1,322
104 ROCKY HILL $1,316
105 SIMSBURY $1,298
106 ELLINGTON $1,272
107 GROTON $1,269
108 GRISWOLD $1,264
109 CORNWALL $1,251
110 NORWICH $1,245
111 MIDDLEFIELD $1,232
112 KILLINGWORTH $1,203
113 DERBY $1,181
114 EAST HARTFORD $1,158
115 PRESTON $1,149
116 BOZRAH $1,132
117 SALEM $1,131
118 EAST GRANBY $1,120
119 SHELTON $1,108
120 HARWINTON $1,081
121 THOMPSON $1,062
122 NORFOLK $1,016
123 BARKHAMSTED $1,013
124 BRISTOL $1,001
125 HADDAM $979
126 SUFFIELD $943
127 EAST HAVEN $932
128 ANDOVER $925
129 SALISBURY $901
130 DURHAM $835
131 CHESTER $813
132 COLCHESTER $786
133 SOUTHBURY $781
134 WALLINGFORD $768
135 DEEP RIVER $764
136 ASHFORD $744
137 FRANKLIN $726
138 WOODBURY $705
139 WINDHAM $677
140 LISBON $655
141 BROOKLYN $642
142 NORTH CANAAN $642
143 PLAINFIELD $641
144 WILLINGTON $635
145 TORRINGTON $635
146 MORRIS $597
147 EAST WINDSOR $560
148 NEW MILFORD $527
149 GOSHEN $517
150 WOODSTOCK $474
151 COLEBROOK $471
152 ANSONIA $350
153 WINCHESTER $323
154 LEBANON $317
155 HARTLAND $291
156 ROXBURY $208
157 NEWINGTON $206
158 WASHINGTON $179
159 MANSFIELD $171
160 BRIDGEWATER $169
161 COLUMBIA $147
162 EASTFORD $87
163 PUTNAM $69
164 CANTERBURY $65
165 NORTH STONINGTON $57
166 CHAPLIN $44
167 HAMPTON $0
168 VOLUNTOWN $0
169 BETHLEHEM $0
Median:
Average:
$1,612
$2,480
C - 6

Net Pension Liability per Capita
FYE 2016
1 NEW HAVEN $5,421
2 HAMDEN $4,815
3 WEST HARTFORD $3,747
4 EAST HARTFORD $3,601
5 HARTFORD $3,343
6 GREENWICH $2,625
7 MERIDEN $2,511
8 BRIDGEPORT $2,499
9 TRUMBULL $2,464
10 NORWICH $1,977
11 WATERBURY $1,945
12 VERNON $1,878
13 OLD SAYBROOK $1,826
14 NEWINGTON $1,822
15 NORTH HAVEN $1,715
16 BLOOMFIELD $1,715
17 GLASTONBURY $1,604
18 STAMFORD $1,594
19 WESTPORT $1,508
20 AVON $1,492
21 NORWALK $1,468
22 NAUGATUCK $1,453
23 DANBURY $1,417
24 MILFORD $1,390
25 TORRINGTON $1,336
26 STRATFORD $1,310
27 FARMINGTON $1,297
28 CHESHIRE $1,291
29 PLYMOUTH $1,225
30 PORTLAND $1,160
31 MANCHESTER $986
32 WINCHESTER $954
33 NEW BRITAIN $948
34 WEST HAVEN $936
35 WETHERSFIELD $920
36 CLINTON $914
37 SOUTH WINDSOR $912
38 ORANGE $895
39 NEW LONDON $882
40 SIMSBURY $821
41 NORTH BRANFORD $818
42 EAST HAMPTON $812
43 FAIRFIELD $811
44 WOLCOTT $802
45 CANTON $755
46 THOMASTON $739
47 WESTON $726
48 MIDDLEBURY $711
49 MADISON $696
50 STAFFORD $683
51 DERBY $665
52 NEW MILFORD $656
53 SUFFIELD $649
54 WATERFORD $643
55 EASTON $628
56 LITCHFIELD $614
57 WOODBURY $609
58 WOODBRIDGE $547
59 BETHEL $541
60 BRANFORD $540
61 WILTON $534
62 WINDSOR $532
63 GROTON $516
64 REDDING $485
65 EAST WINDSOR $484
66 NEWTOWN $484
67 WATERTOWN $479
68 WINDSOR LOCKS $471
69 ESSEX $450
70 GUILFORD $441
71 CROMWELL $432
72 LEDYARD $427
73 ENFIELD $415
74 MONROE $395
75 ROCKY HILL $390
76 DEEP RIVER $382
77 PLAINVILLE $381
78 ANSONIA $364
79 PLAINFIELD $363
80 WALLINGFORD $361
81 GRANBY $354
82 EAST LYME $348
83 MONTVILLE $319
84 BROOKLYN $302
85 WESTBROOK $302
86 OXFORD $300
87 BROOKFIELD $294
88 WINDHAM $284
89 BERLIN $278
90 COVENTRY $275
91 SOUTHBURY $275
92 STONINGTON $262
93 MORRIS $250
94 NEW HARTFORD $246
95 GRISWOLD $243
96 MANSFIELD $236
97 WARREN $236
98 SOUTHINGTON $235
99 KILLINGWORTH $218
100 CHESTER $196
101 HADDAM $182
102 ELLINGTON $178
103 RIDGEFIELD $177
104 ANDOVER $171
105 DURHAM $162
106 BOZRAH $157
107 BRISTOL $157
108 WASHINGTON $148
109 THOMPSON $140
110 WOODSTOCK $134
111 SEYMOUR $124
112 BEACON FALLS $123
113 NEW FAIRFIELD $119
114 SOMERS $110
115 PRESTON $103
116 MIDDLEFIELD $100
117 LEBANON $91
118 BETHANY $83
119 BURLINGTON $69
120 EAST HAVEN $57
121 EAST HADDAM $54
122 CANTERBURY $52
123 SHELTON $48
124 SALISBURY $42
125 PROSPECT $39
126 HARWINTON $35
127 COLCHESTER $33
128 GOSHEN $33
129 WILLINGTON $22
130 SPRAGUE $0
131 KENT $0
132 KILLINGLY $0
133 LISBON $0
134 LYME $0
135 MARLBOROUGH $0
136 SHERMAN $0
137 HEBRON $0
138 MIDDLETOWN $0
139 SCOTLAND $0
140 SALEM $0
141 ROXBURY $0
142 NEW CANAAN $0
143 NORFOLK $0
144 NORTH CANAAN $0
145 PUTNAM $0
146 NORTH STONINGTON $0
147 SHARON $0
148 COLEBROOK $0
149 ASHFORD $0
150 BARKHAMSTED $0
151 BETHLEHEM $0
152 BOLTON $0
153 BRIDGEWATER $0
154 VOLUNTOWN $0
155 UNION $0
156 OLD LYME $0
157 HARTLAND $0
158 TOLLAND $0
159 CANAAN $0
160 COLUMBIA $0
161 CORNWALL $0
162 DARIEN $0
163 STERLING $0
164 EAST GRANBY $0
165 EASTFORD $0
166 POMFRET $0
167 FRANKLIN $0
168 HAMPTON $0
169 CHAPLIN $0
Median:
Average:
$302
$1,350
C - 7


2016 Median Household Income *
Median
Household
Income
% of State-
wide MHI
WESTON $218,152 304.0%1
DARIEN $208,125 290.0%2
WILTON $179,844 250.6%3
NEW CANAAN $176,601 246.1%4
WESTPORT $166,307 231.8%5
RIDGEFIELD $145,014 202.1%6
WOODBRIDGE $136,786 190.6%7
GREENWICH $134,223 187.1%8
EASTON $133,356 185.8%9
REDDING $129,643 180.7%10
AVON $124,608 173.7%11
FAIRFIELD $122,135 170.2%12
BURLINGTON $117,069 163.2%13
DURHAM $114,491 159.6%14
MONROE $113,333 157.9%15
TRUMBULL $112,674 157.0%16
SHERMAN $111,667 155.6%17
HEBRON $110,739 154.3%18
ROXBURY $110,625 154.2%19
SIMSBURY $110,099 153.4%20
NEWTOWN $110,036 153.3%21
GRANBY $109,901 153.2%22
TOLLAND $109,382 152.4%23
GLASTONBURY $108,600 151.3%24
CHESHIRE $108,559 151.3%25
ORANGE $106,475 148.4%26
BROOKFIELD $106,278 148.1%27
BETHANY $106,058 147.8%28
Median
Household
Income
% of State-
wide MHI
MADISON $105,673 147.3%29
BARKHAMSTED $104,899 146.2%30
SALEM $104,732 146.0%31
PROSPECT $103,659 144.5%32
BRIDGEWATER $103,393 144.1%33
KILLINGWORTH $103,295 144.0%34
MARLBOROUGH $103,276 143.9%35
MIDDLEFIELD $103,262 143.9%36
MIDDLEBURY $103,235 143.9%37
GUILFORD $102,199 142.4%38
NEW FAIRFIELD $101,392 141.3%39
ANDOVER $100,724 140.4%40
SOUTH WINDSOR $100,122 139.5%41
OXFORD $99,311 138.4%42
HADDAM $99,258 138.3%43
COLCHESTER $99,257 138.3%44
SUFFIELD $99,098 138.1%45
EAST HAMPTON $95,923 133.7%46
GOSHEN $95,219 132.7%47
FARMINGTON $95,158 132.6%48
SOMERS $94,765 132.1%49
BETHEL $94,292 131.4%50
HARWINTON $93,770 130.7%51
BERLIN $93,750 130.7%52
NORTH HAVEN $93,696 130.6%53
FRANKLIN $93,438 130.2%54
COLUMBIA $92,981 129.6%55
NEW HARTFORD $92,970 129.6%56
WESTBROOK $92,721 129.2%57
Median
Household
Income
% of State-
wide MHI
WARREN $92,083 128.3%58
WEST HARTFORD $91,875 128.0%59
BOLTON $91,087 126.9%60
ESSEX $89,950 125.4%61
LYME $89,643 124.9%62
HARTLAND $89,438 124.6%63
COVENTRY $88,967 124.0%64
POMFRET $88,906 123.9%65
EAST GRANBY $88,559 123.4%66
SOUTHINGTON $88,214 122.9%67
LEBANON $88,125 122.8%69
UNION $88,125 122.8%68
OLD LYME $87,971 122.6%70
CANTON $87,404 121.8%71
SHELTON $87,277 121.6%72
BETHLEHEM $87,056 121.3%73
LISBON $86,833 121.0%74
SCOTLAND $86,397 120.4%75
EAST LYME $85,872 119.7%76
NORTH BRANFORD $85,357 119.0%77
SOUTHBURY $85,068 118.6%78
LEDYARD $84,821 118.2%79
WOODSTOCK $84,700 118.0%80
BOZRAH $84,698 118.0%81
BEACON FALLS $84,570 117.9%82
WOLCOTT $83,828 116.8%83
CROMWELL $83,739 116.7%84
SHARON $82,714 115.3%85
WINDSOR $82,707 115.3%86
* Source: U.S. Census Bureau 2012-16 American Community Survey
C - 9

2016 Median Household Income *
Median
Household
Income
% of State-
wide MHI
WASHINGTON $82,418 114.9%87
MORRIS $82,031 114.3%88
ROCKY HILL $81,988 114.3%89
MILFORD $81,844 114.1%90
STAMFORD $81,634 113.8%91
PORTLAND $81,589 113.7%92
CANTERBURY $81,496 113.6%93
NEW MILFORD $81,350 113.4%94
COLEBROOK $81,184 113.1%95
VOLUNTOWN $81,023 112.9%96
LITCHFIELD $80,951 112.8%97
NORWALK $80,896 112.7%98
NEWINGTON $80,315 111.9%99
CHAPLIN $80,000 111.5%100
ELLINGTON $79,917 111.4%101
SEYMOUR $79,734 111.1%102
EAST HADDAM $79,668 111.0%103
WOODBURY $79,387 110.6%104
WATERFORD $78,382 109.2%105
WETHERSFIELD $78,371 109.2%106
ASHFORD $78,313 109.1%107
EASTFORD $78,309 109.1%108
STONINGTON $78,274 109.1%109
CHESTER $76,648 106.8%110
WATERTOWN $76,175 106.2%111
WALLINGFORD $75,942 105.8%112
NORTH CANAAN $75,690 105.5%113
OLD SAYBROOK $75,237 104.9%114
NORTH STONINGTON $75,091 104.6%115
Median
Household
Income
% of State-
wide MHI
SALISBURY $74,853 104.3%116
EAST WINDSOR $74,784 104.2%117
BROOKLYN $74,375 103.7%118
BLOOMFIELD $74,107 103.3%120
CORNWALL $74,107 103.3%119
CLINTON $74,022 103.2%121
NORFOLK $73,804 102.9%122
HAMPTON $73,684 102.7%123
MONTVILLE $73,160 102.0%124
WILLINGTON $72,237 100.7%125
CANAAN $72,174 100.6%126
HAMDEN $71,665 99.9%127
BRANFORD $71,619 99.8%128
ENFIELD $71,526 99.7%129
PLYMOUTH $70,635 98.4%130
DEEP RIVER $69,861 97.4%131
PRESTON $69,439 96.8%132
STRATFORD $69,336 96.6%133
THOMPSON $68,869 96.0%134
STERLING $68,776 95.8%135
DANBURY $67,430 94.0%136
WINDSOR LOCKS $66,494 92.7%137
THOMASTON $65,901 91.8%138
SPRAGUE $65,861 91.8%139
MANCHESTER $65,592 91.4%140
PLAINFIELD $65,254 90.9%141
GROTON $64,074 89.3%142
MIDDLETOWN $63,828 89.0%143
STAFFORD $63,681 88.7%144
Median
Household
Income
% of State-
wide MHI
MANSFIELD $63,391 88.3%145
EAST HAVEN $63,137 88.0%146
PLAINVILLE $61,907 86.3%147
KENT $61,875 86.2%148
BRISTOL $61,551 85.8%149
VERNON $61,099 85.1%150
KILLINGLY $60,548 84.4%151
NAUGATUCK $59,522 83.0%152
TORRINGTON $58,717 81.8%153
WINCHESTER $57,429 80.0%154
GRISWOLD $57,312 79.9%155
MERIDEN $55,547 77.4%156
DERBY $55,316 77.1%157
PUTNAM $52,224 72.8%158
NORWICH $51,758 72.1%159
WEST HAVEN $50,831 70.8%160
EAST HARTFORD $50,750 70.7%161
ANSONIA $43,386 60.5%162
BRIDGEPORT $43,137 60.1%163
NEW BRITAIN $41,844 58.3%164
WINDHAM $40,603 56.6%165
WATERBURY $39,681 55.3%166
NEW HAVEN $38,126 53.1%167
NEW LONDON $35,357 49.3%168
HARTFORD $32,095 44.7%169
** Statewide MHI ** $71,755 100.0%
* Source: U.S. Census Bureau 2012-16 American Community Survey
C - 10

2016 Unemployment *
HARTFORD1 9.4%
WATERBURY2 8.1%
BRIDGEPORT3 7.7%
NEW BRITAIN4 7.2%
NEW LONDON5 7.2%
ANSONIA6 7.0%
NEW HAVEN7 6.6%
EAST HARTFORD8 6.6%
DERBY9 6.4%
GRISWOLD10 6.2%
MERIDEN11 6.2%
WINDHAM12 6.1%
NORWICH13 6.1%
STERLING14 6.1%
KILLINGLY15 6.0%
PLYMOUTH16 6.0%
PLAINFIELD17 6.0%
WEST HAVEN18 6.0%
STRATFORD19 5.9%
TORRINGTON20 5.9%
PUTNAM21 5.8%
NAUGATUCK22 5.8%
BRISTOL23 5.7%
SPRAGUE24 5.7%
EAST HAVEN25 5.7%
BLOOMFIELD26 5.5%
LISBON27 5.5%
ENFIELD28 5.5%
SEYMOUR29 5.5%
CHAPLIN30 5.4%
STAFFORD31 5.4%
EAST WINDSOR32 5.4%
WINCHESTER33 5.3%
WINDSOR LOCKS34 5.2%
MONTVILLE35 5.1%
THOMPSON36 5.1%
MIDDLETOWN37 5.1%
BROOKLYN38 5.1%
MANCHESTER39 5.0%
CANTERBURY40 5.0%
VOLUNTOWN41 5.0%
HAMPTON42 5.0%
WINDSOR43 4.9%
PRESTON44 4.9%
VERNON45 4.9%
SHELTON46 4.9%
MANSFIELD47 4.8%
SOUTHBURY48 4.8%
PLAINVILLE49 4.8%
SALEM50 4.7%
NORTH CANAAN51 4.7%
BOZRAH52 4.6%
PORTLAND53 4.6%
EAST LYME54 4.6%
WATERFORD55 4.6%
SCOTLAND56 4.6%
BEACON FALLS57 4.6%
HAMDEN58 4.6%
EAST HADDAM59 4.6%
WESTBROOK60 4.6%
COLEBROOK61 4.5%
GROTON62 4.5%
WETHERSFIELD63 4.5%
MILFORD64 4.5%
BRANFORD65 4.5%
MONROE66 4.5%
LEBANON67 4.5%
FRANKLIN68 4.4%
SOMERS69 4.4%
NORFOLK70 4.4%
BETHLEHEM71 4.4%
WATERTOWN72 4.4%
NORWALK73 4.4%
NEWINGTON74 4.4%
BARKHAMSTED75 4.4%
MIDDLEFIELD76 4.4%
ASHFORD77 4.4%
WALLINGFORD78 4.3%
NEW MILFORD79 4.3%
WOLCOTT80 4.3%
NEW HARTFORD81 4.3%
OLD SAYBROOK82 4.3%
NEW FAIRFIELD83 4.3%
UNION84 4.3%
FAIRFIELD85 4.3%
WOODSTOCK86 4.3%
THOMASTON87 4.3%
CROMWELL88 4.3%
NORTH HAVEN89 4.3%
BETHEL90 4.3%
NEWTOWN91 4.3%
STAMFORD92 4.2%
LEDYARD93 4.2%
OXFORD94 4.2%
TRUMBULL95 4.2%
NORTH BRANFORD96 4.2%
GOSHEN97 4.2%
EAST HAMPTON98 4.2%
ELLINGTON99 4.2%
SOUTHINGTON100 4.2%
DANBURY101 4.2%
WARREN102 4.2%
HARWINTON103 4.1%
BERLIN104 4.1%
COLUMBIA105 4.1%
BROOKFIELD106 4.1%
ANDOVER107 4.1%
CLINTON108 4.1%
DARIEN109 4.1%
SOUTH WINDSOR110 4.1%
SUFFIELD111 4.1%
COLCHESTER112 4.1%
BURLINGTON113 4.1%
PROSPECT114 4.0%
STONINGTON115 4.0%
ESSEX116 4.0%
HARTLAND117 4.0%
LITCHFIELD118 4.0%
COVENTRY119 4.0%
SHERMAN120 4.0%
REDDING121 4.0%
WESTON122 4.0%
NORTH STONINGTON123 4.0%
MIDDLEBURY124 3.9%
WILLINGTON125 3.9%
WILTON126 3.9%
EAST GRANBY127 3.9%
ROCKY HILL128 3.9%
BETHANY129 3.9%
MORRIS130 3.9%
WOODBURY131 3.9%
ORANGE132 3.9%
KENT133 3.9%
NEW CANAAN134 3.8%
MARLBOROUGH135 3.8%
GREENWICH136 3.8%
DEEP RIVER137 3.8%
OLD LYME138 3.7%
WEST HARTFORD139 3.7%
WESTPORT140 3.7%
MADISON141 3.7%
FARMINGTON142 3.6%
CHESTER143 3.6%
RIDGEFIELD144 3.6%
GRANBY145 3.6%
EASTFORD146 3.6%
CANTON147 3.6%
EASTON148 3.6%
BOLTON149 3.6%
HADDAM150 3.5%
HEBRON151 3.5%
TOLLAND152 3.5%
GLASTONBURY153 3.5%
CHESHIRE154 3.5%
DURHAM155 3.5%
WOODBRIDGE156 3.4%
POMFRET157 3.4%
KILLINGWORTH158 3.4%
GUILFORD159 3.4%
BRIDGEWATER160 3.4%
SIMSBURY161 3.4%
AVON162 3.4%
LYME163 3.4%
SHARON164 3.2%
ROXBURY165 3.2%
WASHINGTON166 3.2%
SALISBURY167 3.1%
CANAAN168 3.0%
CORNWALL169 2.9%
Median:
Average:
4.3%
5.1%
C - 11
* Source: State of CT, Dept. ofLabor (Calendar Year 2016)

TANF Recipients as a % of Population *
TANF
FY 2015-16
Recipients
Recipients
As a % of
Population
HARTFORD 3.96%4,8771
NEW BRITAIN 3.33%2,4152
NEW HAVEN 3.15%4,0973
WATERBURY 2.86%3,0954
NEW LONDON 1.97%5325
MERIDEN 1.90%1,1346
WINDHAM 1.84%4557
NORWICH 1.76%6968
BRIDGEPORT 1.49%2,1799
EAST HARTFORD 1.49%74910
SPRAGUE 1.47%4311
BRISTOL 1.27%76512
ANSONIA 1.23%23013
WEST HAVEN 1.12%61314
MANCHESTER 1.04%60415
PUTNAM 1.03%9616
DERBY 0.93%11817
KILLINGLY 0.92%15718
MIDDLETOWN 0.92%42719
GRISWOLD 0.84%9820
VERNON 0.82%23821
EAST HAVEN 0.81%23222
PLAINFIELD 0.80%12023
BLOOMFIELD 0.73%15124
WINCHESTER 0.69%7425
NAUGATUCK 0.68%21526
HAMDEN 0.68%41727
ENFIELD 0.67%29628
TANF
FY 2015-16
Recipients
Recipients
As a % of
Population
VOLUNTOWN 0.66%1729
STERLING 0.64%2430
WINDSOR 0.63%18231
TORRINGTON 0.62%21632
STAMFORD 0.59%76433
CHAPLIN 0.58%1334
GROTON 0.58%22635
STONINGTON 0.56%10536
BROOKLYN 0.52%4337
PLYMOUTH 0.52%6138
STAFFORD 0.52%6139
PLAINVILLE 0.49%8640
WINDSOR LOCKS 0.45%5641
THOMPSON 0.42%3942
EAST WINDSOR 0.41%4743
HAMPTON 0.38%744
LISBON 0.37%1645
STRATFORD 0.36%19046
LEDYARD 0.36%5447
NORWALK 0.35%31048
PORTLAND 0.34%3249
CANAAN 0.34%450
THOMASTON 0.33%2551
WATERFORD 0.32%6252
MORRIS 0.31%753
BRANFORD 0.31%8654
MONTVILLE 0.31%5955
COLCHESTER 0.30%4856
CANTERBURY 0.30%1557
TANF
FY 2015-16
Recipients
Recipients
As a % of
Population
WEST HARTFORD 0.29%18258
ASHFORD 0.28%1259
COLEBROOK 0.28%460
PRESTON 0.28%1361
DANBURY 0.28%23562
EAST HAMPTON 0.26%3463
WATERTOWN 0.26%5764
SEYMOUR 0.26%4365
NEW MILFORD 0.25%6966
SHELTON 0.25%10467
NEWINGTON 0.25%7668
COVENTRY 0.25%3169
BEACON FALLS 0.25%1570
SOUTHINGTON 0.24%10571
WALLINGFORD 0.24%10772
BERLIN 0.23%4873
NORTH BRANFORD 0.23%3274
EAST HADDAM 0.22%2075
ROCKY HILL 0.22%4476
WETHERSFIELD 0.22%5777
SALEM 0.22%978
MILFORD 0.21%11679
SUFFIELD 0.21%3380
PROSPECT 0.21%2081
WILLINGTON 0.20%1282
BOLTON 0.20%1083
NORTH HAVEN 0.20%4884
DEEP RIVER 0.20%985
WOODBRIDGE 0.18%1686
* Source: State of CT, Dept. of Social Services
C - 12

TANF Recipients as a % of Population *
TANF
FY 2015-16
Recipients
Recipients
As a % of
Population
GUILFORD 0.18%4087
GLASTONBURY 0.18%6288
SCOTLAND 0.18%389
CROMWELL 0.17%2490
CLINTON 0.17%2291
POMFRET 0.17%792
LEBANON 0.17%1293
COLUMBIA 0.17%994
SOMERS 0.16%1895
ELLINGTON 0.16%2696
LITCHFIELD 0.16%1397
GREENWICH 0.16%9798
BOZRAH 0.16%499
ANDOVER 0.15%5100
FRANKLIN 0.15%3101
SOUTH WINDSOR 0.15%38102
WOODSTOCK 0.14%11103
MARLBOROUGH 0.14%9104
OLD SAYBROOK 0.14%14105
OXFORD 0.14%18106
WOLCOTT 0.14%23107
FARMINGTON 0.14%35108
MIDDLEFIELD 0.14%6109
ORANGE 0.13%18110
TOLLAND 0.13%19111
EAST LYME 0.12%23112
HEBRON 0.12%11113
SOUTHBURY 0.11%22114
BETHEL 0.11%22115
TANF
FY 2015-16
Recipients
Recipients
As a % of
Population
CHESHIRE 0.11%32116
BARKHAMSTED 0.11%4117
CANTON 0.11%11118
SIMSBURY 0.10%24119
NORTH STONINGTON 0.09%5120
HARTLAND 0.09%2121
NORTH CANAAN 0.09%3122
OLD LYME 0.09%7123
MANSFIELD 0.09%24124
SHERMAN 0.08%3125
EASTON 0.08%6126
EAST GRANBY 0.08%4127
ESSEX 0.08%5128
NEW HARTFORD 0.07%5129
WOODBURY 0.07%7130
HADDAM 0.07%6131
WESTBROOK 0.07%5132
WESTPORT 0.07%20133
GOSHEN 0.07%2134
BURLINGTON 0.06%6135
KILLINGWORTH 0.06%4136
BROOKFIELD 0.06%10137
WASHINGTON 0.06%2138
EASTFORD 0.06%1139
NEW FAIRFIELD 0.06%8140
BETHANY 0.05%3141
NEWTOWN 0.05%15142
TRUMBULL 0.05%19143
MIDDLEBURY 0.05%4144
TANF
FY 2015-16
Recipients
Recipients
As a % of
Population
DARIEN 0.05%11145
NEW CANAAN 0.04%9146
FAIRFIELD 0.04%27147
DURHAM 0.04%3148
SHARON 0.04%1149
HARWINTON 0.04%2150
MONROE 0.04%7151
GRANBY 0.04%4152
AVON 0.03%6153
BETHLEHEM 0.03%1154
SALISBURY 0.03%1155
MADISON 0.03%5156
CHESTER 0.02%1157
WESTON 0.02%2158
WILTON 0.02%3159
BRIDGEWATER 0.00%0160
CORNWALL 0.00%0161
KENT 0.00%0162
LYME 0.00%0163
NORFOLK 0.00%0164
REDDING 0.00%0165
RIDGEFIELD 0.00%0166
ROXBURY 0.00%0167
UNION 0.00%0168
WARREN 0.00%0169
** Statewide Average ** 0.86%180
* Source: State of CT, Dept. of Social Services
C - 13


Net Current Education
FYE 2016 *
Expenditures per Pupil
CORNWALL1 $30,193BRIDGEWATER2 $29,202WASHINGTON3 $29,202ROXBURY4 $29,202CANAAN5 $28,947SHARON6 $28,608KENT7 $23,589SALISBURY8 $23,568SCOTLAND9 $22,800WESTBROOK10 $22,590NORTH CANAAN11 $22,236HAMPTON12 $21,926GREENWICH13 $21,238REDDING14 $21,233BLOOMFIELD15 $21,160NORFOLK16 $20,763WESTON17 $20,759EASTFORD18 $20,643CHAPLIN19 $20,128WESTPORT20 $19,800WARREN21 $19,685MORRIS22 $19,685GOSHEN23 $19,685OLD LYME24 $19,634LYME25 $19,634BETHLEHEM26 $19,603WOODBURY27 $19,603NEW CANAAN28 $19,576DURHAM29 $19,463MIDDLEFIELD30 $19,463VOLUNTOWN31 $19,440WILTON32 $19,337DARIEN33 $19,314HARTFORD34 $19,313EASTON35 $19,233EAST WINDSOR36 $19,093
ASHFORD37 $19,089ESSEX38 $19,087WINDSOR LOCKS39 $19,086WINDHAM40 $18,977EAST GRANBY41 $18,921OLD SAYBROOK42 $18,835LITCHFIELD43 $18,526HARTLAND44 $18,480MILFORD45 $18,431NEW HAVEN46 $18,367HAMDEN47 $18,366WINCHESTER48 $18,343COLEBROOK49 $18,331CHESTER50 $18,272STAMFORD51 $18,063WILLINGTON52 $18,017EAST HADDAM53 $17,907WOODBRIDGE54 $17,736LEBANON55 $17,705DEEP RIVER56 $17,678CANTERBURY57 $17,525BOZRAH58 $17,519MANSFIELD59 $17,513BOLTON60 $17,490COLUMBIA61 $17,475BETHANY62 $17,428WINDSOR63 $17,286ORANGE64 $17,266BRANFORD65 $17,233SHERMAN66 $17,224UNION67 $17,216SALEM68 $17,215STAFFORD69 $17,180HADDAM70 $17,165KILLINGWORTH71 $17,165NORWALK72 $17,094
LISBON73 $17,042RIDGEFIELD74 $17,013MADISON75 $16,955PUTNAM76 $16,911POMFRET77 $16,902GUILFORD78 $16,865SOUTH WINDSOR79 $16,835WALLINGFORD80 $16,831CLINTON81 $16,793BARKHAMSTED82 $16,782KILLINGLY83 $16,732NEW LONDON84 $16,730THOMPSON85 $16,657SOUTHBURY86 $16,619MIDDLEBURY87 $16,619PRESTON88 $16,613FAIRFIELD89 $16,561NEW HARTFORD90 $16,473MIDDLETOWN91 $16,453MONROE92 $16,371NEWINGTON93 $16,294TORRINGTON94 $16,283NORWICH95 $16,260MANCHESTER96 $16,249FARMINGTON97 $16,237STONINGTON98 $16,128ANDOVER99 $16,040SIMSBURY100 $16,036NORTH STONINGTON101 $16,027WATERFORD102 $15,871NEWTOWN103 $15,871EAST HAVEN104 $15,849BERLIN105 $15,776BETHEL106 $15,775CANTON107 $15,729GLASTONBURY108 $15,729
AVON109 $15,726VERNON110 $15,707SUFFIELD111 $15,698EAST LYME112 $15,631GROTON113 $15,530COVENTRY114 $15,502TRUMBULL115 $15,417BEACON FALLS116 $15,391PROSPECT117 $15,391DERBY118 $15,376NORTH HAVEN119 $15,345HEBRON120 $15,336MONTVILLE121 $15,320FRANKLIN122 $15,319CHESHIRE123 $15,237WATERBURY124 $15,219LEDYARD125 $15,146SOMERS126 $15,122PLAINVILLE127 $15,104WETHERSFIELD128 $15,097NORTH BRANFORD129 $15,076NAUGATUCK130 $15,068WEST HARTFORD131 $15,022NEW FAIRFIELD132 $14,994THOMASTON133 $14,958COLCHESTER134 $14,716EAST HAMPTON135 $14,705STRATFORD136 $14,631GRANBY137 $14,547PORTLAND138 $14,539ROCKY HILL139 $14,522PLAINFIELD140 $14,522TOLLAND141 $14,495BROOKLYN142 $14,483HARWINTON143 $14,440BURLINGTON144 $14,440
SEYMOUR145 $14,385PLYMOUTH146 $14,370BRIDGEPORT147 $14,344WATERTOWN148 $14,243BROOKFIELD149 $14,125NEW MILFORD150 $14,017ANSONIA151 $13,972MERIDEN152 $13,956CROMWELL153 $13,928GRISWOLD154 $13,898ENFIELD155 $13,894BRISTOL156 $13,894OXFORD157 $13,883WEST HAVEN158 $13,825SOUTHINGTON159 $13,811WOODSTOCK160 $13,677MARLBOROUGH161 $13,628STERLING162 $13,470EAST HARTFORD163 $13,437SHELTON164 $13,401SPRAGUE165 $13,391WOLCOTT166 $13,377NEW BRITAIN167 $13,196ELLINGTON168 $12,984DANBURY169 $12,794
Average:
Median: $16,657
$16,245
C - 15
* The data is the latest available from the State Dept. of Education at the time of this publication; however, it is not considered the final figures.

Current Year Tax Collection
Rates, FYE 2016
TORRINGTON1 * 100.0%CHESHIRE2 99.8%FARMINGTON3 99.8%AVON4 99.7%BRIDGEWATER5 99.7%SHERMAN6 99.7%WARREN7 99.7%GOSHEN8 99.7%NEW CANAAN9 99.7%WILLINGTON10 99.6%WOODBRIDGE11 99.6%DARIEN12 99.6%MADISON13 99.6%GLASTONBURY14 99.6%GUILFORD15 99.5%SIMSBURY16 99.5%KILLINGWORTH17 99.5%ROXBURY18 99.4%WESTBROOK19 99.4%SALISBURY20 99.4%ELLINGTON21 99.4%HARWINTON22 99.4%ORANGE23 99.4%NEW FAIRFIELD24 99.4%MARLBOROUGH25 99.3%NEWTOWN26 99.3%ROCKY HILL27 99.3%CLINTON28 99.3%WILTON29 99.3%CANTON30 99.3%NEWINGTON31 99.3%BURLINGTON32 99.3%GREENWICH33 99.3%WEST HARTFORD34 99.3%KENT35 99.3%
SOUTHBURY36 99.3%WATERFORD37 99.2%TOLLAND38 99.2%BROOKFIELD39 99.2%NORFOLK40 99.2%WASHINGTON41 99.2%SUFFIELD42 99.1%CROMWELL43 99.1%LYME44 99.1%POMFRET45 99.1%OLD SAYBROOK46 99.1%WETHERSFIELD47 99.1%TRUMBULL48 99.1%GRANBY49 99.1%ESSEX50 99.1%MONROE51 99.1%PROSPECT52 99.1%DURHAM53 99.1%EAST GRANBY54 99.0%SHELTON55 99.0%HADDAM56 99.0%BOLTON57 98.9%RIDGEFIELD58 98.9%EAST LYME59 98.9%NORWALK60 98.9%SOUTH WINDSOR61 98.9%EAST HADDAM62 98.9%BERLIN63 98.9%VERNON64 98.9%SOUTHINGTON65 98.9%CANTERBURY66 98.9%BETHEL67 98.8%EAST WINDSOR68 98.8%THOMASTON69 98.8%NORTH HAVEN70 98.8%
MANSFIELD71 98.8%COLCHESTER72 98.8%WINDHAM73 98.8%COVENTRY74 98.8%BETHANY75 98.8%LEDYARD76 98.8%WINDSOR77 98.8%COLUMBIA78 98.8%CHESTER79 98.8%BLOOMFIELD80 98.7%STAMFORD81 98.7%SALEM82 98.7%OLD LYME83 98.7%WESTON84 98.7%STONINGTON85 98.7%WESTPORT86 98.7%EASTON87 98.7%PORTLAND88 98.7%LITCHFIELD89 98.7%HAMPTON90 98.7%DANBURY91 98.7%FAIRFIELD92 98.7%HAMDEN93 98.7%SOMERS94 98.7%DEEP RIVER95 98.6%NORTH BRANFORD96 98.6%WATERTOWN97 98.6%WALLINGFORD98 98.6%BROOKLYN99 98.6%CHAPLIN100 98.6%GROTON101 98.6%UNION102 98.6%REDDING103 98.6%NEW HARTFORD104 98.5%ANDOVER105 98.5%
WEST HAVEN106 98.5%BRANFORD107 98.5%LISBON108 98.4%WOODSTOCK109 98.4%WATERBURY110 98.4%COLEBROOK111 98.4%OXFORD112 98.4%NEW MILFORD113 98.4%HARTLAND114 98.4%MIDDLEBURY115 98.4%BRIDGEPORT116 98.3%WINDSOR LOCKS117 98.3%FRANKLIN118 98.3%VOLUNTOWN119 98.3%MANCHESTER120 98.3%SEYMOUR121 98.3%MIDDLEFIELD122 98.2%THOMPSON123 98.2%ASHFORD124 98.2%CANAAN125 98.1%WOODBURY126 98.1%BETHLEHEM127 98.1%WOLCOTT128 98.1%BRISTOL129 98.1%WINCHESTER130 98.1%ENFIELD131 98.1%MORRIS132 98.1%PRESTON133 98.1%MILFORD134 98.0%NEW HAVEN135 98.0%EAST HAMPTON136 98.0%DERBY137 97.9%BOZRAH138 97.9%PLAINVILLE139 97.9%SCOTLAND140 97.9%
EAST HAVEN141 97.9%EASTFORD142 97.9%LEBANON143 97.9%HEBRON144 97.9%PLYMOUTH145 97.9%CORNWALL146 97.9%PUTNAM147 97.8%SHARON148 97.8%MERIDEN149 97.8%PLAINFIELD150 97.8%KILLINGLY151 97.8%MONTVILLE152 97.7%NEW LONDON153 97.7%MIDDLETOWN154 97.6%STRATFORD155 97.5%GRISWOLD156 97.5%NORTH STONINGTON157 97.4%BEACON FALLS158 97.4%EAST HARTFORD159 97.3%BARKHAMSTED160 97.3%STAFFORD161 97.2%STERLING162 97.1%NORTH CANAAN163 97.0%NORWICH164 96.8%ANSONIA165 96.7%NEW BRITAIN166 96.6%HARTFORD167 95.7%NAUGATUCK168 93.4%SPRAGUE169 90.7%
Median: 98.7%
Average: 98.6%
C - 16
* A Special legislative act allows this municipality's tax collection services to be contracted to an outside firm. This firm charges a commission which is not reflected in the tax collection rate.

Currrent Year Adusted Tax
Levy per Capita, FYE 2016
1 WESTPORT $6,566
2 WESTON $6,520
3 NEW CANAAN $6,433
4 WILTON $6,199
5 DARIEN $5,895
6 GREENWICH $5,609
7 EASTON $5,337
8 REDDING $4,960
9 WOODBRIDGE $4,856
10 RIDGEFIELD $4,844
11 CORNWALL $4,417
12 FAIRFIELD $4,407
13 WASHINGTON $4,390
14 ROXBURY $4,388
15 ORANGE $4,336
16 OLD LYME $4,316
17 WATERFORD $4,269
18 OLD SAYBROOK $4,116
19 BRIDGEWATER $4,082
20 AVON $4,059
21 MADISON $4,051
22 GLASTONBURY $4,048
23 TRUMBULL $4,041
24 NORFOLK $3,935
25 LYME $3,887
26 STAMFORD $3,753
27 KENT $3,752
28 WESTBROOK $3,748
29 MONROE $3,745
30 MIDDLEBURY $3,729
31 SHERMAN $3,722
32 GUILFORD $3,678
33 SHARON $3,668
34 WEST HARTFORD $3,642
35 NEWTOWN $3,618
36 SOUTH WINDSOR $3,571
37 WARREN $3,550
38 BLOOMFIELD $3,544
39 BETHANY $3,536
40 COLEBROOK $3,510
41 SALISBURY $3,496
42 FARMINGTON $3,482
43 DURHAM $3,475
44 GOSHEN $3,471
45 MORRIS $3,467
46 SIMSBURY $3,458
47 HADDAM $3,456
48 CANAAN $3,441
49 EAST GRANBY $3,440
50 NORTH HAVEN $3,417
51 BRANFORD $3,366
52 NORWALK $3,365
53 BROOKFIELD $3,362
54 ESSEX $3,346
55 LITCHFIELD $3,307
56 MILFORD $3,295
57 BERLIN $3,244
58 WETHERSFIELD $3,219
59 BOLTON $3,210
60 UNION $3,181
61 STRATFORD $3,150
62 MIDDLEFIELD $3,134
63 CANTON $3,128
64 CLINTON $3,103
65 GRANBY $3,099
66 BETHEL $3,095
67 WOODBURY $3,089
68 WINDSOR $3,075
69 SOUTHBURY $3,072
70 NEW FAIRFIELD $3,047
71 NEWINGTON $3,006
72 STONINGTON $3,005
73 ROCKY HILL $2,985
74 MARLBOROUGH $2,976
75 HEBRON $2,974
76 DEEP RIVER $2,935
77 CROMWELL $2,926
78 BURLINGTON $2,919
79 CHESHIRE $2,859
80 NEW MILFORD $2,854
81 KILLINGWORTH $2,841
82 TOLLAND $2,838
83 NEW HARTFORD $2,832
84 PORTLAND $2,796
85 OXFORD $2,783
86 SALEM $2,781
87 NORTH BRANFORD $2,779
88 NORTH CANAAN $2,738
89 EAST LYME $2,737
90 HAMDEN $2,721
91 EAST HADDAM $2,715
92 HARWINTON $2,706
93 WALLINGFORD $2,643
94 NORTH STONINGTON $2,635
95 WINDSOR LOCKS $2,628
96 BEACON FALLS $2,622
97 CHESTER $2,607
98 BARKHAMSTED $2,605
99 SEYMOUR $2,578
100 TORRINGTON $2,577
101 EAST WINDSOR $2,563
102 SOUTHINGTON $2,560
103 ELLINGTON $2,514
104 ANDOVER $2,498
105 EAST HARTFORD $2,476
106 CHAPLIN $2,476
107 EAST HAMPTON $2,474
108 PLAINVILLE $2,470
109 MANCHESTER $2,470
110 PROSPECT $2,468
111 SHELTON $2,465
112 MIDDLETOWN $2,465
113 BETHLEHEM $2,445
114 LEBANON $2,440
115 SUFFIELD $2,440
116 FRANKLIN $2,435
117 SCOTLAND $2,424
118 WATERTOWN $2,411
119 THOMASTON $2,409
120 HARTLAND $2,364
121 COLUMBIA $2,355
122 COVENTRY $2,350
123 ASHFORD $2,333
124 COLCHESTER $2,328
125 BOZRAH $2,316
126 NAUGATUCK $2,315
127 DANBURY $2,311
128 PLYMOUTH $2,298
129 LEDYARD $2,283
130 VERNON $2,256
131 BRISTOL $2,234
132 EAST HAVEN $2,188
133 WATERBURY $2,184
134 STAFFORD $2,167
135 WOLCOTT $2,157
136 HARTFORD $2,133
137 POMFRET $2,127
138 DERBY $2,117
139 WINCHESTER $2,106
140 VOLUNTOWN $2,105
141 HAMPTON $2,079
142 WILLINGTON $2,056
143 BRIDGEPORT $2,045
144 WOODSTOCK $2,042
145 EASTFORD $2,034
146 GROTON $2,026
147 MERIDEN $2,009
148 MONTVILLE $1,972
149 PRESTON $1,946
150 NEW HAVEN $1,942
151 ENFIELD $1,941
152 KILLINGLY $1,935
153 STERLING $1,927
154 NORWICH $1,880
155 SPRAGUE $1,843
156 NEW LONDON $1,832
157 SOMERS $1,819
158 ANSONIA $1,795
159 PLAINFIELD $1,716
160 LISBON $1,698
161 CANTERBURY $1,688
162 NEW BRITAIN $1,674
163 WEST HAVEN $1,646
164 GRISWOLD $1,608
165 BROOKLYN $1,589
166 THOMPSON $1,556
167 WINDHAM $1,439
168 MANSFIELD $1,161
169 PUTNAM $1,078
Average:
Median: $2,783
$2,872
C - 17

Property Tax Revenues as a %of Total Revenues*, FYE 2016
1 GOSHEN 94.9%2 WARREN 94.2%3 ROXBURY 93.2%4 WASHINGTON 92.8%5 MIDDLEBURY 92.6%6 WOODBURY 92.5%7 BRIDGEWATER 92.5%8 OLD LYME 92.4%9 HADDAM 91.7%
10 SHARON 91.7%11 LYME 91.6%12 ESSEX 91.6%13 SOUTHBURY 91.5%14 EASTON 89.9%15 REDDING 89.6%16 SHERMAN 89.6%17 MORRIS 89.5%18 WOODBRIDGE 88.7%19 ORANGE 88.5%20 BROOKFIELD 88.4%21 WATERFORD 88.4%22 WESTON 88.2%23 WILTON 88.1%24 KENT 88.1%25 CORNWALL 87.9%26 OLD SAYBROOK 87.7%27 NEW CANAAN 87.2%28 GUILFORD 86.5%29 FAIRFIELD 86.4%30 BRANFORD 86.3%31 LITCHFIELD 86.2%32 MADISON 86.0%33 DARIEN 85.7%34 WESTBROOK 85.5%35 STONINGTON 85.5%
36 STAMFORD 85.4%37 SALISBURY 85.3%38 FARMINGTON 85.3%39 AVON 85.0%40 CHESTER 84.8%41 GLASTONBURY 84.7%42 EAST GRANBY 84.6%43 WESTPORT 84.4%44 RIDGEFIELD 84.3%45 SHELTON 84.3%46 NEWTOWN 84.1%47 TRUMBULL 83.8%48 GREENWICH 83.8%49 NORWALK 83.7%50 SIMSBURY 83.7%51 NORTH HAVEN 83.4%52 MILFORD 83.1%53 ROCKY HILL 83.0%54 NORFOLK 82.6%55 MONROE 82.5%56 BLOOMFIELD 82.4%57 COLEBROOK 82.2%58 DURHAM 82.1%59 MIDDLEFIELD 81.7%60 HARWINTON 81.5%61 WEST HARTFORD 81.5%62 BETHANY 81.0%63 KILLINGWORTH 80.9%64 CANTON 80.4%65 CROMWELL 80.3%66 WETHERSFIELD 80.3%67 BARKHAMSTED 80.1%68 UNION 80.1%69 MARLBOROUGH 80.0%70 BETHEL 79.8%
71 SOUTH WINDSOR 79.4%72 CANAAN 79.3%73 BETHLEHEM 79.2%74 BERLIN 78.9%75 NEW FAIRFIELD 78.7%76 WINDSOR 77.4%77 NEWINGTON 76.9%78 PORTLAND 76.9%79 DEEP RIVER 76.8%80 NEW HARTFORD 76.7%81 HAMDEN 76.5%82 PROSPECT 76.4%83 NORTH BRANFORD 76.2%84 DANBURY 76.2%85 CLINTON 76.0%86 EAST WINDSOR 75.9%87 EAST HADDAM 75.8%88 STRATFORD 75.0%89 BURLINGTON 75.0%90 BEACON FALLS 74.6%91 SOUTHINGTON 74.6%92 GRANBY 74.5%93 BOLTON 74.1%94 CHESHIRE 74.0%95 OXFORD 74.0%96 HEBRON 73.9%97 ANDOVER 72.7%98 EAST HAMPTON 72.5%99 MANCHESTER 72.2%
100 WALLINGFORD 72.1%101 SEYMOUR 72.1%102 NORTH CANAAN 71.9%103 FRANKLIN 71.7%104 NEW MILFORD 71.6%105 COLUMBIA 71.5%
106 ELLINGTON 70.8%107 BOZRAH 70.8%108 PLAINVILLE 70.8%109 SALEM 70.5%110 TOLLAND 70.5%111 EAST LYME 70.4%112 WATERTOWN 70.1%113 VERNON 69.7%114 WILLINGTON 69.5%115 NORTH STONINGTON 69.1%116 EAST HAVEN 68.8%117 HARTLAND 68.6%118 SCOTLAND 68.2%119 COVENTRY 68.2%120 THOMASTON 68.1%121 WOODSTOCK 67.9%122 MIDDLETOWN 67.9%123 TORRINGTON 67.1%124 POMFRET 66.9%125 CHAPLIN 66.6%126 WINDSOR LOCKS 66.5%127 WINCHESTER 66.2%128 HAMPTON 65.8%129 EASTFORD 65.7%130 PLYMOUTH 65.6%131 SUFFIELD 65.5%132 LEBANON 65.0%133 ASHFORD 64.7%134 BRISTOL 64.6%135 COLCHESTER 64.0%136 GROTON 62.9%137 STERLING 62.7%138 WOLCOTT 62.4%139 NAUGATUCK 61.6%140 ENFIELD 61.6%
141 EAST HARTFORD 61.4%142 STAFFORD 61.0%143 SOMERS 60.7%144 MONTVILLE 60.4%145 BROOKLYN 59.6%146 LEDYARD 59.2%147 MANSFIELD 59.2%148 DERBY 59.0%149 NORWICH 58.6%150 MERIDEN 58.3%151 CANTERBURY 57.8%152 THOMPSON 57.8%153 WATERBURY 57.3%154 VOLUNTOWN 57.1%155 PRESTON 56.6%156 KILLINGLY 54.8%157 SPRAGUE 54.0%158 NEW LONDON 54.0%159 LISBON 53.3%160 WEST HAVEN 53.1%161 GRISWOLD 53.0%162 BRIDGEPORT 52.5%163 PLAINFIELD 51.0%164 NEW BRITAIN 50.3%165 ANSONIA 49.5%166 WINDHAM 47.2%167 HARTFORD 46.7%168 NEW HAVEN 46.3%169 PUTNAM 40.5%
Average:
Median: 76.0%
72.0%
* Total General Fund revenues including operating transfers in
C - 18

Intergovernmental Revenues as a % of Total Revenues*, FYE 2016
1 HARTFORD 49.5%2 WINDHAM 48.4%3 NEW HAVEN 45.3%4 ANSONIA 44.8%5 PUTNAM 44.7%6 NEW BRITAIN 43.6%7 PLAINFIELD 43.5%8 WEST HAVEN 43.5%9 SPRAGUE 41.8%
10 VOLUNTOWN 41.4%11 BRIDGEPORT 41.1%12 GRISWOLD 40.5%13 CANTERBURY 40.4%14 NEW LONDON 40.1%15 MANSFIELD 39.2%16 THOMPSON 39.1%17 BROOKLYN 37.7%18 WATERBURY 37.5%19 MERIDEN 37.0%20 KILLINGLY 37.0%21 SOMERS 36.6%22 STERLING 36.1%23 PRESTON 36.0%24 LISBON 35.5%25 MONTVILLE 35.2%26 WOLCOTT 34.8%27 NORWICH 34.7%28 STAFFORD 34.6%29 GROTON 34.4%30 LEDYARD 34.1%31 DERBY 33.8%32 COLCHESTER 33.2%33 PLYMOUTH 33.1%34 EAST HARTFORD 32.5%35 ASHFORD 32.4%
36 ENFIELD 32.2%37 CHAPLIN 32.2%38 HAMPTON 32.1%39 NAUGATUCK 32.0%40 BRISTOL 31.8%41 EASTFORD 31.6%42 WINCHESTER 31.2%43 POMFRET 31.1%44 SCOTLAND 30.2%45 THOMASTON 30.2%46 WINDSOR LOCKS 30.0%47 LEBANON 30.0%48 WOODSTOCK 29.9%49 HARTLAND 29.7%50 COVENTRY 29.2%51 WILLINGTON 28.9%52 NORTH STONINGTON 28.7%53 SUFFIELD 28.4%54 TOLLAND 28.2%55 EAST HAVEN 28.0%56 SALEM 27.7%57 TORRINGTON 27.4%58 NORTH CANAAN 26.8%59 ANDOVER 26.4%60 VERNON 26.3%61 COLUMBIA 26.3%62 ELLINGTON 26.0%63 BOZRAH 26.0%64 PLAINVILLE 26.0%65 EAST HAMPTON 25.9%66 WATERTOWN 25.8%67 SEYMOUR 25.0%68 FRANKLIN 24.8%69 MIDDLETOWN 24.8%70 MANCHESTER 24.4%
71 HEBRON 23.2%72 WALLINGFORD 23.1%73 NEW MILFORD 22.9%74 BOLTON 22.9%75 EAST WINDSOR 22.4%76 NORTH BRANFORD 22.3%77 CHESHIRE 22.3%78 SOUTHINGTON 22.2%79 NEWINGTON 21.8%80 GRANBY 21.7%81 CLINTON 21.4%82 BEACON FALLS 21.3%83 NEW HARTFORD 21.3%84 EAST HADDAM 20.4%85 HAMDEN 20.3%86 PORTLAND 19.7%87 EAST LYME 19.5%88 STRATFORD 19.1%89 WINDSOR 19.0%90 BARKHAMSTED 18.5%91 SOUTH WINDSOR 18.4%92 DANBURY 18.3%93 BETHEL 18.2%94 PROSPECT 18.0%95 UNION 17.8%96 CANTON 17.7%97 MARLBOROUGH 17.4%98 OXFORD 17.4%99 DEEP RIVER 17.3%
100 HARWINTON 16.9%101 WETHERSFIELD 16.9%102 NEW FAIRFIELD 16.8%103 BURLINGTON 16.5%104 CANAAN 16.5%105 COLEBROOK 15.8%
106 BERLIN 15.8%107 WEST HARTFORD 15.6%108 CROMWELL 15.6%109 MONROE 15.0%110 MIDDLEFIELD 14.9%111 BETHLEHEM 14.9%112 ROCKY HILL 14.6%113 DURHAM 14.5%114 BETHANY 14.2%115 EAST GRANBY 14.1%116 SIMSBURY 13.7%117 NORFOLK 13.6%118 NEWTOWN 13.6%119 SHELTON 12.7%120 FARMINGTON 12.6%121 BLOOMFIELD 12.4%122 GLASTONBURY 11.9%123 NORWALK 11.8%124 KILLINGWORTH 11.8%125 LITCHFIELD 11.7%126 MILFORD 11.7%127 NORTH HAVEN 11.4%128 AVON 11.3%129 TRUMBULL 11.2%130 GUILFORD 11.0%131 MADISON 10.9%132 CHESTER 10.6%133 WESTBROOK 10.1%134 BROOKFIELD 10.0%135 SALISBURY 9.9%136 DARIEN 9.6%137 OLD SAYBROOK 9.6%138 CORNWALL 9.5%139 RIDGEFIELD 9.5%140 WESTON 9.2%
141 WILTON 9.2%142 STONINGTON 9.1%143 STAMFORD 8.9%144 WATERFORD 8.9%145 FAIRFIELD 8.6%146 NEW CANAAN 8.4%147 MORRIS 8.4%148 BRANFORD 8.1%149 SHERMAN 8.0%150 KENT 7.8%151 ORANGE 7.5%152 REDDING 7.5%153 GREENWICH 6.9%154 HADDAM 6.8%155 EASTON 6.1%156 SOUTHBURY 5.7%157 WOODBRIDGE 5.7%158 ESSEX 5.6%159 WOODBURY 5.2%160 LYME 5.2%161 SHARON 5.1%162 OLD LYME 4.7%163 MIDDLEBURY 3.8%164 BRIDGEWATER 3.0%165 GOSHEN 2.8%166 WARREN 2.0%167 ROXBURY 1.8%168 WESTPORT 1.6%169 WASHINGTON 1.6%
Average:
Median: 20.3%
23.2%
* Total General Fund revenues including operating transfers in
C - 19

Equalized Mill Rates
FYE 2016
WATERBURY1 42.58
HARTFORD2 40.47
BRIDGEPORT3 33.94
NEW BRITAIN4 33.29
EAST HARTFORD5 32.75
TORRINGTON6 32.35
NAUGATUCK7 32.32
HAMDEN8 29.82
WINDHAM9 28.30
NORWICH10 27.85
DERBY11 27.42
WETHERSFIELD12 27.16
SCOTLAND13 26.79
NEW LONDON14 26.60
WOODBRIDGE15 26.23
MERIDEN16 26.18
NEW HAVEN17 25.95
STRATFORD18 25.86
VERNON19 25.82
BOLTON20 25.72
HEBRON21 25.70
PLYMOUTH22 25.65
ANSONIA23 25.62
MANCHESTER24 25.42
SOUTH WINDSOR25 25.36
BLOOMFIELD26 25.17
SEYMOUR27 25.06
GRANBY28 24.93
BRISTOL29 24.81
WEST HARTFORD30 24.57
CHAPLIN31 24.48
BEACON FALLS32 24.48
WINCHESTER33 24.32
MIDDLETOWN34 24.26
DURHAM35 24.10
MONROE36 24.01
GLASTONBURY37 23.74
NEWINGTON38 23.67
THOMASTON39 23.66
EAST HAVEN40 23.62
MIDDLEFIELD41 23.61
SIMSBURY42 23.54
ASHFORD43 23.48
TOLLAND44 23.40
BETHANY45 23.38
SALEM46 23.36
PORTLAND47 23.25
STAFFORD48 23.14
MARLBOROUGH49 22.75
WEST HAVEN50 22.63
ANDOVER51 22.55
PLAINVILLE52 22.55
UNION53 22.53
STERLING54 22.51
HADDAM55 22.47
COLEBROOK56 22.28
COLCHESTER57 22.18
NEWTOWN58 22.12
COVENTRY59 21.97
LEDYARD60 21.84
CROMWELL61 21.72
TRUMBULL62 21.66
BETHEL63 21.51
ELLINGTON64 21.48
BURLINGTON65 21.46
BERLIN66 21.34
HAMPTON67 21.28
SPRAGUE68 21.14
NORTH BRANFORD69 21.12
EAST WINDSOR70 20.94
CANTON71 20.93
MIDDLEBURY72 20.87
ORANGE73 20.86
WINDSOR74 20.85
ENFIELD75 20.69
EASTON76 20.66
NEW HARTFORD77 20.65
NORTH HAVEN78 20.61
NORTH CANAAN79 20.59
MANSFIELD80 20.55
EAST HADDAM81 20.32
CHESHIRE82 20.15
WATERTOWN83 20.11
LEBANON84 20.09
MONTVILLE85 19.95
AVON86 19.94
KILLINGLY87 19.92
BOZRAH88 19.91
EAST GRANBY89 19.87
REDDING90 19.85
PROSPECT91 19.85
WOLCOTT92 19.71
PLAINFIELD93 19.66
WILLINGTON94 19.61
SOUTHINGTON95 19.61
VOLUNTOWN96 19.59
MILFORD97 19.58
GRISWOLD98 19.55
DANBURY99 19.50
WINDSOR LOCKS100 19.34
NORTH STONINGTON101 19.34
BARKHAMSTED102 19.31
EAST HAMPTON103 19.30
HARWINTON104 19.14
WOODBURY105 19.13
SUFFIELD106 19.11
WALLINGFORD107 19.05
BRANFORD108 18.94
NEW FAIRFIELD109 18.92
SOUTHBURY110 18.87
CLINTON111 18.83
ROCKY HILL112 18.81
POMFRET113 18.79
WESTON114 18.74
NEW MILFORD115 18.67
MORRIS116 18.64
DEEP RIVER117 18.63
GUILFORD118 18.48
LITCHFIELD119 18.43
EASTFORD120 18.26
BROOKFIELD121 18.22
CHESTER122 18.21
HARTLAND123 17.86
KILLINGWORTH124 17.67
WILTON125 17.60
WATERFORD126 17.57
BROOKLYN127 17.50
MADISON128 17.46
COLUMBIA129 17.46
FARMINGTON130 17.37
THOMPSON131 17.27
OXFORD132 17.04
PRESTON133 16.92
EAST LYME134 16.85
RIDGEFIELD135 16.83
CANAAN136 16.72
FAIRFIELD137 16.67
NORWALK138 16.57
CANTERBURY139 16.45
NORFOLK140 16.45
WOODSTOCK141 16.43
BETHLEHEM142 16.27
SOMERS143 16.23
FRANKLIN144 15.73
SHELTON145 15.23
WESTBROOK146 15.15
GROTON147 15.11
STAMFORD148 15.06
OLD LYME149 14.42
STONINGTON150 14.03
ESSEX151 14.01
SHERMAN152 13.64
GOSHEN153 13.43
BRIDGEWATER154 13.23
LISBON155 13.08
OLD SAYBROOK156 13.06
LYME157 12.94
KENT158 12.61
CORNWALL159 12.52
PUTNAM160 11.51
WESTPORT161 11.01
SHARON162 10.74
NEW CANAAN163 10.54
ROXBURY164 10.11
DARIEN165 9.45
WARREN166 9.34
WASHINGTON167 8.73
SALISBURY168 7.69
GREENWICH169 6.99
Average:
Median: 19.95
18.98
C - 20


Equalized Net Grand List per
Capita, FYE 2016
GREENWICH $802,3141
DARIEN $623,6282
NEW CANAAN $610,3283
WESTPORT $596,3654
WASHINGTON $502,6195
SALISBURY $454,3986
ROXBURY $434,0827
WARREN $380,0868
CORNWALL $352,9149
WILTON $352,12710
WESTON $347,98111
SHARON $341,53712
OLD SAYBROOK $315,21913
BRIDGEWATER $308,58014
LYME $300,41715
OLD LYME $299,31216
KENT $297,47517
RIDGEFIELD $287,78118
SHERMAN $272,82819
FAIRFIELD $264,39520
GOSHEN $258,49721
EASTON $258,30622
REDDING $249,84823
STAMFORD $249,11324
WESTBROOK $247,34625
WATERFORD $242,91826
NORFOLK $239,20027
ESSEX $238,78328
MADISON $232,00729
STONINGTON $214,20030
ORANGE $207,86431
CANAAN $205,77032
AVON $203,60433
NORWALK $203,03834
FARMINGTON $200,40035
GUILFORD $199,04336
TRUMBULL $186,57037
MORRIS $186,01038
WOODBRIDGE $185,14039
BROOKFIELD $184,53940
LITCHFIELD $179,45241
MIDDLEBURY $178,69542
BRANFORD $177,73343
EAST GRANBY $173,15544
GLASTONBURY $170,47545
MILFORD $168,28046
NORTH HAVEN $165,81847
CLINTON $164,82948
NEWTOWN $163,59049
OXFORD $163,38650
SOUTHBURY $162,79951
EAST LYME $162,42052
SHELTON $161,88653
WOODBURY $161,48054
NEW FAIRFIELD $161,06955
KILLINGWORTH $160,76456
ROCKY HILL $158,72557
DEEP RIVER $157,57158
COLEBROOK $157,52159
MONROE $155,99460
FRANKLIN $154,78461
HADDAM $153,81962
NEW MILFORD $152,88563
BERLIN $152,03164
BETHANY $151,24765
BETHLEHEM $150,28966
CANTON $149,41767
WEST HARTFORD $148,22068
WINDSOR $147,49969
SIMSBURY $146,92770
DURHAM $144,23171
BETHEL $143,89372
CHESTER $143,13273
CHESHIRE $141,88074
HARWINTON $141,41975
UNION $141,20876
SOUTH WINDSOR $140,81477
BLOOMFIELD $140,79178
WALLINGFORD $138,70579
NEW HARTFORD $137,12680
NORTH STONINGTON $136,26481
BURLINGTON $136,00982
WINDSOR LOCKS $135,84383
COLUMBIA $134,87584
BARKHAMSTED $134,85785
CROMWELL $134,74386
GROTON $134,10687
EAST HADDAM $133,59988
NORTH CANAAN $132,96189
MIDDLEFIELD $132,70990
HARTLAND $132,38591
NORTH BRANFORD $131,59292
MARLBOROUGH $130,82293
SOUTHINGTON $130,59794
LISBON $129,82895
EAST HAMPTON $128,20496
SUFFIELD $127,65397
NEWINGTON $126,98598
BOLTON $124,81099
PROSPECT $124,338100
WOODSTOCK $124,320101
GRANBY $124,293102
EAST WINDSOR $122,435103
STRATFORD $121,827104
LEBANON $121,466105
TOLLAND $121,280106
PORTLAND $120,251107
WATERTOWN $119,903108
SALEM $119,068109
WETHERSFIELD $118,513110
DANBURY $118,509111
ELLINGTON $117,069112
BOZRAH $116,346113
HEBRON $115,742114
PRESTON $115,007115
POMFRET $113,228116
SOMERS $112,110117
EASTFORD $111,419118
ANDOVER $110,751119
PLAINVILLE $109,554120
WOLCOTT $109,459121
VOLUNTOWN $107,447122
BEACON FALLS $107,099123
COVENTRY $106,966124
COLCHESTER $104,981125
WILLINGTON $104,850126
LEDYARD $104,488127
SEYMOUR $102,856128
CANTERBURY $102,561129
THOMASTON $101,818130
MIDDLETOWN $101,623131
CHAPLIN $101,122132
ASHFORD $99,358133
MONTVILLE $98,865134
HAMPTON $97,732135
MANCHESTER $97,170136
KILLINGLY $97,135137
ENFIELD $93,843138
STAFFORD $93,653139
PUTNAM $93,625140
EAST HAVEN $92,645141
HAMDEN $91,256142
BROOKLYN $90,795143
SCOTLAND $90,458144
THOMPSON $90,063145
BRISTOL $90,026146
PLYMOUTH $89,610147
VERNON $87,381148
PLAINFIELD $87,277149
SPRAGUE $87,190150
WINCHESTER $86,630151
STERLING $85,578152
GRISWOLD $82,253153
TORRINGTON $79,678154
DERBY $77,224155
MERIDEN $76,711156
EAST HARTFORD $75,610157
NEW HAVEN $74,833158
WEST HAVEN $72,720159
NAUGATUCK $71,628160
ANSONIA $70,050161
NEW LONDON $68,891162
NORWICH $67,503163
BRIDGEPORT $60,239164
MANSFIELD $56,504165
HARTFORD $52,709166
WATERBURY $51,301167
WINDHAM $50,829168
NEW BRITAIN $50,285169
Average:
Median: $134,857
$151,307
C - 22

SECTION D
INDIVIDUAL TOWN DATA

TOWN INDEX PAGE
ANDOVER DARIEN KENT NORTH STONINGTON STERLING ANSONIA DEEP RIVER KILLINGLY NORWALK STONINGTON ASHFORD DERBY KILLINGWORTH NORWICH STRATFORD AVON DURHAM LEBANON OLD LYME SUFFIELD BARKHAMSTED EAST GRANBY LEDYARD OLD SAYBROOK THOMASTON BEACON FALLS EAST HADDAM LISBON ORANGE THOMPSON BERLIN EAST HAMPTON LITCHFIELD OXFORD TOLLAND BETHANY EAST HARTFORD LYME PLAINFIELD TORRINGTON BETHEL EAST HAVEN MADISON PLAINVILLE TRUMBULL BETHLEHEM EAST LYME MANCHESTER PLYMOUTH UNION BLOOMFIELD EAST WINDSOR MANSFIELD POMFRET VERNON BOLTON EASTFORD MARLBOROUGH PORTLAND VOLUNTOWN BOZRAH EASTON MERIDEN PRESTON WALLINGFORD BRANFORD ELLINGTON MIDDLEBURY PROSPECT WARREN BRIDGEPORT ENFIELD MIDDLEFIELD PUTNAM WASHINGTON BRIDGEWATER ESSEX MIDDLETOWN REDDING WATERBURY BRISTOL FAIRFIELD MILFORD RIDGEFIELD WATERFORD BROOKFIELD FARMINGTON MONROE ROCKY HILL WATERTOWN BROOKLYN FRANKLIN MONTVILLE ROXBURY WEST HARTFORD BURLINGTON GLASTONBURY MORRIS SALEM WEST HAVEN CANAAN GOSHEN NAUGATUCK SALISBURY WESTBROOK CANTERBURY GRANBY NEW BRITAIN SCOTLAND WESTON CANTON GREENWICH NEW CANAAN SEYMOUR WESTPORT CHAPLIN GRISWOLD NEW FAIRFIELD SHARON WETHERSFIELD CHESHIRE GROTON NEW HARTFORD SHELTON WILLINGTON CHESTER GROTON (City of) NEW HAVEN SHERMAN WILTON CLINTON GUILFORD NEW LONDON SIMSBURY WINCHESTER COLCHESTER HADDAM NEW MILFORD SOMERS WINDHAM COLEBROOK HAMDEN NEWINGTON SOUTH WINDSOR WINDSOR COLUMBIA HAMPTON NEWTOWN SOUTHBURY WINDSOR LOCKS CORNWALL HARTFORD NORFOLK SOUTHINGTON WOLCOTT COVENTRY HARTLAND NORTH BRANFORD SPRAGUE WOODBRIDGE CROMWELL HARWINTON NORTH CANAAN STAFFORD WOODBURY DANBURY HEBRON NORTH HAVEN STAMFORD WOODSTOCK

ANDOVER
Bond Rating (Moody's, as of July 1)
Population (State Dept. of Public Health)
Equalized Net Grand List
Equalized Mill Rate
Mill Rate
Total Revenues
Intergovernmental Revenues
Current Year Collection %
Total Expenditures
Education Expenditures
Unemployment (Annual Average)
School Enrollment (State Education Dept.)
TANF Recipients (As a % of Population)
Total Fund Balance (Deficit)
Total Expenditures and Other Financing Uses
Total Revenues and Other Financing Sources
Grand List Data
Property Tax Collection Data
Property Tax Revenues
Net Change In Fund Balance
FISCAL YEARS ENDED 2012 TO 2016
Operating Expenditures
Current Year Adjusted Tax Levy
Net Grand List
Economic Data
Operating Results - General Fund
Fund Balance - General Fund
Total Taxes Collected as a % of Total Outstanding
D - 1
Total Transfers In From Other Funds
Debt Measures
Total Transfers Out To Other Funds
2015
3,273
589
6.4%
0.3%
2013
$369,373,776
21.61
$258,506,273
30.80
$7,980,881
98.8%
98.3%
$7,845,981
$2,930,349
$10,927,830
$0
$10,927,830
$8,562,868
$1,969,196
$10,532,064
$0
$10,532,064
$395,766
$0
$147,430
$2,266,912
$2,425,685
2014
3,272
569
5.6%
0.1%
$359,165,307
22.24
$258,994,445
30.77
$7,989,074
98.7%
98.1%
$7,874,644
$2,979,697
$10,928,616
$0
$11,082,185
$8,800,679
$2,209,479
$11,010,158
$74,603
$11,084,761
($2,576)
$0
$0
$2,423,109
3,262
536
4.5%
0.3%
$379,287,784
21.22
$260,819,765
30.72
$8,047,795
98.9%
98.5%
$7,940,342
$3,019,532
$11,041,322
$0
$11,054,902
$8,576,809
$2,077,800
$10,654,609
$90,450
$10,745,059
$309,843
$0
$59,600
$2,663,238
$2,732,952
2016
3,252
502
4.1%
0.2%
$360,162,930
22.55
$263,133,905
30.72
$8,122,124
98.5%
98.0%
$8,158,369
$2,961,909
$11,215,238
$0
$11,215,238
$8,780,455
$1,994,668
$10,775,123
$187,284
$10,962,407
$252,831
$0
$906,080
$2,049,458
$2,985,783
3,272
608
6.6%
0.3%
2012
$375,282,778
20.40
$277,779,008
27.60
$7,657,199
98.9%
98.4%
$7,520,427
$2,835,725
$10,451,841
$0
$10,451,841
$8,408,601
$1,769,888
$10,178,489
$59
$10,178,548
$273,293
$0
$84,012
$2,029,919
Committed $30,245 $0
Nonspendable $0 $10,114 $2,187
$0
$1,943,720
$0
$11,343$7,939
$0
$2,415,170
Restricted
Assigned
Unassigned
$3,903,870
$158,379
$3,009,004
$150,549
Bonded Long-Term Debt
Annual Debt Service
$4,759,500
$132,885
$4,302,092
$129,060
$3,435,910
$154,509

ANSONIA
Bond Rating (Moody's, as of July 1)
Population (State Dept. of Public Health)
Equalized Net Grand List
Equalized Mill Rate
Mill Rate
Total Revenues
Intergovernmental Revenues
Current Year Collection %
Total Expenditures
Education Expenditures
Unemployment (Annual Average)
School Enrollment (State Education Dept.)
TANF Recipients (As a % of Population)
Total Fund Balance (Deficit)
Total Expenditures and Other Financing Uses
Total Revenues and Other Financing Sources
Grand List Data
Property Tax Collection Data
Property Tax Revenues
Net Change In Fund Balance
FISCAL YEARS ENDED 2012 TO 2016
Operating Expenditures
Current Year Adjusted Tax Levy
Net Grand List
Economic Data
Operating Results - General Fund
Fund Balance - General Fund
Total Taxes Collected as a % of Total Outstanding
D - 2
Total Transfers In From Other Funds
Debt Measures
Total Transfers Out To Other Funds
2015
19,020
2,629
Aa3
10.9%
1.5%
2013
$1,356,816,401
23.93
$1,174,493,645
27.65
$32,474,853
96.3%
91.3%
$32,175,591
$29,957,368
$65,567,716
$0
$65,567,716
$34,124,712
$31,419,424
$65,544,136
$50,000
$65,594,136
($26,420)
$0
$0
$7,431,490
$8,732,966
2014
18,959
2,529
Aa3
9.3%
1.3%
$1,276,588,989
27.52
$892,673,611
39.34
$35,133,842
95.9%
90.9%
$34,270,829
$28,229,568
$67,160,046
$0
$67,160,046
$35,784,832
$28,081,614
$63,866,446
$275,000
$64,141,446
$3,018,600
$0
$0
$11,751,566
18,854
2,585
Aa3
8.1%
1.5%
$1,346,104,648
25.73
$892,497,451
38.61
$34,636,255
96.6%
93.5%
$34,134,309
$27,853,347
$66,599,366
$1,148,272
$67,747,638
$37,029,834
$26,580,667
$63,610,501
$0
$63,610,501
$4,137,137
$0
$0
$13,174,667
$15,888,701
2016
18,732
2,524
Aa3
7.0%
1.2%
$1,312,183,325
25.62
$894,098,985
37.52
$33,615,325
96.7%
92.6%
$32,497,383
$29,372,130
$65,625,346
$0
$65,625,346
$38,507,977
$29,307,817
$67,815,794
$169,586
$67,985,380
($2,360,034)
$0
$0
$9,724,228
$13,528,668
19,158
2,711
Aa3
11.5%
1.5%
2012
$1,456,089,783
21.06
$1,165,382,074
26.25
$30,667,475
96.2%
91.5%
$30,079,600
$26,864,426
$60,502,603
$0
$60,502,603
$33,764,768
$26,610,092
$60,374,860
$0
$60,374,860
$127,743
$0
$0
$8,759,386
Committed $3,804,440 $2,714,034
Nonspendable $0 $0 $0
$2,408,595
$6,350,791
$1,301,476
$0$0
$2,219,132
$9,532,434
Restricted
Assigned
Unassigned
$11,887,495
$8,787,631
$6,549,611
$8,199,236
Bonded Long-Term Debt
Annual Debt Service
$18,324,741
$8,738,794
$15,075,232
$9,109,490
$8,749,598
$7,868,338

ASHFORD
Bond Rating (Moody's, as of July 1)
Population (State Dept. of Public Health)
Equalized Net Grand List
Equalized Mill Rate
Mill Rate
Total Revenues
Intergovernmental Revenues
Current Year Collection %
Total Expenditures
Education Expenditures
Unemployment (Annual Average)
School Enrollment (State Education Dept.)
TANF Recipients (As a % of Population)
Total Fund Balance (Deficit)
Total Expenditures and Other Financing Uses
Total Revenues and Other Financing Sources
Grand List Data
Property Tax Collection Data
Property Tax Revenues
Net Change In Fund Balance
FISCAL YEARS ENDED 2012 TO 2016
Operating Expenditures
Current Year Adjusted Tax Levy
Net Grand List
Economic Data
Operating Results - General Fund
Fund Balance - General Fund
Total Taxes Collected as a % of Total Outstanding
D - 3
Total Transfers In From Other Funds
Debt Measures
Total Transfers Out To Other Funds
2015
4,281
643
Aa3
6.8%
0.6%
2013
$421,452,029
21.83
$294,930,180
31.05
$9,201,569
97.9%
93.5%
$9,247,248
$4,953,913
$14,608,189
$0
$17,398,292
$11,250,309
$3,385,353
$14,635,662
$241,578
$16,961,049
$437,243
$0
$205,062
$2,022,519
$2,259,764
2014
4,259
616
Aa3
5.5%
0.7%
$403,533,699
23.30
$295,376,144
31.65
$9,402,777
98.1%
93.8%
$9,504,537
$5,109,447
$14,993,735
$0
$14,993,735
$11,758,559
$2,699,005
$14,457,564
$759,951
$15,217,515
($223,780)
$0
$102,883
$2,035,984
4,251
598
Aa3
4.5%
0.3%
$406,706,663
23.58
$296,251,889
32.16
$9,591,686
97.9%
93.1%
$9,572,093
$5,028,901
$15,007,838
$0
$15,033,774
$11,771,983
$2,932,783
$14,704,766
$638,452
$15,343,218
($309,444)
$0
$83,667
$1,625,757
$1,726,540
2016
4,236
563
Aa3
4.4%
0.3%
$420,881,941
23.48
$297,466,704
32.96
$9,881,076
98.2%
93.4%
$9,949,890
$4,985,298
$15,379,831
$0
$15,379,831
$11,825,590
$3,084,691
$14,910,281
$363,908
$15,274,189
$105,642
$0
$108,809
$1,708,311
$1,832,182
4,284
703
Aa3
7.7%
0.5%
2012
$405,748,471
21.75
$343,837,767
25.60
$8,826,425
97.9%
93.8%
$8,882,703
$5,120,557
$14,422,540
$0
$14,422,540
$11,084,777
$2,848,269
$13,933,046
$93,463
$14,026,509
$396,031
$0
$57,485
$1,822,521
Committed $15,062 $17,116
Nonspendable $0 $0 $37,878
$26,171
$1,700,987
$26,474
$5,709$145
$22,783
$1,910,173
Restricted
Assigned
Unassigned
$4,034,168
$306,386
$3,151,608
$445,290
Bonded Long-Term Debt
Annual Debt Service
$5,448,488
$499,209
$4,775,407
$952,942
$3,791,250
$412,442

AVON
Bond Rating (Moody's, as of July 1)
Population (State Dept. of Public Health)
Equalized Net Grand List
Equalized Mill Rate
Mill Rate
Total Revenues
Intergovernmental Revenues
Current Year Collection %
Total Expenditures
Education Expenditures
Unemployment (Annual Average)
School Enrollment (State Education Dept.)
TANF Recipients (As a % of Population)
Total Fund Balance (Deficit)
Total Expenditures and Other Financing Uses
Total Revenues and Other Financing Sources
Grand List Data
Property Tax Collection Data
Property Tax Revenues
Net Change In Fund Balance
FISCAL YEARS ENDED 2012 TO 2016
Operating Expenditures
Current Year Adjusted Tax Levy
Net Grand List
Economic Data
Operating Results - General Fund
Fund Balance - General Fund
Total Taxes Collected as a % of Total Outstanding
D - 4
Total Transfers In From Other Funds
Debt Measures
Total Transfers Out To Other Funds
2015
18,386
3,472
Aaa
5.0%
0.1%
2013
$3,573,844,477
19.22
$2,668,106,790
25.65
$68,686,698
99.8%
99.7%
$68,836,758
$8,450,231
$80,754,044
$0
$80,754,044
$53,396,764
$24,260,848
$77,657,612
$1,508,499
$79,166,111
$1,587,933
$0
$2,664,114
$8,035,653
$10,707,173
2014
18,421
3,421
Aaa
4.3%
0.1%
$3,603,844,068
19.75
$2,688,826,620
26.32
$71,181,158
99.8%
99.7%
$71,328,459
$10,344,758
$84,909,300
$2,156
$85,265,657
$56,632,683
$24,381,445
$81,014,128
$2,101,685
$83,115,813
$2,149,844
$0
$4,164,774
$12,857,017
18,414
3,326
Aaa
3.7%
0.0%
$3,656,295,571
19.87
$2,559,080,530
28.32
$72,652,069
99.7%
99.5%
$72,702,548
$9,442,455
$85,264,641
$39,308
$85,459,812
$58,148,061
$25,093,803
$83,241,864
$3,993,997
$87,235,861
($1,776,049)
$0
$3,050,722
$8,003,009
$11,080,968
2016
18,364
3,292
Aaa
3.4%
0.0%
$3,738,989,796
19.94
$2,577,798,250
28.80
$74,537,630
99.7%
99.5%
$74,777,579
$9,949,386
$87,685,177
$340,000
$88,325,083
$59,484,885
$25,598,215
$85,083,100
$3,487,203
$88,570,303
($245,220)
$0
$2,326,985
$8,443,716
$10,782,099
18,283
3,538
Aaa
5.4%
0.1%
2012
$3,572,440,736
18.55
$2,638,616,860
25.04
$66,261,613
99.7%
99.7%
$66,477,970
$10,519,982
$79,568,080
$33,432
$79,601,512
$51,292,289
$26,292,177
$77,584,466
$903,060
$78,487,526
$1,113,986
$0
$2,318,586
$9,119,240
Committed $0 $0
Nonspendable $11,398 $27,237 $190,147
$0
$6,610,507
$0
$7,406$5,157
$0
$8,687,086
Restricted
Assigned
Unassigned
$30,640,043
$3,858,788
$24,788,279
$3,699,813
Bonded Long-Term Debt
Annual Debt Service
$29,570,000
$4,658,237
$33,305,000
$4,437,321
$27,867,484
$3,647,488

BARKHAMSTED
Bond Rating (Moody's, as of July 1)
Population (State Dept. of Public Health)
Equalized Net Grand List
Equalized Mill Rate
Mill Rate
Total Revenues
Intergovernmental Revenues
Current Year Collection %
Total Expenditures
Education Expenditures
Unemployment (Annual Average)
School Enrollment (State Education Dept.)
TANF Recipients (As a % of Population)
Total Fund Balance (Deficit)
Total Expenditures and Other Financing Uses
Total Revenues and Other Financing Sources
Grand List Data
Property Tax Collection Data
Property Tax Revenues
Net Change In Fund Balance
FISCAL YEARS ENDED 2012 TO 2016
Operating Expenditures
Current Year Adjusted Tax Levy
Net Grand List
Economic Data
Operating Results - General Fund
Fund Balance - General Fund
Total Taxes Collected as a % of Total Outstanding
D - 5
Total Transfers In From Other Funds
Debt Measures
Total Transfers Out To Other Funds
2015
3,745
649
6.4%
0.1%
2013
$505,822,210
17.39
$374,141,996
23.39
$8,797,618
97.4%
93.2%
$8,770,258
$2,215,545
$11,122,940
$0
$11,122,940
$8,852,107
$2,022,777
$10,874,884
$20,471
$10,895,355
$227,585
$0
$133,313
$1,550,465
$1,683,778
2014
3,705
602
5.3%
0.1%
$485,270,508
18.81
$374,882,562
24.26
$9,127,518
97.5%
92.9%
$9,101,908
$2,207,868
$11,435,286
$0
$11,435,286
$9,363,120
$2,066,032
$11,429,152
$18,500
$11,447,652
($12,366)
$0
$237,300
$1,671,412
3,685
585
4.6%
0.2%
$484,551,017
19.27
$339,083,712
27.37
$9,335,667
97.5%
92.6%
$9,377,549
$2,206,661
$11,781,212
$0
$11,781,212
$9,432,399
$2,158,584
$11,590,983
$212,300
$11,803,283
($22,071)
$0
$255,000
$1,394,341
$1,649,341
2016
3,664
565
4.4%
0.1%
$494,116,946
19.31
$341,699,965
27.72
$9,543,351
97.3%
91.8%
$9,496,126
$2,190,046
$11,858,453
$0
$11,858,453
$9,502,969
$2,261,714
$11,764,683
$267,420
$12,032,103
($173,650)
$0
$200,000
$1,275,691
$1,475,691
3,759
650
7.6%
0.1%
2012
$531,437,283
15.87
$370,660,182
22.67
$8,435,758
97.7%
93.8%
$8,445,529
$2,118,537
$10,688,900
$0
$10,688,900
$8,597,998
$1,926,399
$10,524,397
$155,040
$10,679,437
$9,463
$0
$1,236
$1,456,193
Committed $0 $0
Nonspendable $0 $0 $0
$0
$1,454,957
$0
$0$0
$0
$1,434,112
Restricted
Assigned
Unassigned
$2,946,192
$129,900
$3,712,978
$673,337
Bonded Long-Term Debt
Annual Debt Service
$3,383,054
$15,254
$3,176,607
$127,150
$4,496,263
$127,500

BEACON FALLS
Bond Rating (Moody's, as of July 1)
Population (State Dept. of Public Health)
Equalized Net Grand List
Equalized Mill Rate
Mill Rate
Total Revenues
Intergovernmental Revenues
Current Year Collection %
Total Expenditures
Education Expenditures
Unemployment (Annual Average)
School Enrollment (State Education Dept.)
TANF Recipients (As a % of Population)
Total Fund Balance (Deficit)
Total Expenditures and Other Financing Uses
Total Revenues and Other Financing Sources
Grand List Data
Property Tax Collection Data
Property Tax Revenues
Net Change In Fund Balance
FISCAL YEARS ENDED 2012 TO 2016
Operating Expenditures
Current Year Adjusted Tax Levy
Net Grand List
Economic Data
Operating Results - General Fund
Fund Balance - General Fund
Total Taxes Collected as a % of Total Outstanding
D - 6
Total Transfers In From Other Funds
Debt Measures
Total Transfers Out To Other Funds
2015
6,052
954
6.4%
0.4%
2013
$675,570,669
21.55
$471,512,634
31.10
$14,555,631
97.0%
91.7%
$14,623,812
$4,478,464
$19,728,537
$0
$20,657,690
$13,516,055
$5,727,279
$19,243,334
$161,689
$19,405,023
$1,252,667
$0
$0
$2,125,229
$2,149,386
2014
6,055
940
6.0%
0.4%
$641,059,735
23.37
$472,457,962
31.90
$14,984,636
97.4%
92.0%
$15,270,452
$4,717,436
$20,537,046
$0
$22,935,542
$13,978,646
$5,619,315
$19,597,961
$50,311
$21,948,186
$987,356
$0
$0
$3,136,742
6,081
934
5.2%
0.4%
$629,447,447
24.40
$475,004,584
32.50
$15,358,614
97.2%
93.2%
$15,752,349
$4,574,430
$20,924,327
$0
$21,043,297
$14,614,288
$6,223,006
$20,837,294
$945,620
$21,782,914
($739,617)
$0
$0
$2,353,095
$2,397,125
2016
6,095
900
4.6%
0.2%
$652,767,965
24.48
$479,221,588
33.40
$15,980,394
97.4%
93.5%
$16,038,809
$4,586,087
$21,493,710
$0
$21,520,494
$14,820,178
$5,917,726
$20,737,904
$272,746
$21,010,650
$509,844
$0
$166,290
$2,710,594
$2,906,969
6,065
995
7.4%
0.4%
2012
$636,220,058
21.95
$540,455,641
26.10
$13,962,723
96.6%
91.9%
$14,110,201
$4,488,715
$19,057,733
$50,000
$19,167,183
$13,312,652
$5,568,523
$18,881,175
$235,900
$19,117,075
$50,108
$0
$0
$872,562
Committed $0 $17,083
Nonspendable $30,085 $26,947 $0
$0
$872,562
$0
$24,157$24,157
$0
$3,112,585
Restricted
Assigned
Unassigned
$16,839,325
$251,224
$21,527,428
$580,323
Bonded Long-Term Debt
Annual Debt Service
$11,132,320
$302,547
$11,355,586
$397,413
$18,303,642
$613,546

BERLIN
Bond Rating (Moody's, as of July 1)
Population (State Dept. of Public Health)
Equalized Net Grand List
Equalized Mill Rate
Mill Rate
Total Revenues
Intergovernmental Revenues
Current Year Collection %
Total Expenditures
Education Expenditures
Unemployment (Annual Average)
School Enrollment (State Education Dept.)
TANF Recipients (As a % of Population)
Total Fund Balance (Deficit)
Total Expenditures and Other Financing Uses
Total Revenues and Other Financing Sources
Grand List Data
Property Tax Collection Data
Property Tax Revenues
Net Change In Fund Balance
FISCAL YEARS ENDED 2012 TO 2016
Operating Expenditures
Current Year Adjusted Tax Levy
Net Grand List
Economic Data
Operating Results - General Fund
Fund Balance - General Fund
Total Taxes Collected as a % of Total Outstanding
D - 7
Total Transfers In From Other Funds
Debt Measures
Total Transfers Out To Other Funds
2015
20,590
3,051
Aa2
6.0%
0.2%
2013
$3,087,503,864
19.21
$2,351,626,782
25.15
$59,323,912
98.7%
97.0%
$59,750,689
$12,927,657
$77,058,458
$103,959
$77,492,817
$46,108,451
$28,853,965
$74,962,416
$1,037,137
$75,999,553
$1,493,264
$0
$1,800,000
$10,701,294
$12,791,267
2014
20,610
3,063
Aa2
5.2%
0.3%
$3,080,343,787
20.13
$2,155,657,751
28.77
$61,995,090
98.9%
97.3%
$62,265,408
$13,429,655
$79,841,221
$73,544
$80,184,450
$48,175,177
$30,819,870
$78,995,047
$1,277,311
$80,272,358
($87,908)
$0
$2,600,000
$12,703,359
20,560
3,024
Aa2
4.7%
0.3%
$3,189,552,820
19.93
$2,186,129,483
28.92
$63,580,282
98.9%
97.2%
$63,867,121
$12,386,029
$80,300,240
$272,540
$81,015,395
$47,885,291
$32,699,803
$80,585,094
$990,900
$81,575,994
($560,599)
$0
$1,800,000
$10,014,792
$12,142,760
2016
20,499
2,938
Aa2
4.1%
0.2%
$3,116,476,402
21.34
$2,177,154,828
30.35
$66,490,030
98.9%
97.8%
$66,691,876
$13,312,658
$84,424,801
$69,610
$97,736,654
$49,476,881
$33,535,145
$83,012,026
$926,296
$96,023,831
$1,712,823
$0
$2,300,000
$11,157,031
$13,855,598
20,463
3,079
Aa2
6.7%
0.2%
2012
$3,173,994,700
17.98
$2,315,395,129
24.50
$57,082,130
98.5%
96.6%
$57,384,370
$13,319,574
$75,213,076
$317,390
$75,642,654
$45,044,221
$28,621,059
$73,665,280
$1,047,083
$74,712,363
$930,291
$0
$1,550,000
$11,298,003
Committed $398,567 $327,968
Nonspendable $0 $0 $0
$368,642
$9,379,361
$289,973
$0$0
$328,093
$9,775,266
Restricted
Assigned
Unassigned
$49,918,168
$4,316,876
$83,924,544
$6,203,033
Bonded Long-Term Debt
Annual Debt Service
$27,583,238
$2,862,610
$34,477,141
$2,941,589
$61,352,429
$4,297,391

BETHANY
Bond Rating (Moody's, as of July 1)
Population (State Dept. of Public Health)
Equalized Net Grand List
Equalized Mill Rate
Mill Rate
Total Revenues
Intergovernmental Revenues
Current Year Collection %
Total Expenditures
Education Expenditures
Unemployment (Annual Average)
School Enrollment (State Education Dept.)
TANF Recipients (As a % of Population)
Total Fund Balance (Deficit)
Total Expenditures and Other Financing Uses
Total Revenues and Other Financing Sources
Grand List Data
Property Tax Collection Data
Property Tax Revenues
Net Change In Fund Balance
FISCAL YEARS ENDED 2012 TO 2016
Operating Expenditures
Current Year Adjusted Tax Levy
Net Grand List
Economic Data
Operating Results - General Fund
Fund Balance - General Fund
Total Taxes Collected as a % of Total Outstanding
D - 8
Total Transfers In From Other Funds
Debt Measures
Total Transfers Out To Other Funds
2015
5,540
944
Aa2
5.6%
0.1%
2013
$820,596,492
21.60
$619,479,650
28.54
$17,724,295
98.5%
98.0%
$17,861,301
$3,437,582
$22,060,185
$0
$22,060,185
$15,599,595
$5,522,645
$21,122,240
$539,796
$21,662,036
$398,149
$3,300
$300,000
$3,032,874
$3,387,567
2014
5,531
914
Aa2
5.3%
0.0%
$815,132,209
22.59
$620,166,763
29.60
$18,412,298
98.6%
97.8%
$18,347,495
$3,467,034
$22,710,966
$0
$22,710,966
$15,923,151
$5,970,526
$21,893,677
$638,328
$22,532,005
$178,961
$3,300
$340,000
$3,566,528
5,510
885
Aa2
4.4%
0.1%
$784,906,293
23.85
$549,236,405
33.90
$18,720,483
98.6%
97.7%
$18,709,655
$3,301,310
$22,899,209
$0
$22,899,209
$16,405,008
$6,210,255
$22,615,263
$1,014,691
$23,629,954
($730,745)
$3,300
$255,000
$2,544,030
$2,835,783
2016
5,488
841
Aa2
3.9%
0.1%
$830,045,629
23.38
$551,306,171
35.04
$19,406,173
98.8%
98.0%
$19,523,218
$3,424,720
$24,113,267
$0
$24,113,267
$16,698,230
$6,535,304
$23,233,534
$467,000
$23,700,534
$412,733
$3,300
$0
$3,193,549
$3,248,516
5,550
974
Aa2
6.1%
0.2%
2012
$818,192,358
21.22
$617,087,907
28.06
$17,361,758
98.6%
98.0%
$17,388,184
$3,233,000
$21,332,188
$0
$27,292,924
$15,411,290
$5,565,902
$20,977,192
$509,819
$27,005,572
$287,352
$3,300
$0
$2,989,420
Committed $0 $0
Nonspendable $51,667 $33,453 $20,822
$0
$2,965,298
$0
$51,393$13,966
$0
$3,209,262
Restricted
Assigned
Unassigned
$13,753,560
$1,179,707
$10,803,627
$1,047,607
Bonded Long-Term Debt
Annual Debt Service
$17,003,908
$1,155,706
$15,550,217
$1,176,287
$12,321,602
$1,157,072

BETHEL
Bond Rating (Moody's, as of July 1)
Population (State Dept. of Public Health)
Equalized Net Grand List
Equalized Mill Rate
Mill Rate
Total Revenues
Intergovernmental Revenues
Current Year Collection %
Total Expenditures
Education Expenditures
Unemployment (Annual Average)
School Enrollment (State Education Dept.)
TANF Recipients (As a % of Population)
Total Fund Balance (Deficit)
Total Expenditures and Other Financing Uses
Total Revenues and Other Financing Sources
Grand List Data
Property Tax Collection Data
Property Tax Revenues
Net Change In Fund Balance
FISCAL YEARS ENDED 2012 TO 2016
Operating Expenditures
Current Year Adjusted Tax Levy
Net Grand List
Economic Data
Operating Results - General Fund
Fund Balance - General Fund
Total Taxes Collected as a % of Total Outstanding
D - 9
Total Transfers In From Other Funds
Debt Measures
Total Transfers Out To Other Funds
2015
19,264
2,962
Aa2
6.5%
0.2%
2013
$2,654,603,288
21.12
$2,340,464,670
24.07
$56,056,266
98.7%
98.4%
$56,319,319
$13,396,122
$70,858,954
$0
$70,858,954
$44,246,629
$24,153,540
$68,400,169
$655,730
$69,055,899
$1,803,055
$0
$0
$10,899,766
$11,020,653
2014
19,372
2,946
Aa2
5.4%
0.2%
$2,646,524,193
21.96
$1,852,145,585
31.50
$58,116,179
98.8%
98.5%
$58,682,339
$14,565,184
$74,729,636
$0
$74,737,636
$46,384,500
$24,760,251
$71,144,751
$890,529
$72,035,280
$2,702,356
$0
$0
$13,723,009
19,529
2,880
Aa2
4.7%
0.1%
$2,732,007,325
21.87
$1,864,792,390
32.11
$59,743,962
98.7%
98.4%
$59,900,954
$13,385,789
$74,469,096
$0
$74,469,096
$46,517,348
$25,004,722
$71,522,070
$1,174,866
$72,696,936
$1,772,160
$0
$0
$15,284,996
$15,583,907
2016
19,627
2,930
Aa2
4.3%
0.1%
$2,824,194,298
21.51
$1,890,122,000
32.18
$60,745,636
98.8%
98.2%
$61,102,747
$13,962,715
$76,575,748
$0
$76,575,748
$48,105,825
$24,810,383
$72,916,208
$1,680,000
$74,596,208
$1,979,540
$0
$0
$16,549,611
$17,563,447
19,161
2,962
Aa2
6.9%
0.2%
2012
$2,769,107,286
19.02
$2,312,832,450
23.24
$52,657,934
98.8%
98.4%
$54,167,031
$13,030,608
$68,326,365
$0
$68,326,365
$42,185,635
$23,402,766
$65,588,401
$553,779
$66,142,180
$2,184,185
$0
$0
$9,217,598
Committed $380,807 $264,119
Nonspendable $633,029 $34,792 $61,987
$0
$9,155,611
$0
$120,887$132,117
$0
$13,590,892
Restricted
Assigned
Unassigned
$28,878,941
$3,373,128
$29,018,981
$2,968,586
Bonded Long-Term Debt
Annual Debt Service
$32,796,404
$3,810,542
$30,309,208
$3,660,464
$26,677,904
$2,675,464

BETHLEHEM
Bond Rating (Moody's, as of July 1)
Population (State Dept. of Public Health)
Equalized Net Grand List
Equalized Mill Rate
Mill Rate
Total Revenues
Intergovernmental Revenues
Current Year Collection %
Total Expenditures
Education Expenditures
Unemployment (Annual Average)
School Enrollment (State Education Dept.)
TANF Recipients (As a % of Population)
Total Fund Balance (Deficit)
Total Expenditures and Other Financing Uses
Total Revenues and Other Financing Sources
Grand List Data
Property Tax Collection Data
Property Tax Revenues
Net Change In Fund Balance
FISCAL YEARS ENDED 2012 TO 2016
Operating Expenditures
Current Year Adjusted Tax Levy
Net Grand List
Economic Data
Operating Results - General Fund
Fund Balance - General Fund
Total Taxes Collected as a % of Total Outstanding
D - 10
Total Transfers In From Other Funds
Debt Measures
Total Transfers Out To Other Funds
2015
3,553
428
5.7%
0.0%
2013
$490,788,175
16.88
$405,598,145
20.50
$8,284,463
97.9%
94.2%
$8,392,776
$1,734,028
$10,319,687
$24,722
$10,344,409
$6,784,789
$2,402,183
$9,186,972
$834,231
$10,021,203
$323,206
$0
$300,000
$1,406,343
$1,706,343
2014
3,501
404
5.4%
0.1%
$531,735,907
15.63
$407,011,169
20.50
$8,310,051
97.4%
93.8%
$8,356,242
$1,667,107
$10,283,754
$105,625
$10,389,379
$7,017,668
$2,375,082
$9,392,750
$922,036
$10,314,786
$74,593
$0
$250,000
$1,780,936
3,473
383
4.6%
0.1%
$520,535,507
15.69
$364,205,855
22.47
$8,164,913
97.6%
92.9%
$8,246,446
$1,721,757
$10,203,582
$0
$10,203,582
$6,946,134
$2,493,981
$9,440,115
$917,345
$10,357,460
($153,878)
$0
$250,000
$1,377,058
$1,627,058
2016
3,447
353
4.4%
0.0%
$518,047,233
16.27
$367,532,967
22.96
$8,428,522
98.1%
94.1%
$8,555,685
$1,609,445
$10,398,136
$405,000
$10,803,136
$7,187,029
$2,414,137
$9,601,166
$1,063,132
$10,664,298
$138,838
$0
$0
$1,465,896
$1,765,896
3,566
453
6.5%
0.0%
2012
$552,927,754
15.09
$405,637,873
20.67
$8,341,223
97.7%
94.2%
$8,473,981
$1,505,732
$10,207,024
$0
$10,207,024
$6,870,029
$2,359,559
$9,229,588
$839,811
$10,069,399
$137,625
$0
$300,000
$1,383,137
Committed $300,000 $0
Nonspendable $0 $0 $0
$0
$1,083,137
$0
$0$0
$0
$1,530,936
Restricted
Assigned
Unassigned
$223,596
$0
$0
$0
Bonded Long-Term Debt
Annual Debt Service
$723,296
$0
$474,320
$0
$67,146
$0

BLOOMFIELD
Bond Rating (Moody's, as of July 1)
Population (State Dept. of Public Health)
Equalized Net Grand List
Equalized Mill Rate
Mill Rate
Total Revenues
Intergovernmental Revenues
Current Year Collection %
Total Expenditures
Education Expenditures
Unemployment (Annual Average)
School Enrollment (State Education Dept.)
TANF Recipients (As a % of Population)
Total Fund Balance (Deficit)
Total Expenditures and Other Financing Uses
Total Revenues and Other Financing Sources
Grand List Data
Property Tax Collection Data
Property Tax Revenues
Net Change In Fund Balance
FISCAL YEARS ENDED 2012 TO 2016
Operating Expenditures
Current Year Adjusted Tax Levy
Net Grand List
Economic Data
Operating Results - General Fund
Fund Balance - General Fund
Total Taxes Collected as a % of Total Outstanding
D - 11
Total Transfers In From Other Funds
Debt Measures
Total Transfers Out To Other Funds
2015
20,673
2,261
Aa2
8.4%
0.9%
2013
$2,595,430,274
26.42
$1,980,601,704
34.55
$68,561,240
98.4%
97.4%
$68,752,328
$14,348,379
$85,085,106
$0
$96,470,947
$40,980,883
$37,716,257
$78,697,140
$2,083,237
$92,116,750
$4,354,197
$712,937
$2,122,990
$14,602,679
$17,438,606
2014
20,819
2,187
Aa2
7.1%
0.9%
$2,802,966,115
25.36
$2,031,708,687
34.85
$71,075,964
98.5%
97.7%
$71,679,525
$11,640,999
$85,402,840
$50,000
$85,452,840
$42,708,097
$39,127,389
$81,835,486
$2,850,000
$84,685,486
$767,354
$0
$2,315,312
$18,205,960
20,749
2,244
Aa2
6.3%
0.9%
$2,837,611,566
25.46
$2,067,157,242
34.84
$72,246,279
98.6%
97.7%
$72,644,940
$10,539,585
$85,119,505
$125,000
$85,413,092
$42,712,016
$41,111,724
$83,823,740
$2,631,577
$86,455,317
($1,042,225)
$0
$2,054,536
$15,109,199
$17,163,735
2016
20,642
2,238
Aa2
5.5%
0.7%
$2,906,211,229
25.17
$2,033,984,990
36.00
$73,160,192
98.7%
98.0%
$73,563,398
$11,091,620
$89,140,280
$100,000
$89,240,280
$43,740,001
$42,093,656
$85,833,657
$2,419,246
$88,252,903
$987,377
$0
$1,551,424
$16,599,688
$18,151,112
20,602
2,374
Aa2
9.0%
0.9%
2012
$2,786,819,016
23.43
$1,954,832,232
33.70
$65,281,933
98.7%
97.9%
$66,310,109
$12,018,377
$80,049,238
$197,911
$80,323,514
$41,407,469
$38,497,834
$79,905,303
$733,186
$80,638,489
($314,975)
$1,382,150
$672,501
$13,084,409
Committed $0 $0
Nonspendable $0 $0 $0
$0
$11,029,758
$0
$0$0
$0
$15,890,648
Restricted
Assigned
Unassigned
$55,625,000
$5,955,928
$53,085,250
$6,198,138
Bonded Long-Term Debt
Annual Debt Service
$63,591,061
$5,486,120
$59,355,261
$6,509,608
$57,265,250
$6,087,159

BOLTON
Bond Rating (Moody's, as of July 1)
Population (State Dept. of Public Health)
Equalized Net Grand List
Equalized Mill Rate
Mill Rate
Total Revenues
Intergovernmental Revenues
Current Year Collection %
Total Expenditures
Education Expenditures
Unemployment (Annual Average)
School Enrollment (State Education Dept.)
TANF Recipients (As a % of Population)
Total Fund Balance (Deficit)
Total Expenditures and Other Financing Uses
Total Revenues and Other Financing Sources
Grand List Data
Property Tax Collection Data
Property Tax Revenues
Net Change In Fund Balance
FISCAL YEARS ENDED 2012 TO 2016
Operating Expenditures
Current Year Adjusted Tax Levy
Net Grand List
Economic Data
Operating Results - General Fund
Fund Balance - General Fund
Total Taxes Collected as a % of Total Outstanding
D - 12
Total Transfers In From Other Funds
Debt Measures
Total Transfers Out To Other Funds
2015
4,948
815
Aa3
5.5%
0.3%
2013
$596,743,013
24.02
$479,708,927
29.80
$14,331,829
98.9%
98.6%
$14,573,921
$4,855,814
$20,066,210
$0
$20,066,210
$14,080,200
$5,243,532
$19,323,732
$532,225
$19,855,957
$210,253
$0
$1,233,967
$986,036
$2,221,323
2014
4,952
803
Aa3
4.5%
0.3%
$614,405,621
24.28
$480,891,802
30.96
$14,920,330
99.2%
99.0%
$15,003,849
$4,830,217
$20,429,001
$0
$20,429,001
$14,500,226
$5,267,716
$19,767,942
$526,770
$20,294,712
$134,289
$0
$1,336,506
$2,355,612
4,947
779
Aa3
3.9%
0.3%
$610,929,036
24.79
$427,447,825
35.34
$15,144,307
99.3%
99.0%
$15,240,614
$4,981,416
$20,759,488
$46,041
$20,956,352
$14,768,355
$5,624,787
$20,393,142
$484,695
$20,877,837
$78,515
$0
$1,335,428
$1,098,699
$2,434,127
2016
4,930
759
Aa3
3.6%
0.2%
$615,311,148
25.72
$428,519,803
36.77
$15,823,160
98.9%
98.7%
$15,817,931
$4,897,507
$21,353,960
$0
$21,353,960
$14,696,498
$5,714,206
$20,410,704
$471,185
$20,881,889
$472,071
$0
$1,387,152
$1,381,546
$2,906,198
4,960
828
Aa3
5.7%
0.3%
2012
$639,975,197
21.79
$477,288,285
29.33
$13,943,188
98.8%
98.0%
$14,099,797
$4,994,535
$19,739,348
$0
$19,769,193
$13,711,064
$5,110,375
$18,821,439
$531,818
$19,353,257
$415,936
$0
$1,134,194
$2,011,070
Committed $30,000 $0
Nonspendable $107,500 $0 $4,676
$0
$872,200
$0
$1,320$32,747
$0
$986,359
Restricted
Assigned
Unassigned
$12,839,672
$1,202,214
$11,296,259
$1,169,514
Bonded Long-Term Debt
Annual Debt Service
$14,502,410
$1,215,446
$13,648,775
$1,278,076
$12,152,322
$1,178,289

BOZRAH
Bond Rating (Moody's, as of July 1)
Population (State Dept. of Public Health)
Equalized Net Grand List
Equalized Mill Rate
Mill Rate
Total Revenues
Intergovernmental Revenues
Current Year Collection %
Total Expenditures
Education Expenditures
Unemployment (Annual Average)
School Enrollment (State Education Dept.)
TANF Recipients (As a % of Population)
Total Fund Balance (Deficit)
Total Expenditures and Other Financing Uses
Total Revenues and Other Financing Sources
Grand List Data
Property Tax Collection Data
Property Tax Revenues
Net Change In Fund Balance
FISCAL YEARS ENDED 2012 TO 2016
Operating Expenditures
Current Year Adjusted Tax Levy
Net Grand List
Economic Data
Operating Results - General Fund
Fund Balance - General Fund
Total Taxes Collected as a % of Total Outstanding
D - 13
Total Transfers In From Other Funds
Debt Measures
Total Transfers Out To Other Funds
2015
2,639
343
A1
7.6%
0.4%
2013
$314,565,082
17.33
$244,343,654
22.50
$5,452,163
97.4%
93.3%
$5,417,756
$2,082,116
$7,665,514
$25,000
$7,690,514
$5,670,995
$2,268,447
$7,939,442
$0
$7,939,442
($248,928)
$0
$0
$278,172
$278,372
2014
2,622
345
6.6%
0.2%
$308,291,157
18.39
$215,585,700
26.25
$5,669,902
97.6%
93.6%
$5,684,257
$2,368,562
$8,235,484
$126
$8,235,610
$5,831,304
$2,269,878
$8,101,182
$0
$8,101,182
$134,428
$0
$0
$412,800
2,603
314
5.4%
0.2%
$287,469,867
20.34
$218,581,611
26.75
$5,845,793
97.4%
93.1%
$5,905,444
$2,091,938
$8,195,143
$0
$8,195,143
$5,857,043
$2,439,285
$8,296,328
$0
$8,296,328
($101,185)
$0
$0
$311,615
$311,615
2016
2,578
308
4.6%
0.2%
$299,941,184
19.91
$220,073,977
27.00
$5,970,977
97.9%
95.2%
$6,034,430
$2,217,063
$8,519,509
$0
$8,519,509
$5,925,910
$2,254,270
$8,180,180
$0
$8,180,180
$339,329
$0
$0
$650,944
$650,944
2,638
350
A1
7.9%
0.6%
2012
$299,899,708
16.51
$243,404,219
22.00
$4,949,866
98.2%
94.0%
$5,405,496
$2,190,134
$7,788,433
$25,952
$7,814,385
$5,548,197
$1,929,425
$7,477,622
$0
$7,477,622
$336,763
$0
$134,913
$527,301
Committed $0 $0
Nonspendable $0 $0 $2,151
$0
$390,237
$0
$200$0
$0
$412,800
Restricted
Assigned
Unassigned
$3,644,916
$519,120
$2,918,689
$493,360
Bonded Long-Term Debt
Annual Debt Service
$4,306,479
$444,872
$4,004,083
$537,105
$3,282,991
$506,240

BRANFORD
Bond Rating (Moody's, as of July 1)
Population (State Dept. of Public Health)
Equalized Net Grand List
Equalized Mill Rate
Mill Rate
Total Revenues
Intergovernmental Revenues
Current Year Collection %
Total Expenditures
Education Expenditures
Unemployment (Annual Average)
School Enrollment (State Education Dept.)
TANF Recipients (As a % of Population)
Total Fund Balance (Deficit)
Total Expenditures and Other Financing Uses
Total Revenues and Other Financing Sources
Grand List Data
Property Tax Collection Data
Property Tax Revenues
Net Change In Fund Balance
FISCAL YEARS ENDED 2012 TO 2016
Operating Expenditures
Current Year Adjusted Tax Levy
Net Grand List
Economic Data
Operating Results - General Fund
Fund Balance - General Fund
Total Taxes Collected as a % of Total Outstanding
D - 14
Total Transfers In From Other Funds
Debt Measures
Total Transfers Out To Other Funds
2015
27,988
3,354
Aa1
6.7%
0.4%
2013
$4,905,862,518
17.67
$3,466,384,192
24.95
$86,677,790
98.6%
96.7%
$87,473,879
$9,900,481
$103,895,497
$482,264
$104,377,761
$56,100,841
$42,678,156
$98,778,997
$3,301,057
$102,080,054
$2,297,707
$0
$3,284,951
$17,472,351
$21,638,146
2014
28,225
3,316
Aa1
5.7%
0.3%
$5,030,865,923
17.77
$3,486,675,562
25.59
$89,402,779
98.5%
96.4%
$89,374,443
$10,244,386
$105,095,586
$483,822
$105,579,408
$57,742,288
$42,674,183
$100,416,471
$3,833,397
$104,249,868
$1,329,540
$0
$3,542,725
$22,967,686
28,145
3,183
Aa1
5.1%
0.3%
$4,973,991,562
18.60
$3,511,071,799
26.24
$92,508,065
98.5%
96.5%
$93,137,810
$8,421,875
$106,885,659
$524,481
$129,503,403
$57,416,360
$43,308,531
$100,724,891
$5,412,406
$127,710,902
$1,792,501
$0
$3,177,321
$21,500,116
$24,760,187
2016
28,028
3,122
Aa1
4.5%
0.3%
$4,981,495,540
18.94
$3,485,684,401
26.93
$94,341,895
98.5%
96.3%
$94,484,140
$8,854,178
$108,909,565
$597,452
$109,507,017
$59,226,125
$46,142,969
$105,369,094
$4,280,246
$109,649,340
($142,323)
$0
$3,250,167
$21,286,883
$24,617,864
28,024
3,393
Aa1
7.5%
0.4%
2012
$4,932,416,163
16.97
$3,446,825,087
24.27
$83,707,138
98.3%
96.3%
$83,858,159
$9,720,290
$98,559,752
$430,039
$99,410,925
$54,721,423
$40,673,266
$95,394,689
$2,922,376
$98,317,065
$1,093,860
$0
$3,215,268
$19,340,439
Committed $64,517 $65,523
Nonspendable $16,297 $17,227 $30,564
$61,284
$16,033,323
$851,282
$29,562$31,200
$69,252
$19,324,509
Restricted
Assigned
Unassigned
$43,620,106
$7,310,265
$37,176,199
$8,018,795
Bonded Long-Term Debt
Annual Debt Service
$55,742,886
$6,848,487
$49,768,298
$7,268,138
$44,229,877
$6,592,379

BRIDGEPORT
Bond Rating (Moody's, as of July 1)
Population (State Dept. of Public Health)
Equalized Net Grand List
Equalized Mill Rate
Mill Rate
Total Revenues
Intergovernmental Revenues
Current Year Collection %
Total Expenditures
Education Expenditures
Unemployment (Annual Average)
School Enrollment (State Education Dept.)
TANF Recipients (As a % of Population)
Total Fund Balance (Deficit)
Total Expenditures and Other Financing Uses
Total Revenues and Other Financing Sources
Grand List Data
Property Tax Collection Data
Property Tax Revenues
Net Change In Fund Balance
FISCAL YEARS ENDED 2012 TO 2016
Operating Expenditures
Current Year Adjusted Tax Levy
Net Grand List
Economic Data
Operating Results - General Fund
Fund Balance - General Fund
Total Taxes Collected as a % of Total Outstanding
D - 15
Total Transfers In From Other Funds
Debt Measures
Total Transfers Out To Other Funds
2015
147,216
20,485
A1
11.9%
2.3%
2013
$7,729,475,314
37.01
$6,980,962,874
41.11
$286,087,295
97.4%
86.7%
$285,962,925
$234,019,361
$539,075,595
$500,000
$599,674,688
$261,470,234
$278,295,951
$539,766,185
$0
$599,471,120
$203,568
$0
$0
$12,574,082
$12,924,082
2014
147,612
21,008
A2
10.2%
1.9%
$8,275,778,089
35.48
$7,110,904,657
41.86
$293,618,037
97.0%
85.9%
$290,690,776
$240,139,304
$552,115,914
$500,000
$568,056,103
$267,927,607
$281,518,300
$549,445,907
$2,910,284
$567,584,369
$471,734
$0
$0
$13,395,816
147,629
21,096
A2
8.8%
1.7%
$7,896,519,203
37.52
$7,079,109,642
42.20
$296,309,866
98.3%
86.1%
$297,658,389
$232,665,443
$552,294,012
$500,000
$588,192,445
$264,104,051
$288,115,427
$552,219,478
$558,839
$587,874,800
$317,645
$0
$0
$13,363,461
$13,713,461
2016
145,936
20,946
A2
7.7%
1.5%
$8,791,072,383
33.94
$7,136,523,574
42.20
$298,378,832
98.3%
86.3%
$299,380,641
$234,246,831
$567,250,296
$3,313,024
$640,709,235
$273,774,169
$296,152,567
$569,926,736
$316,915
$639,803,554
$905,681
$0
$0
$14,269,142
$14,619,142
146,425
20,871
A1
12.6%
2.7%
2012
$8,760,393,532
31.43
$6,985,043,932
39.64
$275,342,273
97.3%
86.5%
$274,118,745
$231,508,096
$525,041,173
$500,000
$525,541,173
$259,297,544
$270,083,625
$529,381,169
$0
$529,381,169
($3,839,996)
$0
$3,222,700
$12,720,514
Committed $0 $0
Nonspendable $350,000 $350,000 $350,000
$0
$9,147,814
$0
$350,000$350,000
$0
$13,045,816
Restricted
Assigned
Unassigned
$622,329,724
$74,023,395
$627,370,200
$73,557,934
Bonded Long-Term Debt
Annual Debt Service
$695,608,000
$70,974,002
$663,411,000
$66,201,895
$647,805,133
$77,557,896

BRIDGEWATER
Bond Rating (Moody's, as of July 1)
Population (State Dept. of Public Health)
Equalized Net Grand List
Equalized Mill Rate
Mill Rate
Total Revenues
Intergovernmental Revenues
Current Year Collection %
Total Expenditures
Education Expenditures
Unemployment (Annual Average)
School Enrollment (State Education Dept.)
TANF Recipients (As a % of Population)
Total Fund Balance (Deficit)
Total Expenditures and Other Financing Uses
Total Revenues and Other Financing Sources
Grand List Data
Property Tax Collection Data
Property Tax Revenues
Net Change In Fund Balance
FISCAL YEARS ENDED 2012 TO 2016
Operating Expenditures
Current Year Adjusted Tax Levy
Net Grand List
Economic Data
Operating Results - General Fund
Fund Balance - General Fund
Total Taxes Collected as a % of Total Outstanding
D - 16
Total Transfers In From Other Funds
Debt Measures
Total Transfers Out To Other Funds
2015
1,696
197
6.0%
0.0%
2013
$551,028,926
12.24
$385,571,838
17.50
$6,744,343
99.5%
99.3%
$6,784,468
$307,777
$7,236,796
$0
$7,236,796
$4,891,483
$2,252,028
$7,143,511
$85,000
$7,228,511
$8,285
$0
$2,563,955
$868,510
$3,432,465
2014
1,675
170
5.8%
0.0%
$522,898,157
12.93
$387,086,614
17.50
$6,759,555
99.8%
99.6%
$6,804,048
$184,418
$7,183,973
$0
$7,183,973
$4,950,398
$2,232,328
$7,182,726
$96,000
$7,278,726
($94,753)
$0
$2,326,908
$3,337,712
1,659
145
4.5%
0.0%
$500,337,946
13.38
$389,449,386
17.25
$6,692,876
99.7%
99.6%
$6,704,480
$192,390
$7,119,691
$0
$7,119,691
$4,686,690
$2,427,301
$7,113,991
$215,000
$7,328,991
($209,300)
$0
$1,932,327
$1,196,085
$3,128,412
2016
1,648
136
3.4%
0.0%
$508,540,109
13.23
$390,634,084
17.25
$6,727,869
99.7%
99.5%
$6,770,619
$222,017
$7,276,705
$44,409
$7,321,114
$4,368,358
$2,594,519
$6,962,877
$159,000
$7,121,877
$199,237
$0
$1,821,851
$1,505,798
$3,327,649
1,702
205
5.7%
0.0%
2012
$494,235,816
13.68
$416,521,811
16.25
$6,759,286
99.5%
99.0%
$6,772,551
$187,351
$7,259,541
$0
$7,259,541
$5,022,059
$2,146,106
$7,168,165
$45,000
$7,213,165
$46,376
$0
$2,487,831
$3,424,180
Committed $0 $0
Nonspendable $0 $0 $0
$0
$936,349
$0
$0$0
$0
$1,010,804
Restricted
Assigned
Unassigned
$575,886
$0
$278,235
$0
Bonded Long-Term Debt
Annual Debt Service
$863,280
$0
$708,455
$0
$418,338
$0

BRISTOL
Bond Rating (Moody's, as of July 1)
Population (State Dept. of Public Health)
Equalized Net Grand List
Equalized Mill Rate
Mill Rate
Total Revenues
Intergovernmental Revenues
Current Year Collection %
Total Expenditures
Education Expenditures
Unemployment (Annual Average)
School Enrollment (State Education Dept.)
TANF Recipients (As a % of Population)
Total Fund Balance (Deficit)
Total Expenditures and Other Financing Uses
Total Revenues and Other Financing Sources
Grand List Data
Property Tax Collection Data
Property Tax Revenues
Net Change In Fund Balance
FISCAL YEARS ENDED 2012 TO 2016
Operating Expenditures
Current Year Adjusted Tax Levy
Net Grand List
Economic Data
Operating Results - General Fund
Fund Balance - General Fund
Total Taxes Collected as a % of Total Outstanding
D - 17
Total Transfers In From Other Funds
Debt Measures
Total Transfers Out To Other Funds
2015
60,568
8,503
Aa2
8.5%
1.5%
2013
$5,459,212,487
22.93
$4,320,751,637
28.75
$125,182,000
98.6%
97.8%
$125,635,000
$64,542,000
$195,280,000
$15,000
$195,295,000
$98,435,000
$54,166,000
$152,601,000
$42,025,000
$194,626,000
$669,000
$0
$2,112,000
$24,149,000
$30,099,000
2014
60,570
8,491
Aa2
7.3%
1.4%
$5,400,791,639
23.67
$3,773,177,053
33.50
$127,835,000
98.2%
97.3%
$127,757,000
$64,980,000
$198,138,000
$2,288,000
$200,426,000
$102,684,000
$55,341,000
$158,025,000
$41,574,000
$199,599,000
$827,000
$0
$1,113,000
$30,926,000
60,452
8,452
Aa2
6.6%
1.4%
$5,747,912,862
23.38
$3,837,148,042
34.61
$134,358,000
98.2%
97.3%
$133,589,970
$67,491,132
$207,756,973
$5,947
$207,762,920
$104,561,451
$87,142,318
$191,703,769
$15,268,312
$206,972,081
$790,839
$0
$2,053,023
$26,605,958
$31,716,983
2016
60,147
8,393
Aa2
5.7%
1.3%
$5,414,806,061
24.81
$3,821,929,916
34.61
$134,361,000
98.1%
97.0%
$134,031,402
$65,965,354
$207,319,190
$74,132
$207,393,322
$105,974,983
$83,185,171
$189,160,154
$13,793,319
$202,953,473
$4,439,849
$0
$4,345,929
$28,737,167
$36,156,832
60,603
8,637
Aa2
9.2%
1.4%
2012
$5,587,418,252
20.94
$4,272,946,245
27.24
$117,021,000
98.8%
97.7%
$117,518,000
$66,772,000
$190,282,000
$1,562,000
$216,599,000
$100,448,000
$55,908,000
$156,356,000
$34,681,000
$215,606,000
$993,000
$0
$1,617,000
$29,430,000
Committed $3,064,919 $3,057,414
Nonspendable $8,817 $588 $2,000
$3,848,000
$23,963,000
$3,835,000
$3,000$2,000
$3,856,000
$25,955,000
Restricted
Assigned
Unassigned
$70,637,000
$9,294,000
$60,208,703
$8,883,863
Bonded Long-Term Debt
Annual Debt Service
$83,839,000
$7,165,000
$77,193,000
$9,836,000
$64,164,390
$8,959,455

BROOKFIELD
Bond Rating (Moody's, as of July 1)
Population (State Dept. of Public Health)
Equalized Net Grand List
Equalized Mill Rate
Mill Rate
Total Revenues
Intergovernmental Revenues
Current Year Collection %
Total Expenditures
Education Expenditures
Unemployment (Annual Average)
School Enrollment (State Education Dept.)
TANF Recipients (As a % of Population)
Total Fund Balance (Deficit)
Total Expenditures and Other Financing Uses
Total Revenues and Other Financing Sources
Grand List Data
Property Tax Collection Data
Property Tax Revenues
Net Change In Fund Balance
FISCAL YEARS ENDED 2012 TO 2016
Operating Expenditures
Current Year Adjusted Tax Levy
Net Grand List
Economic Data
Operating Results - General Fund
Fund Balance - General Fund
Total Taxes Collected as a % of Total Outstanding
D - 18
Total Transfers In From Other Funds
Debt Measures
Total Transfers Out To Other Funds
2015
16,860
2,836
Aa1
6.2%
0.1%
2013
$3,101,025,713
17.05
$2,170,169,449
24.54
$52,885,463
99.1%
98.4%
$53,369,182
$6,510,324
$61,032,656
$174,000
$62,442,712
$41,347,563
$19,928,753
$61,276,316
$744,895
$62,021,211
$421,501
$0
$0
$3,695,461
$5,762,337
2014
17,055
2,826
Aa1
5.2%
0.0%
$3,191,616,523
17.29
$2,181,612,178
25.40
$55,196,602
99.1%
98.4%
$55,535,626
$7,044,108
$63,929,211
$203,138
$81,708,640
$42,881,832
$20,407,191
$63,289,023
$845,450
$81,318,223
$390,417
$0
$0
$6,152,754
17,143
2,756
Aa1
4.4%
0.1%
$3,197,487,613
17.75
$2,208,055,756
25.70
$56,741,871
99.0%
98.3%
$56,899,846
$6,750,156
$65,038,825
$952,794
$65,991,619
$43,046,911
$21,216,972
$64,263,883
$2,746,236
$67,010,119
($1,018,500)
$0
$0
$3,746,890
$5,134,254
2016
17,098
2,731
Aa2
4.1%
0.1%
$3,155,246,251
18.22
$2,240,023,646
25.70
$57,482,464
99.2%
98.7%
$57,852,688
$6,560,717
$65,408,925
$0
$65,522,445
$44,101,873
$20,231,595
$64,333,468
$986,221
$65,319,689
$202,756
$0
$0
$4,946,691
$5,337,010
16,783
2,905
Aa1
6.6%
0.2%
2012
$3,119,479,688
16.59
$2,615,921,837
19.94
$51,739,800
99.2%
98.6%
$52,186,945
$6,795,024
$59,944,938
$0
$60,837,496
$39,846,302
$19,281,587
$59,127,889
$992,105
$60,119,994
$717,502
$0
$300,000
$6,045,628
Committed $390,319 $1,387,364
Nonspendable $0 $0 $0
$635,831
$5,109,797
$2,066,876
$0$0
$1,762,144
$4,390,610
Restricted
Assigned
Unassigned
$37,459,511
$4,273,857
$32,853,798
$3,943,835
Bonded Long-Term Debt
Annual Debt Service
$35,585,096
$4,755,814
$40,415,587
$4,581,039
$35,282,875
$4,456,398

BROOKLYN
Bond Rating (Moody's, as of July 1)
Population (State Dept. of Public Health)
Equalized Net Grand List
Equalized Mill Rate
Mill Rate
Total Revenues
Intergovernmental Revenues
Current Year Collection %
Total Expenditures
Education Expenditures
Unemployment (Annual Average)
School Enrollment (State Education Dept.)
TANF Recipients (As a % of Population)
Total Fund Balance (Deficit)
Total Expenditures and Other Financing Uses
Total Revenues and Other Financing Sources
Grand List Data
Property Tax Collection Data
Property Tax Revenues
Net Change In Fund Balance
FISCAL YEARS ENDED 2012 TO 2016
Operating Expenditures
Current Year Adjusted Tax Levy
Net Grand List
Economic Data
Operating Results - General Fund
Fund Balance - General Fund
Total Taxes Collected as a % of Total Outstanding
D - 19
Total Transfers In From Other Funds
Debt Measures
Total Transfers Out To Other Funds
2015
8,280
1,261
A1
7.9%
0.8%
2013
$688,058,184
17.84
$527,808,438
23.19
$12,277,485
97.9%
95.0%
$12,546,486
$9,758,964
$22,935,553
$0
$22,952,110
$17,370,720
$4,634,657
$22,005,377
$357,946
$22,363,323
$588,787
$37,135
$195,172
$2,320,403
$2,559,610
2014
8,254
1,239
A1
7.0%
0.8%
$736,109,247
16.85
$531,868,925
23.19
$12,402,823
98.5%
97.2%
$12,833,167
$9,903,495
$23,262,353
$0
$23,263,353
$18,141,251
$4,555,025
$22,696,276
$381,523
$23,077,799
$185,554
$32,351
$128,118
$2,745,164
8,259
1,206
6.0%
0.6%
$770,831,370
16.77
$549,699,585
23.43
$12,930,089
98.4%
97.3%
$12,930,611
$9,729,067
$23,172,093
$0
$23,180,351
$18,539,569
$4,599,409
$23,138,978
$918,937
$24,057,915
($877,564)
$32,351
$128,118
$1,701,695
$1,869,064
2016
8,205
1,225
5.1%
0.5%
$744,968,939
17.50
$554,246,087
23.43
$13,036,384
98.6%
97.8%
$13,216,352
$8,359,463
$22,169,123
$0
$22,169,123
$17,955,158
$4,366,910
$22,322,068
$939,485
$23,261,553
($1,092,430)
$32,351
$128,118
$604,129
$771,498
8,203
1,265
A1
8.6%
0.7%
2012
$699,341,455
16.74
$521,979,567
22.38
$11,708,068
97.4%
93.7%
$11,808,746
$9,690,564
$22,021,499
$0
$22,032,644
$16,973,810
$4,396,633
$21,370,443
$447,490
$21,817,933
$214,711
$24,886
$195,172
$1,970,823
Committed $0 $0
Nonspendable $6,900 $6,900 $6,900
$0
$1,743,865
$0
$6,900$6,900
$0
$2,577,795
Restricted
Assigned
Unassigned
$4,625,791
$5,079,506
$5,270,000
$5,391,938
Bonded Long-Term Debt
Annual Debt Service
$4,662,866
$2,889,756
$5,439,807
$3,816,410
$5,320,786
$4,677,440

BURLINGTON
Bond Rating (Moody's, as of July 1)
Population (State Dept. of Public Health)
Equalized Net Grand List
Equalized Mill Rate
Mill Rate
Total Revenues
Intergovernmental Revenues
Current Year Collection %
Total Expenditures
Education Expenditures
Unemployment (Annual Average)
School Enrollment (State Education Dept.)
TANF Recipients (As a % of Population)
Total Fund Balance (Deficit)
Total Expenditures and Other Financing Uses
Total Revenues and Other Financing Sources
Grand List Data
Property Tax Collection Data
Property Tax Revenues
Net Change In Fund Balance
FISCAL YEARS ENDED 2012 TO 2016
Operating Expenditures
Current Year Adjusted Tax Levy
Net Grand List
Economic Data
Operating Results - General Fund
Fund Balance - General Fund
Total Taxes Collected as a % of Total Outstanding
D - 20
Total Transfers In From Other Funds
Debt Measures
Total Transfers Out To Other Funds
2015
9,494
1,770
Aa2
5.5%
0.1%
2013
$1,242,699,537
20.23
$934,393,860
26.80
$25,137,190
99.0%
97.8%
$25,289,651
$4,948,503
$31,330,297
$97,339
$31,427,636
$22,848,392
$7,289,610
$30,138,002
$554,112
$30,692,114
$735,522
$0
$202,976
$4,793,278
$4,996,254
2014
9,576
1,721
Aa2
4.5%
0.1%
$1,268,897,485
20.55
$941,466,651
27.50
$26,079,669
99.1%
97.9%
$26,048,866
$5,028,255
$32,302,479
$116,181
$32,418,660
$23,328,178
$8,261,229
$31,589,407
$541,211
$32,130,618
$288,042
$0
$189,093
$5,284,296
9,623
1,675
Aa2
4.3%
0.1%
$1,265,127,719
21.05
$885,507,753
29.85
$26,632,546
99.0%
97.8%
$26,685,668
$6,043,674
$33,730,465
$261,456
$33,991,921
$23,670,355
$9,725,015
$33,395,370
$619,000
$34,014,370
($22,449)
$0
$150,000
$4,795,990
$5,261,847
2016
9,614
1,624
Aa2
4.1%
0.1%
$1,307,588,291
21.46
$899,396,283
31.10
$28,062,665
99.3%
98.4%
$28,289,694
$6,239,951
$35,810,524
$1,922,411
$37,732,935
$24,619,045
$11,545,249
$36,164,294
$984,909
$37,149,203
$583,732
$0
$977,019
$4,558,560
$5,845,579
9,434
1,779
Aa2
6.2%
0.1%
2012
$1,241,201,726
19.97
$922,464,098
26.75
$24,792,920
99.0%
97.7%
$25,093,092
$5,127,718
$31,441,626
$0
$31,441,626
$22,567,658
$8,187,836
$30,755,494
$70,729
$30,826,223
$615,403
$0
$210,436
$4,260,732
Committed $310,000 $315,857
Nonspendable $0 $0 $0
$0
$4,050,296
$0
$0$0
$635,050
$4,460,153
Restricted
Assigned
Unassigned
$16,269,454
$542,467
$15,810,082
$530,418
Bonded Long-Term Debt
Annual Debt Service
$19,146,122
$520,501
$17,650,230
$554,139
$14,642,726
$530,418

CANAAN
Bond Rating (Moody's, as of July 1)
Population (State Dept. of Public Health)
Equalized Net Grand List
Equalized Mill Rate
Mill Rate
Total Revenues
Intergovernmental Revenues
Current Year Collection %
Total Expenditures
Education Expenditures
Unemployment (Annual Average)
School Enrollment (State Education Dept.)
TANF Recipients (As a % of Population)
Total Fund Balance (Deficit)
Total Expenditures and Other Financing Uses
Total Revenues and Other Financing Sources
Grand List Data
Property Tax Collection Data
Property Tax Revenues
Net Change In Fund Balance
FISCAL YEARS ENDED 2012 TO 2016
Operating Expenditures
Current Year Adjusted Tax Levy
Net Grand List
Economic Data
Operating Results - General Fund
Fund Balance - General Fund
Total Taxes Collected as a % of Total Outstanding
D - 21
Total Transfers In From Other Funds
Debt Measures
Total Transfers Out To Other Funds
2015
1,214
117
7.2%
0.5%
2013
$218,423,818
17.71
$191,449,465
20.50
$3,867,998
98.2%
97.4%
$3,896,038
$687,482
$4,719,378
$5,000
$4,724,378
$3,244,772
$1,365,120
$4,609,892
$220,740
$4,830,632
($106,254)
$0
$243,323
$597,570
$845,894
2014
1,195
115
5.5%
0.7%
$242,972,236
15.04
$170,020,565
21.50
$3,654,308
98.2%
97.0%
$3,687,718
$802,830
$4,640,937
$8,124
$4,649,061
$3,040,647
$1,466,796
$4,507,443
$218,680
$4,726,123
($77,062)
$0
$323,668
$768,832
1,185
111
3.7%
0.5%
$220,795,158
17.56
$170,581,480
22.75
$3,876,752
97.3%
96.4%
$3,879,968
$860,748
$4,890,219
$32,000
$4,922,219
$3,216,778
$1,586,938
$4,803,716
$168,098
$4,971,814
($49,595)
$0
$103,354
$605,869
$719,237
2016
1,177
111
3.0%
0.3%
$242,191,014
16.72
$172,486,100
23.50
$4,049,996
98.1%
96.8%
$4,095,100
$852,229
$5,161,835
$0
$5,161,835
$3,111,571
$1,758,982
$4,870,553
$147,060
$5,017,613
$144,222
$0
$218,188
$632,745
$863,459
1,218
141
8.5%
0.8%
2012
$284,771,304
13.51
$188,188,760
20.50
$3,846,053
98.4%
97.4%
$3,877,400
$688,386
$4,723,354
$24,511
$4,747,865
$3,215,901
$1,396,342
$4,612,243
$108,615
$4,720,858
$27,007
$0
$276,364
$952,148
Committed $12,526 $10,014
Nonspendable $0 $0 $0
$2,500
$673,284
$5,001
$0$0
$33,819
$411,345
Restricted
Assigned
Unassigned
$853,521
$85,613
$3,079,099
$279,299
Bonded Long-Term Debt
Annual Debt Service
$902,890
$91,717
$1,047,250
$88,665
$3,013,262
$124,470

CANTERBURY
Bond Rating (Moody's, as of July 1)
Population (State Dept. of Public Health)
Equalized Net Grand List
Equalized Mill Rate
Mill Rate
Total Revenues
Intergovernmental Revenues
Current Year Collection %
Total Expenditures
Education Expenditures
Unemployment (Annual Average)
School Enrollment (State Education Dept.)
TANF Recipients (As a % of Population)
Total Fund Balance (Deficit)
Total Expenditures and Other Financing Uses
Total Revenues and Other Financing Sources
Grand List Data
Property Tax Collection Data
Property Tax Revenues
Net Change In Fund Balance
FISCAL YEARS ENDED 2012 TO 2016
Operating Expenditures
Current Year Adjusted Tax Levy
Net Grand List
Economic Data
Operating Results - General Fund
Fund Balance - General Fund
Total Taxes Collected as a % of Total Outstanding
D - 22
Total Transfers In From Other Funds
Debt Measures
Total Transfers Out To Other Funds
2015
5,096
704
7.6%
0.3%
2013
$453,811,453
17.93
$383,171,804
21.20
$8,139,019
97.5%
94.9%
$8,133,950
$6,686,359
$14,971,257
$420,624
$15,391,881
$12,149,799
$2,582,074
$14,731,873
$605,158
$15,337,031
$54,850
$10,010
$407,430
$1,838,188
$2,255,628
2014
5,088
660
6.6%
0.4%
$479,945,794
17.40
$383,275,877
21.70
$8,351,236
97.9%
95.8%
$8,579,715
$6,600,658
$15,466,083
$14,300
$15,480,383
$12,162,679
$2,880,138
$15,042,817
$291,493
$15,334,310
$146,073
$12,071
$358,386
$2,401,701
5,089
656
5.9%
0.5%
$497,660,449
16.89
$389,555,738
21.50
$8,407,618
98.2%
96.6%
$8,544,967
$6,430,703
$15,275,538
$3,366
$15,278,904
$12,296,025
$2,933,028
$15,229,053
$254,290
$15,483,343
($204,439)
$16,075
$559,233
$1,621,954
$2,197,262
2016
5,065
649
5.0%
0.3%
$519,471,944
16.45
$392,665,406
21.65
$8,547,776
98.9%
98.0%
$8,731,191
$6,097,579
$15,100,560
$0
$15,100,560
$12,129,756
$2,570,904
$14,700,660
$375,000
$15,075,660
$24,900
$33,377
$585,581
$1,595,217
$2,222,162
5,106
721
8.5%
0.4%
2012
$501,240,917
16.11
$380,008,455
21.20
$8,075,777
97.9%
96.0%
$8,246,561
$6,286,761
$14,711,118
$0
$14,711,118
$11,472,655
$2,549,969
$14,022,624
$1,153,551
$15,176,175
($465,057)
$27,703
$545,407
$2,200,778
Committed $7,987 $0
Nonspendable $0 $0 $0
$200,000
$1,427,668
$0
$0$0
$0
$2,031,244
Restricted
Assigned
Unassigned
$440,000
$77,206
$330,000
$71,981
Bonded Long-Term Debt
Annual Debt Service
$550,000
$82,432
$495,000
$79,819
$385,000
$74,594

CANTON
Bond Rating (Moody's, as of July 1)
Population (State Dept. of Public Health)
Equalized Net Grand List
Equalized Mill Rate
Mill Rate
Total Revenues
Intergovernmental Revenues
Current Year Collection %
Total Expenditures
Education Expenditures
Unemployment (Annual Average)
School Enrollment (State Education Dept.)
TANF Recipients (As a % of Population)
Total Fund Balance (Deficit)
Total Expenditures and Other Financing Uses
Total Revenues and Other Financing Sources
Grand List Data
Property Tax Collection Data
Property Tax Revenues
Net Change In Fund Balance
FISCAL YEARS ENDED 2012 TO 2016
Operating Expenditures
Current Year Adjusted Tax Levy
Net Grand List
Economic Data
Operating Results - General Fund
Fund Balance - General Fund
Total Taxes Collected as a % of Total Outstanding
D - 23
Total Transfers In From Other Funds
Debt Measures
Total Transfers Out To Other Funds
2015
10,357
1,776
Aa2
5.3%
0.1%
2013
$1,518,771,590
19.71
$1,130,952,090
26.42
$29,937,826
98.9%
97.1%
$30,135,693
$6,277,721
$37,164,314
$1,409
$37,165,723
$25,709,116
$10,040,170
$35,749,286
$1,580,479
$37,329,765
($164,042)
$0
$12,919
$5,106,180
$6,513,268
2014
10,345
1,727
Aa2
4.7%
0.1%
$1,540,795,085
19.86
$1,135,939,550
26.91
$30,598,767
98.9%
97.0%
$30,757,812
$6,557,094
$38,157,294
$43,693
$38,324,648
$26,705,326
$9,845,581
$36,550,907
$2,685,550
$39,236,457
($911,809)
$0
$7,349
$5,601,459
10,330
1,659
Aa2
3.9%
0.2%
$1,563,227,414
20.01
$1,094,095,940
28.56
$31,280,112
99.1%
97.4%
$31,733,732
$7,136,000
$39,703,562
$0
$39,841,047
$27,426,241
$10,058,355
$37,484,596
$2,306,750
$39,791,346
$49,701
$0
$12,500
$5,579,884
$5,651,160
2016
10,287
1,638
Aa2
3.6%
0.1%
$1,537,052,180
20.93
$1,100,809,533
29.19
$32,173,858
99.3%
98.2%
$32,330,018
$7,133,342
$40,205,463
$0
$40,205,463
$27,532,880
$10,415,174
$37,948,054
$1,808,533
$39,756,587
$448,876
$0
$165,121
$5,874,855
$6,100,036
10,351
1,772
Aa2
5.6%
0.1%
2012
$1,557,809,830
18.95
$1,121,224,936
26.28
$29,521,094
99.0%
97.0%
$29,773,217
$7,311,860
$38,058,514
$0
$38,058,514
$25,324,536
$10,466,665
$35,791,201
$1,001,321
$36,792,522
$1,265,992
$1,336,646
$315,286
$6,677,310
Committed $0 $0
Nonspendable $60,060 $58,776 $24,079
$0
$5,001,299
$1,336,636
$57,533$57,554
$0
$5,536,556
Restricted
Assigned
Unassigned
$14,298,994
$1,449,696
$17,636,365
$1,835,591
Bonded Long-Term Debt
Annual Debt Service
$10,538,331
$2,293,281
$8,559,346
$2,065,102
$18,915,722
$1,427,119

CHAPLIN
Bond Rating (Moody's, as of July 1)
Population (State Dept. of Public Health)
Equalized Net Grand List
Equalized Mill Rate
Mill Rate
Total Revenues
Intergovernmental Revenues
Current Year Collection %
Total Expenditures
Education Expenditures
Unemployment (Annual Average)
School Enrollment (State Education Dept.)
TANF Recipients (As a % of Population)
Total Fund Balance (Deficit)
Total Expenditures and Other Financing Uses
Total Revenues and Other Financing Sources
Grand List Data
Property Tax Collection Data
Property Tax Revenues
Net Change In Fund Balance
FISCAL YEARS ENDED 2012 TO 2016
Operating Expenditures
Current Year Adjusted Tax Levy
Net Grand List
Economic Data
Operating Results - General Fund
Fund Balance - General Fund
Total Taxes Collected as a % of Total Outstanding
D - 24
Total Transfers In From Other Funds
Debt Measures
Total Transfers Out To Other Funds
2015
2,276
299
7.1%
0.6%
2013
$213,098,562
24.43
$172,699,060
30.15
$5,205,533
98.0%
97.2%
$5,336,620
$2,611,637
$8,042,800
$9,918
$8,052,718
$5,931,939
$1,623,959
$7,555,898
$354,600
$7,910,498
$142,220
$31,286
$65,578
$1,108,402
$1,481,417
2014
2,262
304
6.6%
0.8%
$220,319,766
23.60
$171,883,425
30.15
$5,200,342
97.5%
96.9%
$5,228,720
$2,725,419
$7,990,607
$0
$7,990,607
$6,101,752
$1,917,797
$8,019,549
$368,490
$8,388,039
($397,432)
$44,126
$65,578
$1,083,985
2,255
292
6.1%
0.8%
$212,812,929
24.72
$148,895,840
35.05
$5,261,336
98.3%
97.6%
$5,337,826
$2,854,128
$8,333,534
$12,478
$8,346,012
$6,331,588
$1,743,946
$8,075,534
$293,502
$8,369,036
($23,024)
$48,044
$355,770
$655,996
$1,060,961
2016
2,246
288
5.4%
0.6%
$227,120,155
24.48
$157,184,170
35.05
$5,560,595
98.6%
98.0%
$5,599,463
$2,704,394
$8,407,336
$0
$8,407,336
$6,158,721
$1,734,150
$7,892,871
$571,528
$8,464,399
($57,063)
$67,191
$52,721
$797,377
$918,440
2,286
302
7.8%
0.7%
2012
$241,368,513
21.53
$172,251,937
30.15
$5,195,831
97.2%
96.5%
$5,194,116
$2,646,028
$7,925,420
$0
$7,925,420
$5,626,443
$1,526,914
$7,153,357
$356,811
$7,510,168
$415,252
$29,136
$800,578
$1,339,197
Committed $0 $0
Nonspendable $1,151 $1,151 $1,151
$0
$508,332
$275,000
$1,151$1,151
$0
$973,130
Restricted
Assigned
Unassigned
$141,213
$27,790
$98,775
$43,749
Bonded Long-Term Debt
Annual Debt Service
$180,122
$27,790
$161,130
$27,790
$120,682
$27,790

CHESHIRE
Bond Rating (Moody's, as of July 1)
Population (State Dept. of Public Health)
Equalized Net Grand List
Equalized Mill Rate
Mill Rate
Total Revenues
Intergovernmental Revenues
Current Year Collection %
Total Expenditures
Education Expenditures
Unemployment (Annual Average)
School Enrollment (State Education Dept.)
TANF Recipients (As a % of Population)
Total Fund Balance (Deficit)
Total Expenditures and Other Financing Uses
Total Revenues and Other Financing Sources
Grand List Data
Property Tax Collection Data
Property Tax Revenues
Net Change In Fund Balance
FISCAL YEARS ENDED 2012 TO 2016
Operating Expenditures
Current Year Adjusted Tax Levy
Net Grand List
Economic Data
Operating Results - General Fund
Fund Balance - General Fund
Total Taxes Collected as a % of Total Outstanding
D - 25
Total Transfers In From Other Funds
Debt Measures
Total Transfers Out To Other Funds
2015
29,150
4,655
Aa1
5.2%
0.1%
2013
$3,869,637,585
20.10
$2,863,684,660
27.23
$77,777,955
99.7%
99.6%
$78,167,540
$23,677,909
$105,019,133
$802,863
$106,080,340
$68,815,590
$35,630,248
$104,445,838
$1,000,000
$105,445,838
$634,502
$0
$2,559,828
$9,234,697
$12,392,161
2014
29,250
4,601
Aa1
4.5%
0.1%
$3,959,962,623
20.04
$2,881,617,644
27.60
$79,373,263
99.8%
99.7%
$79,722,309
$24,543,872
$107,166,756
$813,938
$118,203,684
$71,369,932
$36,027,664
$107,397,596
$950,000
$118,426,980
($223,296)
$0
$2,577,811
$12,168,865
29,262
4,528
Aa1
3.8%
0.1%
$3,859,984,363
21.14
$2,698,424,306
30.25
$81,616,162
99.8%
99.7%
$81,989,985
$25,852,837
$110,593,641
$754,013
$116,706,254
$74,575,158
$35,978,149
$110,553,307
$1,100,000
$116,925,506
($219,252)
$0
$2,503,625
$9,113,228
$11,949,613
2016
29,282
4,401
Aa1
3.5%
0.1%
$4,154,525,678
20.15
$2,726,793,817
30.69
$83,710,090
99.8%
99.7%
$83,973,691
$25,313,541
$112,704,206
$753,657
$119,892,943
$75,896,046
$36,637,632
$112,533,678
$1,185,000
$120,037,187
($144,244)
$0
$2,231,241
$9,397,574
$11,805,369
29,300
4,785
Aa1
5.5%
0.1%
2012
$4,000,682,851
18.99
$2,840,240,842
26.85
$75,961,009
99.6%
99.5%
$76,299,237
$23,993,678
$103,062,041
$803,652
$109,840,957
$67,408,514
$36,572,789
$103,981,303
$745,000
$110,589,387
($748,430)
$0
$2,219,557
$11,757,659
Committed $100,000 $250,000
Nonspendable $76,554 $82,760 $83,655
$600,000
$8,854,447
$500,000
$97,636$81,848
$500,000
$9,009,206
Restricted
Assigned
Unassigned
$63,752,792
$8,810,859
$67,885,078
$7,603,255
Bonded Long-Term Debt
Annual Debt Service
$57,172,608
$9,936,790
$60,862,861
$8,808,966
$72,341,466
$8,180,230

CHESTER
Bond Rating (Moody's, as of July 1)
Population (State Dept. of Public Health)
Equalized Net Grand List
Equalized Mill Rate
Mill Rate
Total Revenues
Intergovernmental Revenues
Current Year Collection %
Total Expenditures
Education Expenditures
Unemployment (Annual Average)
School Enrollment (State Education Dept.)
TANF Recipients (As a % of Population)
Total Fund Balance (Deficit)
Total Expenditures and Other Financing Uses
Total Revenues and Other Financing Sources
Grand List Data
Property Tax Collection Data
Property Tax Revenues
Net Change In Fund Balance
FISCAL YEARS ENDED 2012 TO 2016
Operating Expenditures
Current Year Adjusted Tax Levy
Net Grand List
Economic Data
Operating Results - General Fund
Fund Balance - General Fund
Total Taxes Collected as a % of Total Outstanding
D - 26
Total Transfers In From Other Funds
Debt Measures
Total Transfers Out To Other Funds
2015
4,343
513
Aa3
5.3%
0.1%
2013
$634,519,844
17.79
$502,446,675
22.45
$11,285,650
99.0%
98.5%
$11,408,340
$1,455,992
$13,182,052
$170,562
$13,352,614
$9,148,482
$3,257,836
$12,406,318
$527,497
$12,933,815
$418,799
$0
$33,961
$1,899,027
$1,932,988
2014
4,316
480
Aa3
4.6%
0.1%
$670,265,984
16.48
$501,227,540
21.95
$11,047,679
98.7%
97.9%
$11,037,684
$1,392,643
$12,832,691
$173,235
$13,005,926
$8,693,813
$3,469,758
$12,163,571
$745,026
$12,908,597
$97,329
$0
$46,293
$2,030,317
4,277
459
Aa3
3.9%
0.0%
$629,961,157
17.17
$440,646,140
24.82
$10,815,903
99.9%
98.8%
$10,848,239
$1,379,955
$12,560,273
$195,390
$12,755,663
$8,769,969
$3,639,220
$12,409,189
$361,270
$12,770,459
($14,796)
$0
$291,184
$1,724,338
$2,015,522
2016
4,255
443
Aa3
3.6%
0.0%
$609,028,103
18.21
$443,038,190
25.32
$11,090,749
98.8%
97.7%
$11,109,486
$1,394,270
$13,033,658
$65,275
$13,098,933
$8,819,133
$3,610,175
$12,429,308
$574,312
$13,003,620
$95,313
$0
$221,734
$1,889,100
$2,110,834
4,245
530
Aa3
5.6%
0.1%
2012
$686,977,349
16.08
$500,981,070
22.11
$11,049,827
99.1%
98.1%
$11,081,320
$1,215,200
$12,600,561
$153,544
$12,754,105
$9,115,305
$3,159,304
$12,274,609
$526,784
$12,801,393
($47,288)
$0
$174,641
$1,514,189
Committed $0 $0
Nonspendable $0 $0 $0
$0
$1,339,548
$0
$0$0
$0
$1,984,024
Restricted
Assigned
Unassigned
$4,601,097
$239,394
$3,459,011
$227,794
Bonded Long-Term Debt
Annual Debt Service
$6,212,031
$250,160
$5,558,100
$244,940
$4,023,375
$233,594

CLINTON
Bond Rating (Moody's, as of July 1)
Population (State Dept. of Public Health)
Equalized Net Grand List
Equalized Mill Rate
Mill Rate
Total Revenues
Intergovernmental Revenues
Current Year Collection %
Total Expenditures
Education Expenditures
Unemployment (Annual Average)
School Enrollment (State Education Dept.)
TANF Recipients (As a % of Population)
Total Fund Balance (Deficit)
Total Expenditures and Other Financing Uses
Total Revenues and Other Financing Sources
Grand List Data
Property Tax Collection Data
Property Tax Revenues
Net Change In Fund Balance
FISCAL YEARS ENDED 2012 TO 2016
Operating Expenditures
Current Year Adjusted Tax Levy
Net Grand List
Economic Data
Operating Results - General Fund
Fund Balance - General Fund
Total Taxes Collected as a % of Total Outstanding
D - 27
Total Transfers In From Other Funds
Debt Measures
Total Transfers Out To Other Funds
2015
13,180
2,034
Aa2
6.5%
0.3%
2013
$2,096,939,873
17.92
$1,496,831,086
25.18
$37,573,535
99.3%
98.1%
$37,634,261
$11,389,907
$50,047,900
$3,049
$50,050,949
$33,124,324
$15,537,874
$48,662,198
$1,845,686
$50,507,884
($456,935)
$0
$471,763
$7,169,418
$7,991,181
2014
13,129
2,016
Aa2
5.6%
0.3%
$2,143,157,440
17.80
$1,499,396,462
25.43
$38,153,083
99.1%
97.7%
$38,123,058
$11,757,984
$51,097,320
$0
$51,097,320
$34,066,239
$15,381,427
$49,447,666
$1,914,620
$51,362,286
($264,966)
$0
$363,622
$7,726,215
13,047
1,957
Aa2
4.8%
0.2%
$2,114,190,882
18.62
$1,505,495,363
26.27
$39,363,348
99.3%
97.9%
$39,563,337
$10,931,383
$51,449,628
$137,441
$51,587,069
$34,191,891
$15,994,418
$50,186,309
$1,952,030
$52,138,339
($551,270)
$0
$244,867
$6,511,826
$7,174,945
2016
12,961
1,863
Aa2
4.1%
0.2%
$2,136,348,483
18.83
$1,509,702,057
26.77
$40,224,220
99.3%
98.3%
$40,509,880
$11,393,179
$53,224,618
$45,597
$57,805,336
$35,148,514
$17,348,263
$52,496,777
$1,892,167
$58,199,673
($394,337)
$0
$239,252
$6,184,081
$6,780,608
13,196
2,057
Aa2
7.2%
0.3%
2012
$2,130,140,264
17.41
$1,490,408,085
24.92
$37,085,402
99.2%
98.2%
$37,169,019
$11,674,036
$49,723,025
$198,603
$49,921,628
$32,273,832
$15,874,050
$48,147,882
$1,940,571
$50,088,453
($166,825)
$0
$875,545
$8,448,116
Committed $350,000 $418,252
Nonspendable $7,275 $0 $47,560
$350,000
$7,175,011
$350,000
$0$0
$350,000
$7,012,593
Restricted
Assigned
Unassigned
$27,510,000
$2,158,999
$44,636,540
$3,026,526
Bonded Long-Term Debt
Annual Debt Service
$17,115,000
$2,025,662
$21,800,000
$1,936,987
$31,195,000
$2,445,630

COLCHESTER
Bond Rating (Moody's, as of July 1)
Population (State Dept. of Public Health)
Equalized Net Grand List
Equalized Mill Rate
Mill Rate
Total Revenues
Intergovernmental Revenues
Current Year Collection %
Total Expenditures
Education Expenditures
Unemployment (Annual Average)
School Enrollment (State Education Dept.)
TANF Recipients (As a % of Population)
Total Fund Balance (Deficit)
Total Expenditures and Other Financing Uses
Total Revenues and Other Financing Sources
Grand List Data
Property Tax Collection Data
Property Tax Revenues
Net Change In Fund Balance
FISCAL YEARS ENDED 2012 TO 2016
Operating Expenditures
Current Year Adjusted Tax Levy
Net Grand List
Economic Data
Operating Results - General Fund
Fund Balance - General Fund
Total Taxes Collected as a % of Total Outstanding
D - 28
Total Transfers In From Other Funds
Debt Measures
Total Transfers Out To Other Funds
2015
16,210
2,950
Aa3
6.3%
0.3%
2013
$1,681,198,817
20.32
$1,176,520,440
28.80
$34,157,365
98.4%
96.0%
$34,364,251
$19,347,462
$55,054,432
$0
$55,054,432
$41,828,767
$11,633,481
$53,462,248
$625,363
$54,087,611
$966,821
$0
$698,770
$4,758,733
$5,530,790
2014
16,192
2,847
Aa3
5.2%
0.4%
$1,713,186,821
21.10
$1,191,172,264
30.28
$36,156,049
98.4%
95.8%
$36,248,381
$19,727,811
$57,442,798
$0
$57,442,798
$43,879,506
$12,946,202
$56,825,708
$868,439
$57,694,147
($251,349)
$0
$250,730
$5,279,441
16,130
2,767
Aa3
4.5%
0.3%
$1,683,452,351
21.91
$1,195,815,175
30.57
$36,891,618
98.5%
96.2%
$37,226,671
$19,483,781
$58,053,271
$0
$58,053,271
$43,909,369
$12,645,270
$56,554,639
$1,053,867
$57,608,506
$444,765
$0
$370,685
$5,255,366
$5,724,206
2016
16,061
2,705
Aa3
4.1%
0.3%
$1,686,095,860
22.18
$1,201,873,865
30.76
$37,393,155
98.8%
97.0%
$37,712,051
$19,575,213
$58,880,023
$0
$58,880,023
$44,296,560
$12,344,063
$56,640,623
$1,292,550
$57,933,173
$946,850
$0
$502,848
$5,711,933
$6,671,056
16,187
3,063
Aa3
7.0%
0.3%
2012
$1,768,924,794
19.09
$1,297,297,874
25.85
$33,774,748
98.4%
96.0%
$33,794,551
$19,517,186
$54,641,781
$214,746
$54,856,527
$40,492,902
$12,831,923
$53,324,825
$583,058
$53,907,883
$948,644
$0
$176,476
$4,563,969
Committed $418,455 $67,500
Nonspendable $37,820 $30,655 $20,945
$32,000
$4,334,548
$44,936
$28,351$19,510
$120,829
$4,888,372
Restricted
Assigned
Unassigned
$16,278,738
$2,344,691
$12,628,171
$2,250,840
Bonded Long-Term Debt
Annual Debt Service
$15,905,000
$3,229,422
$17,645,534
$2,145,667
$14,448,121
$2,318,240

COLEBROOK
Bond Rating (Moody's, as of July 1)
Population (State Dept. of Public Health)
Equalized Net Grand List
Equalized Mill Rate
Mill Rate
Total Revenues
Intergovernmental Revenues
Current Year Collection %
Total Expenditures
Education Expenditures
Unemployment (Annual Average)
School Enrollment (State Education Dept.)
TANF Recipients (As a % of Population)
Total Fund Balance (Deficit)
Total Expenditures and Other Financing Uses
Total Revenues and Other Financing Sources
Grand List Data
Property Tax Collection Data
Property Tax Revenues
Net Change In Fund Balance
FISCAL YEARS ENDED 2012 TO 2016
Operating Expenditures
Current Year Adjusted Tax Levy
Net Grand List
Economic Data
Operating Results - General Fund
Fund Balance - General Fund
Total Taxes Collected as a % of Total Outstanding
D - 29
Total Transfers In From Other Funds
Debt Measures
Total Transfers Out To Other Funds
2015
1,457
221
4.9%
0.0%
2013
$243,345,406
20.23
$183,495,360
26.82
$4,923,843
98.3%
96.7%
$5,066,611
$907,870
$6,054,353
$0
$6,054,353
$3,719,089
$1,783,487
$5,502,576
$300,000
$5,802,576
$251,777
$0
$0
$1,209,117
$1,209,117
2014
1,445
216
5.3%
0.1%
$236,048,961
21.28
$184,993,030
27.10
$5,023,088
98.8%
97.2%
$5,068,981
$979,543
$6,104,784
$0
$6,104,784
$3,781,634
$1,754,911
$5,536,545
$400,000
$5,936,545
$168,239
$0
$0
$1,377,356
1,436
200
4.4%
0.1%
$238,852,754
21.83
$187,537,080
27.80
$5,215,130
97.8%
96.6%
$5,281,552
$1,026,933
$6,378,188
$0
$6,378,188
$3,931,647
$1,869,195
$5,800,842
$492,000
$6,292,842
$85,346
$0
$0
$1,462,702
$1,462,702
2016
1,430
195
4.5%
0.3%
$225,255,646
22.28
$184,066,533
27.80
$5,019,028
98.4%
97.1%
$4,832,333
$929,084
$5,877,067
$2,000
$5,879,067
$3,821,541
$1,794,181
$5,615,722
$450,000
$6,065,722
($186,655)
$0
$0
$1,276,047
$1,276,047
1,461
222
4.9%
0.0%
2012
$260,445,069
18.12
$182,139,408
26.00
$4,718,284
97.4%
95.2%
$4,706,046
$959,753
$5,713,466
$0
$5,713,466
$3,978,880
$1,637,742
$5,616,622
$190,400
$5,807,022
($93,556)
$0
$0
$957,340
Committed $0 $0
Nonspendable $0 $0 $0
$0
$957,340
$0
$0$0
$0
$1,377,356
Restricted
Assigned
Unassigned
$931,159
$73,375
$672,857
$69,125
Bonded Long-Term Debt
Annual Debt Service
$1,272,389
$89,626
$1,075,765
$94,350
$817,275
$71,250

COLUMBIA
Bond Rating (Moody's, as of July 1)
Population (State Dept. of Public Health)
Equalized Net Grand List
Equalized Mill Rate
Mill Rate
Total Revenues
Intergovernmental Revenues
Current Year Collection %
Total Expenditures
Education Expenditures
Unemployment (Annual Average)
School Enrollment (State Education Dept.)
TANF Recipients (As a % of Population)
Total Fund Balance (Deficit)
Total Expenditures and Other Financing Uses
Total Revenues and Other Financing Sources
Grand List Data
Property Tax Collection Data
Property Tax Revenues
Net Change In Fund Balance
FISCAL YEARS ENDED 2012 TO 2016
Operating Expenditures
Current Year Adjusted Tax Levy
Net Grand List
Economic Data
Operating Results - General Fund
Fund Balance - General Fund
Total Taxes Collected as a % of Total Outstanding
D - 30
Total Transfers In From Other Funds
Debt Measures
Total Transfers Out To Other Funds
2015
5,460
722
Aa2
6.1%
0.1%
2013
$662,497,596
19.02
$463,524,396
27.13
$12,599,969
98.9%
98.1%
$12,888,917
$4,064,965
$17,283,331
$15,598
$17,298,929
$12,036,200
$3,616,686
$15,652,886
$2,611,744
$18,264,630
($965,701)
$0
$49,000
$2,779,947
$2,828,947
2014
5,454
705
Aa2
5.3%
0.4%
$676,993,655
18.63
$463,992,644
27.13
$12,611,835
98.7%
98.0%
$12,656,992
$4,564,047
$17,523,472
$14,861
$17,538,333
$12,716,452
$3,673,899
$16,390,351
$962,657
$17,353,008
$185,325
$0
$17,500
$3,014,272
5,434
701
Aa2
4.8%
0.3%
$706,382,478
17.92
$466,098,071
27.13
$12,657,031
98.9%
98.3%
$12,686,875
$5,107,112
$18,123,451
$10,678
$18,134,129
$12,592,285
$3,714,231
$16,306,516
$1,123,341
$17,429,857
$704,272
$0
$230,648
$3,467,432
$3,718,544
2016
5,433
698
Aa2
4.1%
0.2%
$732,773,607
17.46
$471,633,257
27.13
$12,792,401
98.8%
98.0%
$12,871,153
$4,737,038
$17,979,505
$33,661
$18,013,166
$13,317,717
$3,558,129
$16,875,846
$1,109,346
$17,985,192
$27,974
$0
$400,000
$3,172,799
$3,609,955
5,461
738
Aa2
6.5%
0.2%
2012
$687,043,326
18.34
$534,100,530
23.55
$12,602,440
98.2%
96.8%
$12,589,812
$4,299,003
$17,204,283
$14,127
$17,218,410
$11,931,065
$3,815,682
$15,746,747
$764,127
$16,510,874
$707,536
$0
$0
$3,794,648
Committed $0 $0
Nonspendable $37,156 $20,464 $0
$0
$3,794,648
$0
$0$9,858
$0
$2,986,914
Restricted
Assigned
Unassigned
$1,503,911
$542,088
$799,177
$188,500
Bonded Long-Term Debt
Annual Debt Service
$2,250,000
$835,193
$1,785,000
$566,413
$999,032
$518,176

CORNWALL
Bond Rating (Moody's, as of July 1)
Population (State Dept. of Public Health)
Equalized Net Grand List
Equalized Mill Rate
Mill Rate
Total Revenues
Intergovernmental Revenues
Current Year Collection %
Total Expenditures
Education Expenditures
Unemployment (Annual Average)
School Enrollment (State Education Dept.)
TANF Recipients (As a % of Population)
Total Fund Balance (Deficit)
Total Expenditures and Other Financing Uses
Total Revenues and Other Financing Sources
Grand List Data
Property Tax Collection Data
Property Tax Revenues
Net Change In Fund Balance
FISCAL YEARS ENDED 2012 TO 2016
Operating Expenditures
Current Year Adjusted Tax Levy
Net Grand List
Economic Data
Operating Results - General Fund
Fund Balance - General Fund
Total Taxes Collected as a % of Total Outstanding
D - 31
Total Transfers In From Other Funds
Debt Measures
Total Transfers Out To Other Funds
2015
1,412
153
Aa2
5.6%
0.0%
2013
$558,229,843
10.23
$390,739,580
14.60
$5,713,031
98.5%
95.2%
$5,837,331
$1,005,494
$6,968,536
$0
$6,968,536
$4,283,594
$1,784,289
$6,067,883
$1,097,500
$7,165,383
($196,847)
$0
$279,621
$1,505,805
$1,785,426
2014
1,398
144
Aa2
3.7%
0.0%
$506,565,540
11.24
$393,024,930
14.50
$5,695,547
98.2%
94.7%
$5,732,848
$714,591
$6,524,676
$0
$6,524,676
$4,268,248
$1,866,659
$6,134,907
$220,000
$6,354,907
$169,769
$0
$470,008
$1,955,195
1,387
133
Aa2
3.4%
0.0%
$508,637,310
11.66
$397,536,310
14.90
$5,932,149
97.6%
93.2%
$5,893,224
$606,972
$6,560,878
$10,000
$6,570,878
$4,227,939
$1,912,493
$6,140,432
$463,025
$6,603,457
($32,579)
$0
$460,735
$1,449,442
$1,922,616
2016
1,380
128
Aa2
2.9%
0.0%
$487,020,993
12.52
$403,060,810
15.13
$6,095,638
97.9%
93.6%
$6,236,640
$676,544
$7,091,466
$4,154
$7,095,620
$4,320,167
$1,942,398
$6,262,565
$610,000
$6,872,565
$223,055
$0
$476,655
$1,661,032
$2,145,671
1,399
160
Aa2
5.6%
0.0%
2012
$510,908,379
11.14
$454,746,840
12.50
$5,689,537
98.6%
94.8%
$5,713,265
$1,049,616
$6,938,288
$2,256
$8,890,482
$4,096,802
$1,814,363
$5,911,165
$1,156,500
$8,902,665
($12,183)
$0
$478,024
$1,982,273
Committed $0 $0
Nonspendable $7,984 $12,439 $0
$0
$1,504,249
$0
$0$0
$0
$1,485,187
Restricted
Assigned
Unassigned
$2,235,533
$177,150
$1,726,424
$175,675
Bonded Long-Term Debt
Annual Debt Service
$2,252,202
$227,951
$2,420,435
$182,518
$1,915,407
$179,300

COVENTRY
Bond Rating (Moody's, as of July 1)
Population (State Dept. of Public Health)
Equalized Net Grand List
Equalized Mill Rate
Mill Rate
Total Revenues
Intergovernmental Revenues
Current Year Collection %
Total Expenditures
Education Expenditures
Unemployment (Annual Average)
School Enrollment (State Education Dept.)
TANF Recipients (As a % of Population)
Total Fund Balance (Deficit)
Total Expenditures and Other Financing Uses
Total Revenues and Other Financing Sources
Grand List Data
Property Tax Collection Data
Property Tax Revenues
Net Change In Fund Balance
FISCAL YEARS ENDED 2012 TO 2016
Operating Expenditures
Current Year Adjusted Tax Levy
Net Grand List
Economic Data
Operating Results - General Fund
Fund Balance - General Fund
Total Taxes Collected as a % of Total Outstanding
D - 32
Total Transfers In From Other Funds
Debt Measures
Total Transfers Out To Other Funds
2015
12,411
1,853
Aa3
6.2%
0.3%
2013
$1,323,175,982
20.16
$983,240,670
27.00
$26,677,398
98.1%
96.3%
$27,323,143
$12,829,292
$40,746,035
$692,028
$41,438,063
$28,131,806
$11,976,051
$40,107,857
$432,546
$40,540,403
$897,660
$40,054
$637,789
$3,666,097
$4,760,615
2014
12,419
1,820
Aa3
5.2%
0.3%
$1,353,205,676
20.56
$994,034,405
27.97
$27,821,385
98.3%
96.8%
$28,197,177
$13,186,656
$41,957,753
$689,167
$42,646,920
$29,631,593
$11,938,419
$41,570,012
$322,720
$41,892,732
$754,188
$37,845
$864,374
$5,514,803
12,438
1,777
Aa2
4.5%
0.3%
$1,377,873,593
20.77
$1,000,261,400
28.47
$28,619,285
98.2%
96.4%
$28,619,356
$12,421,409
$41,584,494
$598,135
$46,835,753
$29,541,973
$12,297,633
$41,839,606
$561,113
$46,954,345
($118,592)
$37,845
$683,244
$4,257,666
$5,396,211
2016
12,433
1,737
Aa2
4.0%
0.2%
$1,329,903,900
21.97
$930,610,730
31.20
$29,216,611
98.8%
98.0%
$29,733,732
$12,724,221
$43,067,464
$556,720
$43,624,184
$30,014,124
$12,029,465
$42,043,589
$978,212
$43,021,801
$602,383
$37,845
$728,280
$4,814,513
$5,998,594
12,425
1,889
Aa3
7.0%
0.3%
2012
$1,331,531,195
19.82
$969,387,403
27.00
$26,385,567
97.8%
95.5%
$26,509,011
$12,694,185
$39,759,918
$691,540
$40,451,458
$27,995,105
$11,292,429
$39,287,534
$365,432
$39,652,966
$798,492
$0
$621,768
$3,862,955
Committed $0 $0
Nonspendable $417,956 $417,456 $38,762
$2,363
$3,200,062
$2,363
$414,312$413,375
$0
$4,199,209
Restricted
Assigned
Unassigned
$20,612,645
$2,622,402
$20,086,314
$2,637,335
Bonded Long-Term Debt
Annual Debt Service
$23,984,608
$2,746,647
$21,987,589
$2,798,038
$18,622,014
$2,780,503

CROMWELL
Bond Rating (Moody's, as of July 1)
Population (State Dept. of Public Health)
Equalized Net Grand List
Equalized Mill Rate
Mill Rate
Total Revenues
Intergovernmental Revenues
Current Year Collection %
Total Expenditures
Education Expenditures
Unemployment (Annual Average)
School Enrollment (State Education Dept.)
TANF Recipients (As a % of Population)
Total Fund Balance (Deficit)
Total Expenditures and Other Financing Uses
Total Revenues and Other Financing Sources
Grand List Data
Property Tax Collection Data
Property Tax Revenues
Net Change In Fund Balance
FISCAL YEARS ENDED 2012 TO 2016
Operating Expenditures
Current Year Adjusted Tax Levy
Net Grand List
Economic Data
Operating Results - General Fund
Fund Balance - General Fund
Total Taxes Collected as a % of Total Outstanding
D - 33
Total Transfers In From Other Funds
Debt Measures
Total Transfers Out To Other Funds
2015
14,178
2,044
6.3%
0.3%
2013
$1,782,299,356
21.42
$1,410,488,569
27.06
$38,169,380
99.0%
97.0%
$38,277,712
$7,538,023
$47,410,342
$152,364
$58,568,754
$28,339,843
$17,268,190
$45,608,033
$382,024
$56,881,815
$1,686,939
$0
$15,434
$6,539,226
$6,605,660
2014
14,113
2,062
5.5%
0.3%
$1,794,452,347
21.60
$1,255,940,643
30.75
$38,757,802
99.2%
97.3%
$38,862,600
$7,973,832
$48,369,004
$511,224
$48,880,228
$29,649,940
$17,059,420
$46,709,360
$929,696
$47,639,056
$1,241,172
$0
$51,186
$7,846,832
14,034
2,100
4.8%
0.2%
$1,998,362,936
20.01
$1,271,368,432
31.18
$39,984,365
99.1%
98.7%
$39,967,103
$8,336,950
$49,786,802
$323,205
$50,110,007
$30,610,852
$18,031,573
$48,642,425
$527,521
$49,169,946
$940,061
$0
$50,402
$7,730,698
$8,786,893
2016
13,960
2,104
4.3%
0.2%
$1,881,010,741
21.72
$1,289,926,800
31.38
$40,850,410
99.1%
98.5%
$40,874,985
$7,919,803
$50,338,557
$536,486
$54,000,043
$31,204,449
$17,859,396
$49,063,845
$1,979,076
$54,125,999
($125,956)
$0
$24,536
$7,764,001
$8,660,937
14,217
2,035
6.8%
0.3%
2012
$1,905,273,841
19.59
$1,391,647,305
26.80
$37,316,375
99.1%
97.2%
$37,357,669
$7,379,711
$46,063,164
$476,966
$46,540,130
$28,116,330
$17,317,235
$45,433,565
$477,463
$45,911,028
$629,102
$0
$8,146
$4,918,721
Committed $872,400 $1,005,793
Nonspendable $0 $0 $5,758
$70,000
$4,834,817
$51,000
$0$0
$161,500
$7,634,146
Restricted
Assigned
Unassigned
$26,320,000
$3,266,877
$20,855,000
$3,760,638
Bonded Long-Term Debt
Annual Debt Service
$28,514,864
$3,908,438
$28,485,000
$4,623,521
$23,620,000
$3,724,114

DANBURY
Bond Rating (Moody's, as of July 1)
Population (State Dept. of Public Health)
Equalized Net Grand List
Equalized Mill Rate
Mill Rate
Total Revenues
Intergovernmental Revenues
Current Year Collection %
Total Expenditures
Education Expenditures
Unemployment (Annual Average)
School Enrollment (State Education Dept.)
TANF Recipients (As a % of Population)
Total Fund Balance (Deficit)
Total Expenditures and Other Financing Uses
Total Revenues and Other Financing Sources
Grand List Data
Property Tax Collection Data
Property Tax Revenues
Net Change In Fund Balance
FISCAL YEARS ENDED 2012 TO 2016
Operating Expenditures
Current Year Adjusted Tax Levy
Net Grand List
Economic Data
Operating Results - General Fund
Fund Balance - General Fund
Total Taxes Collected as a % of Total Outstanding
D - 34
Total Transfers In From Other Funds
Debt Measures
Total Transfers Out To Other Funds
2015
83,684
10,727
Aa1
6.1%
0.5%
2013
$9,161,036,487
19.24
$7,862,871,107
22.45
$176,286,931
98.5%
96.4%
$175,594,707
$45,650,430
$232,382,745
$1,224,665
$248,291,640
$130,444,875
$103,486,036
$233,930,911
$463,697
$248,119,894
$171,746
$0
$4,833,247
$22,157,381
$28,464,602
2014
83,784
10,577
Aa1
5.2%
0.4%
$9,754,447,760
18.71
$6,827,106,602
26.80
$182,473,765
98.3%
95.9%
$181,696,534
$46,161,761
$240,935,273
$0
$251,003,425
$135,882,098
$103,681,522
$239,563,620
$3,772,000
$250,613,705
$389,720
$0
$4,654,591
$28,854,322
84,657
10,687
Aa1
4.6%
0.3%
$10,106,162,713
18.70
$6,887,609,487
27.60
$188,954,885
98.5%
96.3%
$188,467,780
$48,767,079
$248,795,541
$925,000
$254,226,480
$141,957,467
$104,133,845
$246,091,312
$5,550,000
$251,641,312
$2,585,168
$11,735
$4,005,403
$23,065,200
$31,439,490
2016
84,992
10,871
Aa1
4.2%
0.3%
$10,072,276,173
19.50
$6,947,001,073
28.26
$196,409,119
98.7%
96.5%
$196,683,257
$47,213,313
$258,267,443
$6,167
$277,600,973
$144,825,555
$109,290,744
$254,116,299
$6,072,864
$276,051,234
$1,549,739
$0
$4,290,436
$28,646,378
$32,989,229
82,807
10,615
Aa1
6.8%
0.6%
2012
$9,696,064,958
17.35
$7,817,419,062
21.69
$168,271,128
98.7%
96.5%
$168,088,383
$47,293,595
$225,901,142
$245,814
$242,921,633
$129,949,781
$96,613,000
$226,562,781
$1,158,428
$242,822,322
$99,311
$0
$4,845,847
$28,292,856
Committed $0 $0
Nonspendable $52,415 $4,357,152 $597,231
$709,030
$22,140,748
$909,216
$564,758$42,062
$295,320
$23,862,349
Restricted
Assigned
Unassigned
$150,620,321
$16,730,060
$150,204,619
$23,898,041
Bonded Long-Term Debt
Annual Debt Service
$153,312,077
$15,791,843
$151,317,868
$16,942,045
$147,461,333
$15,065,126

DARIEN
Bond Rating (Moody's, as of July 1)
Population (State Dept. of Public Health)
Equalized Net Grand List
Equalized Mill Rate
Mill Rate
Total Revenues
Intergovernmental Revenues
Current Year Collection %
Total Expenditures
Education Expenditures
Unemployment (Annual Average)
School Enrollment (State Education Dept.)
TANF Recipients (As a % of Population)
Total Fund Balance (Deficit)
Total Expenditures and Other Financing Uses
Total Revenues and Other Financing Sources
Grand List Data
Property Tax Collection Data
Property Tax Revenues
Net Change In Fund Balance
FISCAL YEARS ENDED 2012 TO 2016
Operating Expenditures
Current Year Adjusted Tax Levy
Net Grand List
Economic Data
Operating Results - General Fund
Fund Balance - General Fund
Total Taxes Collected as a % of Total Outstanding
D - 35
Total Transfers In From Other Funds
Debt Measures
Total Transfers Out To Other Funds
2015
21,330
4,874
Aaa
6.1%
0.1%
2013
$11,544,162,952
9.67
$8,856,220,791
12.68
$111,676,352
99.5%
98.8%
$112,058,320
$13,371,459
$131,359,478
$649,934
$132,009,412
$90,216,733
$37,862,766
$128,079,499
$2,993,270
$131,072,769
$936,643
$0
$1,410,002
$17,404,398
$19,472,937
2014
21,689
4,931
Aaa
5.1%
0.1%
$12,451,401,017
9.35
$8,891,650,290
13.17
$116,477,451
99.3%
98.7%
$116,637,973
$14,737,968
$137,248,698
$637,593
$137,886,291
$96,322,274
$39,905,593
$136,227,867
$2,665,674
$138,893,541
($1,007,250)
$0
$1,408,502
$18,465,687
21,787
4,918
Aaa
4.3%
0.0%
$11,786,964,074
10.49
$8,250,643,822
15.01
$123,644,319
99.6%
99.3%
$124,755,330
$13,420,590
$144,364,868
$647,595
$163,032,438
$99,103,639
$41,738,563
$140,842,202
$3,741,955
$162,446,129
$586,309
$0
$1,970,677
$16,693,474
$19,051,996
2016
21,744
4,860
Aaa
4.1%
0.1%
$13,560,177,773
9.45
$8,356,198,215
15.35
$128,188,881
99.6%
99.3%
$128,492,997
$14,386,285
$149,248,923
$654,567
$158,199,253
$102,402,057
$41,514,251
$143,916,308
$4,960,910
$156,965,441
$1,233,812
$0
$1,645,899
$18,243,033
$20,285,808
21,114
4,835
Aaa
6.7%
0.0%
2012
$11,544,591,566
9.24
$8,795,413,483
12.20
$106,717,082
99.4%
98.5%
$106,517,751
$13,207,295
$124,826,191
$638,020
$125,464,211
$86,509,642
$36,741,888
$123,251,530
$1,405,575
$124,657,105
$807,106
$0
$930,449
$18,536,294
Committed $354,394 $355,973
Nonspendable $42,482 $31,872 $597,944
$0
$17,007,901
$0
$658,537$574,718
$0
$16,482,467
Restricted
Assigned
Unassigned
$86,912,708
$11,065,206
$71,566,369
$11,461,556
Bonded Long-Term Debt
Annual Debt Service
$99,005,273
$10,559,331
$89,434,453
$10,879,666
$77,430,020
$11,640,656

DEEP RIVER
Bond Rating (Moody's, as of July 1)
Population (State Dept. of Public Health)
Equalized Net Grand List
Equalized Mill Rate
Mill Rate
Total Revenues
Intergovernmental Revenues
Current Year Collection %
Total Expenditures
Education Expenditures
Unemployment (Annual Average)
School Enrollment (State Education Dept.)
TANF Recipients (As a % of Population)
Total Fund Balance (Deficit)
Total Expenditures and Other Financing Uses
Total Revenues and Other Financing Sources
Grand List Data
Property Tax Collection Data
Property Tax Revenues
Net Change In Fund Balance
FISCAL YEARS ENDED 2012 TO 2016
Operating Expenditures
Current Year Adjusted Tax Levy
Net Grand List
Economic Data
Operating Results - General Fund
Fund Balance - General Fund
Total Taxes Collected as a % of Total Outstanding
D - 36
Total Transfers In From Other Funds
Debt Measures
Total Transfers Out To Other Funds
2015
4,589
656
5.7%
0.2%
2013
$682,594,876
17.52
$482,257,259
24.68
$11,960,854
98.0%
97.1%
$11,959,196
$3,307,898
$15,833,187
$20,000
$15,853,187
$10,720,924
$5,310,581
$16,031,505
$0
$16,031,505
($178,318)
$0
$57,469
$87,847
$145,316
2014
4,571
645
5.2%
0.3%
$674,174,035
18.21
$488,069,153
25.08
$12,277,789
98.0%
96.7%
$12,310,468
$2,740,359
$15,709,837
$0
$16,399,841
$11,206,997
$5,163,105
$16,370,102
$0
$16,370,102
$29,739
$0
$60,259
$175,055
4,516
638
4.6%
0.1%
$668,852,470
19.10
$490,381,516
25.88
$12,773,007
98.4%
97.2%
$12,988,027
$2,819,743
$16,539,342
$0
$16,539,342
$11,549,813
$4,573,316
$16,123,129
$135,318
$16,258,447
$280,895
$0
$65,475
$390,475
$455,950
2016
4,482
624
3.8%
0.2%
$706,233,946
18.63
$499,546,159
26.28
$13,156,026
98.6%
97.6%
$13,229,459
$2,987,550
$17,233,872
$0
$17,233,872
$11,812,374
$4,958,101
$16,770,475
$186,062
$16,956,537
$277,335
$0
$71,413
$661,872
$733,285
4,603
648
6.1%
0.0%
2012
$684,869,066
17.02
$478,667,206
24.28
$11,658,655
98.6%
97.1%
$11,782,802
$2,928,640
$15,520,419
$208,112
$16,166,896
$10,717,646
$5,036,641
$15,754,287
$315,200
$16,069,487
$97,409
$0
$56,520
$323,634
Committed $0 $0
Nonspendable $0 $0 $0
$0
$267,114
$0
$0$0
$0
$114,796
Restricted
Assigned
Unassigned
$4,453,242
$358,386
$3,426,376
$171,633
Bonded Long-Term Debt
Annual Debt Service
$5,000,004
$102,758
$4,275,510
$192,324
$3,945,176
$281,226

DERBY
Bond Rating (Moody's, as of July 1)
Population (State Dept. of Public Health)
Equalized Net Grand List
Equalized Mill Rate
Mill Rate
Total Revenues
Intergovernmental Revenues
Current Year Collection %
Total Expenditures
Education Expenditures
Unemployment (Annual Average)
School Enrollment (State Education Dept.)
TANF Recipients (As a % of Population)
Total Fund Balance (Deficit)
Total Expenditures and Other Financing Uses
Total Revenues and Other Financing Sources
Grand List Data
Property Tax Collection Data
Property Tax Revenues
Net Change In Fund Balance
FISCAL YEARS ENDED 2012 TO 2016
Operating Expenditures
Current Year Adjusted Tax Levy
Net Grand List
Economic Data
Operating Results - General Fund
Fund Balance - General Fund
Total Taxes Collected as a % of Total Outstanding
D - 37
Total Transfers In From Other Funds
Debt Measures
Total Transfers Out To Other Funds
2015
12,801
1,613
Aa3
9.2%
1.1%
2013
$1,066,521,234
24.81
$745,348,974
35.50
$26,464,684
96.8%
93.3%
$26,452,229
$13,667,576
$42,672,131
$0
$42,672,131
$19,314,326
$22,516,516
$41,830,842
$490,643
$42,321,485
$350,646
$0
$0
$1,993,243
$1,993,243
2014
12,768
1,633
8.1%
1.0%
$943,469,618
27.57
$744,835,102
35.34
$26,011,029
96.8%
92.4%
$25,774,455
$13,542,428
$43,430,691
$0
$43,430,691
$20,697,007
$21,520,540
$42,217,547
$489,388
$42,706,935
$723,756
$0
$0
$2,716,999
12,700
1,588
7.0%
1.0%
$982,902,415
27.17
$748,399,081
35.74
$26,701,973
97.7%
95.3%
$27,801,813
$14,130,654
$44,200,265
$0
$44,200,265
$22,108,184
$22,265,635
$44,373,819
$442,875
$44,816,694
($616,429)
$0
$0
$2,100,570
$2,100,570
2016
12,631
1,545
6.4%
0.9%
$975,413,503
27.42
$748,833,439
35.74
$26,742,066
97.9%
95.9%
$27,125,675
$15,541,595
$45,897,112
$56,350
$59,096,046
$23,611,655
$23,764,864
$47,376,519
$8,680,000
$60,158,262
($1,062,216)
$0
$0
$1,038,354
$1,038,354
12,830
1,572
Aa3
9.8%
1.2%
2012
$1,091,576,401
23.31
$911,734,591
27.90
$25,449,328
96.6%
93.9%
$25,109,974
$11,842,416
$39,565,556
$0
$39,565,556
$18,898,160
$20,246,021
$39,144,181
$512,887
$39,657,068
($91,512)
$0
$0
$1,642,597
Committed $0 $0
Nonspendable $0 $0 $0
$0
$1,642,597
$0
$0$0
$0
$2,716,999
Restricted
Assigned
Unassigned
$8,346,950
$1,266,853
$14,919,251
$1,253,566
Bonded Long-Term Debt
Annual Debt Service
$10,103,867
$1,374,436
$9,287,209
$1,401,400
$7,211,265
$1,255,477

DURHAM
Bond Rating (Moody's, as of July 1)
Population (State Dept. of Public Health)
Equalized Net Grand List
Equalized Mill Rate
Mill Rate
Total Revenues
Intergovernmental Revenues
Current Year Collection %
Total Expenditures
Education Expenditures
Unemployment (Annual Average)
School Enrollment (State Education Dept.)
TANF Recipients (As a % of Population)
Total Fund Balance (Deficit)
Total Expenditures and Other Financing Uses
Total Revenues and Other Financing Sources
Grand List Data
Property Tax Collection Data
Property Tax Revenues
Net Change In Fund Balance
FISCAL YEARS ENDED 2012 TO 2016
Operating Expenditures
Current Year Adjusted Tax Levy
Net Grand List
Economic Data
Operating Results - General Fund
Fund Balance - General Fund
Total Taxes Collected as a % of Total Outstanding
D - 38
Total Transfers In From Other Funds
Debt Measures
Total Transfers Out To Other Funds
2015
7,361
1,304
5.3%
0.0%
2013
$1,028,249,575
22.91
$732,475,338
32.19
$23,556,829
98.7%
97.7%
$23,550,213
$4,575,747
$28,562,809
$476,181
$29,145,639
$22,540,262
$6,107,215
$28,647,477
$352,422
$28,999,899
$145,740
$0
$168,568
$1,898,716
$2,069,784
2014
7,348
1,241
4.7%
0.1%
$1,008,830,953
23.87
$737,429,530
32.66
$24,083,725
98.7%
97.8%
$24,299,267
$4,644,133
$29,334,002
$475,654
$29,809,656
$22,605,364
$5,917,485
$28,522,849
$794,200
$29,317,049
$492,607
$0
$237,489
$2,562,391
7,301
1,211
3.9%
0.1%
$1,011,318,899
24.40
$743,756,410
33.22
$24,675,940
98.9%
97.7%
$24,901,805
$4,577,582
$29,864,201
$291,582
$30,155,783
$22,854,758
$5,960,200
$28,814,958
$1,147,990
$29,962,948
$192,835
$0
$294,943
$2,457,783
$2,755,226
2016
7,255
1,152
3.5%
0.0%
$1,046,399,211
24.10
$747,833,507
33.74
$25,213,085
99.1%
98.4%
$25,756,035
$4,549,804
$30,733,291
$626,805
$31,498,993
$23,363,540
$6,446,822
$29,810,362
$744,311
$30,554,673
$944,320
$0
$430,623
$3,266,423
$3,699,546
7,368
1,340
5.8%
0.0%
2012
$1,039,135,069
21.29
$726,841,238
30.46
$22,120,933
98.8%
98.2%
$22,206,720
$4,672,489
$27,263,483
$225,110
$27,488,593
$21,677,624
$5,229,027
$26,906,651
$730,185
$27,636,836
($148,243)
$0
$213,246
$1,924,044
Committed $0 $0
Nonspendable $2,500 $2,500 $2,500
$0
$1,708,298
$0
$2,500$2,500
$0
$2,322,402
Restricted
Assigned
Unassigned
$7,378,735
$0
$6,057,722
$0
Bonded Long-Term Debt
Annual Debt Service
$9,738,651
$0
$8,674,706
$0
$6,191,486
$0

EAST GRANBY
Bond Rating (Moody's, as of July 1)
Population (State Dept. of Public Health)
Equalized Net Grand List
Equalized Mill Rate
Mill Rate
Total Revenues
Intergovernmental Revenues
Current Year Collection %
Total Expenditures
Education Expenditures
Unemployment (Annual Average)
School Enrollment (State Education Dept.)
TANF Recipients (As a % of Population)
Total Fund Balance (Deficit)
Total Expenditures and Other Financing Uses
Total Revenues and Other Financing Sources
Grand List Data
Property Tax Collection Data
Property Tax Revenues
Net Change In Fund Balance
FISCAL YEARS ENDED 2012 TO 2016
Operating Expenditures
Current Year Adjusted Tax Levy
Net Grand List
Economic Data
Operating Results - General Fund
Fund Balance - General Fund
Total Taxes Collected as a % of Total Outstanding
D - 39
Total Transfers In From Other Funds
Debt Measures
Total Transfers Out To Other Funds
2015
5,212
901
Aa2
5.5%
0.2%
2013
$764,970,437
20.52
$573,755,871
27.30
$15,697,821
98.4%
97.0%
$15,842,203
$2,895,160
$19,098,133
$0
$19,098,133
$13,829,200
$4,600,055
$18,429,255
$415,427
$18,844,682
$253,451
$0
$762,125
$2,673,779
$3,476,597
2014
5,212
921
Aa2
4.9%
0.1%
$804,101,890
20.79
$590,727,726
28.20
$16,715,258
98.9%
97.7%
$16,920,510
$2,864,532
$20,138,719
$0
$20,138,719
$14,282,030
$5,057,391
$19,339,421
$450,000
$19,789,421
$349,298
$0
$967,646
$3,825,895
5,199
923
Aa2
3.9%
0.1%
$819,268,267
21.05
$572,966,067
29.80
$17,243,323
98.5%
97.4%
$17,290,202
$2,977,079
$20,542,507
$0
$20,542,507
$15,013,695
$5,190,111
$20,203,806
$525,000
$20,728,806
($186,299)
$0
$939,735
$2,659,765
$3,639,596
2016
5,170
907
Aa2
3.9%
0.1%
$895,211,928
19.87
$581,485,097
30.40
$17,787,323
99.0%
97.9%
$17,954,915
$2,989,198
$21,213,635
$0
$21,213,635
$15,333,060
$5,174,583
$20,507,643
$550,000
$21,057,643
$155,992
$0
$749,671
$3,002,501
$3,795,588
5,184
890
Aa2
5.7%
0.2%
2012
$748,993,766
20.28
$561,917,917
27.00
$15,188,580
98.3%
96.7%
$15,222,621
$2,825,510
$18,347,775
$0
$18,347,775
$13,237,128
$4,511,708
$17,748,836
$387,556
$18,136,392
$211,383
$0
$563,815
$3,223,146
Committed $0 $0
Nonspendable $43,416 $40,096 $39,769
$0
$2,619,562
$0
$40,693$45,743
$0
$2,812,506
Restricted
Assigned
Unassigned
$6,800,000
$578,013
$5,788,048
$675,263
Bonded Long-Term Debt
Annual Debt Service
$7,200,000
$408,917
$7,200,000
$173,068
$6,275,000
$691,013

EAST HADDAM
Bond Rating (Moody's, as of July 1)
Population (State Dept. of Public Health)
Equalized Net Grand List
Equalized Mill Rate
Mill Rate
Total Revenues
Intergovernmental Revenues
Current Year Collection %
Total Expenditures
Education Expenditures
Unemployment (Annual Average)
School Enrollment (State Education Dept.)
TANF Recipients (As a % of Population)
Total Fund Balance (Deficit)
Total Expenditures and Other Financing Uses
Total Revenues and Other Financing Sources
Grand List Data
Property Tax Collection Data
Property Tax Revenues
Net Change In Fund Balance
FISCAL YEARS ENDED 2012 TO 2016
Operating Expenditures
Current Year Adjusted Tax Levy
Net Grand List
Economic Data
Operating Results - General Fund
Fund Balance - General Fund
Total Taxes Collected as a % of Total Outstanding
D - 40
Total Transfers In From Other Funds
Debt Measures
Total Transfers Out To Other Funds
2015
9,147
1,294
6.5%
0.1%
2013
$1,236,067,714
17.19
$988,069,591
21.52
$21,253,861
98.9%
98.1%
$21,408,513
$7,132,706
$29,415,368
$412,911
$29,828,279
$20,393,896
$9,236,643
$29,630,539
$1,350,524
$30,981,063
($1,152,784)
$0
$669,928
$4,010,730
$4,680,658
2014
9,127
1,230
5.8%
0.1%
$1,206,408,850
18.21
$843,905,515
26.01
$21,965,909
98.5%
97.7%
$22,029,161
$7,143,416
$30,189,033
$300,046
$30,489,079
$21,391,246
$8,463,152
$29,854,398
$893,835
$30,748,233
($259,154)
$0
$556,482
$4,421,504
9,081
1,180
5.0%
0.2%
$1,223,024,607
19.35
$848,584,530
27.90
$23,667,569
98.8%
98.0%
$23,870,943
$6,731,006
$31,489,916
$309,271
$31,799,187
$20,920,432
$8,972,219
$29,892,651
$1,583,224
$31,475,875
$323,312
$0
$276,601
$4,468,215
$4,744,816
2016
9,023
1,107
4.6%
0.2%
$1,205,467,439
20.32
$852,756,014
28.68
$24,498,985
98.9%
98.6%
$24,855,533
$6,679,889
$32,451,011
$319,257
$32,770,268
$21,557,488
$8,961,877
$30,519,365
$2,432,076
$32,951,441
($181,173)
$0
$411,480
$4,152,163
$4,563,643
9,158
1,303
7.0%
0.1%
2012
$1,313,702,461
15.74
$983,357,843
21.10
$20,680,064
98.9%
98.1%
$20,738,239
$7,001,530
$28,573,678
$799,596
$29,373,274
$20,323,325
$8,686,297
$29,009,622
$411,070
$29,420,692
($47,418)
$0
$1,716,211
$5,833,442
Committed $0 $0
Nonspendable $0 $0 $85,612
$19,629
$4,011,990
$0
$0$0
$0
$3,865,022
Restricted
Assigned
Unassigned
$18,059,351
$2,296,789
$15,530,000
$2,078,153
Bonded Long-Term Debt
Annual Debt Service
$18,548,705
$2,041,687
$17,271,528
$1,993,004
$16,737,174
$2,008,575
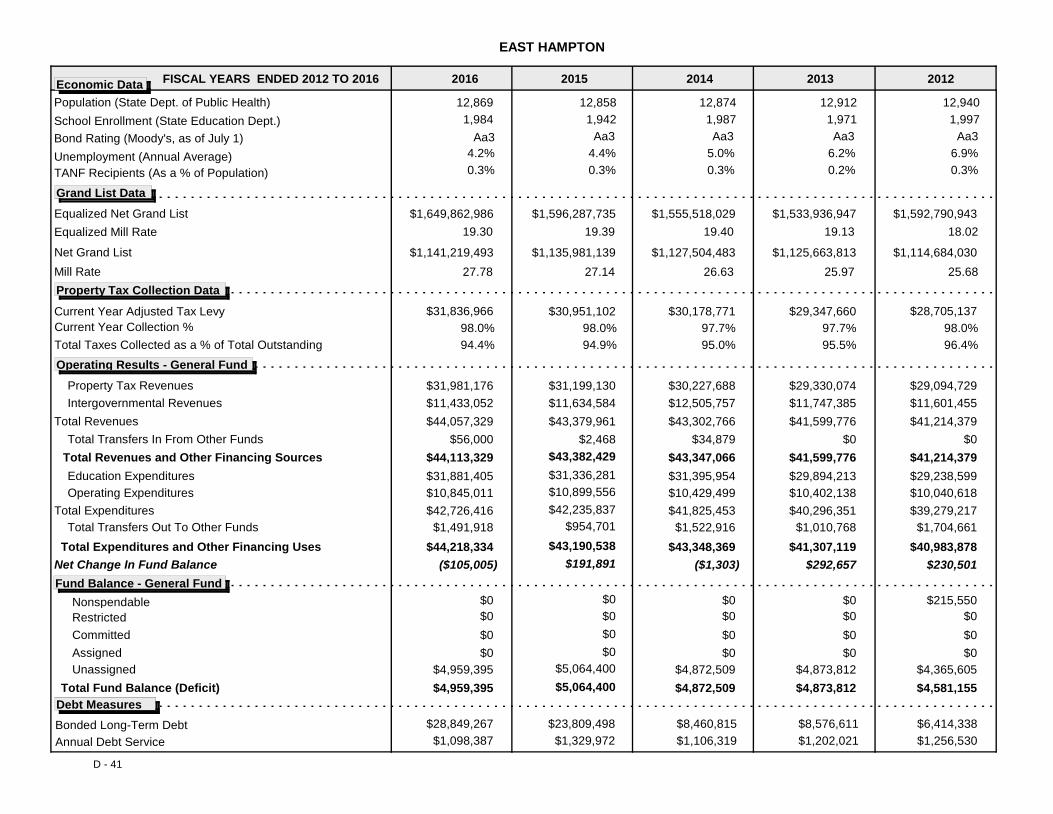
EAST HAMPTON
Bond Rating (Moody's, as of July 1)
Population (State Dept. of Public Health)
Equalized Net Grand List
Equalized Mill Rate
Mill Rate
Total Revenues
Intergovernmental Revenues
Current Year Collection %
Total Expenditures
Education Expenditures
Unemployment (Annual Average)
School Enrollment (State Education Dept.)
TANF Recipients (As a % of Population)
Total Fund Balance (Deficit)
Total Expenditures and Other Financing Uses
Total Revenues and Other Financing Sources
Grand List Data
Property Tax Collection Data
Property Tax Revenues
Net Change In Fund Balance
FISCAL YEARS ENDED 2012 TO 2016
Operating Expenditures
Current Year Adjusted Tax Levy
Net Grand List
Economic Data
Operating Results - General Fund
Fund Balance - General Fund
Total Taxes Collected as a % of Total Outstanding
D - 41
Total Transfers In From Other Funds
Debt Measures
Total Transfers Out To Other Funds
2015
12,912
1,971
Aa3
6.2%
0.2%
2013
$1,533,936,947
19.13
$1,125,663,813
25.97
$29,347,660
97.7%
95.5%
$29,330,074
$11,747,385
$41,599,776
$0
$41,599,776
$29,894,213
$10,402,138
$40,296,351
$1,010,768
$41,307,119
$292,657
$0
$0
$4,873,812
$4,873,812
2014
12,874
1,987
Aa3
5.0%
0.3%
$1,555,518,029
19.40
$1,127,504,483
26.63
$30,178,771
97.7%
95.0%
$30,227,688
$12,505,757
$43,302,766
$34,879
$43,347,066
$31,395,954
$10,429,499
$41,825,453
$1,522,916
$43,348,369
($1,303)
$0
$0
$4,872,509
12,858
1,942
Aa3
4.4%
0.3%
$1,596,287,735
19.39
$1,135,981,139
27.14
$30,951,102
98.0%
94.9%
$31,199,130
$11,634,584
$43,379,961
$2,468
$43,382,429
$31,336,281
$10,899,556
$42,235,837
$954,701
$43,190,538
$191,891
$0
$0
$5,064,400
$5,064,400
2016
12,869
1,984
Aa3
4.2%
0.3%
$1,649,862,986
19.30
$1,141,219,493
27.78
$31,836,966
98.0%
94.4%
$31,981,176
$11,433,052
$44,057,329
$56,000
$44,113,329
$31,881,405
$10,845,011
$42,726,416
$1,491,918
$44,218,334
($105,005)
$0
$0
$4,959,395
$4,959,395
12,940
1,997
Aa3
6.9%
0.3%
2012
$1,592,790,943
18.02
$1,114,684,030
25.68
$28,705,137
98.0%
96.4%
$29,094,729
$11,601,455
$41,214,379
$0
$41,214,379
$29,238,599
$10,040,618
$39,279,217
$1,704,661
$40,983,878
$230,501
$0
$0
$4,581,155
Committed $0 $0
Nonspendable $0 $0 $215,550
$0
$4,365,605
$0
$0$0
$0
$4,872,509
Restricted
Assigned
Unassigned
$8,460,815
$1,106,319
$28,849,267
$1,098,387
Bonded Long-Term Debt
Annual Debt Service
$6,414,338
$1,256,530
$8,576,611
$1,202,021
$23,809,498
$1,329,972

EAST HARTFORD
Bond Rating (Moody's, as of July 1)
Population (State Dept. of Public Health)
Equalized Net Grand List
Equalized Mill Rate
Mill Rate
Total Revenues
Intergovernmental Revenues
Current Year Collection %
Total Expenditures
Education Expenditures
Unemployment (Annual Average)
School Enrollment (State Education Dept.)
TANF Recipients (As a % of Population)
Total Fund Balance (Deficit)
Total Expenditures and Other Financing Uses
Total Revenues and Other Financing Sources
Grand List Data
Property Tax Collection Data
Property Tax Revenues
Net Change In Fund Balance
FISCAL YEARS ENDED 2012 TO 2016
Operating Expenditures
Current Year Adjusted Tax Levy
Net Grand List
Economic Data
Operating Results - General Fund
Fund Balance - General Fund
Total Taxes Collected as a % of Total Outstanding
D - 42
Total Transfers In From Other Funds
Debt Measures
Total Transfers Out To Other Funds
2015
51,199
8,035
Aa2
10.0%
1.8%
2013
$3,849,203,343
29.92
$2,692,719,154
42.79
$115,155,000
97.1%
95.7%
$115,890,000
$59,947,000
$184,846,000
$512,000
$198,664,000
$100,759,000
$83,467,000
$184,226,000
$1,835,000
$199,249,000
($585,000)
$0
$1,338,000
$13,288,000
$14,626,000
2014
51,033
8,165
Aa2
8.5%
1.9%
$3,936,906,558
29.82
$2,688,831,662
43.90
$117,379,000
97.9%
97.0%
$118,022,000
$63,834,000
$191,742,000
$661,000
$192,403,000
$107,307,000
$84,049,000
$191,356,000
$1,080,000
$192,436,000
($33,000)
$0
$626,000
$14,593,000
50,821
8,161
Aa2
7.4%
1.7%
$3,829,879,530
31.66
$2,687,876,591
45.40
$121,245,000
97.6%
96.6%
$122,150,000
$64,424,000
$197,069,000
$725,000
$197,794,000
$103,700,000
$90,719,000
$194,419,000
$1,672,000
$196,091,000
$1,703,000
$0
$583,000
$15,713,000
$16,296,000
2016
50,237
8,092
Aa2
6.6%
1.5%
$3,798,403,109
32.75
$2,689,464,641
45.86
$124,388,000
97.3%
96.4%
$124,808,000
$66,149,000
$202,305,000
$945,000
$203,250,000
$106,475,000
$94,089,000
$200,564,000
$1,709,000
$202,273,000
$977,000
$0
$961,000
$16,312,000
$17,273,000
51,272
8,142
Aa2
10.7%
1.9%
2012
$3,966,619,309
26.73
$3,092,116,582
34.42
$106,016,000
97.3%
95.8%
$107,495,000
$60,641,000
$178,618,000
$506,000
$184,597,000
$97,696,000
$79,000,000
$176,696,000
$797,000
$182,904,000
$1,693,000
$0
$1,257,000
$15,211,000
Committed $0 $0
Nonspendable $0 $0 $0
$0
$13,954,000
$0
$0$0
$0
$13,967,000
Restricted
Assigned
Unassigned
$66,272,000
$10,283,000
$58,167,000
$10,871,000
Bonded Long-Term Debt
Annual Debt Service
$60,368,000
$9,758,000
$53,495,000
$10,162,000
$61,790,000
$10,637,000

EAST HAVEN
Bond Rating (Moody's, as of July 1)
Population (State Dept. of Public Health)
Equalized Net Grand List
Equalized Mill Rate
Mill Rate
Total Revenues
Intergovernmental Revenues
Current Year Collection %
Total Expenditures
Education Expenditures
Unemployment (Annual Average)
School Enrollment (State Education Dept.)
TANF Recipients (As a % of Population)
Total Fund Balance (Deficit)
Total Expenditures and Other Financing Uses
Total Revenues and Other Financing Sources
Grand List Data
Property Tax Collection Data
Property Tax Revenues
Net Change In Fund Balance
FISCAL YEARS ENDED 2012 TO 2016
Operating Expenditures
Current Year Adjusted Tax Levy
Net Grand List
Economic Data
Operating Results - General Fund
Fund Balance - General Fund
Total Taxes Collected as a % of Total Outstanding
D - 43
Total Transfers In From Other Funds
Debt Measures
Total Transfers Out To Other Funds
2015
29,121
3,641
A3
8.8%
0.8%
2013
$2,818,987,196
21.51
$1,970,326,497
30.95
$60,631,831
97.6%
94.7%
$61,664,960
$26,362,443
$90,443,557
$0
$90,443,557
$48,455,006
$40,824,671
$89,279,677
$1,273
$89,280,950
$1,162,607
$0
$0
$1,600,450
$1,600,450
2014
29,044
3,477
A3
7.5%
0.9%
$2,578,578,931
23.54
$1,974,186,731
30.95
$60,695,731
97.7%
95.0%
$62,439,118
$26,530,783
$91,610,030
$0
$91,610,030
$50,428,317
$40,229,283
$90,657,600
$904
$90,658,504
$951,526
$0
$0
$2,551,976
28,935
3,376
A3
6.4%
0.8%
$2,495,667,862
25.20
$1,975,351,052
32.05
$62,880,229
97.7%
95.0%
$64,161,304
$25,756,092
$92,699,361
$61,290
$92,760,651
$50,447,708
$41,014,081
$91,461,789
$0
$91,461,789
$1,298,862
$0
$0
$3,850,838
$3,850,838
2016
28,807
3,414
A3
5.7%
0.8%
$2,668,818,625
23.62
$1,995,443,160
31.55
$63,039,498
97.9%
94.9%
$64,114,541
$26,073,319
$93,175,378
$25,015
$93,200,393
$52,743,757
$39,322,760
$92,066,517
$0
$92,066,517
$1,133,876
$0
$0
$4,984,714
$4,984,714
29,190
3,674
A3
9.5%
0.8%
2012
$2,805,476,865
21.41
$2,261,591,957
26.59
$60,056,771
97.3%
94.6%
$60,386,012
$26,415,418
$89,353,313
$12,969
$89,366,282
$48,339,563
$40,789,676
$89,129,239
$0
$89,129,239
$237,043
$0
$0
$437,843
Committed $0 $0
Nonspendable $0 $0 $0
$0
$437,843
$0
$0$0
$0
$2,551,976
Restricted
Assigned
Unassigned
$37,984,230
$7,572,158
$26,845,958
$5,816,578
Bonded Long-Term Debt
Annual Debt Service
$44,957,321
$7,424,638
$41,941,360
$7,516,499
$31,380,311
$7,327,128

EAST LYME
Bond Rating (Moody's, as of July 1)
Population (State Dept. of Public Health)
Equalized Net Grand List
Equalized Mill Rate
Mill Rate
Total Revenues
Intergovernmental Revenues
Current Year Collection %
Total Expenditures
Education Expenditures
Unemployment (Annual Average)
School Enrollment (State Education Dept.)
TANF Recipients (As a % of Population)
Total Fund Balance (Deficit)
Total Expenditures and Other Financing Uses
Total Revenues and Other Financing Sources
Grand List Data
Property Tax Collection Data
Property Tax Revenues
Net Change In Fund Balance
FISCAL YEARS ENDED 2012 TO 2016
Operating Expenditures
Current Year Adjusted Tax Levy
Net Grand List
Economic Data
Operating Results - General Fund
Fund Balance - General Fund
Total Taxes Collected as a % of Total Outstanding
D - 44
Total Transfers In From Other Funds
Debt Measures
Total Transfers Out To Other Funds
2015
18,937
2,735
Aa2
7.0%
0.2%
2013
$2,925,132,153
15.84
$2,046,376,158
22.78
$46,344,139
98.5%
97.0%
$46,487,710
$13,148,147
$66,155,415
$1,687,976
$67,843,391
$46,632,038
$20,722,784
$67,354,822
$199,195
$67,554,017
$289,374
$0
$1,325,242
$4,925,156
$6,250,398
2014
19,140
2,690
Aa2
5.9%
0.3%
$2,932,491,385
16.27
$2,050,119,208
23.35
$47,723,345
98.4%
96.5%
$47,820,460
$14,329,374
$68,698,564
$1,040,728
$69,739,292
$48,126,767
$21,176,150
$69,302,917
$276,000
$69,578,917
$160,375
$0
$1,582,908
$6,410,773
19,343
2,648
Aa2
5.2%
0.2%
$2,948,988,218
16.80
$2,061,949,264
24.03
$49,542,790
98.5%
96.8%
$49,782,485
$14,231,113
$71,100,600
$852,464
$78,670,730
$49,709,355
$23,446,069
$73,155,424
$189,000
$79,061,133
($390,403)
$0
$836,994
$5,183,376
$6,020,370
2016
18,886
2,616
Aa2
4.6%
0.1%
$3,067,459,765
16.85
$2,086,779,308
24.71
$51,695,402
98.9%
97.1%
$51,942,736
$14,377,198
$72,897,907
$852,464
$74,520,100
$50,487,799
$23,828,976
$74,316,775
$329,800
$74,646,575
($126,475)
$0
$744,511
$5,149,384
$5,893,895
18,892
2,784
Aa2
7.9%
0.2%
2012
$3,019,753,443
14.94
$2,329,404,814
19.47
$45,122,627
98.4%
97.2%
$45,043,599
$13,081,658
$64,412,658
$1,944,469
$74,156,965
$45,459,821
$20,359,857
$65,819,678
$52,480
$73,550,906
$606,059
$0
$1,145,261
$5,961,024
Committed $0 $0
Nonspendable $0 $0 $0
$0
$4,815,763
$0
$0$0
$0
$4,827,865
Restricted
Assigned
Unassigned
$52,802,003
$5,276,364
$52,494,603
$8,385,735
Bonded Long-Term Debt
Annual Debt Service
$48,135,787
$6,107,004
$47,016,174
$12,220,780
$52,957,614
$5,518,409

EAST WINDSOR
Bond Rating (Moody's, as of July 1)
Population (State Dept. of Public Health)
Equalized Net Grand List
Equalized Mill Rate
Mill Rate
Total Revenues
Intergovernmental Revenues
Current Year Collection %
Total Expenditures
Education Expenditures
Unemployment (Annual Average)
School Enrollment (State Education Dept.)
TANF Recipients (As a % of Population)
Total Fund Balance (Deficit)
Total Expenditures and Other Financing Uses
Total Revenues and Other Financing Sources
Grand List Data
Property Tax Collection Data
Property Tax Revenues
Net Change In Fund Balance
FISCAL YEARS ENDED 2012 TO 2016
Operating Expenditures
Current Year Adjusted Tax Levy
Net Grand List
Economic Data
Operating Results - General Fund
Fund Balance - General Fund
Total Taxes Collected as a % of Total Outstanding
D - 45
Total Transfers In From Other Funds
Debt Measures
Total Transfers Out To Other Funds
2015
11,406
1,364
Aa2
8.0%
0.4%
2013
$1,313,333,289
20.61
$1,091,167,948
24.73
$27,063,848
97.9%
95.1%
$27,489,393
$8,842,174
$36,833,211
$0
$36,833,211
$22,517,698
$12,948,767
$35,466,465
$610,820
$36,077,285
$755,926
$0
$412,699
$5,853,623
$6,272,482
2014
11,423
1,305
Aa2
6.7%
0.4%
$1,330,898,946
20.93
$929,988,582
29.78
$27,856,236
97.8%
95.2%
$28,008,686
$8,810,002
$37,367,493
$324,447
$40,494,359
$23,072,375
$13,059,834
$36,132,209
$425,765
$39,315,489
$1,178,870
$0
$357,254
$7,451,352
11,400
1,257
Aa2
5.8%
0.6%
$1,382,146,356
20.58
$952,292,210
29.78
$28,444,386
98.6%
96.2%
$28,868,977
$8,983,491
$38,402,305
$0
$38,402,305
$23,299,723
$12,944,974
$36,244,697
$918,341
$37,163,038
$1,239,267
$0
$1,057,517
$7,633,103
$8,690,620
2016
11,355
1,203
Aa2
5.4%
0.4%
$1,390,247,741
20.94
$951,587,151
30.31
$29,107,370
98.8%
96.4%
$29,484,942
$8,686,073
$38,819,780
$29,772
$38,849,552
$24,287,205
$13,257,327
$37,544,532
$801,000
$38,345,532
$504,020
$0
$895,256
$7,995,983
$9,194,640
11,387
1,369
Aa2
8.7%
0.5%
2012
$1,404,317,112
18.81
$1,081,994,877
24.38
$26,420,692
97.6%
94.6%
$26,659,418
$8,420,974
$36,119,471
$0
$36,119,471
$21,503,161
$12,551,729
$34,054,890
$483,884
$34,538,774
$1,580,697
$0
$320,980
$5,516,556
Committed $303,401 $0
Nonspendable $0 $0 $0
$6,160
$5,189,416
$6,160
$0$0
$0
$7,094,098
Restricted
Assigned
Unassigned
$5,881,867
$1,490,619
$6,357,667
$1,063,396
Bonded Long-Term Debt
Annual Debt Service
$8,262,457
$1,714,118
$7,102,960
$1,396,258
$7,199,323
$1,150,055

EASTFORD
Bond Rating (Moody's, as of July 1)
Population (State Dept. of Public Health)
Equalized Net Grand List
Equalized Mill Rate
Mill Rate
Total Revenues
Intergovernmental Revenues
Current Year Collection %
Total Expenditures
Education Expenditures
Unemployment (Annual Average)
School Enrollment (State Education Dept.)
TANF Recipients (As a % of Population)
Total Fund Balance (Deficit)
Total Expenditures and Other Financing Uses
Total Revenues and Other Financing Sources
Grand List Data
Property Tax Collection Data
Property Tax Revenues
Net Change In Fund Balance
FISCAL YEARS ENDED 2012 TO 2016
Operating Expenditures
Current Year Adjusted Tax Levy
Net Grand List
Economic Data
Operating Results - General Fund
Fund Balance - General Fund
Total Taxes Collected as a % of Total Outstanding
D - 46
Total Transfers In From Other Funds
Debt Measures
Total Transfers Out To Other Funds
2015
1,736
218
6.4%
0.0%
2013
$185,964,069
18.86
$162,723,350
21.50
$3,506,535
97.2%
95.6%
$3,485,224
$1,614,493
$5,192,794
$23,873
$5,467,403
$3,864,869
$1,320,731
$5,185,600
$26,000
$5,211,600
$255,803
$523
$109,643
$1,245,117
$1,355,283
2014
1,734
204
5.6%
0.2%
$217,697,015
16.26
$164,465,448
21.50
$3,539,863
97.0%
94.9%
$3,558,815
$1,691,351
$5,328,682
$168,676
$5,497,358
$3,854,354
$1,182,440
$5,036,794
$14,000
$5,050,794
$446,564
$173
$105,269
$1,806,032
1,750
189
3.9%
0.1%
$201,866,589
17.38
$141,272,662
24.80
$3,507,577
97.9%
96.2%
$3,547,935
$1,747,378
$5,400,501
$9,458
$5,409,959
$3,946,713
$1,154,803
$5,101,516
$93,000
$5,194,516
$215,443
$297
$105,269
$1,511,551
$1,917,117
2016
1,750
179
3.6%
0.1%
$194,982,983
18.26
$141,728,950
25.11
$3,559,423
97.9%
96.4%
$3,575,250
$1,717,920
$5,443,372
$0
$5,443,372
$3,987,911
$1,239,110
$5,227,021
$430,000
$5,657,021
($213,649)
$1,109
$52,028
$1,318,406
$1,808,737
1,730
234
6.4%
0.1%
2012
$173,430,595
19.88
$161,986,262
21.25
$3,448,238
97.5%
96.6%
$3,464,512
$1,655,934
$5,239,756
$2,323
$5,433,354
$3,756,017
$1,172,987
$4,929,004
$421,445
$5,350,449
$82,905
$680
$51,891
$1,099,480
Committed $437,194 $300,000
Nonspendable $0 $0 $0
$0
$1,046,909
$0
$0$0
$300,000
$1,400,590
Restricted
Assigned
Unassigned
$275,008
$58,063
$153,054
$97,261
Bonded Long-Term Debt
Annual Debt Service
$157,346
$58,609
$333,111
$58,063
$215,008
$58,063

EASTON
Bond Rating (Moody's, as of July 1)
Population (State Dept. of Public Health)
Equalized Net Grand List
Equalized Mill Rate
Mill Rate
Total Revenues
Intergovernmental Revenues
Current Year Collection %
Total Expenditures
Education Expenditures
Unemployment (Annual Average)
School Enrollment (State Education Dept.)
TANF Recipients (As a % of Population)
Total Fund Balance (Deficit)
Total Expenditures and Other Financing Uses
Total Revenues and Other Financing Sources
Grand List Data
Property Tax Collection Data
Property Tax Revenues
Net Change In Fund Balance
FISCAL YEARS ENDED 2012 TO 2016
Operating Expenditures
Current Year Adjusted Tax Levy
Net Grand List
Economic Data
Operating Results - General Fund
Fund Balance - General Fund
Total Taxes Collected as a % of Total Outstanding
D - 47
Total Transfers In From Other Funds
Debt Measures
Total Transfers Out To Other Funds
2015
7,616
1,479
Aaa
5.5%
0.0%
2013
$1,883,133,657
20.23
$1,317,809,160
29.10
$38,098,917
98.4%
96.3%
$37,901,617
$2,596,232
$41,833,448
$111,051
$41,944,499
$27,263,689
$14,355,334
$41,619,023
$552,195
$42,171,218
($226,719)
$0
$382,200
$3,568,300
$3,950,500
2014
7,631
1,449
Aaa
4.7%
0.1%
$1,853,145,732
20.81
$1,323,625,353
29.30
$38,571,418
98.6%
96.5%
$38,898,014
$3,036,785
$43,844,333
$197,180
$44,041,513
$27,304,586
$15,199,016
$42,503,602
$388,157
$42,891,759
$1,149,754
$0
$320,000
$5,100,254
7,625
1,417
4.0%
0.0%
$1,910,764,881
20.70
$1,326,365,165
29.90
$39,556,949
98.6%
96.4%
$39,914,489
$2,912,452
$44,358,325
$408,090
$44,766,415
$27,724,507
$15,097,469
$42,821,976
$867,733
$43,689,709
$1,076,706
$0
$640,000
$5,536,960
$6,176,960
2016
7,561
1,394
3.6%
0.1%
$1,953,053,185
20.66
$1,330,424,935
30.38
$40,356,348
98.7%
97.4%
$41,275,805
$2,808,762
$45,911,791
$26,568
$45,938,359
$29,448,104
$14,807,462
$44,255,566
$913,992
$45,169,558
$768,801
$0
$640,000
$6,305,761
$6,945,761
7,603
1,509
Aaa
5.8%
0.0%
2012
$1,898,190,023
20.04
$1,671,596,103
22.95
$38,033,479
98.6%
97.2%
$37,864,061
$2,366,020
$41,954,673
$95,000
$49,158,060
$26,784,954
$14,871,434
$41,656,388
$138,805
$48,790,821
$367,239
$0
$382,200
$4,177,219
Committed $0 $0
Nonspendable $0 $0 $0
$0
$3,795,019
$0
$0$0
$0
$4,780,254
Restricted
Assigned
Unassigned
$30,203,829
$3,207,239
$25,476,830
$3,071,256
Bonded Long-Term Debt
Annual Debt Service
$36,952,175
$3,446,341
$33,612,964
$3,215,403
$28,688,465
$3,117,619

ELLINGTON
Bond Rating (Moody's, as of July 1)
Population (State Dept. of Public Health)
Equalized Net Grand List
Equalized Mill Rate
Mill Rate
Total Revenues
Intergovernmental Revenues
Current Year Collection %
Total Expenditures
Education Expenditures
Unemployment (Annual Average)
School Enrollment (State Education Dept.)
TANF Recipients (As a % of Population)
Total Fund Balance (Deficit)
Total Expenditures and Other Financing Uses
Total Revenues and Other Financing Sources
Grand List Data
Property Tax Collection Data
Property Tax Revenues
Net Change In Fund Balance
FISCAL YEARS ENDED 2012 TO 2016
Operating Expenditures
Current Year Adjusted Tax Levy
Net Grand List
Economic Data
Operating Results - General Fund
Fund Balance - General Fund
Total Taxes Collected as a % of Total Outstanding
D - 48
Total Transfers In From Other Funds
Debt Measures
Total Transfers Out To Other Funds
2015
15,786
2,789
Aa3
6.1%
0.3%
2013
$1,775,809,961
19.88
$1,256,058,634
27.90
$35,308,880
98.7%
97.1%
$35,221,229
$14,706,362
$51,577,243
$1,359,061
$53,322,304
$35,342,309
$16,025,178
$51,367,487
$70,291
$51,437,778
$1,884,526
$0
$1,061,457
$4,792,253
$10,467,275
2014
15,795
2,766
Aa3
5.1%
0.2%
$1,789,664,579
20.29
$1,271,301,727
28.40
$36,315,834
98.8%
97.4%
$36,379,511
$15,675,412
$53,793,866
$106,768
$53,900,634
$37,658,420
$15,404,704
$53,063,124
$260,000
$53,323,124
$577,510
$0
$3,983,701
$11,044,785
15,916
2,750
Aa3
4.8%
0.2%
$1,882,287,917
19.83
$1,292,000,469
28.70
$37,320,835
99.1%
97.7%
$37,720,924
$15,563,229
$54,794,648
$0
$55,509,352
$39,195,495
$16,292,646
$55,488,141
$52,750
$55,540,891
($31,539)
$0
$3,341,901
$1,867,100
$11,013,246
2016
16,071
2,733
Aa3
4.2%
0.2%
$1,881,408,137
21.48
$1,311,375,929
30.50
$40,405,603
99.4%
98.6%
$40,924,360
$15,048,775
$57,771,273
$0
$57,771,273
$39,371,523
$17,176,233
$56,547,756
$49,000
$56,596,756
$1,174,517
$0
$4,472,781
$1,750,335
$12,187,762
15,779
2,766
Aa3
6.4%
0.3%
2012
$1,775,579,566
19.34
$1,242,143,466
27.50
$34,331,008
98.5%
96.7%
$34,334,410
$14,663,268
$50,471,837
$76,092
$59,394,741
$33,773,953
$15,070,229
$48,844,182
$94,923
$57,660,825
$1,733,916
$0
$970,382
$8,582,749
Committed $5,964,646 $5,544,838
Nonspendable $0 $259,407 $0
$4,274,790
$3,337,577
$4,613,565
$0$0
$4,967,019
$2,094,065
Restricted
Assigned
Unassigned
$13,256,025
$1,927,541
$20,450,149
$2,807,112
Bonded Long-Term Debt
Annual Debt Service
$12,375,544
$2,270,638
$10,769,696
$2,300,500
$22,501,876
$2,277,439

ENFIELD
Bond Rating (Moody's, as of July 1)
Population (State Dept. of Public Health)
Equalized Net Grand List
Equalized Mill Rate
Mill Rate
Total Revenues
Intergovernmental Revenues
Current Year Collection %
Total Expenditures
Education Expenditures
Unemployment (Annual Average)
School Enrollment (State Education Dept.)
TANF Recipients (As a % of Population)
Total Fund Balance (Deficit)
Total Expenditures and Other Financing Uses
Total Revenues and Other Financing Sources
Grand List Data
Property Tax Collection Data
Property Tax Revenues
Net Change In Fund Balance
FISCAL YEARS ENDED 2012 TO 2016
Operating Expenditures
Current Year Adjusted Tax Levy
Net Grand List
Economic Data
Operating Results - General Fund
Fund Balance - General Fund
Total Taxes Collected as a % of Total Outstanding
D - 49
Total Transfers In From Other Funds
Debt Measures
Total Transfers Out To Other Funds
2015
44,748
5,767
Aa2
7.5%
0.6%
2013
$4,062,183,096
19.43
$2,841,582,637
27.84
$78,936,000
97.7%
93.5%
$79,821,000
$44,070,000
$132,607,000
$94,000
$134,566,000
$73,344,000
$56,218,000
$129,562,000
$3,662,000
$133,224,000
$1,342,000
$0
$1,592,000
$13,525,000
$19,427,000
2014
44,626
5,597
Aa2
6.4%
0.6%
$4,081,383,174
20.37
$2,845,323,647
29.26
$83,132,000
98.0%
94.3%
$83,092,000
$46,613,000
$140,901,000
$126,000
$141,416,000
$77,039,000
$56,760,000
$133,799,000
$3,579,000
$137,378,000
$4,038,000
$0
$832,000
$23,465,000
44,323
5,555
Aa2
5.6%
0.7%
$4,087,836,445
20.35
$2,851,095,090
29.13
$83,183,000
98.0%
94.3%
$84,366,000
$44,638,000
$137,066,000
$557,000
$139,072,000
$73,482,000
$60,841,000
$134,323,000
$2,412,000
$136,735,000
$2,337,000
$0
$2,171,000
$16,908,000
$25,802,000
2016
44,368
5,553
Aa2
5.5%
0.7%
$4,163,607,597
20.69
$2,877,277,903
29.89
$86,125,000
98.1%
94.3%
$86,628,000
$45,301,000
$140,213,000
$391,000
$141,743,000
$75,996,000
$61,708,000
$137,704,000
$3,251,000
$140,955,000
$788,000
$0
$3,110,000
$18,070,000
$26,590,000
44,660
5,918
Aa2
8.1%
0.6%
2012
$4,158,566,581
18.36
$3,210,138,866
23.88
$76,341,000
97.6%
93.6%
$76,401,000
$43,580,000
$128,435,000
$52,000
$129,007,000
$71,140,000
$54,722,000
$125,862,000
$3,444,000
$129,306,000
($299,000)
$0
$2,569,000
$18,085,000
Committed $1,889,000 $2,130,000
Nonspendable $3,521,000 $4,593,000 $3,732,000
$0
$11,784,000
$0
$4,310,000$4,624,000
$1,968,000
$16,041,000
Restricted
Assigned
Unassigned
$24,083,000
$3,519,000
$60,012,000
$6,008,000
Bonded Long-Term Debt
Annual Debt Service
$28,772,000
$3,952,000
$27,521,000
$2,968,000
$44,512,000
$4,908,000

ESSEX
Bond Rating (Moody's, as of July 1)
Population (State Dept. of Public Health)
Equalized Net Grand List
Equalized Mill Rate
Mill Rate
Total Revenues
Intergovernmental Revenues
Current Year Collection %
Total Expenditures
Education Expenditures
Unemployment (Annual Average)
School Enrollment (State Education Dept.)
TANF Recipients (As a % of Population)
Total Fund Balance (Deficit)
Total Expenditures and Other Financing Uses
Total Revenues and Other Financing Sources
Grand List Data
Property Tax Collection Data
Property Tax Revenues
Net Change In Fund Balance
FISCAL YEARS ENDED 2012 TO 2016
Operating Expenditures
Current Year Adjusted Tax Levy
Net Grand List
Economic Data
Operating Results - General Fund
Fund Balance - General Fund
Total Taxes Collected as a % of Total Outstanding
D - 50
Total Transfers In From Other Funds
Debt Measures
Total Transfers Out To Other Funds
2015
6,633
968
Aa2
6.1%
0.1%
2013
$1,473,597,147
14.04
$1,120,189,036
18.47
$20,694,554
99.0%
98.3%
$20,761,480
$1,445,426
$23,027,304
$0
$30,765,449
$15,818,277
$6,808,539
$22,626,816
$422,636
$30,684,156
$81,293
$0
$248,011
$2,736,618
$3,250,997
2014
6,612
935
Aa2
5.2%
0.0%
$1,493,863,898
14.27
$1,119,610,296
18.99
$21,321,019
98.7%
97.8%
$21,326,485
$1,582,749
$23,716,546
$0
$23,796,613
$16,539,771
$6,843,375
$23,383,146
$425,577
$23,808,723
($12,110)
$0
$242,713
$3,238,887
6,586
880
Aa2
4.8%
0.1%
$1,473,880,730
14.70
$1,031,550,311
20.99
$21,660,411
98.8%
97.7%
$21,730,417
$1,559,154
$23,979,383
$0
$23,979,383
$16,395,031
$7,113,754
$23,508,785
$371,166
$23,879,951
$99,432
$0
$176,921
$3,051,000
$3,338,319
2016
6,539
813
Aa2
4.0%
0.1%
$1,561,401,317
14.01
$1,036,820,170
21.08
$21,881,159
99.1%
98.1%
$22,025,103
$1,341,581
$24,056,846
$0
$24,056,846
$16,305,340
$6,858,240
$23,163,580
$426,322
$23,589,902
$466,944
$0
$475,844
$2,979,005
$3,805,263
6,648
970
Aa2
6.7%
0.2%
2012
$1,562,802,546
12.84
$1,116,538,776
17.98
$20,061,358
99.0%
98.4%
$20,147,562
$1,259,999
$21,988,895
$0
$22,155,587
$15,259,930
$6,723,260
$21,983,190
$169,886
$22,153,076
$2,511
$0
$361,766
$3,169,704
Committed $275,000 $50,000
Nonspendable $75,414 $60,398 $12,934
$216,186
$2,578,818
$233,950
$32,418$9,947
$72,253
$2,913,974
Restricted
Assigned
Unassigned
$15,067,045
$906,501
$12,303,976
$956,475
Bonded Long-Term Debt
Annual Debt Service
$16,559,566
$952,884
$16,061,406
$1,031,357
$13,608,703
$915,359

FAIRFIELD
Bond Rating (Moody's, as of July 1)
Population (State Dept. of Public Health)
Equalized Net Grand List
Equalized Mill Rate
Mill Rate
Total Revenues
Intergovernmental Revenues
Current Year Collection %
Total Expenditures
Education Expenditures
Unemployment (Annual Average)
School Enrollment (State Education Dept.)
TANF Recipients (As a % of Population)
Total Fund Balance (Deficit)
Total Expenditures and Other Financing Uses
Total Revenues and Other Financing Sources
Grand List Data
Property Tax Collection Data
Property Tax Revenues
Net Change In Fund Balance
FISCAL YEARS ENDED 2012 TO 2016
Operating Expenditures
Current Year Adjusted Tax Levy
Net Grand List
Economic Data
Operating Results - General Fund
Fund Balance - General Fund
Total Taxes Collected as a % of Total Outstanding
D - 51
Total Transfers In From Other Funds
Debt Measures
Total Transfers Out To Other Funds
2015
60,855
10,322
Aaa
6.5%
0.1%
2013
$15,534,035,048
16.13
$10,857,288,637
23.37
$250,603,000
98.8%
97.9%
$250,020,000
$26,229,000
$289,947,000
$1,000
$290,268,000
$166,241,000
$118,309,000
$284,550,000
$3,599,000
$288,149,000
$2,119,000
$0
$1,398,000
$17,408,000
$18,806,000
2014
61,347
10,304
Aaa
5.4%
0.1%
$16,145,663,531
15.91
$10,889,060,051
23.93
$256,935,000
98.7%
97.6%
$256,634,000
$29,508,000
$301,187,000
$0
$301,187,000
$171,991,000
$121,334,000
$293,325,000
$4,685,000
$298,010,000
$3,177,000
$0
$815,000
$21,983,000
61,523
10,255
Aaa
4.7%
0.1%
$16,319,163,696
16.14
$10,913,511,153
24.40
$263,352,000
98.6%
97.5%
$263,941,000
$25,464,000
$303,146,000
$46,000
$303,530,000
$171,906,000
$125,191,000
$297,097,000
$3,293,000
$300,390,000
$3,140,000
$0
$863,000
$24,260,000
$25,123,000
2016
61,160
10,126
Aaa
4.3%
0.0%
$16,170,416,830
16.67
$10,975,624,915
24.79
$269,553,000
98.7%
97.3%
$270,365,000
$26,820,000
$312,899,000
$0
$312,899,000
$180,029,000
$128,033,000
$308,062,000
$1,700,000
$309,762,000
$3,137,000
$0
$825,000
$27,435,000
$28,260,000
60,450
10,314
Aaa
7.1%
0.1%
2012
$15,424,548,293
15.52
$10,787,725,630
22.47
$239,402,000
98.9%
98.1%
$240,615,000
$24,570,000
$279,052,000
$12,000
$279,384,000
$161,132,000
$114,385,000
$275,517,000
$2,180,000
$277,697,000
$1,687,000
$0
$0
$16,687,000
Committed $0 $0
Nonspendable $0 $0 $0
$2,094,000
$14,593,000
$0
$0$0
$0
$21,168,000
Restricted
Assigned
Unassigned
$197,948,188
$23,357,000
$195,829,000
$24,749,000
Bonded Long-Term Debt
Annual Debt Service
$189,319,000
$22,337,000
$213,062,000
$23,258,000
$193,347,000
$24,809,000

FARMINGTON
Bond Rating (Moody's, as of July 1)
Population (State Dept. of Public Health)
Equalized Net Grand List
Equalized Mill Rate
Mill Rate
Total Revenues
Intergovernmental Revenues
Current Year Collection %
Total Expenditures
Education Expenditures
Unemployment (Annual Average)
School Enrollment (State Education Dept.)
TANF Recipients (As a % of Population)
Total Fund Balance (Deficit)
Total Expenditures and Other Financing Uses
Total Revenues and Other Financing Sources
Grand List Data
Property Tax Collection Data
Property Tax Revenues
Net Change In Fund Balance
FISCAL YEARS ENDED 2012 TO 2016
Operating Expenditures
Current Year Adjusted Tax Levy
Net Grand List
Economic Data
Operating Results - General Fund
Fund Balance - General Fund
Total Taxes Collected as a % of Total Outstanding
D - 52
Total Transfers In From Other Funds
Debt Measures
Total Transfers Out To Other Funds
2015
25,613
4,079
Aaa
5.4%
0.1%
2013
$5,313,947,102
15.47
$3,749,372,288
21.90
$82,227,880
99.6%
99.4%
$82,373,994
$12,152,086
$97,224,880
$0
$100,854,557
$61,514,220
$33,092,827
$94,607,047
$1,800,000
$100,015,354
$839,203
$0
$179,726
$8,917,875
$9,097,601
2014
25,627
4,033
Aaa
4.6%
0.2%
$4,964,907,343
16.82
$3,475,173,670
24.07
$83,534,157
99.6%
99.3%
$83,594,831
$13,512,775
$99,968,583
$0
$99,968,583
$63,908,106
$32,678,284
$96,586,390
$2,805,604
$99,391,994
$576,589
$0
$122,297
$9,674,190
25,629
4,028
Aaa
3.9%
0.2%
$5,214,499,137
16.40
$3,500,061,738
24.44
$85,500,544
99.6%
99.4%
$85,678,697
$12,526,132
$100,764,679
$0
$100,764,679
$63,453,677
$32,421,805
$95,875,482
$3,701,737
$99,577,219
$1,187,460
$0
$518,355
$10,343,295
$10,861,650
2016
25,524
4,048
Aaa
3.6%
0.1%
$5,115,009,589
17.37
$3,532,450,005
25.10
$88,868,429
99.8%
99.5%
$89,179,689
$13,153,469
$104,543,428
$0
$104,543,428
$67,188,409
$33,310,833
$100,499,242
$3,630,815
$104,130,057
$413,371
$0
$370,383
$10,904,638
$11,275,021
25,529
4,045
Aaa
5.8%
0.2%
2012
$5,016,473,381
15.81
$3,727,355,263
21.27
$79,292,043
99.6%
99.5%
$79,556,089
$11,990,375
$93,721,633
$0
$99,086,209
$59,898,122
$32,782,593
$92,680,715
$1,010,000
$98,965,322
$120,887
$0
$178,623
$8,258,398
Committed $0 $0
Nonspendable $0 $0 $16,040
$0
$8,063,735
$0
$0$0
$0
$9,551,893
Restricted
Assigned
Unassigned
$44,250,446
$7,713,185
$39,426,591
$6,849,514
Bonded Long-Term Debt
Annual Debt Service
$56,452,884
$8,892,671
$50,528,722
$8,536,931
$42,985,902
$6,866,267

FRANKLIN
Bond Rating (Moody's, as of July 1)
Population (State Dept. of Public Health)
Equalized Net Grand List
Equalized Mill Rate
Mill Rate
Total Revenues
Intergovernmental Revenues
Current Year Collection %
Total Expenditures
Education Expenditures
Unemployment (Annual Average)
School Enrollment (State Education Dept.)
TANF Recipients (As a % of Population)
Total Fund Balance (Deficit)
Total Expenditures and Other Financing Uses
Total Revenues and Other Financing Sources
Grand List Data
Property Tax Collection Data
Property Tax Revenues
Net Change In Fund Balance
FISCAL YEARS ENDED 2012 TO 2016
Operating Expenditures
Current Year Adjusted Tax Levy
Net Grand List
Economic Data
Operating Results - General Fund
Fund Balance - General Fund
Total Taxes Collected as a % of Total Outstanding
D - 53
Total Transfers In From Other Funds
Debt Measures
Total Transfers Out To Other Funds
2015
1,987
281
6.6%
0.3%
2013
$279,527,369
15.90
$212,355,196
21.04
$4,444,126
99.4%
99.0%
$4,500,074
$1,644,771
$6,309,489
$5,007
$6,314,496
$4,250,498
$1,809,851
$6,060,349
$32,000
$6,092,349
$222,147
$0
$77,550
$542,148
$619,698
2014
1,984
267
6.3%
0.3%
$278,675,631
16.61
$215,037,865
21.54
$4,628,408
98.9%
98.4%
$4,623,373
$1,732,750
$6,520,322
$0
$6,520,322
$4,360,997
$1,839,052
$6,200,049
$94,750
$6,294,799
$225,523
$0
$0
$867,655
1,975
253
5.4%
0.2%
$270,251,429
17.36
$189,115,180
24.72
$4,691,155
98.5%
98.0%
$4,710,721
$1,761,506
$6,628,733
$0
$6,628,733
$4,375,142
$1,931,240
$6,306,382
$183,900
$6,490,282
$138,451
$0
$276,361
$729,745
$1,006,106
2016
1,955
255
4.4%
0.2%
$302,603,372
15.73
$191,400,520
24.72
$4,759,484
98.3%
97.7%
$4,780,592
$1,656,383
$6,669,080
$0
$6,669,080
$4,455,436
$1,856,684
$6,312,120
$407,827
$6,719,947
($50,867)
$0
$56,274
$876,530
$932,804
1,991
285
6.6%
0.3%
2012
$291,331,006
14.80
$211,212,205
20.54
$4,312,941
98.9%
98.5%
$4,380,123
$1,600,115
$6,172,683
$32,964
$6,205,647
$4,364,345
$1,752,187
$6,116,532
$19,582
$6,136,114
$69,533
$0
$0
$397,551
Committed $0 $0
Nonspendable $0 $0 $0
$0
$397,551
$0
$0$0
$0
$867,655
Restricted
Assigned
Unassigned
$1,805,130
$271,604
$1,418,702
$257,012
Bonded Long-Term Debt
Annual Debt Service
$2,191,558
$230,195
$1,998,344
$280,539
$1,611,916
$264,635

GLASTONBURY
Bond Rating (Moody's, as of July 1)
Population (State Dept. of Public Health)
Equalized Net Grand List
Equalized Mill Rate
Mill Rate
Total Revenues
Intergovernmental Revenues
Current Year Collection %
Total Expenditures
Education Expenditures
Unemployment (Annual Average)
School Enrollment (State Education Dept.)
TANF Recipients (As a % of Population)
Total Fund Balance (Deficit)
Total Expenditures and Other Financing Uses
Total Revenues and Other Financing Sources
Grand List Data
Property Tax Collection Data
Property Tax Revenues
Net Change In Fund Balance
FISCAL YEARS ENDED 2012 TO 2016
Operating Expenditures
Current Year Adjusted Tax Levy
Net Grand List
Economic Data
Operating Results - General Fund
Fund Balance - General Fund
Total Taxes Collected as a % of Total Outstanding
D - 54
Total Transfers In From Other Funds
Debt Measures
Total Transfers Out To Other Funds
2015
34,768
6,753
Aaa
5.1%
0.1%
2013
$5,742,991,731
22.34
$4,207,613,915
30.50
$128,299,243
99.4%
99.3%
$128,472,632
$21,437,368
$156,351,083
$108,624
$159,508,078
$101,617,744
$46,586,747
$148,204,491
$5,379,200
$153,583,691
$5,924,387
$0
$2,323,703
$21,881,949
$24,457,819
2014
34,754
6,582
Aaa
4.5%
0.2%
$5,441,509,440
24.56
$3,808,546,358
35.10
$133,617,304
99.4%
99.3%
$133,909,658
$20,916,758
$159,763,437
$58,235
$171,219,784
$106,599,514
$46,905,348
$153,504,862
$4,401,715
$167,600,656
$3,619,128
$0
$1,045,142
$26,916,411
34,678
6,313
Aaa
3.8%
0.2%
$5,749,528,717
23.77
$3,832,589,412
35.65
$136,682,891
99.4%
99.2%
$137,088,886
$18,421,311
$160,239,746
$0
$160,256,433
$107,377,221
$47,337,064
$154,714,285
$6,752,000
$161,466,285
($1,209,852)
$0
$1,143,003
$24,339,992
$25,706,559
2016
34,584
6,213
Aaa
3.5%
0.2%
$5,895,699,482
23.74
$3,871,305,346
36.10
$139,990,757
99.6%
99.4%
$140,255,321
$19,628,137
$165,595,208
$0
$165,626,179
$110,736,179
$47,903,028
$158,639,207
$5,631,300
$164,270,507
$1,355,672
$0
$1,001,234
$25,843,730
$27,062,231
34,698
6,826
Aaa
5.4%
0.1%
2012
$5,718,023,248
21.88
$4,165,399,080
30.05
$125,090,308
99.5%
99.3%
$125,803,008
$18,403,425
$150,378,446
$0
$167,011,790
$99,561,559
$47,838,922
$147,400,481
$4,036,000
$168,069,825
($1,058,035)
$0
$2,386,401
$18,533,432
Committed $0 $0
Nonspendable $217,267 $223,564 $256,476
$0
$15,890,555
$0
$252,167$223,188
$0
$25,648,081
Restricted
Assigned
Unassigned
$88,206,979
$10,949,431
$73,062,844
$10,005,360
Bonded Long-Term Debt
Annual Debt Service
$93,997,752
$10,197,520
$86,564,139
$10,595,513
$80,473,325
$10,673,414

GOSHEN
Bond Rating (Moody's, as of July 1)
Population (State Dept. of Public Health)
Equalized Net Grand List
Equalized Mill Rate
Mill Rate
Total Revenues
Intergovernmental Revenues
Current Year Collection %
Total Expenditures
Education Expenditures
Unemployment (Annual Average)
School Enrollment (State Education Dept.)
TANF Recipients (As a % of Population)
Total Fund Balance (Deficit)
Total Expenditures and Other Financing Uses
Total Revenues and Other Financing Sources
Grand List Data
Property Tax Collection Data
Property Tax Revenues
Net Change In Fund Balance
FISCAL YEARS ENDED 2012 TO 2016
Operating Expenditures
Current Year Adjusted Tax Levy
Net Grand List
Economic Data
Operating Results - General Fund
Fund Balance - General Fund
Total Taxes Collected as a % of Total Outstanding
D - 55
Total Transfers In From Other Funds
Debt Measures
Total Transfers Out To Other Funds
2015
2,945
405
5.8%
0.2%
2013
$729,286,705
12.64
$613,940,005
15.00
$9,220,832
99.2%
98.6%
$9,234,191
$413,074
$9,839,567
$51,100
$9,890,667
$6,924,636
$2,552,638
$9,477,274
$541,172
$10,018,446
($127,779)
$0
$316,200
$1,378,926
$1,717,271
2014
2,914
378
5.1%
0.2%
$740,215,957
13.48
$518,007,170
19.20
$9,974,682
99.0%
98.5%
$10,028,548
$339,750
$10,577,971
$51,100
$10,629,071
$7,250,596
$2,641,305
$9,891,901
$636,689
$10,528,590
$100,481
$0
$327,004
$1,854,704
2,904
353
4.6%
0.1%
$739,933,594
13.53
$520,545,130
19.20
$10,012,673
99.5%
99.0%
$10,087,390
$332,235
$10,628,210
$51,100
$10,679,310
$7,253,218
$2,580,985
$9,834,203
$667,566
$10,501,769
$177,541
$0
$194,354
$1,799,949
$2,032,245
2016
2,891
355
4.2%
0.1%
$747,314,239
13.43
$523,351,320
19.10
$10,033,284
99.7%
99.4%
$10,099,665
$299,172
$10,588,537
$51,100
$10,639,637
$7,108,614
$2,596,537
$9,705,151
$707,520
$10,412,671
$226,966
$0
$500,886
$1,715,932
$2,259,211
2,952
409
7.1%
0.3%
2012
$788,916,770
11.61
$610,305,970
15.00
$9,161,026
99.3%
98.8%
$9,186,512
$382,760
$9,758,960
$51,100
$9,810,060
$7,155,779
$2,350,235
$9,506,014
$390,576
$9,896,590
($86,530)
$0
$600,291
$1,845,050
Committed $25,284 $36,968
Nonspendable $17,109 $974 $19,374
$0
$1,225,385
$0
$22,145$17,933
$36,968
$1,472,799
Restricted
Assigned
Unassigned
$1,014,099
$0
$1,493,652
$0
Bonded Long-Term Debt
Annual Debt Service
$1,529,378
$0
$1,217,045
$0
$753,522
$0

GRANBY
Bond Rating (Moody's, as of July 1)
Population (State Dept. of Public Health)
Equalized Net Grand List
Equalized Mill Rate
Mill Rate
Total Revenues
Intergovernmental Revenues
Current Year Collection %
Total Expenditures
Education Expenditures
Unemployment (Annual Average)
School Enrollment (State Education Dept.)
TANF Recipients (As a % of Population)
Total Fund Balance (Deficit)
Total Expenditures and Other Financing Uses
Total Revenues and Other Financing Sources
Grand List Data
Property Tax Collection Data
Property Tax Revenues
Net Change In Fund Balance
FISCAL YEARS ENDED 2012 TO 2016
Operating Expenditures
Current Year Adjusted Tax Levy
Net Grand List
Economic Data
Operating Results - General Fund
Fund Balance - General Fund
Total Taxes Collected as a % of Total Outstanding
D - 56
Total Transfers In From Other Funds
Debt Measures
Total Transfers Out To Other Funds
2015
11,323
2,074
Aa2
5.2%
0.1%
2013
$1,408,127,839
23.12
$1,066,837,530
30.69
$32,556,187
99.1%
98.4%
$32,683,980
$9,891,402
$43,296,005
$330,089
$43,626,094
$29,454,150
$12,343,428
$41,797,578
$1,304,836
$43,102,414
$523,680
$0
$1,819,320
$2,226,136
$4,061,320
2014
11,310
2,024
4.6%
0.1%
$1,363,093,257
24.26
$954,011,490
34.83
$33,064,702
99.1%
98.5%
$33,236,196
$10,814,146
$44,755,683
$340,232
$45,127,215
$30,638,153
$12,724,519
$43,362,672
$1,224,808
$44,587,480
$539,735
$0
$1,714,573
$4,601,055
11,298
1,948
4.0%
0.1%
$1,407,472,134
24.13
$960,029,620
35.52
$33,968,158
99.0%
98.2%
$34,051,516
$9,553,843
$44,379,395
$531,012
$44,910,407
$30,716,490
$12,959,330
$43,675,820
$1,565,882
$45,241,702
($331,295)
$0
$1,676,175
$2,586,074
$4,269,760
2016
11,247
1,921
3.6%
0.0%
$1,397,925,266
24.93
$965,474,890
36.22
$34,856,873
99.1%
98.3%
$34,955,039
$10,183,360
$45,927,999
$1,005,517
$46,933,516
$31,216,353
$13,412,997
$44,629,350
$1,891,992
$46,521,342
$412,174
$0
$1,662,011
$3,012,382
$4,681,934
11,316
2,148
Aa2
5.6%
0.1%
2012
$1,397,471,124
22.63
$1,057,105,520
30.10
$31,627,866
98.9%
98.3%
$31,683,669
$11,210,292
$43,587,000
$335,011
$43,922,011
$29,506,830
$14,171,716
$43,678,546
$1,165,029
$44,843,575
($921,564)
$0
$1,784,920
$3,537,640
Committed $7,541 $7,511
Nonspendable $0 $0 $0
$10,975
$1,741,745
$15,864
$0$0
$15,864
$2,870,618
Restricted
Assigned
Unassigned
$27,871,352
$3,457,543
$22,766,095
$3,756,355
Bonded Long-Term Debt
Annual Debt Service
$23,681,404
$3,430,415
$30,203,602
$3,295,410
$25,544,797
$3,376,968

GREENWICH
Bond Rating (Moody's, as of July 1)
Population (State Dept. of Public Health)
Equalized Net Grand List
Equalized Mill Rate
Mill Rate
Total Revenues
Intergovernmental Revenues
Current Year Collection %
Total Expenditures
Education Expenditures
Unemployment (Annual Average)
School Enrollment (State Education Dept.)
TANF Recipients (As a % of Population)
Total Fund Balance (Deficit)
Total Expenditures and Other Financing Uses
Total Revenues and Other Financing Sources
Grand List Data
Property Tax Collection Data
Property Tax Revenues
Net Change In Fund Balance
FISCAL YEARS ENDED 2012 TO 2016
Operating Expenditures
Current Year Adjusted Tax Levy
Net Grand List
Economic Data
Operating Results - General Fund
Fund Balance - General Fund
Total Taxes Collected as a % of Total Outstanding
D - 57
Total Transfers In From Other Funds
Debt Measures
Total Transfers Out To Other Funds
2015
62,396
8,710
Aaa
5.7%
0.2%
2013
$42,269,356,545
7.53
$30,709,850,064
10.39
$318,184,576
99.1%
98.0%
$318,769,792
$26,543,729
$372,957,683
$4,505,235
$377,462,918
$155,006,606
$199,550,322
$354,556,928
$15,163,000
$369,719,928
$7,742,990
$0
$13,514,831
$21,690,344
$35,287,077
2014
62,610
8,661
Aaa
4.8%
0.2%
$45,635,509,076
7.20
$30,824,749,610
10.68
$328,586,523
98.9%
97.8%
$328,529,917
$32,376,036
$391,212,359
$5,804,398
$397,016,757
$159,830,154
$209,179,544
$369,009,698
$15,994,000
$385,003,698
$12,013,059
$0
$19,473,494
$47,300,136
62,695
8,674
Aaa
4.1%
0.2%
$48,731,135,496
6.92
$30,955,949,676
10.97
$337,402,140
99.2%
98.0%
$338,909,392
$32,596,244
$401,451,706
$6,517,281
$407,968,987
$164,233,253
$223,261,449
$387,494,702
$13,841,000
$401,335,702
$6,633,285
$0
$22,788,722
$25,726,186
$53,933,421
2016
62,359
8,682
Aaa
3.8%
0.2%
$50,031,483,545
6.99
$31,086,586,390
11.27
$349,798,076
99.3%
98.1%
$350,698,456
$29,010,055
$411,612,235
$7,004,529
$418,616,764
$167,235,645
$230,059,712
$397,295,357
$19,080,000
$416,375,357
$2,241,407
$0
$30,870,368
$25,304,460
$56,174,828
62,256
8,715
Aaa
6.2%
0.2%
2012
$43,381,228,410
7.06
$30,363,191,887
10.11
$306,264,382
99.3%
98.3%
$306,616,555
$27,425,341
$360,897,505
$3,998,895
$364,896,400
$152,486,555
$192,113,688
$344,600,243
$14,555,000
$359,155,243
$5,741,157
$0
$12,417,458
$27,544,087
Committed $0 $0
Nonspendable $0 $5,418,513 $2,474,238
$21,140
$12,631,251
$81,902
$0$6,245
$0
$27,820,397
Restricted
Assigned
Unassigned
$117,943,220
$25,979,658
$151,193,490
$31,711,448
Bonded Long-Term Debt
Annual Debt Service
$93,158,943
$23,185,196
$94,859,704
$23,365,790
$130,420,375
$32,321,447

GRISWOLD
Bond Rating (Moody's, as of July 1)
Population (State Dept. of Public Health)
Equalized Net Grand List
Equalized Mill Rate
Mill Rate
Total Revenues
Intergovernmental Revenues
Current Year Collection %
Total Expenditures
Education Expenditures
Unemployment (Annual Average)
School Enrollment (State Education Dept.)
TANF Recipients (As a % of Population)
Total Fund Balance (Deficit)
Total Expenditures and Other Financing Uses
Total Revenues and Other Financing Sources
Grand List Data
Property Tax Collection Data
Property Tax Revenues
Net Change In Fund Balance
FISCAL YEARS ENDED 2012 TO 2016
Operating Expenditures
Current Year Adjusted Tax Levy
Net Grand List
Economic Data
Operating Results - General Fund
Fund Balance - General Fund
Total Taxes Collected as a % of Total Outstanding
D - 58
Total Transfers In From Other Funds
Debt Measures
Total Transfers Out To Other Funds
2015
11,959
1,836
9.4%
1.2%
2013
$997,412,759
17.39
$697,647,931
24.80
$17,347,376
97.2%
94.4%
$17,379,328
$14,081,308
$33,641,240
$0
$33,641,240
$27,317,952
$5,552,994
$32,870,946
$532,500
$33,403,446
$237,794
$0
$159,971
$2,628,824
$2,995,847
2014
11,916
1,845
8.1%
1.3%
$958,388,012
19.00
$695,610,176
26.03
$18,207,564
97.5%
95.1%
$18,428,474
$14,451,801
$35,285,007
$0
$35,285,007
$28,005,356
$5,667,510
$33,672,866
$642,999
$34,315,865
$969,142
$0
$256,190
$3,964,989
11,830
1,776
7.0%
1.0%
$972,447,211
18.87
$699,028,061
26.08
$18,353,729
97.4%
94.6%
$18,493,876
$13,849,501
$34,504,010
$0
$34,504,010
$27,669,568
$5,738,671
$33,408,239
$1,128,465
$34,536,704
($32,694)
$0
$268,685
$3,646,888
$3,932,295
2016
11,719
1,787
6.2%
0.8%
$963,919,193
19.55
$705,810,105
26.57
$18,841,208
97.5%
95.0%
$19,096,517
$14,602,820
$36,019,820
$0
$53,268,610
$28,599,440
$6,248,740
$34,848,180
$1,244,560
$52,983,899
$284,711
$0
$420,203
$3,783,046
$4,217,006
11,986
1,846
10.0%
1.0%
2012
$1,009,839,725
15.39
$826,130,433
18.73
$15,538,436
97.8%
95.0%
$15,638,317
$14,145,562
$31,985,332
$0
$31,985,332
$26,378,099
$5,550,640
$31,928,739
$376,750
$32,305,489
($320,157)
$0
$484,971
$2,758,053
Committed $0 $0
Nonspendable $13,757 $16,722 $610,922
$0
$1,662,160
$0
$207,052$11,211
$0
$3,697,588
Restricted
Assigned
Unassigned
$17,758,936
$1,692,166
$14,815,200
$1,749,362
Bonded Long-Term Debt
Annual Debt Service
$19,721,202
$1,847,154
$18,768,568
$1,772,645
$16,724,467
$1,775,051

GROTON
Bond Rating (Moody's, as of July 1)
Population (State Dept. of Public Health)
Equalized Net Grand List
Equalized Mill Rate
Mill Rate
Total Revenues
Intergovernmental Revenues
Current Year Collection %
Total Expenditures
Education Expenditures
Unemployment (Annual Average)
School Enrollment (State Education Dept.)
TANF Recipients (As a % of Population)
Total Fund Balance (Deficit)
Total Expenditures and Other Financing Uses
Total Revenues and Other Financing Sources
Grand List Data
Property Tax Collection Data
Property Tax Revenues
Net Change In Fund Balance
FISCAL YEARS ENDED 2012 TO 2016
Operating Expenditures
Current Year Adjusted Tax Levy
Net Grand List
Economic Data
Operating Results - General Fund
Fund Balance - General Fund
Total Taxes Collected as a % of Total Outstanding
D - 59
Total Transfers In From Other Funds
Debt Measures
Total Transfers Out To Other Funds
2015
40,176
5,091
Aa2
7.4%
0.7%
2013
$5,674,978,734
14.14
$3,949,777,080
20.22
$80,232,312
98.5%
96.9%
$81,691,813
$44,883,513
$128,803,319
$1,027,913
$151,128,063
$80,996,988
$43,489,830
$124,486,818
$3,667,447
$149,254,370
$1,873,693
$0
$3,003,114
$11,617,470
$14,620,584
2014
40,167
5,014
Aa2
6.0%
0.8%
$5,453,605,492
14.72
$3,868,863,246
20.72
$80,265,647
98.7%
97.4%
$81,882,690
$46,217,827
$130,721,622
$1,014,411
$132,051,882
$82,192,134
$44,078,055
$126,270,189
$1,913,433
$128,183,622
$3,868,260
$0
$4,346,530
$18,488,844
39,692
4,957
Aa2
5.3%
0.8%
$5,435,454,547
14.36
$3,909,603,306
20.13
$78,060,622
98.5%
97.1%
$78,601,542
$43,397,238
$124,886,980
$2,310,285
$127,197,265
$81,862,680
$45,343,396
$127,206,076
$1,713,433
$128,919,509
($1,722,244)
$0
$4,556,108
$9,510,492
$16,766,600
2016
39,261
4,904
Aa2
4.5%
0.6%
$5,265,116,792
15.11
$3,820,151,399
20.95
$79,533,483
98.6%
97.3%
$80,035,498
$43,716,941
$126,267,855
$908,951
$127,176,806
$84,010,289
$44,354,685
$128,364,974
$2,788,400
$131,153,374
($3,976,568)
$0
$2,026,112
$10,097,227
$12,790,032
39,896
5,181
Aa2
8.0%
0.7%
2012
$5,219,564,260
14.86
$4,110,600,162
18.89
$77,540,497
97.8%
96.2%
$77,709,085
$43,940,965
$123,676,477
$797,972
$142,094,150
$79,722,039
$43,409,860
$123,131,899
$1,963,764
$142,537,501
($443,351)
$0
$3,325,543
$12,746,891
Committed $666,693 $2,700,000
Nonspendable $0 $0 $0
$0
$9,421,348
$0
$0$0
$2,700,000
$11,442,314
Restricted
Assigned
Unassigned
$59,282,038
$5,707,146
$49,831,703
$6,380,310
Bonded Long-Term Debt
Annual Debt Service
$58,667,201
$7,832,715
$53,832,065
$5,953,056
$54,540,001
$6,537,049

GROTON (City of)
Bond Rating (Moody's, as of July 1)
Population (State Dept. of Public Health)
Equalized Net Grand List
Equalized Mill Rate
Mill Rate
Total Revenues
Intergovernmental Revenues
Current Year Collection %
Total Expenditures
Education Expenditures
Unemployment (Annual Average)
School Enrollment (State Education Dept.)
TANF Recipients (As a % of Population)
Total Fund Balance (Deficit)
Total Expenditures and Other Financing Uses
Total Revenues and Other Financing Sources
Grand List Data
Property Tax Collection Data
Property Tax Revenues
Net Change In Fund Balance
FISCAL YEARS ENDED 2012 TO 2016
Operating Expenditures
Current Year Adjusted Tax Levy
Net Grand List
Economic Data
Operating Results - General Fund
Fund Balance - General Fund
Total Taxes Collected as a % of Total Outstanding
D - 60
Total Transfers In From Other Funds
Debt Measures
Total Transfers Out To Other Funds
2015
Aa3
2013
$6,343,834
99.1%
98.8%
$6,417,756
$290,170
$13,444,977
$3,119,496
$16,564,473
$0
$16,118,947
$16,118,947
$0
$16,118,947
$445,526
$0
$46,075
$3,899,210
$4,652,381
2014
Aa3
$5,942,495
99.4%
99.3%
$6,166,362
$692,025
$13,086,079
$3,119,496
$16,205,575
$0
$16,239,533
$16,239,533
$464,533
$16,704,066
($498,491)
$0
$160,862
$4,153,890
Aa3
$6,216,893
99.1%
98.9%
$6,240,201
$410,820
$12,685,024
$3,119,496
$15,804,520
$0
$16,487,058
$16,487,058
$0
$16,487,058
($682,538)
$0
$720,172
$2,718,163
$3,471,352
2016
Aa3
5.87
$7,015,746
99.2%
99.0%
$7,041,746
$221,886
$13,031,733
$3,587,412
$16,619,145
$0
$16,192,308
$16,192,308
$0
$16,192,308
$426,837
$0
$400,000
$3,463,375
$3,898,189
Aa3
2012
$5,497,598
99.0%
98.7%
$5,628,575
$327,558
$12,381,385
$3,101,624
$15,483,009
$0
$15,302,629
$15,302,629
$175,832
$15,478,461
$4,548
$0
$28,571
$4,206,855
Committed $0 $0
Nonspendable $34,814 $33,017 $17,138
$676,227
$3,484,919
$657,188
$49,908$9,750
$658,790
$3,324,488
Restricted
Assigned
Unassigned
$5,635,000
$989,185
$4,455,000
$762,294
Bonded Long-Term Debt
Annual Debt Service
$3,493,000
$801,259
$6,428,000
$754,103
$5,040,000
$784,909

GUILFORD
Bond Rating (Moody's, as of July 1)
Population (State Dept. of Public Health)
Equalized Net Grand List
Equalized Mill Rate
Mill Rate
Total Revenues
Intergovernmental Revenues
Current Year Collection %
Total Expenditures
Education Expenditures
Unemployment (Annual Average)
School Enrollment (State Education Dept.)
TANF Recipients (As a % of Population)
Total Fund Balance (Deficit)
Total Expenditures and Other Financing Uses
Total Revenues and Other Financing Sources
Grand List Data
Property Tax Collection Data
Property Tax Revenues
Net Change In Fund Balance
FISCAL YEARS ENDED 2012 TO 2016
Operating Expenditures
Current Year Adjusted Tax Levy
Net Grand List
Economic Data
Operating Results - General Fund
Fund Balance - General Fund
Total Taxes Collected as a % of Total Outstanding
D - 61
Total Transfers In From Other Funds
Debt Measures
Total Transfers Out To Other Funds
2015
22,417
3,605
Aa2
5.3%
0.1%
2013
$4,177,877,721
17.26
$3,489,689,577
22.36
$72,103,279
99.5%
99.3%
$77,165,575
$10,188,125
$89,452,878
$0
$108,523,184
$58,751,799
$29,146,916
$87,898,715
$182,000
$106,990,072
$1,533,112
$0
$1,092,734
$5,094,933
$6,617,254
2014
22,413
3,559
Aa2
4.6%
0.1%
$4,401,457,459
16.95
$3,493,861,794
23.06
$74,615,429
99.5%
99.4%
$79,780,015
$11,574,815
$93,395,758
$0
$93,395,758
$61,781,211
$30,217,561
$91,998,772
$176,015
$92,174,787
$1,220,971
$0
$1,677,420
$7,838,225
22,350
3,454
Aa2
3.9%
0.2%
$4,347,800,907
18.35
$3,042,717,635
27.42
$79,780,293
99.5%
99.3%
$82,662,466
$10,392,959
$95,092,236
$2,407
$95,528,193
$63,185,233
$31,088,004
$94,273,237
$185,015
$94,458,252
$1,069,941
$433,550
$1,378,522
$6,763,025
$8,908,166
2016
22,277
3,450
Aa2
3.4%
0.2%
$4,434,076,490
18.48
$3,051,805,195
28.24
$81,926,925
99.5%
99.3%
$85,373,805
$10,848,990
$98,649,042
$0
$116,498,098
$64,614,449
$32,444,113
$97,058,562
$684,440
$114,764,607
$1,733,491
$668,304
$1,386,953
$8,216,230
$10,641,657
22,403
3,684
Aa2
5.5%
0.2%
2012
$4,466,535,556
15.69
$3,472,194,672
21.52
$70,073,457
99.5%
99.3%
$73,809,996
$10,474,843
$86,138,813
$0
$86,138,813
$56,963,303
$28,465,599
$85,428,902
$148,000
$85,576,902
$561,911
$0
$496,390
$5,084,142
Committed $312,053 $312,053
Nonspendable $58,117 $21,016 $0
$447,040
$4,140,712
$429,587
$0$0
$312,053
$5,848,752
Restricted
Assigned
Unassigned
$36,489,000
$3,351,551
$85,615,000
$6,104,992
Bonded Long-Term Debt
Annual Debt Service
$42,705,002
$5,275,703
$38,694,000
$4,548,189
$60,234,000
$3,719,290

HADDAM
Bond Rating (Moody's, as of July 1)
Population (State Dept. of Public Health)
Equalized Net Grand List
Equalized Mill Rate
Mill Rate
Total Revenues
Intergovernmental Revenues
Current Year Collection %
Total Expenditures
Education Expenditures
Unemployment (Annual Average)
School Enrollment (State Education Dept.)
TANF Recipients (As a % of Population)
Total Fund Balance (Deficit)
Total Expenditures and Other Financing Uses
Total Revenues and Other Financing Sources
Grand List Data
Property Tax Collection Data
Property Tax Revenues
Net Change In Fund Balance
FISCAL YEARS ENDED 2012 TO 2016
Operating Expenditures
Current Year Adjusted Tax Levy
Net Grand List
Economic Data
Operating Results - General Fund
Fund Balance - General Fund
Total Taxes Collected as a % of Total Outstanding
D - 62
Total Transfers In From Other Funds
Debt Measures
Total Transfers Out To Other Funds
2015
8,363
1,314
Aa3
5.5%
0.1%
2013
$1,235,489,184
21.03
$897,304,580
28.99
$25,987,612
99.0%
95.5%
$26,074,511
$2,042,960
$28,557,675
$0
$28,557,675
$20,918,591
$6,069,852
$26,988,443
$1,093,103
$28,081,546
$476,129
$0
$0
$3,671,221
$3,671,221
2014
8,333
1,339
Aa3
4.8%
0.2%
$1,197,059,823
22.14
$899,845,277
29.48
$26,502,050
98.9%
95.8%
$26,605,805
$2,065,467
$29,150,891
$0
$29,170,391
$21,414,633
$5,990,648
$27,405,281
$1,667,070
$29,072,351
$98,040
$0
$0
$3,769,261
8,292
1,297
Aa3
4.1%
0.2%
$1,210,735,544
22.74
$905,164,703
30.39
$27,531,502
99.0%
96.1%
$27,718,031
$2,062,061
$30,279,303
$0
$30,279,303
$22,376,890
$6,436,549
$28,813,439
$969,178
$29,782,617
$496,686
$0
$0
$4,265,947
$4,265,947
2016
8,260
1,261
Aa3
3.5%
0.1%
$1,270,545,275
22.47
$912,861,548
31.20
$28,544,380
99.0%
96.1%
$28,685,674
$2,134,441
$31,270,809
$0
$31,270,809
$23,465,940
$6,222,239
$29,688,179
$1,047,200
$30,735,379
$535,430
$0
$128,000
$4,673,377
$4,801,377
8,358
1,346
Aa3
6.0%
0.1%
2012
$1,272,219,726
19.75
$890,333,108
28.23
$25,123,509
98.7%
95.3%
$25,282,077
$2,197,636
$27,932,516
$110,000
$28,042,516
$20,170,062
$6,063,851
$26,233,913
$1,185,102
$27,419,015
$623,501
$0
$0
$3,195,092
Committed $0 $0
Nonspendable $0 $0 $0
$0
$3,195,092
$0
$0$0
$0
$3,769,261
Restricted
Assigned
Unassigned
$10,297,383
$260,586
$8,082,681
$254,285
Bonded Long-Term Debt
Annual Debt Service
$9,163,167
$49,921
$11,202,332
$164,982
$9,216,645
$257,785

HAMDEN
Bond Rating (Moody's, as of July 1)
Population (State Dept. of Public Health)
Equalized Net Grand List
Equalized Mill Rate
Mill Rate
Total Revenues
Intergovernmental Revenues
Current Year Collection %
Total Expenditures
Education Expenditures
Unemployment (Annual Average)
School Enrollment (State Education Dept.)
TANF Recipients (As a % of Population)
Total Fund Balance (Deficit)
Total Expenditures and Other Financing Uses
Total Revenues and Other Financing Sources
Grand List Data
Property Tax Collection Data
Property Tax Revenues
Net Change In Fund Balance
FISCAL YEARS ENDED 2012 TO 2016
Operating Expenditures
Current Year Adjusted Tax Levy
Net Grand List
Economic Data
Operating Results - General Fund
Fund Balance - General Fund
Total Taxes Collected as a % of Total Outstanding
D - 63
Total Transfers In From Other Funds
Debt Measures
Total Transfers Out To Other Funds
2015
61,607
6,763
A3
6.8%
0.8%
2013
$5,517,481,552
27.14
$4,048,765,885
37.14
$149,765,959
98.5%
97.3%
$149,054,322
$45,338,028
$200,852,851
$398,562
$202,117,571
$91,359,833
$109,709,468
$201,069,301
$554,191
$201,623,492
$494,079
$0
$1,135
$1,687,935
$1,689,070
2014
61,422
6,707
A3
5.8%
0.8%
$5,513,135,592
28.57
$4,062,588,948
38.94
$157,517,657
98.4%
96.9%
$157,520,523
$43,373,808
$208,952,934
$0
$208,952,934
$91,700,269
$116,244,395
$207,944,664
$480,000
$208,424,664
$528,270
$0
$1,135
$2,217,340
61,218
6,529
Baa1
5.1%
0.7%
$5,469,363,955
29.30
$4,072,325,628
39.93
$160,274,044
98.6%
97.2%
$162,646,202
$37,141,207
$206,809,203
$1,037,259
$331,136,620
$84,858,213
$123,147,773
$208,005,986
$122,303,087
$330,309,073
$827,547
$0
$0
$3,043,752
$3,043,752
2016
61,125
6,434
Baa1
4.6%
0.7%
$5,578,004,424
29.82
$4,075,516,582
40.87
$166,314,670
98.7%
97.0%
$166,677,729
$44,146,760
$217,509,730
$363,255
$220,067,985
$94,446,338
$128,104,698
$222,551,036
$0
$222,551,036
($2,483,051)
$0
$0
$2,960,701
$2,960,701
60,863
6,770
A3
7.5%
0.7%
2012
$5,754,354,481
24.16
$4,022,975,958
34.77
$139,022,100
98.9%
97.7%
$139,969,770
$42,518,172
$188,285,326
$587,527
$203,399,467
$87,773,548
$101,422,935
$189,196,483
$0
$202,762,040
$637,427
$0
$0
$1,194,991
Committed $0 $0
Nonspendable $0 $0 $0
$0
$1,194,991
$0
$0$0
$0
$2,216,205
Restricted
Assigned
Unassigned
$119,040,000
$16,213,367
$292,220,000
$22,139,790
Bonded Long-Term Debt
Annual Debt Service
$143,213,863
$15,140,304
$129,975,000
$16,280,508
$262,270,000
$14,183,868

HAMPTON
Bond Rating (Moody's, as of July 1)
Population (State Dept. of Public Health)
Equalized Net Grand List
Equalized Mill Rate
Mill Rate
Total Revenues
Intergovernmental Revenues
Current Year Collection %
Total Expenditures
Education Expenditures
Unemployment (Annual Average)
School Enrollment (State Education Dept.)
TANF Recipients (As a % of Population)
Total Fund Balance (Deficit)
Total Expenditures and Other Financing Uses
Total Revenues and Other Financing Sources
Grand List Data
Property Tax Collection Data
Property Tax Revenues
Net Change In Fund Balance
FISCAL YEARS ENDED 2012 TO 2016
Operating Expenditures
Current Year Adjusted Tax Levy
Net Grand List
Economic Data
Operating Results - General Fund
Fund Balance - General Fund
Total Taxes Collected as a % of Total Outstanding
D - 64
Total Transfers In From Other Funds
Debt Measures
Total Transfers Out To Other Funds
2015
1,868
196
9.3%
0.4%
2013
$203,292,220
18.73
$154,233,737
24.80
$3,807,734
97.7%
94.7%
$3,829,812
$1,839,568
$5,783,201
$0
$5,783,201
$4,051,240
$1,566,853
$5,618,093
$351,336
$5,969,429
($186,228)
$13,695
$19,628
$988,332
$1,078,098
2014
1,859
191
6.2%
0.5%
$188,468,025
20.40
$155,670,037
24.80
$3,845,612
98.8%
97.5%
$4,015,434
$1,929,150
$6,069,929
$0
$6,069,929
$4,126,273
$2,110,001
$6,236,274
$112,103
$6,348,377
($278,448)
$6,910
$233,954
$799,649
1,849
183
5.3%
0.4%
$178,744,406
20.74
$125,064,590
29.73
$3,706,953
98.7%
97.9%
$3,721,971
$1,926,316
$5,741,527
$0
$5,754,081
$4,095,928
$1,480,202
$5,576,130
$372,146
$5,948,276
($194,195)
$0
$11,700
$525,355
$556,751
2016
1,837
175
5.0%
0.4%
$179,533,474
21.28
$125,742,991
30.51
$3,819,867
98.7%
98.2%
$3,838,258
$1,868,853
$5,830,313
$0
$5,830,313
$4,090,389
$1,315,427
$5,405,816
$161,844
$5,567,660
$262,653
$0
$0
$812,442
$819,404
1,869
195
10.0%
0.2%
2012
$208,128,935
18.18
$153,546,826
24.80
$3,783,591
97.7%
95.1%
$3,793,257
$1,831,240
$5,742,996
$0
$5,742,996
$4,143,921
$1,383,456
$5,527,377
$208,000
$5,735,377
$7,619
$8,948
$114,840
$1,264,326
Committed $0 $0
Nonspendable $6,962 $19,696 $58,542
$0
$1,081,996
$0
$56,443$54,562
$0
$504,223
Restricted
Assigned
Unassigned
$0
$665,546
$0
$0
Bonded Long-Term Debt
Annual Debt Service
$833,979
$78,631
$658,849
$182,367
$10,723
$0

HARTFORD
Bond Rating (Moody's, as of July 1)
Population (State Dept. of Public Health)
Equalized Net Grand List
Equalized Mill Rate
Mill Rate
Total Revenues
Intergovernmental Revenues
Current Year Collection %
Total Expenditures
Education Expenditures
Unemployment (Annual Average)
School Enrollment (State Education Dept.)
TANF Recipients (As a % of Population)
Total Fund Balance (Deficit)
Total Expenditures and Other Financing Uses
Total Revenues and Other Financing Sources
Grand List Data
Property Tax Collection Data
Property Tax Revenues
Net Change In Fund Balance
FISCAL YEARS ENDED 2012 TO 2016
Operating Expenditures
Current Year Adjusted Tax Levy
Net Grand List
Economic Data
Operating Results - General Fund
Fund Balance - General Fund
Total Taxes Collected as a % of Total Outstanding
D - 65
Total Transfers In From Other Funds
Debt Measures
Total Transfers Out To Other Funds
2015
125,017
21,656
A1
14.3%
4.3%
2013
$6,526,348,965
37.93
$3,398,455,123
74.29
$247,520,000
94.6%
85.6%
$255,546,000
$280,695,000
$549,643,000
$5,928,000
$562,082,000
$314,620,000
$206,957,000
$521,577,000
$40,240,000
$561,817,000
$265,000
$0
$2,850,000
$27,528,000
$30,378,000
2014
124,705
21,784
A1
12.2%
4.6%
$6,888,293,807
36.13
$3,484,646,856
74.29
$248,851,000
95.0%
84.8%
$256,765,000
$286,236,000
$557,359,000
$10,430,000
$567,789,000
$321,535,000
$232,883,000
$554,418,000
$26,868,000
$581,286,000
($13,497,000)
$0
$3,859,000
$16,881,000
124,006
21,597
A3
10.6%
4.5%
$6,877,950,983
36.86
$3,531,344,777
74.29
$253,546,000
96.0%
85.1%
$260,640,000
$289,332,000
$566,606,000
$21,150,000
$587,756,000
$326,647,000
$244,374,000
$571,021,000
$11,690,000
$582,711,000
$5,045,000
$0
$1,712,000
$20,214,000
$21,926,000
2016
123,243
21,524
Baa1
9.4%
4.0%
$6,496,073,222
40.47
$3,619,341,714
74.29
$262,887,000
95.7%
85.7%
$266,870,000
$282,708,000
$565,580,000
$5,438,000
$571,018,000
$323,155,000
$242,599,000
$565,754,000
$13,059,000
$578,813,000
($7,795,000)
$0
$8,663,000
$5,468,000
$14,131,000
124,893
21,107
A1
15.1%
4.6%
2012
$7,147,577,757
38.96
$3,738,377,678
71.79
$278,481,000
93.8%
86.1%
$277,245,000
$280,582,000
$573,734,000
$2,285,000
$576,574,000
$313,069,000
$219,557,000
$532,626,000
$38,921,000
$571,547,000
$5,027,000
$0
$4,332,000
$30,113,000
Committed $0 $0
Nonspendable $0 $0 $0
$0
$25,781,000
$0
$0$0
$0
$13,022,000
Restricted
Assigned
Unassigned
$527,911,000
$54,318,000
$698,625,000
$77,504,000
Bonded Long-Term Debt
Annual Debt Service
$337,080,000
$39,647,000
$487,546,000
$45,245,000
$581,093,000
$49,302,000

HARTLAND
Bond Rating (Moody's, as of July 1)
Population (State Dept. of Public Health)
Equalized Net Grand List
Equalized Mill Rate
Mill Rate
Total Revenues
Intergovernmental Revenues
Current Year Collection %
Total Expenditures
Education Expenditures
Unemployment (Annual Average)
School Enrollment (State Education Dept.)
TANF Recipients (As a % of Population)
Total Fund Balance (Deficit)
Total Expenditures and Other Financing Uses
Total Revenues and Other Financing Sources
Grand List Data
Property Tax Collection Data
Property Tax Revenues
Net Change In Fund Balance
FISCAL YEARS ENDED 2012 TO 2016
Operating Expenditures
Current Year Adjusted Tax Levy
Net Grand List
Economic Data
Operating Results - General Fund
Fund Balance - General Fund
Total Taxes Collected as a % of Total Outstanding
D - 66
Total Transfers In From Other Funds
Debt Measures
Total Transfers Out To Other Funds
2015
2,131
300
A1
5.7%
0.0%
2013
$277,715,086
16.85
$194,348,560
24.00
$4,678,964
98.6%
96.7%
$4,781,424
$1,979,176
$6,876,771
$26
$6,876,797
$4,906,068
$1,424,407
$6,330,475
$448,626
$6,779,101
$97,696
$0
$161,875
$963,260
$1,125,135
2014
2,129
287
A1
5.1%
0.0%
$288,386,501
16.58
$195,097,545
24.50
$4,780,653
98.8%
97.2%
$4,777,434
$2,122,498
$7,003,552
$2,519
$7,006,071
$5,134,598
$1,540,093
$6,674,691
$259,787
$6,934,478
$71,593
$0
$183,892
$1,196,728
2,127
273
A1
4.7%
0.1%
$284,267,166
17.03
$197,159,605
24.50
$4,840,263
98.7%
96.8%
$4,839,989
$2,106,326
$7,052,473
$19
$7,052,492
$5,167,038
$1,520,637
$6,687,675
$218,905
$6,906,580
$145,912
$0
$270,913
$1,071,727
$1,342,640
2016
2,117
275
A1
4.0%
0.1%
$280,259,620
17.86
$196,621,980
25.50
$5,005,582
98.4%
94.8%
$4,981,951
$2,157,298
$7,258,256
$19
$7,258,275
$5,502,205
$1,573,778
$7,075,983
$279,693
$7,355,676
($97,401)
$0
$530,127
$715,112
$1,245,239
2,132
319
A1
6.3%
0.1%
2012
$261,420,906
17.84
$197,939,734
23.50
$4,663,158
98.3%
96.8%
$4,638,279
$2,004,355
$6,737,652
$56
$6,737,708
$4,786,648
$1,389,746
$6,176,394
$427,989
$6,604,383
$133,325
$0
$188,687
$1,027,439
Committed $0 $0
Nonspendable $0 $0 $0
$0
$838,752
$0
$0$0
$0
$1,012,836
Restricted
Assigned
Unassigned
$904,669
$212,763
$615,256
$119,913
Bonded Long-Term Debt
Annual Debt Service
$1,346,821
$221,302
$830,793
$217,027
$760,739
$124,283

HARWINTON
Bond Rating (Moody's, as of July 1)
Population (State Dept. of Public Health)
Equalized Net Grand List
Equalized Mill Rate
Mill Rate
Total Revenues
Intergovernmental Revenues
Current Year Collection %
Total Expenditures
Education Expenditures
Unemployment (Annual Average)
School Enrollment (State Education Dept.)
TANF Recipients (As a % of Population)
Total Fund Balance (Deficit)
Total Expenditures and Other Financing Uses
Total Revenues and Other Financing Sources
Grand List Data
Property Tax Collection Data
Property Tax Revenues
Net Change In Fund Balance
FISCAL YEARS ENDED 2012 TO 2016
Operating Expenditures
Current Year Adjusted Tax Levy
Net Grand List
Economic Data
Operating Results - General Fund
Fund Balance - General Fund
Total Taxes Collected as a % of Total Outstanding
D - 67
Total Transfers In From Other Funds
Debt Measures
Total Transfers Out To Other Funds
2015
5,593
904
5.8%
0.2%
2013
$790,175,622
17.39
$565,625,094
24.60
$13,738,679
99.2%
98.5%
$13,779,484
$3,550,473
$17,631,380
$0
$17,631,380
$11,880,886
$5,313,177
$17,194,063
$255,914
$17,449,977
$181,403
$0
$0
$3,002,481
$3,002,481
2014
5,531
903
5.1%
0.2%
$760,025,199
18.14
$564,695,831
24.60
$13,786,458
99.5%
98.8%
$13,994,883
$3,141,286
$17,440,464
$0
$17,440,464
$12,006,633
$5,093,037
$17,099,670
$223,976
$17,323,646
$116,818
$0
$0
$3,119,299
5,493
853
4.3%
0.1%
$773,110,450
18.60
$541,079,975
26.90
$14,381,702
99.6%
99.2%
$14,439,088
$3,214,735
$17,929,121
$0
$17,929,121
$12,639,441
$5,231,160
$17,870,601
$265,193
$18,135,794
($206,673)
$0
$0
$2,912,626
$2,912,626
2016
5,466
840
4.1%
0.0%
$772,997,339
19.14
$537,388,702
27.30
$14,792,710
99.4%
98.9%
$14,835,273
$3,075,342
$18,192,161
$17,260
$18,209,421
$12,727,809
$4,744,630
$17,472,439
$987,997
$18,460,436
($251,015)
$0
$0
$2,661,611
$2,661,611
5,600
915
6.6%
0.1%
2012
$748,162,896
17.71
$553,918,475
23.90
$13,248,909
98.8%
97.9%
$13,787,053
$3,010,249
$17,057,404
$9,780
$17,067,184
$11,389,097
$4,937,685
$16,326,782
$332,000
$16,658,782
$408,402
$0
$0
$2,821,078
Committed $0 $0
Nonspendable $0 $0 $0
$0
$2,821,078
$0
$0$0
$0
$3,119,299
Restricted
Assigned
Unassigned
$6,933,541
$0
$5,911,175
$0
Bonded Long-Term Debt
Annual Debt Service
$7,986,311
$200,000
$7,483,437
$200,000
$6,570,390
$0

HEBRON
Bond Rating (Moody's, as of July 1)
Population (State Dept. of Public Health)
Equalized Net Grand List
Equalized Mill Rate
Mill Rate
Total Revenues
Intergovernmental Revenues
Current Year Collection %
Total Expenditures
Education Expenditures
Unemployment (Annual Average)
School Enrollment (State Education Dept.)
TANF Recipients (As a % of Population)
Total Fund Balance (Deficit)
Total Expenditures and Other Financing Uses
Total Revenues and Other Financing Sources
Grand List Data
Property Tax Collection Data
Property Tax Revenues
Net Change In Fund Balance
FISCAL YEARS ENDED 2012 TO 2016
Operating Expenditures
Current Year Adjusted Tax Levy
Net Grand List
Economic Data
Operating Results - General Fund
Fund Balance - General Fund
Total Taxes Collected as a % of Total Outstanding
D - 68
Total Transfers In From Other Funds
Debt Measures
Total Transfers Out To Other Funds
2015
9,588
2,008
Aa2
5.3%
0.1%
2013
$1,097,934,379
23.60
$768,127,730
33.55
$25,914,117
98.5%
96.4%
$26,016,823
$8,839,751
$35,956,527
$298,370
$37,557,919
$26,945,745
$8,878,221
$35,823,966
$551,700
$36,375,666
$1,182,253
$0
$337,742
$4,123,853
$4,461,595
2014
9,564
1,896
Aa2
4.8%
0.1%
$1,080,916,746
24.93
$772,648,505
34.70
$26,944,807
98.3%
96.2%
$27,078,435
$8,990,878
$36,861,972
$243,000
$40,874,459
$27,866,472
$7,925,339
$35,791,811
$727,457
$39,863,341
$1,011,118
$0
$262,071
$5,472,713
9,552
1,772
4.0%
0.1%
$1,112,632,087
25.21
$778,644,080
35.75
$28,045,844
98.4%
95.8%
$28,024,898
$9,032,190
$38,163,594
$185,000
$38,488,594
$28,797,677
$7,995,591
$36,793,268
$833,265
$37,626,533
$862,061
$0
$525,116
$5,809,658
$6,334,774
2016
9,529
1,664
3.5%
0.1%
$1,102,908,486
25.70
$782,001,450
36.00
$28,344,010
97.9%
94.5%
$28,191,796
$8,840,024
$38,063,202
$72,845
$38,236,047
$28,289,109
$8,523,993
$36,813,102
$735,201
$37,548,303
$687,744
$0
$372,486
$6,650,032
$7,022,518
9,624
2,081
Aa2
5.9%
0.1%
2012
$1,115,238,901
23.65
$868,218,820
30.26
$26,370,297
98.5%
96.8%
$26,356,371
$8,531,099
$35,729,535
$474,029
$36,259,320
$26,592,584
$8,208,253
$34,800,837
$1,091,544
$35,892,381
$366,939
$0
$194,396
$3,279,342
Committed $0 $0
Nonspendable $0 $0 $0
$0
$3,084,946
$0
$0$0
$0
$5,210,642
Restricted
Assigned
Unassigned
$18,807,303
$1,141,036
$14,990,197
$1,168,294
Bonded Long-Term Debt
Annual Debt Service
$20,006,360
$1,930,732
$19,623,550
$1,233,882
$16,973,793
$1,118,549

KENT
Bond Rating (Moody's, as of July 1)
Population (State Dept. of Public Health)
Equalized Net Grand List
Equalized Mill Rate
Mill Rate
Total Revenues
Intergovernmental Revenues
Current Year Collection %
Total Expenditures
Education Expenditures
Unemployment (Annual Average)
School Enrollment (State Education Dept.)
TANF Recipients (As a % of Population)
Total Fund Balance (Deficit)
Total Expenditures and Other Financing Uses
Total Revenues and Other Financing Sources
Grand List Data
Property Tax Collection Data
Property Tax Revenues
Net Change In Fund Balance
FISCAL YEARS ENDED 2012 TO 2016
Operating Expenditures
Current Year Adjusted Tax Levy
Net Grand List
Economic Data
Operating Results - General Fund
Fund Balance - General Fund
Total Taxes Collected as a % of Total Outstanding
D - 69
Total Transfers In From Other Funds
Debt Measures
Total Transfers Out To Other Funds
2015
2,939
317
Aa2
5.7%
0.0%
2013
$686,205,494
13.76
$665,620,489
14.27
$9,440,500
99.0%
97.0%
$9,553,319
$1,012,520
$10,946,660
$37,836
$10,984,496
$7,045,914
$3,430,162
$10,476,076
$923,474
$11,399,550
($415,054)
$0
$350,000
$2,195,230
$2,545,230
2014
2,910
315
Aa2
4.4%
0.1%
$701,869,675
13.77
$671,859,145
14.45
$9,663,170
99.0%
97.1%
$9,723,285
$1,205,585
$11,395,754
$27,953
$11,423,707
$7,016,016
$3,855,805
$10,871,821
$777,400
$11,649,221
($225,514)
$0
$408,859
$2,319,716
2,869
298
Aa2
4.2%
0.0%
$846,627,927
11.88
$592,540,429
17.03
$10,055,555
98.8%
97.0%
$10,140,221
$1,119,596
$11,661,625
$35,832
$12,561,457
$7,188,717
$3,846,233
$11,034,950
$1,692,950
$12,727,900
($166,443)
$0
$0
$1,909,011
$2,153,273
2016
2,819
292
Aa2
3.9%
0.0%
$838,582,024
12.61
$594,416,601
17.86
$10,576,296
99.3%
98.8%
$10,642,697
$943,886
$12,019,962
$62,727
$12,082,689
$7,278,670
$3,858,388
$11,137,058
$758,700
$11,895,758
$186,931
$0
$0
$2,038,661
$2,340,204
2,951
339
Aa2
6.3%
0.2%
2012
$810,280,827
11.56
$660,005,006
14.27
$9,367,480
98.8%
96.7%
$9,483,970
$795,244
$10,682,291
$24,009
$14,814,361
$6,691,378
$3,488,263
$10,179,641
$588,426
$14,797,021
$17,340
$0
$638,000
$2,960,284
Committed $288,428 $244,262
Nonspendable $13,115 $0 $0
$0
$2,322,284
$0
$0$0
$0
$1,910,857
Restricted
Assigned
Unassigned
$4,415,940
$696,438
$3,874,899
$693,194
Bonded Long-Term Debt
Annual Debt Service
$5,502,328
$826,463
$5,204,239
$714,354
$4,542,426
$672,788

KILLINGLY
Bond Rating (Moody's, as of July 1)
Population (State Dept. of Public Health)
Equalized Net Grand List
Equalized Mill Rate
Mill Rate
Total Revenues
Intergovernmental Revenues
Current Year Collection %
Total Expenditures
Education Expenditures
Unemployment (Annual Average)
School Enrollment (State Education Dept.)
TANF Recipients (As a % of Population)
Total Fund Balance (Deficit)
Total Expenditures and Other Financing Uses
Total Revenues and Other Financing Sources
Grand List Data
Property Tax Collection Data
Property Tax Revenues
Net Change In Fund Balance
FISCAL YEARS ENDED 2012 TO 2016
Operating Expenditures
Current Year Adjusted Tax Levy
Net Grand List
Economic Data
Operating Results - General Fund
Fund Balance - General Fund
Total Taxes Collected as a % of Total Outstanding
D - 70
Total Transfers In From Other Funds
Debt Measures
Total Transfers Out To Other Funds
2015
17,233
2,488
Aa2
9.5%
1.1%
2013
$1,491,814,232
19.21
$1,365,179,309
19.70
$28,651,840
97.6%
95.9%
$28,731,952
$22,056,094
$54,327,437
$503,571
$54,831,008
$42,666,655
$11,965,645
$54,632,300
$1,245,800
$55,878,100
($1,047,092)
$0
$1,008,783
$6,962,390
$8,427,717
2014
17,172
2,421
Aa3
7.9%
1.3%
$1,597,543,143
19.03
$1,336,287,490
20.70
$30,395,902
97.6%
96.0%
$30,568,731
$22,203,161
$57,003,009
$721,080
$59,034,075
$43,637,467
$13,892,633
$57,530,100
$1,170,020
$58,700,120
$333,955
$0
$1,210,700
$8,761,672
17,131
2,327
Aa3
7.0%
1.3%
$1,558,606,470
20.27
$1,084,341,779
26.51
$31,596,382
97.6%
95.8%
$31,633,701
$22,516,265
$58,194,105
$844,656
$64,116,650
$44,202,229
$13,113,454
$57,315,683
$1,187,608
$63,089,447
$1,027,203
$0
$1,037,747
$8,548,781
$9,788,875
2016
17,069
2,412
Aa3
6.0%
0.9%
$1,657,995,334
19.92
$1,106,789,534
27.31
$33,021,360
97.8%
95.7%
$33,225,714
$22,398,430
$59,682,387
$931,049
$72,791,340
$44,815,164
$13,365,455
$58,180,619
$5,516,567
$71,053,346
$1,737,994
$0
$1,326,320
$9,958,897
$11,526,869
17,269
2,549
Aa2
10.4%
1.1%
2012
$1,626,787,833
17.22
$1,311,450,736
19.20
$28,005,174
97.8%
96.2%
$28,019,655
$21,912,766
$52,931,804
$500,815
$53,481,008
$41,301,709
$12,358,414
$53,660,123
$1,239,870
$54,899,993
($1,418,985)
$0
$1,686,171
$9,474,809
Committed $241,652 $202,347
Nonspendable $0 $0 $0
$373,778
$7,414,860
$456,544
$0$0
$455,722
$7,095,250
Restricted
Assigned
Unassigned
$31,118,366
$2,793,875
$34,040,613
$2,923,075
Bonded Long-Term Debt
Annual Debt Service
$26,420,696
$2,748,347
$32,201,022
$2,756,361
$31,480,685
$3,032,151

KILLINGWORTH
Bond Rating (Moody's, as of July 1)
Population (State Dept. of Public Health)
Equalized Net Grand List
Equalized Mill Rate
Mill Rate
Total Revenues
Intergovernmental Revenues
Current Year Collection %
Total Expenditures
Education Expenditures
Unemployment (Annual Average)
School Enrollment (State Education Dept.)
TANF Recipients (As a % of Population)
Total Fund Balance (Deficit)
Total Expenditures and Other Financing Uses
Total Revenues and Other Financing Sources
Grand List Data
Property Tax Collection Data
Property Tax Revenues
Net Change In Fund Balance
FISCAL YEARS ENDED 2012 TO 2016
Operating Expenditures
Current Year Adjusted Tax Levy
Net Grand List
Economic Data
Operating Results - General Fund
Fund Balance - General Fund
Total Taxes Collected as a % of Total Outstanding
D - 71
Total Transfers In From Other Funds
Debt Measures
Total Transfers Out To Other Funds
2015
6,490
984
Aa2
5.6%
0.1%
2013
$1,021,230,811
17.34
$714,579,555
24.78
$17,712,046
99.3%
99.0%
$17,782,133
$2,869,250
$21,038,483
$0
$21,038,483
$16,611,324
$3,773,472
$20,384,796
$418,271
$20,803,067
$235,416
$0
$0
$3,409,819
$3,409,819
2014
6,490
962
Aa2
4.7%
0.1%
$970,463,261
18.04
$713,809,345
24.53
$17,507,905
99.2%
99.0%
$17,585,956
$2,730,733
$20,681,148
$0
$20,681,148
$15,777,424
$3,864,985
$19,642,409
$436,500
$20,078,909
$602,239
$0
$0
$4,012,058
6,455
912
Aa2
3.9%
0.1%
$1,053,407,032
16.75
$718,731,799
24.53
$17,639,742
99.3%
99.1%
$17,689,778
$2,757,662
$20,892,606
$622,405
$21,515,011
$15,957,890
$4,565,946
$20,523,836
$1,164,341
$21,688,177
($173,166)
$0
$0
$3,838,892
$3,838,892
2016
6,419
903
Aa2
3.4%
0.1%
$1,031,946,948
17.67
$722,716,487
25.23
$18,238,258
99.5%
99.3%
$18,305,235
$2,670,217
$21,349,428
$1,273,231
$22,622,659
$16,417,262
$4,117,614
$20,534,876
$1,788,984
$22,323,860
$298,799
$0
$0
$4,704,214
$4,704,214
6,504
1,067
Aa2
5.8%
0.1%
2012
$1,010,340,966
18.47
$818,293,169
22.77
$18,657,771
99.3%
99.0%
$18,724,175
$2,722,055
$21,798,520
$0
$21,798,520
$16,985,013
$3,745,246
$20,730,259
$445,500
$21,175,759
$622,761
$0
$90,000
$3,174,403
Committed $0 $0
Nonspendable $0 $0 $0
$200,000
$2,884,403
$0
$0$0
$0
$4,012,058
Restricted
Assigned
Unassigned
$9,861,473
$267,559
$7,722,319
$510,659
Bonded Long-Term Debt
Annual Debt Service
$10,132,101
$281,122
$8,960,623
$274,341
$8,866,252
$287,559

LEBANON
Bond Rating (Moody's, as of July 1)
Population (State Dept. of Public Health)
Equalized Net Grand List
Equalized Mill Rate
Mill Rate
Total Revenues
Intergovernmental Revenues
Current Year Collection %
Total Expenditures
Education Expenditures
Unemployment (Annual Average)
School Enrollment (State Education Dept.)
TANF Recipients (As a % of Population)
Total Fund Balance (Deficit)
Total Expenditures and Other Financing Uses
Total Revenues and Other Financing Sources
Grand List Data
Property Tax Collection Data
Property Tax Revenues
Net Change In Fund Balance
FISCAL YEARS ENDED 2012 TO 2016
Operating Expenditures
Current Year Adjusted Tax Levy
Net Grand List
Economic Data
Operating Results - General Fund
Fund Balance - General Fund
Total Taxes Collected as a % of Total Outstanding
D - 72
Total Transfers In From Other Funds
Debt Measures
Total Transfers Out To Other Funds
2015
7,319
1,142
6.9%
0.5%
2013
$839,856,300
18.82
$665,504,785
23.60
$15,807,401
97.9%
97.0%
$15,528,089
$7,708,327
$24,353,640
$262
$24,353,902
$18,810,571
$3,563,828
$22,374,399
$807,130
$23,281,529
$1,072,373
$0
$0
$3,789,965
$3,885,986
2014
7,309
1,136
5.8%
0.4%
$843,273,018
19.25
$675,482,689
23.90
$16,231,351
97.8%
97.0%
$15,926,823
$8,160,496
$25,077,972
$270
$25,078,242
$19,604,569
$3,776,388
$23,380,957
$1,348,694
$24,729,651
$348,591
$0
$0
$4,234,577
7,259
1,077
4.9%
0.4%
$844,437,123
19.79
$590,664,476
28.20
$16,712,027
97.9%
96.9%
$16,213,731
$7,844,678
$25,207,965
$192,020
$25,399,985
$19,618,104
$3,933,097
$23,551,201
$2,130,882
$25,682,083
($282,098)
$0
$0
$3,870,010
$3,952,479
2016
7,197
1,027
4.5%
0.2%
$874,191,847
20.09
$607,415,900
28.70
$17,562,596
97.9%
96.7%
$17,703,245
$8,173,948
$27,215,422
$32,021
$27,247,443
$20,035,732
$4,039,849
$24,075,581
$2,138,619
$26,214,200
$1,033,243
$0
$280,098
$4,704,364
$4,986,470
7,326
1,186
8.0%
0.4%
2012
$870,115,361
17.31
$658,930,140
22.80
$15,058,644
97.7%
97.0%
$14,797,966
$7,764,509
$23,843,755
$750,067
$24,593,822
$18,954,614
$3,663,502
$22,618,116
$1,236,082
$23,854,198
$739,624
$0
$0
$2,813,613
Committed $0 $0
Nonspendable $2,008 $82,469 $25,294
$0
$2,788,319
$0
$96,021$148,770
$100,000
$3,985,807
Restricted
Assigned
Unassigned
$3,151,043
$721,944
$2,282,455
$612,637
Bonded Long-Term Debt
Annual Debt Service
$3,660,535
$794,057
$8,469,081
$5,748,840
$2,594,807
$804,840

LEDYARD
Bond Rating (Moody's, as of July 1)
Population (State Dept. of Public Health)
Equalized Net Grand List
Equalized Mill Rate
Mill Rate
Total Revenues
Intergovernmental Revenues
Current Year Collection %
Total Expenditures
Education Expenditures
Unemployment (Annual Average)
School Enrollment (State Education Dept.)
TANF Recipients (As a % of Population)
Total Fund Balance (Deficit)
Total Expenditures and Other Financing Uses
Total Revenues and Other Financing Sources
Grand List Data
Property Tax Collection Data
Property Tax Revenues
Net Change In Fund Balance
FISCAL YEARS ENDED 2012 TO 2016
Operating Expenditures
Current Year Adjusted Tax Levy
Net Grand List
Economic Data
Operating Results - General Fund
Fund Balance - General Fund
Total Taxes Collected as a % of Total Outstanding
D - 73
Total Transfers In From Other Funds
Debt Measures
Total Transfers Out To Other Funds
2015
15,094
2,526
Aa2
6.8%
0.4%
2013
$1,495,867,237
20.31
$1,099,086,255
27.93
$30,378,451
98.5%
98.0%
$30,453,940
$18,857,628
$52,592,944
$485,980
$53,078,924
$32,958,749
$18,006,109
$50,964,858
$1,793,876
$52,758,734
$320,190
$0
$100,000
$4,082,361
$4,182,361
2014
15,121
2,509
Aa2
5.6%
0.4%
$1,480,806,732
20.90
$1,108,546,974
28.20
$30,941,463
98.8%
98.2%
$31,529,198
$19,454,185
$54,166,873
$572,517
$54,739,390
$33,978,236
$19,046,539
$53,024,775
$1,664,413
$54,689,188
$50,202
$0
$100,000
$4,232,563
15,025
2,459
Aa2
5.0%
0.5%
$1,562,200,147
21.24
$1,117,505,433
29.90
$33,183,288
98.8%
98.1%
$33,216,692
$19,897,568
$56,284,947
$579,081
$56,864,028
$34,539,230
$21,291,405
$55,830,635
$1,512,283
$57,342,918
($478,890)
$0
$100,000
$3,653,673
$3,753,673
2016
14,911
2,366
Aa2
4.2%
0.4%
$1,558,015,973
21.84
$1,126,986,721
30.40
$34,034,766
98.8%
98.0%
$34,123,182
$19,668,223
$57,019,984
$585,536
$66,110,932
$34,275,724
$21,087,896
$55,363,620
$1,935,140
$65,723,509
$387,423
$0
$100,000
$4,041,096
$4,141,096
15,077
2,529
Aa2
7.3%
0.4%
2012
$1,560,175,001
19.38
$1,091,877,538
27.93
$30,231,449
98.8%
98.4%
$30,349,274
$18,750,904
$51,666,931
$786,222
$52,453,153
$32,771,856
$17,587,207
$50,359,063
$1,758,792
$52,117,855
$335,298
$0
$250,000
$3,862,171
Committed $0 $0
Nonspendable $0 $0 $0
$0
$3,612,171
$0
$0$0
$0
$4,132,563
Restricted
Assigned
Unassigned
$15,570,616
$1,700,532
$19,715,434
$1,690,143
Bonded Long-Term Debt
Annual Debt Service
$13,429,913
$1,642,953
$17,025,911
$1,628,076
$14,708,700
$1,771,719

LISBON
Bond Rating (Moody's, as of July 1)
Population (State Dept. of Public Health)
Equalized Net Grand List
Equalized Mill Rate
Mill Rate
Total Revenues
Intergovernmental Revenues
Current Year Collection %
Total Expenditures
Education Expenditures
Unemployment (Annual Average)
School Enrollment (State Education Dept.)
TANF Recipients (As a % of Population)
Total Fund Balance (Deficit)
Total Expenditures and Other Financing Uses
Total Revenues and Other Financing Sources
Grand List Data
Property Tax Collection Data
Property Tax Revenues
Net Change In Fund Balance
FISCAL YEARS ENDED 2012 TO 2016
Operating Expenditures
Current Year Adjusted Tax Levy
Net Grand List
Economic Data
Operating Results - General Fund
Fund Balance - General Fund
Total Taxes Collected as a % of Total Outstanding
D - 74
Total Transfers In From Other Funds
Debt Measures
Total Transfers Out To Other Funds
2015
4,348
625
Aa3
7.3%
0.6%
2013
$548,596,973
13.15
$367,489,421
19.60
$7,211,327
98.3%
97.4%
$7,309,881
$4,920,021
$13,571,166
$0
$13,571,166
$10,327,874
$2,857,213
$13,185,087
$208,123
$13,393,210
$177,956
$47,346
$22,753
$2,337,397
$2,407,496
2014
4,342
619
Aa3
6.7%
0.4%
$565,256,731
12.66
$368,210,844
19.40
$7,154,693
98.5%
97.5%
$7,235,811
$5,004,354
$13,544,075
$14,622
$14,462,467
$10,157,341
$4,087,280
$14,244,621
$215,000
$14,459,621
$2,846
$40,033
$87,126
$2,410,341
4,310
594
Aa3
6.1%
0.2%
$510,510,496
14.16
$369,429,683
19.50
$7,228,592
98.1%
97.0%
$7,282,764
$4,945,024
$13,554,191
$0
$14,412,772
$10,201,601
$3,923,343
$14,124,944
$517,200
$14,642,144
($229,372)
$44,723
$328,179
$1,808,066
$2,180,968
2016
4,281
570
Aa3
5.5%
0.4%
$555,793,822
13.08
$371,049,512
19.50
$7,268,444
98.4%
97.2%
$7,413,401
$4,942,691
$13,741,011
$173,750
$14,724,761
$10,575,891
$4,124,324
$14,700,215
$190,000
$14,890,215
($165,454)
$46,069
$311,922
$1,657,524
$2,015,515
4,355
655
Aa3
8.1%
0.4%
2012
$505,719,283
13.66
$406,919,758
16.86
$6,909,769
98.3%
97.1%
$6,997,811
$5,005,377
$13,303,995
$0
$17,059,706
$10,024,384
$3,571,930
$13,596,314
$181,376
$16,764,200
$295,506
$30,015
$166,347
$2,229,543
Committed $0 $0
Nonspendable $0 $0 $0
$0
$2,033,181
$0
$0$0
$0
$2,283,182
Restricted
Assigned
Unassigned
$3,845,000
$1,474,275
$2,805,000
$1,401,301
Bonded Long-Term Debt
Annual Debt Service
$3,936,421
$1,143,918
$4,342,031
$561,314
$3,325,000
$1,462,825

LITCHFIELD
Bond Rating (Moody's, as of July 1)
Population (State Dept. of Public Health)
Equalized Net Grand List
Equalized Mill Rate
Mill Rate
Total Revenues
Intergovernmental Revenues
Current Year Collection %
Total Expenditures
Education Expenditures
Unemployment (Annual Average)
School Enrollment (State Education Dept.)
TANF Recipients (As a % of Population)
Total Fund Balance (Deficit)
Total Expenditures and Other Financing Uses
Total Revenues and Other Financing Sources
Grand List Data
Property Tax Collection Data
Property Tax Revenues
Net Change In Fund Balance
FISCAL YEARS ENDED 2012 TO 2016
Operating Expenditures
Current Year Adjusted Tax Levy
Net Grand List
Economic Data
Operating Results - General Fund
Fund Balance - General Fund
Total Taxes Collected as a % of Total Outstanding
D - 75
Total Transfers In From Other Funds
Debt Measures
Total Transfers Out To Other Funds
2015
8,333
1,060
Aa2
5.7%
0.2%
2013
$1,425,894,469
17.30
$1,108,810,149
22.20
$24,668,000
98.0%
97.0%
$24,794,000
$3,502,000
$28,877,000
$438,000
$29,315,000
$18,545,000
$10,086,000
$28,631,000
$25,000
$28,656,000
$659,000
$0
$245,000
$5,248,000
$5,554,000
2014
8,264
1,004
Aa2
5.0%
0.2%
$1,421,529,441
17.72
$1,110,140,980
22.60
$25,183,000
98.4%
97.6%
$25,324,000
$3,729,000
$29,612,000
$428,000
$30,040,000
$18,861,000
$10,733,000
$29,594,000
$899,000
$30,493,000
($453,000)
$0
$69,000
$5,101,000
8,212
1,002
Aa2
4.2%
0.2%
$1,468,964,101
17.64
$1,027,751,389
25.20
$25,906,000
98.9%
98.0%
$26,098,000
$3,426,000
$30,108,000
$427,000
$30,605,000
$19,117,000
$10,735,000
$29,852,000
$1,081,000
$30,933,000
($328,000)
$0
$226,000
$4,476,000
$4,773,000
2016
8,175
977
Aa2
4.0%
0.2%
$1,467,022,228
18.43
$1,026,912,873
26.20
$27,038,635
98.7%
97.9%
$27,182,059
$3,694,739
$31,456,339
$59,850
$31,521,252
$20,120,031
$10,684,296
$30,804,327
$759,964
$31,564,291
($43,039)
$0
$465,792
$4,203,563
$4,729,961
8,353
1,154
Aa2
6.1%
0.2%
2012
$1,425,528,147
17.18
$1,100,594,853
22.20
$24,488,000
98.1%
97.1%
$24,652,000
$3,352,000
$28,532,000
$447,000
$28,979,000
$18,102,000
$9,806,000
$27,908,000
$353,000
$28,261,000
$718,000
$0
$522,000
$4,895,000
Committed $0 $0
Nonspendable $60,606 $71,000 $56,000
$0
$4,317,000
$0
$61,000$105,000
$0
$4,927,000
Restricted
Assigned
Unassigned
$27,149,000
$3,308,000
$21,355,000
$3,069,998
Bonded Long-Term Debt
Annual Debt Service
$29,870,000
$3,582,000
$29,594,000
$3,293,000
$25,953,000
$3,177,000

LYME
Bond Rating (Moody's, as of July 1)
Population (State Dept. of Public Health)
Equalized Net Grand List
Equalized Mill Rate
Mill Rate
Total Revenues
Intergovernmental Revenues
Current Year Collection %
Total Expenditures
Education Expenditures
Unemployment (Annual Average)
School Enrollment (State Education Dept.)
TANF Recipients (As a % of Population)
Total Fund Balance (Deficit)
Total Expenditures and Other Financing Uses
Total Revenues and Other Financing Sources
Grand List Data
Property Tax Collection Data
Property Tax Revenues
Net Change In Fund Balance
FISCAL YEARS ENDED 2012 TO 2016
Operating Expenditures
Current Year Adjusted Tax Levy
Net Grand List
Economic Data
Operating Results - General Fund
Fund Balance - General Fund
Total Taxes Collected as a % of Total Outstanding
D - 76
Total Transfers In From Other Funds
Debt Measures
Total Transfers Out To Other Funds
2015
2,401
311
5.5%
0.0%
2013
$681,950,153
11.94
$608,241,038
13.50
$8,145,402
98.6%
97.1%
$8,085,643
$375,371
$8,648,469
$3,750
$8,652,219
$5,885,453
$2,361,940
$8,247,393
$250,000
$8,497,393
$154,826
$0
$277,783
$960,986
$1,238,769
2014
2,389
298
4.7%
0.0%
$713,714,387
11.84
$608,491,084
14.00
$8,449,911
99.1%
97.7%
$8,547,287
$947,243
$9,758,139
$672,666
$13,930,805
$6,483,107
$5,480,339
$11,963,446
$252,000
$12,215,446
$1,715,359
$791,031
$1,372,526
$2,954,128
2,374
295
4.1%
0.0%
$733,857,549
11.85
$513,638,984
17.00
$8,694,963
99.1%
97.5%
$8,742,839
$427,660
$9,358,355
$446,031
$9,897,887
$6,556,450
$4,724,725
$11,281,175
$230,000
$11,511,175
($1,613,288)
$0
$300,888
$1,039,952
$1,340,840
2016
2,355
291
3.4%
0.0%
$707,481,511
12.94
$517,214,463
17.75
$9,154,210
99.1%
97.9%
$9,270,079
$525,392
$10,031,540
$87,284
$10,118,824
$6,559,697
$3,123,875
$9,683,572
$225,000
$9,908,572
$210,252
$0
$198,777
$1,352,315
$1,551,092
2,403
298
5.4%
0.1%
2012
$786,819,970
10.29
$604,728,085
13.50
$8,097,973
99.0%
98.2%
$8,117,154
$358,924
$8,691,592
$3,750
$8,695,342
$5,862,930
$2,802,121
$8,665,051
$125,000
$8,790,051
($94,709)
$0
$186,681
$1,083,943
Committed $0 $0
Nonspendable $0 $0 $0
$0
$897,262
$0
$0$0
$0
$790,571
Restricted
Assigned
Unassigned
$10,920,394
$0
$9,978,020
$453,887
Bonded Long-Term Debt
Annual Debt Service
$8,156,245
$416,086
$7,432,238
$0
$11,057,696
$492,411

MADISON
Bond Rating (Moody's, as of July 1)
Population (State Dept. of Public Health)
Equalized Net Grand List
Equalized Mill Rate
Mill Rate
Total Revenues
Intergovernmental Revenues
Current Year Collection %
Total Expenditures
Education Expenditures
Unemployment (Annual Average)
School Enrollment (State Education Dept.)
TANF Recipients (As a % of Population)
Total Fund Balance (Deficit)
Total Expenditures and Other Financing Uses
Total Revenues and Other Financing Sources
Grand List Data
Property Tax Collection Data
Property Tax Revenues
Net Change In Fund Balance
FISCAL YEARS ENDED 2012 TO 2016
Operating Expenditures
Current Year Adjusted Tax Levy
Net Grand List
Economic Data
Operating Results - General Fund
Fund Balance - General Fund
Total Taxes Collected as a % of Total Outstanding
D - 77
Total Transfers In From Other Funds
Debt Measures
Total Transfers Out To Other Funds
2015
18,297
3,380
Aaa
5.7%
0.1%
2013
$4,169,051,045
16.29
$3,453,481,910
19.77
$67,926,142
99.5%
98.8%
$67,821,393
$8,608,695
$78,692,957
$58,100
$88,385,360
$53,737,674
$22,018,885
$75,756,559
$4,200,177
$89,442,340
($1,056,980)
$0
$1,170,334
$7,801,578
$8,971,912
2014
18,259
3,291
Aaa
4.8%
0.0%
$4,351,612,899
16.15
$3,457,789,924
20.39
$70,277,425
99.5%
98.9%
$70,211,672
$9,664,222
$82,098,836
$67,100
$82,165,936
$55,604,951
$21,667,082
$77,272,033
$3,641,166
$80,913,199
$1,252,737
$0
$1,423,049
$10,224,649
18,223
3,166
Aaa
4.1%
0.1%
$4,085,765,310
17.57
$2,858,907,717
25.17
$71,781,400
99.4%
98.8%
$71,596,027
$8,665,975
$82,688,705
$64,000
$82,752,705
$55,836,777
$22,279,460
$78,116,237
$4,083,054
$82,199,291
$553,414
$0
$1,439,530
$9,338,533
$10,778,063
2016
18,151
3,029
Aaa
3.7%
0.0%
$4,211,167,689
17.46
$2,861,223,204
25.76
$73,526,539
99.6%
98.8%
$73,481,643
$9,285,308
$85,404,899
$87,100
$95,150,319
$57,049,279
$22,390,888
$79,440,167
$4,200,269
$93,013,828
$2,136,491
$0
$1,692,710
$11,221,844
$12,914,554
18,291
3,519
Aaa
6.1%
0.0%
2012
$4,321,079,301
15.35
$3,432,946,993
19.43
$66,347,409
99.3%
98.6%
$66,155,979
$8,300,730
$76,712,312
$64,100
$76,776,412
$52,720,499
$20,495,267
$73,215,766
$3,062,032
$76,277,798
$498,614
$0
$1,363,696
$10,028,892
Committed $0 $0
Nonspendable $0 $0 $0
$0
$8,665,196
$0
$0$0
$0
$8,801,600
Restricted
Assigned
Unassigned
$32,865,000
$4,359,069
$25,822,406
$4,521,680
Bonded Long-Term Debt
Annual Debt Service
$39,460,000
$4,101,296
$36,280,000
$4,293,583
$29,737,668
$4,384,744

MANCHESTER
Bond Rating (Moody's, as of July 1)
Population (State Dept. of Public Health)
Equalized Net Grand List
Equalized Mill Rate
Mill Rate
Total Revenues
Intergovernmental Revenues
Current Year Collection %
Total Expenditures
Education Expenditures
Unemployment (Annual Average)
School Enrollment (State Education Dept.)
TANF Recipients (As a % of Population)
Total Fund Balance (Deficit)
Total Expenditures and Other Financing Uses
Total Revenues and Other Financing Sources
Grand List Data
Property Tax Collection Data
Property Tax Revenues
Net Change In Fund Balance
FISCAL YEARS ENDED 2012 TO 2016
Operating Expenditures
Current Year Adjusted Tax Levy
Net Grand List
Economic Data
Operating Results - General Fund
Fund Balance - General Fund
Total Taxes Collected as a % of Total Outstanding
D - 78
Total Transfers In From Other Funds
Debt Measures
Total Transfers Out To Other Funds
2015
58,211
7,147
Aa1
7.6%
1.1%
2013
$5,558,448,949
22.99
$3,887,671,584
35.83
$127,784,000
97.9%
95.6%
$122,293,000
$46,708,000
$172,932,000
$2,746,000
$175,678,000
$113,067,000
$59,046,000
$172,113,000
$3,042,000
$175,155,000
$523,000
$0
$2,764,000
$11,823,000
$14,648,000
2014
58,106
7,284
Aa1
6.5%
1.2%
$5,476,686,374
25.07
$3,908,022,444
37.44
$137,283,000
98.1%
96.2%
$130,519,000
$48,744,000
$183,274,000
$1,680,000
$185,501,000
$116,985,000
$60,358,000
$177,343,000
$3,460,000
$180,803,000
$4,698,000
$1,009,000
$4,410,000
$19,346,000
58,007
7,352
Aa1
5.6%
1.2%
$5,367,105,127
25.41
$3,892,063,212
38.65
$136,376,000
98.1%
96.2%
$134,379,000
$48,291,000
$187,073,000
$1,616,000
$188,749,000
$121,800,000
$61,619,000
$183,419,000
$4,065,000
$187,484,000
$1,265,000
$910,000
$1,806,000
$17,820,000
$20,611,000
2016
57,873
7,280
Aa1
5.0%
1.0%
$5,623,494,750
25.42
$3,922,977,390
39.40
$142,927,000
98.3%
96.7%
$138,988,000
$47,039,000
$190,982,000
$1,569,000
$224,722,000
$122,400,000
$62,316,000
$184,716,000
$4,524,000
$221,327,000
$3,395,000
$910,000
$1,180,000
$21,892,000
$24,006,000
58,289
7,248
Aa1
8.3%
1.1%
2012
$5,655,669,334
21.81
$4,281,588,907
31.98
$123,354,000
98.1%
96.1%
$121,049,000
$47,260,000
$172,232,000
$1,538,000
$182,885,000
$112,033,000
$58,753,000
$170,786,000
$4,611,000
$184,407,000
($1,522,000)
$0
$3,310,000
$14,125,000
Committed $2,000 $10,000
Nonspendable $22,000 $65,000 $147,000
$32,000
$10,636,000
$24,000
$37,000$23,000
$17,000
$13,887,000
Restricted
Assigned
Unassigned
$79,135,000
$9,921,000
$92,090,000
$10,754,000
Bonded Long-Term Debt
Annual Debt Service
$76,529,000
$9,255,000
$79,375,000
$9,574,000
$84,875,000
$10,188,000

MANSFIELD
Bond Rating (Moody's, as of July 1)
Population (State Dept. of Public Health)
Equalized Net Grand List
Equalized Mill Rate
Mill Rate
Total Revenues
Intergovernmental Revenues
Current Year Collection %
Total Expenditures
Education Expenditures
Unemployment (Annual Average)
School Enrollment (State Education Dept.)
TANF Recipients (As a % of Population)
Total Fund Balance (Deficit)
Total Expenditures and Other Financing Uses
Total Revenues and Other Financing Sources
Grand List Data
Property Tax Collection Data
Property Tax Revenues
Net Change In Fund Balance
FISCAL YEARS ENDED 2012 TO 2016
Operating Expenditures
Current Year Adjusted Tax Levy
Net Grand List
Economic Data
Operating Results - General Fund
Fund Balance - General Fund
Total Taxes Collected as a % of Total Outstanding
D - 79
Total Transfers In From Other Funds
Debt Measures
Total Transfers Out To Other Funds
2015
25,774
1,972
Aa2
7.7%
0.1%
2013
$1,339,347,646
20.06
$980,397,735
27.16
$26,865,483
98.4%
97.1%
$26,975,001
$20,156,961
$48,026,600
$60,500
$48,087,100
$32,224,464
$12,515,632
$44,740,096
$2,667,436
$47,407,532
$679,568
$0
$424,907
$2,749,756
$3,174,663
2014
25,977
1,868
Aa2
6.2%
0.1%
$1,369,554,704
20.52
$1,011,715,713
27.95
$28,107,020
98.7%
97.5%
$28,291,076
$20,829,546
$50,053,639
$38,550
$50,092,189
$33,381,585
$12,853,693
$46,235,278
$3,645,540
$49,880,818
$211,371
$0
$140,010
$3,386,034
26,043
1,851
Aa2
5.2%
0.1%
$1,536,227,431
18.55
$1,036,252,379
27.95
$28,503,460
98.9%
97.6%
$28,770,347
$20,574,330
$50,362,505
$38,500
$50,401,005
$33,321,255
$13,082,583
$46,403,838
$3,442,019
$49,845,857
$555,148
$0
$65,368
$3,875,814
$3,941,182
2016
25,969
1,863
Aa2
4.8%
0.1%
$1,467,364,553
20.55
$1,026,856,306
29.87
$30,159,892
98.8%
97.5%
$30,318,141
$20,083,481
$51,188,126
$2,550
$51,190,676
$34,497,711
$13,331,472
$47,829,183
$2,914,446
$50,743,629
$447,047
$0
$202,139
$4,186,090
$4,388,229
25,648
1,979
Aa2
8.1%
0.2%
2012
$1,443,630,905
18.03
$973,722,578
26.68
$26,035,701
98.4%
97.4%
$25,991,047
$19,796,256
$46,692,221
$57,500
$46,749,721
$32,491,645
$12,088,728
$44,580,373
$1,871,010
$46,451,383
$298,338
$0
$253,527
$2,495,095
Committed $0 $0
Nonspendable $0 $0 $0
$0
$2,241,568
$0
$0$0
$0
$3,246,024
Restricted
Assigned
Unassigned
$7,231,169
$635,650
$4,437,964
$300,325
Bonded Long-Term Debt
Annual Debt Service
$10,680,085
$876,998
$8,662,121
$842,086
$5,803,427
$364,944

MARLBOROUGH
Bond Rating (Moody's, as of July 1)
Population (State Dept. of Public Health)
Equalized Net Grand List
Equalized Mill Rate
Mill Rate
Total Revenues
Intergovernmental Revenues
Current Year Collection %
Total Expenditures
Education Expenditures
Unemployment (Annual Average)
School Enrollment (State Education Dept.)
TANF Recipients (As a % of Population)
Total Fund Balance (Deficit)
Total Expenditures and Other Financing Uses
Total Revenues and Other Financing Sources
Grand List Data
Property Tax Collection Data
Property Tax Revenues
Net Change In Fund Balance
FISCAL YEARS ENDED 2012 TO 2016
Operating Expenditures
Current Year Adjusted Tax Levy
Net Grand List
Economic Data
Operating Results - General Fund
Fund Balance - General Fund
Total Taxes Collected as a % of Total Outstanding
D - 80
Total Transfers In From Other Funds
Debt Measures
Total Transfers Out To Other Funds
2015
6,431
1,188
Aa2
5.7%
0.1%
2013
$807,409,860
21.87
$564,965,100
31.03
$17,659,929
99.0%
98.4%
$17,705,831
$4,242,806
$22,295,152
$296,936
$22,592,088
$15,213,918
$6,541,713
$21,755,631
$273,414
$22,029,045
$563,043
$0
$713,024
$2,563,622
$3,276,646
2014
6,430
1,173
Aa2
5.1%
0.2%
$819,164,512
21.43
$567,632,905
30.76
$17,554,560
99.2%
98.8%
$17,710,133
$4,287,160
$22,344,067
$233,753
$22,761,365
$15,434,472
$7,231,237
$22,665,709
$418,349
$23,084,058
($322,693)
$0
$642,167
$2,953,953
6,430
1,144
Aa2
4.5%
0.2%
$852,428,016
21.28
$572,047,045
31.45
$18,142,932
99.1%
98.7%
$18,228,783
$4,056,299
$22,574,696
$336,972
$23,089,995
$15,784,850
$7,045,953
$22,830,803
$683,179
$23,513,982
($423,987)
$0
$601,163
$1,928,803
$2,529,966
2016
6,402
1,106
Aa2
3.8%
0.1%
$837,524,933
22.75
$575,072,075
32.89
$19,054,059
99.3%
98.9%
$19,144,363
$4,171,830
$23,610,632
$330,760
$23,941,392
$16,547,998
$6,755,460
$23,303,458
$651,228
$23,954,686
($13,294)
$0
$502,638
$2,014,034
$2,516,672
6,433
1,219
Aa2
6.3%
0.2%
2012
$792,883,433
21.61
$626,848,218
27.20
$17,135,312
99.0%
98.6%
$17,204,707
$4,225,526
$21,696,992
$334,492
$28,653,683
$14,996,229
$6,711,399
$21,707,628
$185,124
$28,424,597
$229,086
$0
$506,299
$2,713,603
Committed $0 $0
Nonspendable $0 $0 $0
$0
$2,207,304
$0
$0$0
$0
$2,311,786
Restricted
Assigned
Unassigned
$22,134,715
$2,635,702
$18,280,583
$2,339,999
Bonded Long-Term Debt
Annual Debt Service
$27,104,685
$2,537,058
$24,780,355
$2,387,896
$20,674,735
$2,360,982

MERIDEN
Bond Rating (Moody's, as of July 1)
Population (State Dept. of Public Health)
Equalized Net Grand List
Equalized Mill Rate
Mill Rate
Total Revenues
Intergovernmental Revenues
Current Year Collection %
Total Expenditures
Education Expenditures
Unemployment (Annual Average)
School Enrollment (State Education Dept.)
TANF Recipients (As a % of Population)
Total Fund Balance (Deficit)
Total Expenditures and Other Financing Uses
Total Revenues and Other Financing Sources
Grand List Data
Property Tax Collection Data
Property Tax Revenues
Net Change In Fund Balance
FISCAL YEARS ENDED 2012 TO 2016
Operating Expenditures
Current Year Adjusted Tax Levy
Net Grand List
Economic Data
Operating Results - General Fund
Fund Balance - General Fund
Total Taxes Collected as a % of Total Outstanding
D - 81
Total Transfers In From Other Funds
Debt Measures
Total Transfers Out To Other Funds
2015
60,456
9,070
A1
9.8%
2.2%
2013
$4,644,224,171
24.43
$3,246,242,290
34.70
$113,481,335
97.2%
92.4%
$113,886,618
$73,706,875
$196,860,010
$281,134
$203,686,112
$111,411,471
$85,490,024
$196,901,495
$90,928
$203,445,896
$240,216
$1,009,817
$0
$15,725,159
$17,497,456
2014
60,293
9,002
A1
8.5%
1.9%
$4,263,929,657
26.69
$3,218,470,206
34.99
$113,821,418
97.3%
92.4%
$114,074,859
$74,901,851
$194,900,435
$851,982
$195,752,417
$113,672,829
$81,426,747
$195,099,576
$537,957
$195,637,533
$114,884
$948,144
$0
$17,526,836
59,988
9,006
A1
7.2%
2.0%
$4,618,313,461
25.23
$3,224,902,777
35.74
$116,512,751
97.6%
93.1%
$117,378,964
$74,501,716
$199,264,297
$1,680,702
$200,944,999
$110,843,185
$89,921,883
$200,765,068
$38,197
$200,803,265
$141,734
$937,864
$0
$16,296,211
$17,668,570
2016
59,622
8,811
A1
6.2%
1.9%
$4,573,660,720
26.18
$3,216,495,723
36.63
$119,752,956
97.8%
93.4%
$120,779,671
$76,758,645
$204,458,399
$2,725,414
$207,183,813
$113,183,854
$93,483,468
$206,667,322
$39,766
$206,707,088
$476,725
$942,660
$0
$16,664,792
$18,145,295
60,638
9,142
A1
10.3%
2.2%
2012
$4,637,734,807
23.71
$3,639,460,109
29.83
$109,965,111
97.4%
92.8%
$109,910,284
$74,930,580
$191,847,102
$434,448
$192,281,550
$111,433,666
$81,841,905
$193,275,571
$15,000
$193,290,571
($1,009,021)
$520,001
$0
$17,257,240
Committed $400,699 $285,459
Nonspendable $137,144 $149,036 $133,633
$0
$16,603,606
$636,972
$125,508$130,799
$404,908
$16,042,985
Restricted
Assigned
Unassigned
$78,733,203
$11,573,699
$109,807,000
$15,539,914
Bonded Long-Term Debt
Annual Debt Service
$70,429,000
$12,196,166
$87,042,203
$11,610,000
$119,989,700
$12,072,958

MIDDLEBURY
Bond Rating (Moody's, as of July 1)
Population (State Dept. of Public Health)
Equalized Net Grand List
Equalized Mill Rate
Mill Rate
Total Revenues
Intergovernmental Revenues
Current Year Collection %
Total Expenditures
Education Expenditures
Unemployment (Annual Average)
School Enrollment (State Education Dept.)
TANF Recipients (As a % of Population)
Total Fund Balance (Deficit)
Total Expenditures and Other Financing Uses
Total Revenues and Other Financing Sources
Grand List Data
Property Tax Collection Data
Property Tax Revenues
Net Change In Fund Balance
FISCAL YEARS ENDED 2012 TO 2016
Operating Expenditures
Current Year Adjusted Tax Levy
Net Grand List
Economic Data
Operating Results - General Fund
Fund Balance - General Fund
Total Taxes Collected as a % of Total Outstanding
D - 82
Total Transfers In From Other Funds
Debt Measures
Total Transfers Out To Other Funds
2015
7,571
1,332
Aa2
5.8%
0.1%
2013
$1,314,965,601
19.77
$920,245,661
28.07
$25,992,390
98.4%
96.9%
$26,103,267
$1,367,670
$28,382,195
$328,549
$32,031,915
$19,093,395
$9,529,168
$28,622,563
$107,984
$31,940,869
$91,046
$0
$648,327
$2,725,306
$4,179,942
2014
7,591
1,280
Aa2
5.1%
0.1%
$1,338,288,169
20.09
$927,388,544
28.86
$26,883,133
98.8%
97.7%
$27,151,682
$1,444,580
$29,575,270
$286,179
$29,861,449
$19,694,996
$10,175,468
$29,870,464
$211,943
$30,082,407
($220,958)
$0
$112,287
$3,958,984
7,634
1,241
Aa2
4.4%
0.1%
$1,373,322,266
19.87
$928,246,114
29.34
$27,288,231
98.4%
97.1%
$27,353,151
$1,204,064
$29,537,590
$99,767
$29,637,357
$19,951,990
$9,915,102
$29,867,092
$101,300
$29,968,392
($331,035)
$0
$0
$2,803,151
$3,627,949
2016
7,641
1,222
Aa2
3.9%
0.1%
$1,365,404,875
20.87
$937,282,374
30.12
$28,492,883
98.4%
96.7%
$28,801,143
$1,183,088
$31,015,494
$84,703
$31,100,197
$20,616,454
$9,819,952
$30,436,406
$185,644
$30,622,050
$478,147
$0
$0
$4,053,108
$4,106,096
7,572
1,348
Aa2
6.7%
0.1%
2012
$1,307,481,072
19.86
$1,084,493,849
23.79
$25,962,334
98.7%
97.6%
$26,411,238
$1,594,083
$28,926,020
$75,659
$29,001,679
$18,677,886
$9,723,409
$28,401,295
$82,371
$28,483,666
$518,013
$0
$68,866
$4,088,896
Committed $0 $0
Nonspendable $52,988 $824,798 $69,000
$0
$3,951,030
$0
$806,309$822,941
$0
$3,023,756
Restricted
Assigned
Unassigned
$13,428,580
$756,623
$10,310,618
$868,057
Bonded Long-Term Debt
Annual Debt Service
$10,686,996
$802,511
$14,681,739
$708,300
$11,795,864
$891,016

MIDDLEFIELD
Bond Rating (Moody's, as of July 1)
Population (State Dept. of Public Health)
Equalized Net Grand List
Equalized Mill Rate
Mill Rate
Total Revenues
Intergovernmental Revenues
Current Year Collection %
Total Expenditures
Education Expenditures
Unemployment (Annual Average)
School Enrollment (State Education Dept.)
TANF Recipients (As a % of Population)
Total Fund Balance (Deficit)
Total Expenditures and Other Financing Uses
Total Revenues and Other Financing Sources
Grand List Data
Property Tax Collection Data
Property Tax Revenues
Net Change In Fund Balance
FISCAL YEARS ENDED 2012 TO 2016
Operating Expenditures
Current Year Adjusted Tax Levy
Net Grand List
Economic Data
Operating Results - General Fund
Fund Balance - General Fund
Total Taxes Collected as a % of Total Outstanding
D - 83
Total Transfers In From Other Funds
Debt Measures
Total Transfers Out To Other Funds
2015
4,425
688
6.0%
0.1%
2013
$573,588,857
22.44
$401,114,270
32.15
$12,872,610
98.4%
97.3%
$12,943,264
$2,487,016
$15,758,355
$295,423
$16,053,778
$11,549,668
$3,770,590
$15,320,258
$526,714
$15,846,972
$206,806
$0
$253,075
$1,610,691
$1,863,766
2014
4,424
668
5.5%
0.2%
$543,459,169
24.68
$403,493,320
33.24
$13,411,359
98.6%
97.7%
$13,487,421
$2,558,866
$16,748,420
$260,695
$18,336,115
$11,969,987
$5,822,707
$17,792,694
$565,807
$18,358,501
($22,386)
$0
$350,000
$1,841,380
4,407
638
4.5%
0.2%
$583,065,960
23.63
$405,401,780
33.92
$13,775,104
98.4%
97.3%
$13,794,575
$2,530,552
$16,721,474
$272,114
$16,993,588
$12,323,644
$4,022,266
$16,345,910
$717,309
$17,063,219
($69,631)
$0
$270,455
$1,501,294
$1,771,749
2016
4,387
619
4.4%
0.1%
$582,193,266
23.61
$408,734,287
33.67
$13,747,539
98.2%
97.0%
$13,758,819
$2,511,862
$16,589,606
$255,185
$16,844,791
$12,240,757
$3,832,893
$16,073,650
$690,624
$16,764,274
$80,517
$0
$275,000
$1,577,266
$1,852,266
4,416
688
6.5%
0.0%
2012
$607,342,309
20.70
$447,557,390
28.16
$12,572,924
98.3%
97.5%
$12,618,106
$2,358,073
$15,237,540
$267,902
$15,505,442
$11,332,311
$3,549,918
$14,882,229
$408,403
$15,290,632
$214,810
$0
$170,862
$1,656,960
Committed $0 $0
Nonspendable $0 $0 $0
$0
$1,486,098
$0
$0$0
$0
$1,491,380
Restricted
Assigned
Unassigned
$6,938,596
$2,806,867
$5,406,365
$486,126
Bonded Long-Term Debt
Annual Debt Service
$9,795,962
$476,243
$8,722,300
$524,670
$5,928,906
$486,126

MIDDLETOWN
Bond Rating (Moody's, as of July 1)
Population (State Dept. of Public Health)
Equalized Net Grand List
Equalized Mill Rate
Mill Rate
Total Revenues
Intergovernmental Revenues
Current Year Collection %
Total Expenditures
Education Expenditures
Unemployment (Annual Average)
School Enrollment (State Education Dept.)
TANF Recipients (As a % of Population)
Total Fund Balance (Deficit)
Total Expenditures and Other Financing Uses
Total Revenues and Other Financing Sources
Grand List Data
Property Tax Collection Data
Property Tax Revenues
Net Change In Fund Balance
FISCAL YEARS ENDED 2012 TO 2016
Operating Expenditures
Current Year Adjusted Tax Levy
Net Grand List
Economic Data
Operating Results - General Fund
Fund Balance - General Fund
Total Taxes Collected as a % of Total Outstanding
D - 84
Total Transfers In From Other Funds
Debt Measures
Total Transfers Out To Other Funds
2015
47,333
5,216
Aa2
7.4%
1.0%
2013
$4,870,325,433
21.20
$3,581,095,639
26.90
$103,264,000
97.8%
95.4%
$95,674,000
$35,322,000
$140,113,000
$495,000
$144,255,000
$79,052,000
$48,028,000
$127,080,000
$12,615,000
$139,695,000
$4,560,000
$0
$6,363,000
$15,055,000
$21,418,000
2014
47,043
5,130
Aa2
6.5%
0.9%
$4,608,171,738
23.04
$3,573,042,211
27.70
$106,182,000
97.8%
95.6%
$98,375,000
$36,163,000
$143,238,000
$469,000
$143,707,000
$82,259,000
$50,170,000
$132,429,000
$12,832,000
$145,261,000
($1,554,000)
$0
$3,068,000
$19,864,000
46,756
5,117
Aa2
5.7%
0.9%
$4,721,863,369
24.45
$3,303,791,940
32.70
$115,463,000
97.7%
95.4%
$106,476,000
$34,947,000
$150,822,000
$553,000
$156,662,000
$82,531,000
$52,748,000
$135,279,000
$14,680,000
$149,959,000
$6,703,000
$0
$4,741,000
$21,826,000
$26,567,000
2016
46,544
5,017
Aa2
5.1%
0.9%
$4,729,929,178
24.26
$3,291,420,748
32.60
$114,734,000
97.6%
94.9%
$106,083,000
$38,702,000
$155,794,000
$524,000
$157,148,000
$85,369,000
$56,098,000
$141,467,000
$14,440,000
$155,907,000
$1,241,000
$0
$4,829,000
$22,979,000
$27,808,000
47,325
5,297
Aa2
7.9%
0.9%
2012
$4,963,496,158
20.51
$3,578,426,400
26.10
$101,814,000
97.9%
95.8%
$93,366,000
$35,880,000
$137,606,000
$444,000
$138,050,000
$76,965,000
$46,553,000
$123,518,000
$13,121,000
$136,639,000
$1,411,000
$0
$2,649,000
$16,858,000
Committed $0 $0
Nonspendable $0 $0 $0
$0
$14,209,000
$0
$0$0
$0
$16,796,000
Restricted
Assigned
Unassigned
$70,905,000
$12,866,000
$86,354,000
$14,749,000
Bonded Long-Term Debt
Annual Debt Service
$61,770,000
$12,889,000
$78,820,000
$13,149,000
$90,559,000
$15,190,000

MILFORD
Bond Rating (Moody's, as of July 1)
Population (State Dept. of Public Health)
Equalized Net Grand List
Equalized Mill Rate
Mill Rate
Total Revenues
Intergovernmental Revenues
Current Year Collection %
Total Expenditures
Education Expenditures
Unemployment (Annual Average)
School Enrollment (State Education Dept.)
TANF Recipients (As a % of Population)
Total Fund Balance (Deficit)
Total Expenditures and Other Financing Uses
Total Revenues and Other Financing Sources
Grand List Data
Property Tax Collection Data
Property Tax Revenues
Net Change In Fund Balance
FISCAL YEARS ENDED 2012 TO 2016
Operating Expenditures
Current Year Adjusted Tax Levy
Net Grand List
Economic Data
Operating Results - General Fund
Fund Balance - General Fund
Total Taxes Collected as a % of Total Outstanding
D - 85
Total Transfers In From Other Funds
Debt Measures
Total Transfers Out To Other Funds
2015
53,137
6,755
Aa1
6.6%
0.3%
2013
$9,154,001,283
17.84
$6,399,745,248
25.60
$163,283,000
98.6%
96.0%
$164,236,000
$26,789,000
$200,957,000
$21,000
$216,705,000
$119,070,000
$76,534,000
$195,604,000
$2,827,000
$213,900,000
$2,805,000
$0
$7,875,000
$14,945,000
$23,874,000
2014
53,358
6,558
Aa1
5.7%
0.3%
$9,443,606,030
17.72
$6,440,527,586
26.28
$167,368,000
98.3%
95.5%
$165,899,000
$27,759,000
$203,027,000
$1,327,000
$204,354,000
$123,068,000
$80,687,000
$203,755,000
$1,625,000
$205,380,000
($1,026,000)
$0
$6,959,000
$22,848,000
53,592
6,375
Aa1
5.0%
0.2%
$9,270,938,632
18.68
$6,405,660,627
27.22
$173,188,000
98.1%
95.3%
$171,858,000
$24,254,000
$206,362,000
$0
$224,301,000
$119,634,000
$83,831,000
$203,465,000
$1,264,000
$222,041,000
$2,260,000
$0
$7,696,000
$16,336,000
$25,108,000
2016
54,054
6,232
Aa1
4.5%
0.2%
$9,096,188,398
19.58
$6,407,742,833
27.88
$178,091,000
98.0%
95.1%
$178,278,000
$25,086,000
$214,644,000
$0
$234,050,000
$124,576,000
$85,196,000
$209,772,000
$815,000
$229,285,000
$4,765,000
$0
$8,094,000
$20,668,000
$29,873,000
52,981
6,908
Aa1
7.3%
0.3%
2012
$6,852,065,504
22.75
$5,410,068,779
28.89
$155,888,000
98.2%
95.0%
$155,213,000
$26,930,000
$192,599,000
$596,000
$202,663,000
$114,635,000
$78,186,000
$192,821,000
$2,964,000
$205,117,000
($2,454,000)
$0
$4,198,000
$21,069,000
Committed $1,090,000 $1,055,000
Nonspendable $21,000 $21,000 $21,000
$1,212,000
$15,638,000
$1,033,000
$21,000$21,000
$1,054,000
$14,814,000
Restricted
Assigned
Unassigned
$154,890,000
$12,648,000
$152,959,000
$15,479,000
Bonded Long-Term Debt
Annual Debt Service
$136,103,000
$12,013,000
$149,030,000
$11,939,000
$156,869,000
$15,832,000

MONROE
Bond Rating (Moody's, as of July 1)
Population (State Dept. of Public Health)
Equalized Net Grand List
Equalized Mill Rate
Mill Rate
Total Revenues
Intergovernmental Revenues
Current Year Collection %
Total Expenditures
Education Expenditures
Unemployment (Annual Average)
School Enrollment (State Education Dept.)
TANF Recipients (As a % of Population)
Total Fund Balance (Deficit)
Total Expenditures and Other Financing Uses
Total Revenues and Other Financing Sources
Grand List Data
Property Tax Collection Data
Property Tax Revenues
Net Change In Fund Balance
FISCAL YEARS ENDED 2012 TO 2016
Operating Expenditures
Current Year Adjusted Tax Levy
Net Grand List
Economic Data
Operating Results - General Fund
Fund Balance - General Fund
Total Taxes Collected as a % of Total Outstanding
D - 86
Total Transfers In From Other Funds
Debt Measures
Total Transfers Out To Other Funds
2015
19,834
3,558
Aa2
6.4%
0.1%
2013
$3,098,919,583
21.69
$2,296,715,433
29.26
$67,210,084
99.0%
98.8%
$67,784,322
$13,856,850
$82,869,323
$35,000
$82,904,323
$56,376,507
$24,489,573
$80,866,080
$908,663
$81,774,743
$1,129,580
$0
$735,552
$4,688,184
$5,752,550
2014
19,867
3,425
Aa2
5.7%
0.1%
$3,207,048,912
21.85
$2,307,984,642
30.41
$70,069,868
98.9%
98.6%
$70,058,508
$14,609,179
$85,840,388
$57,865
$93,816,103
$58,266,029
$30,400,603
$88,666,632
$426,545
$92,896,381
$919,722
$0
$692,998
$6,672,272
19,833
3,368
Aa2
5.1%
0.0%
$3,118,165,181
22.98
$2,311,419,040
31.01
$71,651,461
98.8%
98.4%
$71,851,017
$12,698,512
$85,564,931
$409,400
$85,974,331
$58,009,142
$26,437,061
$84,446,203
$926,987
$85,373,190
$601,141
$801,126
$810,881
$6,210,066
$8,041,078
2016
19,658
3,249
Aa2
4.5%
0.0%
$3,066,526,011
24.01
$2,146,111,708
34.35
$73,622,328
99.1%
98.5%
$73,956,951
$13,437,840
$89,637,538
$5,492
$89,643,030
$59,684,089
$26,884,507
$86,568,596
$1,363,153
$87,931,749
$1,711,281
$389,539
$1,113,291
$8,083,096
$9,752,359
19,794
3,661
Aa2
7.2%
0.1%
2012
$3,220,913,936
20.40
$2,289,778,986
28.79
$65,702,612
98.8%
98.3%
$66,287,184
$12,747,056
$80,259,000
$162,379
$89,631,667
$56,657,002
$23,317,015
$79,974,017
$285,996
$89,342,315
$289,352
$0
$555,927
$4,622,970
Committed $0 $0
Nonspendable $166,433 $219,005 $76,893
$0
$3,990,150
$0
$328,814$34,269
$0
$5,945,005
Restricted
Assigned
Unassigned
$44,593,006
$6,052,772
$41,066,958
$5,993,057
Bonded Long-Term Debt
Annual Debt Service
$46,469,674
$5,132,059
$42,529,628
$5,437,360
$46,025,297
$5,920,481

MONTVILLE
Bond Rating (Moody's, as of July 1)
Population (State Dept. of Public Health)
Equalized Net Grand List
Equalized Mill Rate
Mill Rate
Total Revenues
Intergovernmental Revenues
Current Year Collection %
Total Expenditures
Education Expenditures
Unemployment (Annual Average)
School Enrollment (State Education Dept.)
TANF Recipients (As a % of Population)
Total Fund Balance (Deficit)
Total Expenditures and Other Financing Uses
Total Revenues and Other Financing Sources
Grand List Data
Property Tax Collection Data
Property Tax Revenues
Net Change In Fund Balance
FISCAL YEARS ENDED 2012 TO 2016
Operating Expenditures
Current Year Adjusted Tax Levy
Net Grand List
Economic Data
Operating Results - General Fund
Fund Balance - General Fund
Total Taxes Collected as a % of Total Outstanding
D - 87
Total Transfers In From Other Funds
Debt Measures
Total Transfers Out To Other Funds
2015
19,713
2,514
Aa3
8.2%
0.4%
2013
$1,850,227,589
20.32
$1,294,677,552
29.33
$37,594,865
97.7%
95.5%
$39,246,721
$21,095,329
$62,889,255
$10,000
$73,462,553
$41,237,122
$18,586,226
$59,823,348
$688,839
$70,217,065
$3,245,488
$0
$1,467,391
$7,382,987
$9,174,138
2014
19,635
2,496
Aa3
6.9%
0.5%
$1,776,946,041
20.37
$1,241,891,661
29.06
$36,196,777
97.4%
95.2%
$36,002,557
$22,109,764
$60,806,744
$656,601
$61,463,345
$41,200,103
$19,131,457
$60,331,560
$483,131
$60,814,691
$648,654
$0
$1,240,047
$9,822,792
19,396
2,471
Aa3
6.3%
0.4%
$1,824,269,016
20.17
$1,245,545,408
29.37
$36,794,710
97.6%
94.2%
$36,712,292
$22,515,758
$61,968,684
$10,000
$62,162,456
$41,507,886
$19,570,627
$61,078,513
$395,356
$61,473,869
$688,587
$90,867
$1,431,291
$8,756,538
$10,511,379
2016
19,231
2,389
Aa3
5.1%
0.3%
$1,901,263,919
19.95
$1,255,607,913
30.09
$37,925,442
97.7%
93.9%
$38,055,026
$22,183,160
$62,931,474
$99,517
$69,385,333
$42,589,128
$21,174,256
$63,763,384
$378,108
$69,924,663
($539,330)
$56,094
$745,621
$8,856,301
$9,972,049
19,686
2,634
Aa3
8.9%
0.4%
2012
$2,002,452,063
17.51
$1,519,656,255
23.00
$35,053,257
94.4%
92.6%
$33,987,794
$21,184,224
$57,496,725
$106,903
$57,625,057
$39,577,389
$18,173,279
$57,750,668
$0
$57,750,668
($125,611)
$0
$2,637,413
$5,928,650
Committed $188,197 $142,396
Nonspendable $125,836 $90,287 $780,022
$0
$2,511,215
$0
$323,760$45,595
$0
$8,537,150
Restricted
Assigned
Unassigned
$40,650,200
$4,384,287
$35,466,572
$4,313,433
Bonded Long-Term Debt
Annual Debt Service
$46,177,600
$4,166,665
$43,484,200
$4,678,780
$37,769,029
$4,341,488

MORRIS
Bond Rating (Moody's, as of July 1)
Population (State Dept. of Public Health)
Equalized Net Grand List
Equalized Mill Rate
Mill Rate
Total Revenues
Intergovernmental Revenues
Current Year Collection %
Total Expenditures
Education Expenditures
Unemployment (Annual Average)
School Enrollment (State Education Dept.)
TANF Recipients (As a % of Population)
Total Fund Balance (Deficit)
Total Expenditures and Other Financing Uses
Total Revenues and Other Financing Sources
Grand List Data
Property Tax Collection Data
Property Tax Revenues
Net Change In Fund Balance
FISCAL YEARS ENDED 2012 TO 2016
Operating Expenditures
Current Year Adjusted Tax Levy
Net Grand List
Economic Data
Operating Results - General Fund
Fund Balance - General Fund
Total Taxes Collected as a % of Total Outstanding
D - 88
Total Transfers In From Other Funds
Debt Measures
Total Transfers Out To Other Funds
2015
2,345
336
5.6%
0.4%
2013
$498,407,737
15.27
$349,444,098
21.90
$7,609,991
98.9%
98.4%
$7,603,237
$772,934
$8,583,330
$0
$8,583,330
$6,103,672
$2,230,903
$8,334,575
$100,000
$8,434,575
$148,755
$0
$150,000
$1,500,719
$1,650,719
2014
2,314
326
5.0%
0.3%
$464,963,219
16.11
$353,616,808
21.65
$7,492,662
99.1%
98.6%
$7,567,197
$709,962
$8,495,687
$0
$8,495,687
$5,957,858
$2,338,926
$8,296,784
$120,000
$8,416,784
$78,903
$0
$150,000
$1,729,622
2,293
318
4.5%
0.4%
$461,875,974
16.75
$350,388,817
22.38
$7,734,679
99.4%
98.9%
$7,793,553
$736,549
$8,734,565
$0
$8,734,565
$6,135,775
$2,399,623
$8,535,398
$150,000
$8,685,398
$49,167
$0
$250,000
$1,528,789
$1,778,789
2016
2,279
311
3.9%
0.3%
$423,916,013
18.64
$296,719,209
25.92
$7,902,417
98.1%
96.6%
$7,891,612
$740,207
$8,788,032
$26,040
$8,814,072
$6,478,187
$2,429,515
$8,907,702
$110,000
$9,017,702
($203,630)
$0
$250,000
$1,325,160
$1,575,160
2,356
356
6.2%
0.3%
2012
$502,130,423
14.56
$351,448,296
20.83
$7,311,252
99.1%
98.7%
$7,353,138
$727,128
$8,270,527
$0
$8,270,527
$5,803,371
$2,249,121
$8,052,492
$125,000
$8,177,492
$93,035
$0
$150,000
$1,501,964
Committed $0 $0
Nonspendable $0 $0 $0
$0
$1,351,964
$0
$0$0
$0
$1,579,622
Restricted
Assigned
Unassigned
$833,292
$0
$1,361,187
$0
Bonded Long-Term Debt
Annual Debt Service
$1,240,333
$0
$1,072,756
$0
$637,433
$0

NAUGATUCK
Bond Rating (Moody's, as of July 1)
Population (State Dept. of Public Health)
Equalized Net Grand List
Equalized Mill Rate
Mill Rate
Total Revenues
Intergovernmental Revenues
Current Year Collection %
Total Expenditures
Education Expenditures
Unemployment (Annual Average)
School Enrollment (State Education Dept.)
TANF Recipients (As a % of Population)
Total Fund Balance (Deficit)
Total Expenditures and Other Financing Uses
Total Revenues and Other Financing Sources
Grand List Data
Property Tax Collection Data
Property Tax Revenues
Net Change In Fund Balance
FISCAL YEARS ENDED 2012 TO 2016
Operating Expenditures
Current Year Adjusted Tax Levy
Net Grand List
Economic Data
Operating Results - General Fund
Fund Balance - General Fund
Total Taxes Collected as a % of Total Outstanding
D - 89
Total Transfers In From Other Funds
Debt Measures
Total Transfers Out To Other Funds
2015
31,707
4,704
Aa2
8.8%
0.8%
2013
$2,353,969,969
29.04
$2,034,453,806
33.55
$68,349,828
95.7%
86.2%
$68,075,454
$38,181,435
$113,975,205
$565,365
$114,562,045
$62,533,010
$45,278,129
$107,811,139
$5,496,346
$113,307,485
$1,254,560
$0
$935,752
$12,675,673
$13,693,959
2014
31,659
4,593
Aa2
7.6%
0.8%
$2,254,139,970
31.26
$1,566,229,089
44.80
$70,459,746
95.0%
85.9%
$71,270,654
$39,250,092
$117,785,848
$58,617
$117,848,603
$66,204,553
$46,490,848
$112,695,401
$3,601,063
$116,296,464
$1,552,139
$0
$1,617,727
$15,246,098
31,538
4,558
Aa2
6.6%
0.8%
$2,267,947,623
30.93
$1,577,315,620
44.27
$70,156,534
94.3%
84.7%
$70,618,029
$37,060,076
$113,941,277
$2,342,221
$116,922,998
$64,498,577
$49,646,838
$114,145,415
$2,831,193
$116,976,608
($53,610)
$0
$1,463,043
$13,729,445
$15,192,488
2016
31,392
4,496
Aa2
5.8%
0.7%
$2,248,544,821
32.32
$1,584,067,046
45.57
$72,676,537
93.4%
84.1%
$71,992,921
$37,437,473
$113,299,625
$3,540,144
$116,882,769
$66,980,264
$50,473,431
$117,453,695
$2,392,836
$119,846,531
($2,963,762)
$0
$3,356,651
$8,872,075
$12,228,726
31,774
4,754
Aa2
9.4%
0.7%
2012
$2,503,021,520
26.61
$2,025,742,873
32.81
$66,594,092
95.7%
86.7%
$66,475,472
$37,395,247
$111,502,134
$97,603
$111,599,737
$62,380,519
$43,511,181
$105,891,700
$4,720,707
$110,612,407
$987,330
$0
$894,875
$12,439,399
Committed $0 $0
Nonspendable $0 $0 $0
$0
$11,544,524
$0
$82,534$0
$0
$13,628,371
Restricted
Assigned
Unassigned
$89,757,218
$7,795,221
$101,571,434
$11,012,333
Bonded Long-Term Debt
Annual Debt Service
$78,869,531
$8,623,006
$88,547,285
$9,235,163
$91,959,590
$10,071,891

NEW BRITAIN
Bond Rating (Moody's, as of July 1)
Population (State Dept. of Public Health)
Equalized Net Grand List
Equalized Mill Rate
Mill Rate
Total Revenues
Intergovernmental Revenues
Current Year Collection %
Total Expenditures
Education Expenditures
Unemployment (Annual Average)
School Enrollment (State Education Dept.)
TANF Recipients (As a % of Population)
Total Fund Balance (Deficit)
Total Expenditures and Other Financing Uses
Total Revenues and Other Financing Sources
Grand List Data
Property Tax Collection Data
Property Tax Revenues
Net Change In Fund Balance
FISCAL YEARS ENDED 2012 TO 2016
Operating Expenditures
Current Year Adjusted Tax Levy
Net Grand List
Economic Data
Operating Results - General Fund
Fund Balance - General Fund
Total Taxes Collected as a % of Total Outstanding
D - 90
Total Transfers In From Other Funds
Debt Measures
Total Transfers Out To Other Funds
2015
72,939
11,186
A2
11.2%
3.7%
2013
$3,549,594,737
30.61
$2,948,713,573
36.63
$108,661,000
97.7%
90.9%
$114,381,000
$103,939,000
$230,986,000
$5,407,000
$236,637,000
$133,504,000
$101,738,000
$235,242,000
$1,000,000
$236,242,000
$395,000
$0
$0
$12,595,000
$12,595,000
2014
72,878
11,003
A2
9.5%
3.6%
$3,498,493,916
30.94
$2,441,301,264
44.12
$108,247,000
97.0%
90.2%
$108,353,000
$107,833,000
$230,246,000
$11,364,000
$241,610,000
$141,020,000
$108,173,000
$249,193,000
$47,000
$249,240,000
($7,630,000)
$0
$0
$4,965,000
72,808
11,158
Baa1
8.2%
3.5%
$3,598,885,107
33.40
$2,443,274,834
49.00
$120,217,000
96.2%
89.9%
$119,390,000
$103,914,000
$232,946,000
$2,026,000
$238,638,000
$138,100,000
$90,533,000
$228,633,000
$27,000
$228,660,000
$9,978,000
$0
$3,666,000
$11,277,000
$14,943,000
2016
72,558
11,355
Baa1
7.2%
3.3%
$3,648,566,782
33.29
$2,458,540,626
49.00
$121,456,000
96.6%
89.7%
$122,687,000
$106,451,000
$241,843,000
$2,208,000
$244,552,000
$139,867,000
$91,006,000
$230,873,000
$222,000
$231,095,000
$13,457,000
$0
$3,165,000
$25,235,000
$28,400,000
73,153
11,012
A2
11.9%
3.7%
2012
$3,797,502,495
28.33
$2,920,843,957
36.63
$107,582,000
96.0%
89.1%
$110,013,000
$106,402,000
$229,634,000
$11,709,000
$241,769,000
$132,786,000
$108,557,000
$241,343,000
$273,000
$241,616,000
$153,000
$0
$41,000
$12,200,000
Committed $0 $0
Nonspendable $0 $0 $0
$0
$12,159,000
$0
$0$0
$0
$4,965,000
Restricted
Assigned
Unassigned
$210,533,000
$28,345,000
$242,370,000
$17,038,000
Bonded Long-Term Debt
Annual Debt Service
$225,411,000
$31,817,000
$227,456,000
$29,388,000
$248,334,000
$15,830,000

NEW CANAAN
Bond Rating (Moody's, as of July 1)
Population (State Dept. of Public Health)
Equalized Net Grand List
Equalized Mill Rate
Mill Rate
Total Revenues
Intergovernmental Revenues
Current Year Collection %
Total Expenditures
Education Expenditures
Unemployment (Annual Average)
School Enrollment (State Education Dept.)
TANF Recipients (As a % of Population)
Total Fund Balance (Deficit)
Total Expenditures and Other Financing Uses
Total Revenues and Other Financing Sources
Grand List Data
Property Tax Collection Data
Property Tax Revenues
Net Change In Fund Balance
FISCAL YEARS ENDED 2012 TO 2016
Operating Expenditures
Current Year Adjusted Tax Levy
Net Grand List
Economic Data
Operating Results - General Fund
Fund Balance - General Fund
Total Taxes Collected as a % of Total Outstanding
D - 91
Total Transfers In From Other Funds
Debt Measures
Total Transfers Out To Other Funds
2015
20,194
4,221
Aaa
5.8%
0.0%
2013
$11,358,746,273
10.24
$8,248,622,291
14.08
$116,331,874
99.5%
98.7%
$116,615,121
$10,875,400
$133,648,238
$3,114,388
$136,812,803
$82,762,324
$51,773,929
$134,536,253
$115,895
$134,692,148
$2,120,655
$196,202
$6,255,727
$18,728,822
$25,377,073
2014
20,314
4,228
Aaa
5.0%
0.1%
$11,387,799,066
10.65
$8,299,347,038
14.59
$121,316,433
99.6%
98.9%
$122,509,946
$14,458,604
$145,566,683
$10,000
$147,186,528
$86,457,443
$53,644,813
$140,102,256
$827,484
$140,929,740
$6,256,788
$0
$9,545,033
$31,633,861
20,387
4,254
Aaa
4.3%
0.1%
$11,483,498,209
10.92
$8,038,341,746
15.54
$125,351,665
99.7%
99.6%
$126,243,008
$12,358,742
$146,759,457
$756,118
$148,500,636
$90,682,407
$54,689,728
$145,372,135
$4,285,851
$149,657,986
($1,157,350)
$0
$5,826,771
$24,349,923
$30,476,511
2016
20,280
4,263
Aaa
3.8%
0.0%
$12,377,454,660
10.54
$8,126,991,701
15.99
$130,453,388
99.7%
99.4%
$130,758,741
$12,617,362
$149,972,951
$10,000
$160,786,936
$92,082,006
$54,953,795
$147,035,801
$5,408,788
$162,300,308
($1,513,372)
$0
$4,311,322
$23,912,207
$28,963,138
20,110
4,208
Aaa
6.1%
0.0%
2012
$10,871,994,421
10.47
$8,200,262,034
13.85
$113,812,002
99.5%
98.8%
$114,303,054
$10,348,019
$129,853,184
$381,558
$138,365,946
$79,172,586
$49,325,523
$128,498,109
$275,006
$136,059,631
$2,306,315
$172,708
$5,682,297
$23,256,418
Committed $0 $0
Nonspendable $739,609 $299,817 $213,800
$750,000
$16,437,613
$0
$196,322$760,229
$0
$21,328,599
Restricted
Assigned
Unassigned
$128,254,762
$14,033,381
$120,380,287
$17,014,906
Bonded Long-Term Debt
Annual Debt Service
$126,252,541
$12,927,969
$117,175,387
$13,455,343
$123,671,098
$15,785,034

NEW FAIRFIELD
Bond Rating (Moody's, as of July 1)
Population (State Dept. of Public Health)
Equalized Net Grand List
Equalized Mill Rate
Mill Rate
Total Revenues
Intergovernmental Revenues
Current Year Collection %
Total Expenditures
Education Expenditures
Unemployment (Annual Average)
School Enrollment (State Education Dept.)
TANF Recipients (As a % of Population)
Total Fund Balance (Deficit)
Total Expenditures and Other Financing Uses
Total Revenues and Other Financing Sources
Grand List Data
Property Tax Collection Data
Property Tax Revenues
Net Change In Fund Balance
FISCAL YEARS ENDED 2012 TO 2016
Operating Expenditures
Current Year Adjusted Tax Levy
Net Grand List
Economic Data
Operating Results - General Fund
Fund Balance - General Fund
Total Taxes Collected as a % of Total Outstanding
D - 92
Total Transfers In From Other Funds
Debt Measures
Total Transfers Out To Other Funds
2015
14,145
2,725
Aa1
6.5%
0.1%
2013
$2,241,292,944
18.49
$1,695,691,245
24.66
$41,434,446
99.4%
99.2%
$41,855,046
$9,685,455
$53,925,537
$0
$53,925,537
$34,611,870
$18,334,716
$52,946,586
$676,595
$53,623,181
$302,356
$0
$1,062,337
$6,084,821
$7,151,400
2014
14,149
2,643
Aa1
5.2%
0.1%
$2,238,854,493
18.78
$1,687,072,376
25.64
$42,037,398
99.4%
99.4%
$43,312,416
$9,952,002
$56,049,928
$0
$56,049,928
$35,664,277
$18,527,846
$54,192,123
$1,762,822
$55,954,945
$94,983
$0
$984,066
$7,246,381
14,126
2,549
Aa1
4.7%
0.1%
$2,336,267,289
18.87
$1,685,311,490
26.08
$44,087,482
99.5%
99.2%
$44,370,542
$9,003,763
$56,224,106
$0
$58,184,106
$35,540,155
$19,325,375
$54,865,530
$1,337,487
$58,163,017
$21,089
$0
$1,370,144
$5,891,290
$7,267,470
2016
14,005
2,426
Aa1
4.3%
0.1%
$2,255,766,433
18.92
$1,578,364,683
28.53
$42,676,388
99.4%
99.0%
$45,050,139
$9,601,063
$57,272,490
$0
$66,869,445
$36,936,252
$19,478,605
$56,414,857
$1,113,893
$66,994,486
($125,041)
$0
$887,141
$6,240,019
$7,142,428
14,112
2,807
Aa1
7.2%
0.2%
2012
$2,439,853,272
16.34
$1,684,115,996
23.95
$39,870,215
99.2%
98.9%
$40,109,394
$9,316,070
$51,999,749
$0
$51,999,749
$33,498,893
$18,695,029
$52,193,922
$413,350
$52,607,272
($607,523)
$0
$930,916
$7,838,001
Committed $0 $0
Nonspendable $15,268 $6,036 $8,338
$0
$6,898,747
$0
$4,242$1,227
$0
$6,261,088
Restricted
Assigned
Unassigned
$27,060,000
$3,012,259
$22,745,000
$2,887,611
Bonded Long-Term Debt
Annual Debt Service
$31,170,000
$3,065,804
$29,095,000
$3,148,149
$25,070,000
$2,824,846

NEW HARTFORD
Bond Rating (Moody's, as of July 1)
Population (State Dept. of Public Health)
Equalized Net Grand List
Equalized Mill Rate
Mill Rate
Total Revenues
Intergovernmental Revenues
Current Year Collection %
Total Expenditures
Education Expenditures
Unemployment (Annual Average)
School Enrollment (State Education Dept.)
TANF Recipients (As a % of Population)
Total Fund Balance (Deficit)
Total Expenditures and Other Financing Uses
Total Revenues and Other Financing Sources
Grand List Data
Property Tax Collection Data
Property Tax Revenues
Net Change In Fund Balance
FISCAL YEARS ENDED 2012 TO 2016
Operating Expenditures
Current Year Adjusted Tax Levy
Net Grand List
Economic Data
Operating Results - General Fund
Fund Balance - General Fund
Total Taxes Collected as a % of Total Outstanding
D - 93
Total Transfers In From Other Funds
Debt Measures
Total Transfers Out To Other Funds
2015
6,886
1,123
Aa3
6.4%
0.1%
2013
$944,979,390
18.83
$716,719,218
24.80
$17,794,642
98.3%
97.2%
$17,782,201
$5,040,782
$23,170,098
$0
$23,170,098
$17,248,837
$5,464,727
$22,713,564
$412,300
$23,125,864
$44,234
$17,542
$792,140
$3,194,256
$4,003,938
2014
6,812
1,104
Aa3
5.7%
0.2%
$939,030,593
19.09
$715,256,311
24.95
$17,927,099
98.6%
97.1%
$17,985,887
$5,105,988
$23,428,724
$201
$23,428,925
$17,925,220
$5,265,850
$23,191,070
$782,128
$23,973,198
($544,273)
$17,865
$999,022
$3,459,665
6,764
1,059
Aa3
4.7%
0.1%
$930,609,429
19.43
$651,286,600
27.68
$18,082,005
98.7%
97.2%
$18,230,946
$5,236,397
$23,794,709
$0
$23,794,709
$18,139,405
$5,600,261
$23,739,666
$508,191
$24,247,857
($453,148)
$17,883
$1,069,364
$1,919,270
$3,006,517
2016
6,733
1,031
Aa3
4.3%
0.1%
$923,271,139
20.65
$652,658,673
29.04
$19,065,563
98.5%
96.9%
$19,105,372
$5,313,625
$24,775,920
$143,384
$26,937,624
$18,606,770
$6,877,328
$25,484,098
$515,998
$26,000,096
$937,528
$17,901
$422,333
$3,503,811
$3,944,045
6,903
1,136
Aa3
6.3%
0.1%
2012
$955,598,367
17.99
$707,807,479
24.20
$17,191,649
98.7%
97.9%
$17,308,285
$4,965,034
$22,604,284
$0
$22,604,284
$16,544,942
$5,289,576
$21,834,518
$353,000
$22,187,518
($39,125)
$17,542
$858,333
$3,959,704
Committed $0 $0
Nonspendable $0 $0 $0
$0
$3,083,829
$0
$0$0
$0
$2,442,778
Restricted
Assigned
Unassigned
$8,813,858
$682,187
$9,393,350
$617,525
Bonded Long-Term Debt
Annual Debt Service
$10,353,883
$833,961
$9,638,101
$815,579
$8,035,419
$623,686

NEW HAVEN
Bond Rating (Moody's, as of July 1)
Population (State Dept. of Public Health)
Equalized Net Grand List
Equalized Mill Rate
Mill Rate
Total Revenues
Intergovernmental Revenues
Current Year Collection %
Total Expenditures
Education Expenditures
Unemployment (Annual Average)
School Enrollment (State Education Dept.)
TANF Recipients (As a % of Population)
Total Fund Balance (Deficit)
Total Expenditures and Other Financing Uses
Total Revenues and Other Financing Sources
Grand List Data
Property Tax Collection Data
Property Tax Revenues
Net Change In Fund Balance
FISCAL YEARS ENDED 2012 TO 2016
Operating Expenditures
Current Year Adjusted Tax Levy
Net Grand List
Economic Data
Operating Results - General Fund
Fund Balance - General Fund
Total Taxes Collected as a % of Total Outstanding
D - 94
Total Transfers In From Other Funds
Debt Measures
Total Transfers Out To Other Funds
2015
130,660
18,413
A2
10.8%
3.3%
2013
$8,567,371,656
27.25
$5,994,731,716
38.88
$233,426,979
97.5%
95.1%
$230,988,343
$234,142,830
$507,023,591
$0
$570,867,007
$204,422,059
$319,577,521
$523,999,580
$9,008,246
$584,380,358
($13,513,351)
$0
$0
($8,721,555)
($4,721,555)
2014
130,282
18,738
A3
9.0%
3.4%
$9,330,121,969
26.32
$6,077,165,950
40.80
$245,563,607
97.9%
95.6%
$243,999,342
$241,889,965
$529,517,012
$0
$557,085,030
$210,739,315
$313,525,039
$524,264,354
$2,474,489
$552,341,428
$4,743,602
$0
$0
$22,047
130,322
19,122
A3
7.6%
3.3%
$9,713,317,998
26.01
$6,104,865,259
41.55
$252,620,573
97.9%
95.7%
$249,968,781
$248,893,667
$548,594,672
$0
$619,548,631
$214,438,961
$333,769,824
$548,208,785
$1,444,742
$617,844,677
$1,703,954
$0
$0
$1,726,001
$1,726,001
2016
129,934
19,067
A3
6.6%
3.2%
$9,723,396,015
25.95
$6,072,519,797
41.55
$252,312,223
98.0%
95.9%
$250,993,094
$245,394,710
$541,928,552
$0
$608,406,648
$214,734,762
$331,197,234
$545,931,996
$1,511,026
$608,109,044
$297,604
$0
$0
$2,023,605
$2,023,605
130,741
18,002
A2
11.6%
3.2%
2012
$6,779,089,379
33.46
$5,151,303,390
43.90
$226,835,431
97.2%
95.1%
$226,146,445
$237,628,410
$500,541,567
$0
$506,753,660
$203,686,746
$308,747,435
$512,434,181
$2,355,303
$514,789,484
($8,035,824)
$0
$0
$8,791,796
Committed $0 $0
Nonspendable $0 $0 $5,000,000
$0
$3,791,796
$0
$4,000,000$0
$0
$22,047
Restricted
Assigned
Unassigned
$575,831,359
$62,281,760
$596,763,536
$62,488,475
Bonded Long-Term Debt
Annual Debt Service
$509,502,604
$65,158,164
$506,994,678
$65,810,433
$572,143,498
$64,813,409

NEW LONDON
Bond Rating (Moody's, as of July 1)
Population (State Dept. of Public Health)
Equalized Net Grand List
Equalized Mill Rate
Mill Rate
Total Revenues
Intergovernmental Revenues
Current Year Collection %
Total Expenditures
Education Expenditures
Unemployment (Annual Average)
School Enrollment (State Education Dept.)
TANF Recipients (As a % of Population)
Total Fund Balance (Deficit)
Total Expenditures and Other Financing Uses
Total Revenues and Other Financing Sources
Grand List Data
Property Tax Collection Data
Property Tax Revenues
Net Change In Fund Balance
FISCAL YEARS ENDED 2012 TO 2016
Operating Expenditures
Current Year Adjusted Tax Levy
Net Grand List
Economic Data
Operating Results - General Fund
Fund Balance - General Fund
Total Taxes Collected as a % of Total Outstanding
D - 95
Total Transfers In From Other Funds
Debt Measures
Total Transfers Out To Other Funds
2015
27,545
3,577
11.9%
2.5%
2013
$1,874,244,934
22.16
$1,564,831,279
26.60
$41,535,473
98.0%
96.2%
$41,465,307
$37,310,111
$84,162,657
$295,218
$84,457,875
$43,167,950
$35,842,544
$79,010,494
$5,239,212
$84,249,706
$208,169
$0
$0
$1,471,158
$1,471,158
2014
27,374
3,533
9.8%
2.6%
$1,837,874,032
23.58
$1,569,776,194
27.50
$43,339,999
97.8%
96.4%
$43,203,129
$37,911,660
$86,667,709
$50,000
$86,717,709
$45,031,924
$35,563,022
$80,594,946
$5,274,600
$85,869,546
$848,163
$0
$200,000
$2,319,321
27,179
3,595
8.4%
2.3%
$1,826,592,880
26.11
$1,256,420,086
38.00
$47,694,829
97.2%
95.2%
$47,439,641
$36,527,698
$88,986,701
$50,000
$90,136,701
$45,127,644
$37,419,890
$82,547,534
$5,663,499
$88,211,033
$1,925,668
$0
$0
$4,244,989
$4,244,989
2016
26,984
3,605
7.2%
2.0%
$1,858,962,622
26.60
$1,253,973,537
39.49
$49,446,015
97.7%
94.7%
$49,248,024
$36,544,314
$91,139,131
$0
$91,139,131
$46,918,298
$38,696,863
$85,615,161
$5,018,476
$90,633,637
$505,494
$0
$24,694
$4,725,789
$4,750,483
27,707
3,509
12.6%
2.5%
2012
$1,994,278,344
19.63
$1,560,289,376
25.31
$39,140,385
98.1%
96.9%
$39,049,980
$38,557,674
$83,400,738
$416,629
$83,817,367
$43,863,439
$43,461,334
$87,324,773
$213,153
$87,537,926
($3,720,559)
$0
$0
$1,262,989
Committed $0 $0
Nonspendable $0 $0 $0
$0
$1,262,989
$0
$0$0
$0
$2,119,321
Restricted
Assigned
Unassigned
$50,250,400
$5,955,958
$49,578,166
$5,920,295
Bonded Long-Term Debt
Annual Debt Service
$39,082,915
$5,602,372
$39,966,192
$5,435,690
$48,821,926
$5,749,677

NEW MILFORD
Bond Rating (Moody's, as of July 1)
Population (State Dept. of Public Health)
Equalized Net Grand List
Equalized Mill Rate
Mill Rate
Total Revenues
Intergovernmental Revenues
Current Year Collection %
Total Expenditures
Education Expenditures
Unemployment (Annual Average)
School Enrollment (State Education Dept.)
TANF Recipients (As a % of Population)
Total Fund Balance (Deficit)
Total Expenditures and Other Financing Uses
Total Revenues and Other Financing Sources
Grand List Data
Property Tax Collection Data
Property Tax Revenues
Net Change In Fund Balance
FISCAL YEARS ENDED 2012 TO 2016
Operating Expenditures
Current Year Adjusted Tax Levy
Net Grand List
Economic Data
Operating Results - General Fund
Fund Balance - General Fund
Total Taxes Collected as a % of Total Outstanding
D - 96
Total Transfers In From Other Funds
Debt Measures
Total Transfers Out To Other Funds
2015
27,767
4,531
Aa1
6.6%
0.3%
2013
$4,089,945,389
17.66
$2,867,098,845
25.37
$72,246,241
98.0%
96.6%
$72,459,370
$23,289,243
$100,223,142
$1,156,995
$101,939,783
$63,309,161
$33,030,176
$96,339,337
$1,767,040
$98,106,377
$3,833,406
$0
$2,102,753
$14,817,161
$17,387,181
2014
27,474
4,425
Aa1
5.6%
0.3%
$4,007,864,030
18.46
$2,884,668,215
25.85
$73,976,276
98.3%
96.8%
$74,688,984
$24,262,031
$103,489,329
$1,276,241
$106,692,709
$66,335,339
$34,674,651
$101,009,990
$3,558,949
$104,568,939
$2,123,770
$0
$3,570,118
$19,510,951
27,276
4,291
Aa1
4.8%
0.3%
$4,091,911,198
18.55
$2,895,742,205
26.30
$75,922,867
98.5%
97.7%
$77,087,601
$24,240,229
$106,104,916
$924,007
$107,944,612
$68,604,228
$34,777,621
$103,381,849
$2,947,966
$106,329,815
$1,614,797
$0
$3,015,383
$17,761,259
$21,125,748
2016
27,151
4,153
Aa1
4.3%
0.3%
$4,150,983,903
18.67
$2,902,881,880
26.75
$77,482,102
98.4%
97.8%
$78,014,253
$24,998,442
$107,749,832
$1,188,500
$110,027,114
$70,948,347
$35,168,446
$106,116,793
$3,684,948
$109,801,741
$225,373
$0
$1,092,702
$17,880,019
$21,351,121
27,835
4,587
Aa1
7.1%
0.3%
2012
$4,088,829,950
17.14
$2,861,601,385
24.75
$70,093,601
98.1%
96.8%
$70,524,083
$22,747,545
$98,019,043
$1,481,147
$99,984,863
$64,012,160
$34,828,243
$98,840,403
$1,399,212
$100,239,615
($254,752)
$0
$1,441,711
$13,553,775
Committed $450,879 $316,547
Nonspendable $1,927,521 $32,559 $34,105
$179,109
$11,898,850
$434,411
$32,856$32,753
$141,312
$15,766,768
Restricted
Assigned
Unassigned
$21,452,541
$5,802,061
$14,305,861
$5,293,159
Bonded Long-Term Debt
Annual Debt Service
$28,433,571
$6,116,802
$24,094,938
$6,157,519
$17,838,548
$5,533,962
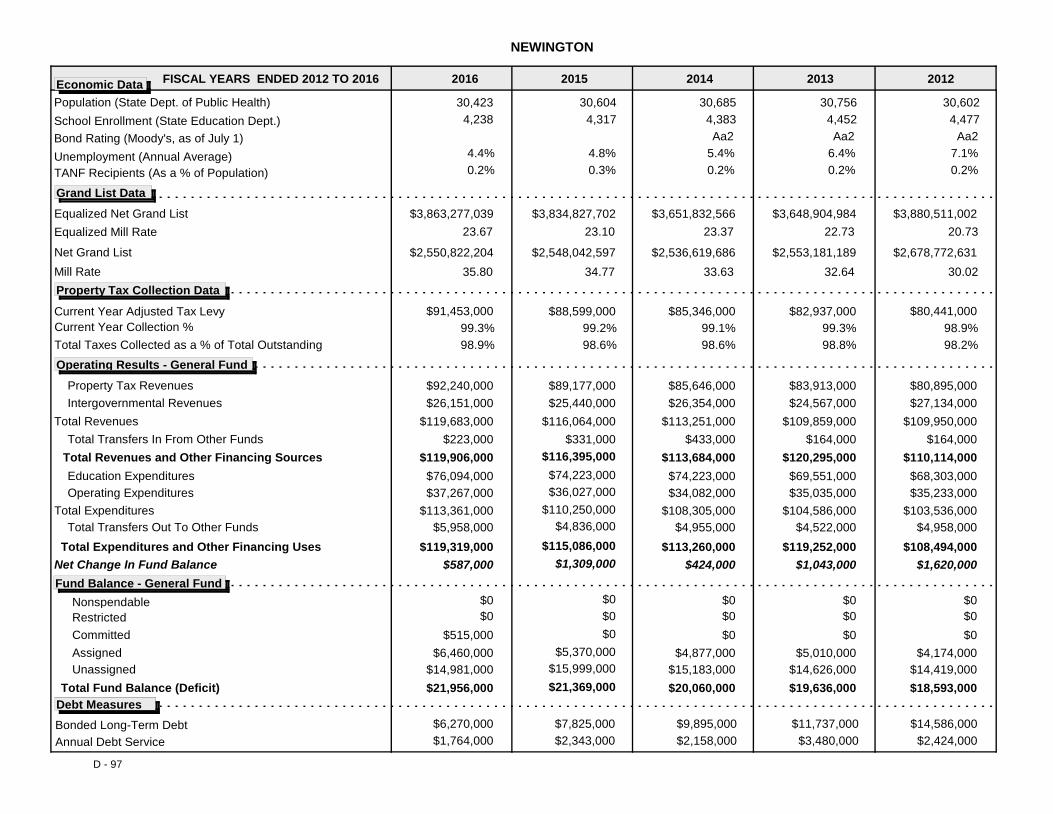
NEWINGTON
Bond Rating (Moody's, as of July 1)
Population (State Dept. of Public Health)
Equalized Net Grand List
Equalized Mill Rate
Mill Rate
Total Revenues
Intergovernmental Revenues
Current Year Collection %
Total Expenditures
Education Expenditures
Unemployment (Annual Average)
School Enrollment (State Education Dept.)
TANF Recipients (As a % of Population)
Total Fund Balance (Deficit)
Total Expenditures and Other Financing Uses
Total Revenues and Other Financing Sources
Grand List Data
Property Tax Collection Data
Property Tax Revenues
Net Change In Fund Balance
FISCAL YEARS ENDED 2012 TO 2016
Operating Expenditures
Current Year Adjusted Tax Levy
Net Grand List
Economic Data
Operating Results - General Fund
Fund Balance - General Fund
Total Taxes Collected as a % of Total Outstanding
D - 97
Total Transfers In From Other Funds
Debt Measures
Total Transfers Out To Other Funds
2015
30,756
4,452
Aa2
6.4%
0.2%
2013
$3,648,904,984
22.73
$2,553,181,189
32.64
$82,937,000
99.3%
98.8%
$83,913,000
$24,567,000
$109,859,000
$164,000
$120,295,000
$69,551,000
$35,035,000
$104,586,000
$4,522,000
$119,252,000
$1,043,000
$0
$5,010,000
$14,626,000
$19,636,000
2014
30,685
4,383
Aa2
5.4%
0.2%
$3,651,832,566
23.37
$2,536,619,686
33.63
$85,346,000
99.1%
98.6%
$85,646,000
$26,354,000
$113,251,000
$433,000
$113,684,000
$74,223,000
$34,082,000
$108,305,000
$4,955,000
$113,260,000
$424,000
$0
$4,877,000
$20,060,000
30,604
4,317
4.8%
0.3%
$3,834,827,702
23.10
$2,548,042,597
34.77
$88,599,000
99.2%
98.6%
$89,177,000
$25,440,000
$116,064,000
$331,000
$116,395,000
$74,223,000
$36,027,000
$110,250,000
$4,836,000
$115,086,000
$1,309,000
$0
$5,370,000
$15,999,000
$21,369,000
2016
30,423
4,238
4.4%
0.2%
$3,863,277,039
23.67
$2,550,822,204
35.80
$91,453,000
99.3%
98.9%
$92,240,000
$26,151,000
$119,683,000
$223,000
$119,906,000
$76,094,000
$37,267,000
$113,361,000
$5,958,000
$119,319,000
$587,000
$0
$6,460,000
$14,981,000
$21,956,000
30,602
4,477
Aa2
7.1%
0.2%
2012
$3,880,511,002
20.73
$2,678,772,631
30.02
$80,441,000
98.9%
98.2%
$80,895,000
$27,134,000
$109,950,000
$164,000
$110,114,000
$68,303,000
$35,233,000
$103,536,000
$4,958,000
$108,494,000
$1,620,000
$0
$4,174,000
$18,593,000
Committed $515,000 $0
Nonspendable $0 $0 $0
$0
$14,419,000
$0
$0$0
$0
$15,183,000
Restricted
Assigned
Unassigned
$9,895,000
$2,158,000
$6,270,000
$1,764,000
Bonded Long-Term Debt
Annual Debt Service
$14,586,000
$2,424,000
$11,737,000
$3,480,000
$7,825,000
$2,343,000

NEWTOWN
Bond Rating (Moody's, as of July 1)
Population (State Dept. of Public Health)
Equalized Net Grand List
Equalized Mill Rate
Mill Rate
Total Revenues
Intergovernmental Revenues
Current Year Collection %
Total Expenditures
Education Expenditures
Unemployment (Annual Average)
School Enrollment (State Education Dept.)
TANF Recipients (As a % of Population)
Total Fund Balance (Deficit)
Total Expenditures and Other Financing Uses
Total Revenues and Other Financing Sources
Grand List Data
Property Tax Collection Data
Property Tax Revenues
Net Change In Fund Balance
FISCAL YEARS ENDED 2012 TO 2016
Operating Expenditures
Current Year Adjusted Tax Levy
Net Grand List
Economic Data
Operating Results - General Fund
Fund Balance - General Fund
Total Taxes Collected as a % of Total Outstanding
D - 98
Total Transfers In From Other Funds
Debt Measures
Total Transfers Out To Other Funds
2015
28,113
5,189
Aa1
5.7%
0.1%
2013
$4,362,136,948
22.01
$3,950,412,514
24.54
$96,019,710
99.0%
97.9%
$96,477,212
$14,999,779
$113,514,676
$122,000
$113,636,676
$74,874,327
$36,694,473
$111,568,800
$452,285
$112,021,085
$1,615,591
$0
$1,416,183
$9,390,049
$10,806,232
2014
28,152
5,020
Aa1
4.9%
0.1%
$4,339,760,783
23.03
$3,037,125,308
33.32
$99,925,361
99.3%
98.2%
$100,427,517
$16,438,269
$119,202,654
$103,627
$119,367,278
$79,695,025
$38,798,253
$118,493,278
$478,741
$118,972,019
$395,259
$0
$958,996
$11,201,491
28,022
4,857
Aa1
4.4%
0.1%
$4,617,680,514
21.82
$3,053,042,306
33.31
$100,736,217
99.2%
98.2%
$101,013,572
$15,304,723
$118,584,112
$225,228
$118,809,340
$78,608,340
$39,833,092
$118,441,432
$262,476
$118,703,908
$105,432
$0
$698,388
$10,608,535
$11,306,923
2016
27,865
4,677
Aa1
4.3%
0.1%
$4,558,435,297
22.12
$3,075,391,014
33.07
$100,822,157
99.3%
98.3%
$101,236,267
$16,346,850
$120,198,122
$225,000
$120,423,122
$79,390,666
$39,525,841
$118,916,507
$501,248
$119,417,755
$1,005,367
$0
$868,010
$11,444,280
$12,312,290
28,042
5,424
Aa1
6.1%
0.2%
2012
$4,662,225,678
20.33
$3,924,457,541
24.37
$94,762,206
99.0%
97.9%
$94,848,822
$14,748,930
$111,645,165
$272,536
$112,288,240
$74,459,845
$36,319,325
$110,779,170
$487,946
$111,267,116
$1,021,124
$0
$810,891
$9,190,641
Committed $0 $0
Nonspendable $0 $0 $0
$0
$8,379,750
$0
$0$0
$0
$10,242,495
Restricted
Assigned
Unassigned
$74,202,189
$10,158,928
$69,075,038
$10,337,495
Bonded Long-Term Debt
Annual Debt Service
$85,277,396
$9,609,016
$77,832,315
$10,059,578
$65,056,908
$10,848,088

NORFOLK
Bond Rating (Moody's, as of July 1)
Population (State Dept. of Public Health)
Equalized Net Grand List
Equalized Mill Rate
Mill Rate
Total Revenues
Intergovernmental Revenues
Current Year Collection %
Total Expenditures
Education Expenditures
Unemployment (Annual Average)
School Enrollment (State Education Dept.)
TANF Recipients (As a % of Population)
Total Fund Balance (Deficit)
Total Expenditures and Other Financing Uses
Total Revenues and Other Financing Sources
Grand List Data
Property Tax Collection Data
Property Tax Revenues
Net Change In Fund Balance
FISCAL YEARS ENDED 2012 TO 2016
Operating Expenditures
Current Year Adjusted Tax Levy
Net Grand List
Economic Data
Operating Results - General Fund
Fund Balance - General Fund
Total Taxes Collected as a % of Total Outstanding
D - 99
Total Transfers In From Other Funds
Debt Measures
Total Transfers Out To Other Funds
2015
1,678
222
7.2%
0.0%
2013
$370,367,225
16.95
$309,817,060
20.18
$6,276,277
98.2%
97.1%
$6,333,899
$945,885
$7,480,050
$4,043
$7,484,093
$4,442,161
$3,227,966
$7,670,127
$105,090
$7,775,217
($291,124)
$0
$400,000
$896,668
$1,296,668
2014
1,655
218
6.1%
0.1%
$379,041,219
16.52
$309,443,430
20.22
$6,263,392
98.1%
96.8%
$6,250,980
$1,014,179
$7,460,894
$5,919
$7,626,813
$4,516,476
$3,210,104
$7,726,580
$105,120
$7,831,700
($204,887)
$0
$125,000
$1,091,781
1,643
207
4.9%
0.0%
$420,070,100
15.68
$293,989,070
22.41
$6,586,579
98.7%
97.1%
$6,683,146
$1,041,981
$8,018,400
$5,923
$8,024,323
$4,588,779
$3,324,801
$7,913,580
$98,807
$8,012,387
$11,936
$0
$150,000
$953,717
$1,103,717
2016
1,632
205
4.4%
0.0%
$390,375,013
16.45
$291,908,780
21.95
$6,421,435
99.2%
97.6%
$6,498,803
$1,069,313
$7,784,095
$81,556
$7,865,651
$4,469,222
$2,925,647
$7,394,869
$372,194
$7,767,063
$98,588
$0
$0
$1,202,305
$1,202,305
1,685
228
6.7%
0.4%
2012
$434,258,317
14.31
$308,799,240
20.11
$6,213,689
98.2%
97.0%
$6,237,766
$972,549
$7,415,526
$3,266
$7,418,792
$4,437,501
$3,056,790
$7,494,291
$104,775
$7,599,066
($180,274)
$0
$400,000
$1,587,792
Committed $0 $0
Nonspendable $0 $0 $0
$0
$1,187,792
$0
$0$0
$0
$966,781
Restricted
Assigned
Unassigned
$2,209,707
$314,481
$1,657,336
$224,488
Bonded Long-Term Debt
Annual Debt Service
$2,601,353
$236,652
$2,378,677
$234,895
$1,965,582
$384,445

NORTH BRANFORD
Bond Rating (Moody's, as of July 1)
Population (State Dept. of Public Health)
Equalized Net Grand List
Equalized Mill Rate
Mill Rate
Total Revenues
Intergovernmental Revenues
Current Year Collection %
Total Expenditures
Education Expenditures
Unemployment (Annual Average)
School Enrollment (State Education Dept.)
TANF Recipients (As a % of Population)
Total Fund Balance (Deficit)
Total Expenditures and Other Financing Uses
Total Revenues and Other Financing Sources
Grand List Data
Property Tax Collection Data
Property Tax Revenues
Net Change In Fund Balance
FISCAL YEARS ENDED 2012 TO 2016
Operating Expenditures
Current Year Adjusted Tax Levy
Net Grand List
Economic Data
Operating Results - General Fund
Fund Balance - General Fund
Total Taxes Collected as a % of Total Outstanding
D - 100
Total Transfers In From Other Funds
Debt Measures
Total Transfers Out To Other Funds
2015
14,353
2,187
Aa2
6.0%
0.3%
2013
$1,731,652,915
20.19
$1,258,800,941
27.77
$34,962,731
98.6%
97.0%
$36,672,944
$12,329,642
$49,398,663
$448,482
$56,269,785
$32,125,690
$17,664,575
$49,790,265
$330,512
$56,184,754
$85,031
$0
$921,550
$5,355,806
$7,084,024
2014
14,322
2,116
Aa2
5.2%
0.2%
$1,785,286,052
20.49
$1,261,064,588
29.10
$36,583,775
98.6%
96.8%
$38,210,475
$12,177,678
$50,793,886
$241,497
$51,310,415
$33,134,078
$18,274,245
$51,408,323
$451,000
$51,859,323
($548,908)
$0
$770,917
$6,535,116
14,263
2,043
Aa2
4.7%
0.2%
$1,791,226,642
21.10
$1,257,251,637
29.92
$37,796,012
98.8%
97.3%
$39,837,975
$11,754,418
$52,242,002
$161,825
$58,633,638
$32,867,738
$18,676,313
$51,544,051
$661,507
$57,914,335
$719,303
$0
$931,332
$5,971,887
$7,254,419
2016
14,198
1,959
Aa2
4.2%
0.2%
$1,868,349,731
21.12
$1,264,928,664
31.08
$39,462,777
98.6%
97.0%
$40,817,618
$11,964,082
$53,432,300
$150,674
$54,646,258
$33,357,496
$19,392,666
$52,750,162
$1,015,583
$53,765,745
$880,513
$0
$1,064,275
$6,719,647
$8,134,932
14,379
2,278
Aa2
6.9%
0.3%
2012
$1,790,264,873
19.44
$1,252,555,301
27.77
$34,811,049
98.3%
97.0%
$36,908,932
$12,310,884
$49,859,783
$461,772
$50,712,905
$32,241,566
$17,770,038
$50,011,604
$310,120
$50,321,724
$391,181
$0
$0
$7,071,993
Committed $350,000 $350,000
Nonspendable $1,010 $1,200 $495
$1,445,294
$5,626,204
$806,000
$668$2,004
$777,000
$4,985,195
Restricted
Assigned
Unassigned
$40,272,774
$5,627,213
$36,808,813
$5,515,038
Bonded Long-Term Debt
Annual Debt Service
$48,194,641
$5,449,371
$44,604,543
$5,448,444
$35,507,413
$5,557,683

NORTH CANAAN
Bond Rating (Moody's, as of July 1)
Population (State Dept. of Public Health)
Equalized Net Grand List
Equalized Mill Rate
Mill Rate
Total Revenues
Intergovernmental Revenues
Current Year Collection %
Total Expenditures
Education Expenditures
Unemployment (Annual Average)
School Enrollment (State Education Dept.)
TANF Recipients (As a % of Population)
Total Fund Balance (Deficit)
Total Expenditures and Other Financing Uses
Total Revenues and Other Financing Sources
Grand List Data
Property Tax Collection Data
Property Tax Revenues
Net Change In Fund Balance
FISCAL YEARS ENDED 2012 TO 2016
Operating Expenditures
Current Year Adjusted Tax Levy
Net Grand List
Economic Data
Operating Results - General Fund
Fund Balance - General Fund
Total Taxes Collected as a % of Total Outstanding
D - 101
Total Transfers In From Other Funds
Debt Measures
Total Transfers Out To Other Funds
2015
3,241
439
6.2%
0.1%
2013
$421,768,606
17.54
$344,468,300
21.50
$7,397,796
97.6%
93.7%
$7,494,900
$2,807,012
$10,831,672
$0
$10,831,672
$8,519,198
$2,275,873
$10,795,071
$130,000
$10,925,071
($93,399)
$0
$80,638
$640,347
$750,449
2014
3,214
433
5.3%
0.2%
$440,728,486
17.84
$308,491,940
25.50
$7,863,170
97.1%
93.5%
$7,887,269
$2,752,469
$11,263,956
$0
$11,433,830
$8,765,855
$2,475,985
$11,241,840
$105,665
$11,347,505
$86,325
$0
$16,053
$836,774
3,194
402
4.6%
0.2%
$402,876,674
21.30
$311,241,200
27.50
$8,580,503
97.7%
94.7%
$8,787,168
$3,242,504
$12,232,528
$0
$12,484,275
$9,389,722
$2,578,846
$11,968,568
$200,692
$12,169,260
$315,015
$0
$0
$969,569
$969,569
2016
3,186
390
4.7%
0.1%
$423,613,307
20.59
$318,083,850
27.50
$8,722,544
97.0%
94.3%
$8,653,445
$3,222,424
$12,033,689
$0
$12,033,689
$9,262,495
$2,432,059
$11,694,554
$208,240
$11,902,794
$130,895
$0
$0
$1,100,464
$1,100,464
3,259
427
7.1%
0.1%
2012
$380,117,948
19.07
$345,140,940
21.00
$7,247,567
97.1%
92.9%
$7,328,797
$2,769,732
$10,616,484
$0
$10,616,484
$8,163,226
$2,327,788
$10,491,014
$127,500
$10,618,514
($2,030)
$0
$0
$843,848
Committed $0 $0
Nonspendable $0 $0 $43,939
$0
$799,909
$0
$29,464$0
$0
$820,721
Restricted
Assigned
Unassigned
$2,608,929
$157,912
$2,045,653
$244,761
Bonded Long-Term Debt
Annual Debt Service
$1,846,660
$117,522
$2,529,667
$145,146
$2,462,643
$182,534

NORTH HAVEN
Bond Rating (Moody's, as of July 1)
Population (State Dept. of Public Health)
Equalized Net Grand List
Equalized Mill Rate
Mill Rate
Total Revenues
Intergovernmental Revenues
Current Year Collection %
Total Expenditures
Education Expenditures
Unemployment (Annual Average)
School Enrollment (State Education Dept.)
TANF Recipients (As a % of Population)
Total Fund Balance (Deficit)
Total Expenditures and Other Financing Uses
Total Revenues and Other Financing Sources
Grand List Data
Property Tax Collection Data
Property Tax Revenues
Net Change In Fund Balance
FISCAL YEARS ENDED 2012 TO 2016
Operating Expenditures
Current Year Adjusted Tax Levy
Net Grand List
Economic Data
Operating Results - General Fund
Fund Balance - General Fund
Total Taxes Collected as a % of Total Outstanding
D - 102
Total Transfers In From Other Funds
Debt Measures
Total Transfers Out To Other Funds
2015
23,939
3,562
Aa1
6.4%
0.3%
2013
$3,669,842,887
20.43
$2,826,743,805
26.54
$74,961,885
98.5%
96.5%
$75,763,749
$10,779,393
$89,954,630
$144,277
$90,098,907
$50,439,271
$39,569,289
$90,008,560
$132,571
$90,141,131
($42,224)
$0
$5,423,401
$8,018,349
$13,493,204
2014
23,909
3,449
Aa1
5.5%
0.2%
$3,814,425,244
20.80
$2,813,316,822
28.10
$79,353,113
98.9%
97.0%
$79,605,043
$10,399,054
$93,673,925
$0
$94,600,329
$53,235,992
$41,192,372
$94,428,364
$238,906
$94,667,270
($66,941)
$0
$5,309,386
$13,426,263
23,828
3,359
Aa1
4.8%
0.2%
$3,985,694,949
19.86
$2,813,446,156
28.10
$79,175,603
98.7%
96.9%
$79,591,102
$10,825,225
$94,453,731
$200,645
$95,007,504
$54,392,877
$41,360,150
$95,753,027
$167,559
$95,920,586
($913,082)
$0
$4,957,365
$7,519,929
$12,513,181
2016
23,709
3,246
Aa1
4.3%
0.2%
$3,931,374,956
20.61
$2,750,583,219
29.42
$81,019,674
98.8%
97.1%
$81,149,464
$11,075,271
$96,126,185
$1,200,000
$97,597,345
$55,280,150
$41,735,741
$97,015,891
$593,922
$97,609,813
($12,468)
$0
$4,673,420
$7,748,336
$12,500,713
24,033
3,608
Aa1
7.2%
0.2%
2012
$3,934,550,279
18.97
$2,826,410,341
26.54
$74,623,024
98.4%
96.4%
$74,561,137
$10,631,965
$88,460,684
$52,288
$88,571,665
$49,716,236
$39,456,019
$89,172,255
$286,912
$89,459,167
($887,502)
$0
$6,028,404
$13,535,428
Committed $0 $0
Nonspendable $78,957 $35,887 $28,729
$0
$7,478,295
$0
$51,454$54,055
$0
$8,062,822
Restricted
Assigned
Unassigned
$56,330,385
$6,144,329
$72,419,137
$6,315,065
Bonded Long-Term Debt
Annual Debt Service
$48,011,130
$6,810,334
$50,709,965
$5,721,546
$51,959,198
$6,436,326

NORTH STONINGTON
Bond Rating (Moody's, as of July 1)
Population (State Dept. of Public Health)
Equalized Net Grand List
Equalized Mill Rate
Mill Rate
Total Revenues
Intergovernmental Revenues
Current Year Collection %
Total Expenditures
Education Expenditures
Unemployment (Annual Average)
School Enrollment (State Education Dept.)
TANF Recipients (As a % of Population)
Total Fund Balance (Deficit)
Total Expenditures and Other Financing Uses
Total Revenues and Other Financing Sources
Grand List Data
Property Tax Collection Data
Property Tax Revenues
Net Change In Fund Balance
FISCAL YEARS ENDED 2012 TO 2016
Operating Expenditures
Current Year Adjusted Tax Levy
Net Grand List
Economic Data
Operating Results - General Fund
Fund Balance - General Fund
Total Taxes Collected as a % of Total Outstanding
D - 103
Total Transfers In From Other Funds
Debt Measures
Total Transfers Out To Other Funds
2015
5,291
781
A1
7.1%
0.2%
2013
$750,776,096
16.63
$525,171,170
25.25
$12,488,651
97.9%
96.2%
$12,652,316
$7,005,458
$20,104,955
$999,615
$21,104,570
$13,413,630
$6,026,574
$19,440,204
$1,916,708
$21,356,912
($252,342)
$41,533
$199,830
$495,644
$792,133
2014
5,288
786
6.1%
0.3%
$765,610,254
17.55
$524,625,576
25.60
$13,437,647
98.2%
96.6%
$13,514,652
$6,418,043
$20,358,430
$1,075,140
$21,433,570
$14,097,174
$4,909,415
$19,006,589
$1,302,119
$20,308,708
$1,124,862
$0
$331,329
$1,916,995
5,256
776
4.8%
0.2%
$752,502,500
18.19
$527,841,749
25.85
$13,691,162
97.5%
96.0%
$13,653,917
$5,623,309
$19,620,442
$64,744
$19,685,186
$13,634,499
$5,118,764
$18,753,263
$673,908
$19,427,171
$258,015
$0
$367,761
$1,805,037
$2,175,010
2016
5,271
752
4.0%
0.1%
$718,244,997
19.34
$530,532,505
26.10
$13,889,800
97.4%
95.0%
$13,716,330
$5,698,980
$19,825,306
$22,859
$19,848,165
$14,169,602
$4,988,923
$19,158,525
$750,668
$19,909,193
($61,028)
$0
$199,992
$1,911,561
$2,113,982
5,303
811
A1
7.3%
0.1%
2012
$773,412,110
16.42
$625,589,856
20.29
$12,701,312
97.5%
96.2%
$12,674,628
$6,324,903
$19,461,754
$185,525
$19,647,279
$13,260,002
$5,739,981
$18,999,983
$1,489,004
$20,488,987
($841,708)
$38,419
$251,389
$1,044,475
Committed $0 $0
Nonspendable $2,429 $2,212 $0
$397,061
$357,606
$0
$55,126$49,153
$0
$1,536,513
Restricted
Assigned
Unassigned
$902,500
$567,938
$300,000
$309,089
Bonded Long-Term Debt
Annual Debt Service
$3,897,000
$1,086,089
$540,000
$3,518,749
$600,000
$328,268

NORWALK
Bond Rating (Moody's, as of July 1)
Population (State Dept. of Public Health)
Equalized Net Grand List
Equalized Mill Rate
Mill Rate
Total Revenues
Intergovernmental Revenues
Current Year Collection %
Total Expenditures
Education Expenditures
Unemployment (Annual Average)
School Enrollment (State Education Dept.)
TANF Recipients (As a % of Population)
Total Fund Balance (Deficit)
Total Expenditures and Other Financing Uses
Total Revenues and Other Financing Sources
Grand List Data
Property Tax Collection Data
Property Tax Revenues
Net Change In Fund Balance
FISCAL YEARS ENDED 2012 TO 2016
Operating Expenditures
Current Year Adjusted Tax Levy
Net Grand List
Economic Data
Operating Results - General Fund
Fund Balance - General Fund
Total Taxes Collected as a % of Total Outstanding
D - 104
Total Transfers In From Other Funds
Debt Measures
Total Transfers Out To Other Funds
2015
87,776
11,241
Aaa
6.4%
0.5%
2013
$16,560,812,571
16.34
$12,808,832,698
21.33
$270,616,024
98.5%
97.6%
$267,975,776
$38,613,793
$318,941,728
$0
$336,952,054
$174,748,185
$142,056,818
$316,805,003
$0
$334,664,452
$2,287,602
$0
$3,681,569
$29,750,868
$33,434,052
2014
88,145
11,290
Aaa
5.6%
0.4%
$16,572,378,408
16.99
$12,804,127,889
22.14
$281,643,493
98.6%
97.7%
$281,947,778
$39,957,341
$335,874,995
$0
$335,874,995
$184,591,078
$147,234,362
$331,825,440
$0
$331,825,440
$4,049,555
$0
$2,870,095
$37,483,607
88,485
11,452
Aaa
4.9%
0.4%
$16,956,223,841
17.35
$11,860,740,743
25.04
$294,159,210
98.7%
97.8%
$294,521,123
$42,239,791
$350,494,312
$0
$350,893,225
$190,790,463
$152,027,740
$342,818,203
$771,000
$343,589,203
$7,304,022
$0
$1,498,991
$42,287,811
$44,787,629
2016
88,438
11,540
Aaa
4.4%
0.4%
$17,956,313,819
16.57
$11,902,540,587
24.92
$297,607,889
98.9%
98.0%
$298,453,609
$42,252,345
$356,597,097
$0
$373,284,523
$195,581,632
$155,460,836
$351,042,468
$0
$366,978,551
$6,305,972
$0
$621,275
$47,362,740
$51,093,601
87,190
11,227
Aaa
7.0%
0.6%
2012
$16,955,393,390
15.45
$12,768,816,416
20.74
$261,927,248
98.7%
97.0%
$261,268,852
$35,204,996
$306,767,702
$0
$326,065,627
$173,117,163
$133,238,219
$306,355,382
$0
$325,493,664
$571,963
$0
$2,591,791
$31,146,450
Committed $3,100,000 $1,000,000
Nonspendable $9,586 $827 $22,729
$0
$28,531,930
$0
$1,615$290
$0
$34,613,222
Restricted
Assigned
Unassigned
$219,174,135
$26,233,346
$211,908,621
$27,377,859
Bonded Long-Term Debt
Annual Debt Service
$208,890,443
$26,423,151
$215,950,691
$26,041,998
$216,345,930
$25,858,384

NORWICH
Bond Rating (Moody's, as of July 1)
Population (State Dept. of Public Health)
Equalized Net Grand List
Equalized Mill Rate
Mill Rate
Total Revenues
Intergovernmental Revenues
Current Year Collection %
Total Expenditures
Education Expenditures
Unemployment (Annual Average)
School Enrollment (State Education Dept.)
TANF Recipients (As a % of Population)
Total Fund Balance (Deficit)
Total Expenditures and Other Financing Uses
Total Revenues and Other Financing Sources
Grand List Data
Property Tax Collection Data
Property Tax Revenues
Net Change In Fund Balance
FISCAL YEARS ENDED 2012 TO 2016
Operating Expenditures
Current Year Adjusted Tax Levy
Net Grand List
Economic Data
Operating Results - General Fund
Fund Balance - General Fund
Total Taxes Collected as a % of Total Outstanding
D - 105
Total Transfers In From Other Funds
Debt Measures
Total Transfers Out To Other Funds
2015
40,347
5,413
Aa2
9.7%
2.1%
2013
$2,919,737,142
22.13
$2,432,705,109
26.90
$64,618,000
96.5%
93.8%
$64,821,000
$43,580,000
$112,150,000
$7,690,000
$119,840,000
$75,394,000
$41,230,000
$116,624,000
$2,656,000
$119,280,000
$560,000
$0
$920,000
$10,275,000
$11,195,000
2014
40,178
5,380
Aa2
8.4%
2.2%
$2,936,727,830
22.45
$2,423,927,020
27.23
$65,922,000
96.6%
94.8%
$66,620,000
$44,891,000
$115,388,000
$7,357,000
$123,362,000
$77,381,000
$43,777,000
$121,158,000
$2,418,000
$123,576,000
($214,000)
$0
$498,000
$10,981,000
39,899
5,373
Aa2
7.3%
2.1%
$2,574,691,786
26.90
$1,795,651,420
38.55
$69,247,000
96.1%
94.2%
$69,578,000
$42,763,000
$116,214,000
$6,458,000
$122,672,000
$77,145,000
$44,275,000
$121,420,000
$1,834,000
$123,254,000
($582,000)
$0
$207,000
$10,192,000
$10,399,000
2016
39,556
5,268
Aa2
6.1%
1.8%
$2,670,158,201
27.85
$1,801,147,830
40.90
$74,375,000
96.8%
95.0%
$76,946,000
$45,537,000
$126,190,000
$5,147,000
$131,337,000
$80,621,000
$39,954,000
$120,575,000
$6,282,000
$126,857,000
$4,480,000
$0
$227,000
$14,652,000
$14,879,000
40,502
5,381
Aa2
10.1%
2.1%
2012
$2,942,693,727
20.09
$2,390,861,539
25.12
$59,108,000
96.5%
93.5%
$59,244,000
$42,703,000
$105,596,000
$7,222,000
$112,818,000
$72,021,000
$38,287,000
$110,308,000
$2,702,000
$113,010,000
($192,000)
$0
$264,000
$10,635,000
Committed $0 $0
Nonspendable $0 $0 $0
$0
$10,371,000
$0
$0$0
$0
$10,483,000
Restricted
Assigned
Unassigned
$41,933,000
$5,613,000
$49,240,000
$5,743,000
Bonded Long-Term Debt
Annual Debt Service
$37,740,000
$4,990,000
$33,757,000
$5,164,000
$44,629,000
$5,618,000

OLD LYME
Bond Rating (Moody's, as of July 1)
Population (State Dept. of Public Health)
Equalized Net Grand List
Equalized Mill Rate
Mill Rate
Total Revenues
Intergovernmental Revenues
Current Year Collection %
Total Expenditures
Education Expenditures
Unemployment (Annual Average)
School Enrollment (State Education Dept.)
TANF Recipients (As a % of Population)
Total Fund Balance (Deficit)
Total Expenditures and Other Financing Uses
Total Revenues and Other Financing Sources
Grand List Data
Property Tax Collection Data
Property Tax Revenues
Net Change In Fund Balance
FISCAL YEARS ENDED 2012 TO 2016
Operating Expenditures
Current Year Adjusted Tax Levy
Net Grand List
Economic Data
Operating Results - General Fund
Fund Balance - General Fund
Total Taxes Collected as a % of Total Outstanding
D - 106
Total Transfers In From Other Funds
Debt Measures
Total Transfers Out To Other Funds
2015
7,592
1,167
6.1%
0.2%
2013
$2,132,599,269
14.47
$1,602,010,270
19.26
$30,856,122
98.6%
97.3%
$31,007,655
$1,206,956
$33,184,285
$10,519
$33,194,804
$24,293,158
$8,153,781
$32,446,939
$195,000
$32,641,939
$552,865
$0
$0
$5,279,040
$5,791,453
2014
7,575
1,141
5.3%
0.1%
$2,251,479,918
13.76
$1,607,851,495
19.30
$30,979,275
98.8%
97.7%
$31,324,083
$1,293,677
$33,631,039
$318,125
$33,949,164
$24,314,383
$8,119,959
$32,434,342
$215,000
$32,649,342
$1,299,822
$0
$0
$7,091,275
7,521
1,091
4.5%
0.1%
$2,257,111,193
14.05
$1,614,323,371
19.66
$31,720,793
98.7%
97.8%
$31,980,235
$1,135,130
$33,991,939
$38,254
$34,030,193
$24,649,113
$8,207,207
$32,856,320
$634,296
$33,490,616
$539,577
$0
$0
$6,827,652
$7,630,852
2016
7,469
1,082
3.7%
0.1%
$2,235,564,264
14.42
$1,564,656,985
20.62
$32,235,851
98.7%
97.6%
$32,484,141
$1,641,583
$35,132,803
$38,400
$35,180,003
$25,014,080
$8,120,063
$33,134,143
$626,000
$33,760,143
$1,419,860
$0
$534,609
$7,857,179
$9,050,712
7,592
1,187
6.8%
0.1%
2012
$2,120,679,355
14.13
$1,596,444,820
18.80
$29,967,309
98.6%
97.5%
$30,236,684
$1,162,359
$32,363,383
$166,696
$32,530,079
$23,285,508
$7,944,181
$31,229,689
$595,000
$31,824,689
$705,390
$0
$0
$5,238,588
Committed $0 $455,171
Nonspendable $658,924 $348,029 $47,467
$274,846
$4,916,275
$365,109
$147,304$178,186
$368,626
$6,544,463
Restricted
Assigned
Unassigned
$31,054,606
$493,004
$29,958,715
$405,139
Bonded Long-Term Debt
Annual Debt Service
$36,388,755
$507,643
$34,287,762
$501,643
$32,521,762
$377,250

OLD SAYBROOK
Bond Rating (Moody's, as of July 1)
Population (State Dept. of Public Health)
Equalized Net Grand List
Equalized Mill Rate
Mill Rate
Total Revenues
Intergovernmental Revenues
Current Year Collection %
Total Expenditures
Education Expenditures
Unemployment (Annual Average)
School Enrollment (State Education Dept.)
TANF Recipients (As a % of Population)
Total Fund Balance (Deficit)
Total Expenditures and Other Financing Uses
Total Revenues and Other Financing Sources
Grand List Data
Property Tax Collection Data
Property Tax Revenues
Net Change In Fund Balance
FISCAL YEARS ENDED 2012 TO 2016
Operating Expenditures
Current Year Adjusted Tax Levy
Net Grand List
Economic Data
Operating Results - General Fund
Fund Balance - General Fund
Total Taxes Collected as a % of Total Outstanding
D - 107
Total Transfers In From Other Funds
Debt Measures
Total Transfers Out To Other Funds
2015
10,246
1,477
Aa2
6.3%
0.1%
2013
$2,806,949,497
12.91
$2,481,098,808
14.62
$36,228,621
99.3%
98.9%
$36,383,563
$3,651,327
$41,005,271
$0
$41,432,047
$24,745,084
$15,095,477
$39,840,561
$783,000
$40,623,561
$808,486
$0
$0
$3,376,384
$3,376,384
2014
10,217
1,417
Aa2
5.3%
0.1%
$2,994,856,250
12.63
$2,488,991,824
15.20
$37,813,661
99.1%
98.6%
$37,831,554
$4,106,868
$42,968,713
$0
$42,986,913
$26,165,008
$16,184,424
$42,349,432
$1,148,101
$43,497,533
($510,620)
$0
$0
$2,865,764
10,160
1,409
Aa2
4.7%
0.1%
$3,114,802,811
12.94
$2,179,627,638
18.50
$40,303,722
99.1%
98.6%
$40,581,969
$5,069,967
$46,788,039
$10,000
$47,310,949
$27,286,135
$18,187,523
$45,473,658
$1,016,354
$46,490,012
$820,937
$143,100
$0
$3,513,946
$3,686,701
2016
10,093
1,351
Aa2
4.3%
0.1%
$3,181,508,486
13.06
$2,219,086,904
18.81
$41,542,750
99.1%
98.7%
$41,747,791
$4,562,670
$47,605,190
$0
$47,605,190
$27,971,556
$18,033,215
$46,004,771
$864,599
$46,869,370
$735,820
$143,100
$0
$4,229,832
$4,422,521
10,238
1,539
Aa2
7.0%
0.1%
2012
$3,026,981,891
11.47
$2,481,624,770
14.06
$34,709,525
99.4%
98.9%
$34,871,775
$3,610,035
$39,517,560
$0
$39,517,560
$24,144,507
$15,164,841
$39,309,348
$309,000
$39,618,348
($100,788)
$0
$0
$2,567,898
Committed $49,589 $29,655
Nonspendable $0 $0 $0
$0
$2,567,898
$0
$0$0
$0
$2,865,764
Restricted
Assigned
Unassigned
$31,773,190
$2,197,325
$35,274,791
$4,070,729
Bonded Long-Term Debt
Annual Debt Service
$19,245,000
$2,488,725
$19,040,000
$2,449,919
$38,212,389
$3,849,049

ORANGE
Bond Rating (Moody's, as of July 1)
Population (State Dept. of Public Health)
Equalized Net Grand List
Equalized Mill Rate
Mill Rate
Total Revenues
Intergovernmental Revenues
Current Year Collection %
Total Expenditures
Education Expenditures
Unemployment (Annual Average)
School Enrollment (State Education Dept.)
TANF Recipients (As a % of Population)
Total Fund Balance (Deficit)
Total Expenditures and Other Financing Uses
Total Revenues and Other Financing Sources
Grand List Data
Property Tax Collection Data
Property Tax Revenues
Net Change In Fund Balance
FISCAL YEARS ENDED 2012 TO 2016
Operating Expenditures
Current Year Adjusted Tax Levy
Net Grand List
Economic Data
Operating Results - General Fund
Fund Balance - General Fund
Total Taxes Collected as a % of Total Outstanding
D - 108
Total Transfers In From Other Funds
Debt Measures
Total Transfers Out To Other Funds
2015
13,953
2,438
Aa1
5.7%
0.1%
2013
$2,124,005,571
26.28
$1,781,125,417
31.20
$55,824,616
99.3%
99.1%
$56,152,014
$5,026,798
$62,872,471
$112,000
$62,984,471
$40,376,009
$20,380,338
$60,756,347
$0
$60,756,347
$2,228,124
$0
$824,543
$8,607,747
$9,445,690
2014
13,955
2,373
Aa1
4.9%
0.1%
$2,704,439,983
21.32
$1,892,490,448
30.50
$57,670,976
99.1%
99.1%
$57,810,283
$4,956,456
$64,537,515
$216,714
$64,754,229
$41,961,871
$21,122,224
$63,084,095
$1,953,715
$65,037,810
($283,581)
$0
$993,680
$9,162,109
13,944
2,351
Aa1
4.2%
0.2%
$2,863,987,193
20.51
$1,911,740,328
30.80
$58,731,779
99.3%
99.1%
$58,830,178
$4,620,212
$64,900,497
$210,242
$65,110,739
$42,516,288
$21,095,179
$63,611,467
$0
$63,611,467
$1,499,272
$0
$1,232,715
$9,415,266
$10,661,381
2016
13,912
2,304
Aa1
3.9%
0.1%
$2,891,806,320
20.86
$1,921,064,120
31.40
$60,318,829
99.4%
99.3%
$60,374,182
$5,118,888
$67,324,863
$870,351
$68,195,214
$44,175,681
$22,901,574
$67,077,255
$529,315
$67,606,570
$588,644
$0
$1,265,994
$9,970,631
$11,250,025
13,935
2,507
Aa1
6.0%
0.1%
2012
$2,268,631,410
23.26
$1,752,048,366
30.20
$52,769,717
98.9%
98.7%
$52,873,997
$4,104,403
$58,516,854
$83,000
$62,368,903
$39,615,890
$18,862,905
$58,478,795
$0
$62,165,843
$203,060
$0
$463,446
$7,217,566
Committed $0 $0
Nonspendable $13,400 $13,400 $22,377
$0
$6,731,743
$0
$13,400$13,400
$0
$8,155,029
Restricted
Assigned
Unassigned
$41,537,655
$2,473,769
$42,488,781
$6,375,710
Bonded Long-Term Debt
Annual Debt Service
$42,393,943
$2,279,792
$39,995,102
$2,448,415
$46,127,120
$10,973,634

OXFORD
Bond Rating (Moody's, as of July 1)
Population (State Dept. of Public Health)
Equalized Net Grand List
Equalized Mill Rate
Mill Rate
Total Revenues
Intergovernmental Revenues
Current Year Collection %
Total Expenditures
Education Expenditures
Unemployment (Annual Average)
School Enrollment (State Education Dept.)
TANF Recipients (As a % of Population)
Total Fund Balance (Deficit)
Total Expenditures and Other Financing Uses
Total Revenues and Other Financing Sources
Grand List Data
Property Tax Collection Data
Property Tax Revenues
Net Change In Fund Balance
FISCAL YEARS ENDED 2012 TO 2016
Operating Expenditures
Current Year Adjusted Tax Levy
Net Grand List
Economic Data
Operating Results - General Fund
Fund Balance - General Fund
Total Taxes Collected as a % of Total Outstanding
D - 109
Total Transfers In From Other Funds
Debt Measures
Total Transfers Out To Other Funds
2015
12,874
2,149
Aa2
6.1%
0.1%
2013
$1,971,212,881
17.22
$1,402,989,404
24.10
$33,952,365
98.1%
89.0%
$33,941,529
$8,797,397
$44,190,396
$0
$44,190,396
$28,790,894
$12,880,453
$41,671,347
$1,119,000
$42,790,347
$1,400,049
$0
$500,000
$5,627,712
$6,127,712
2014
12,914
2,102
Aa2
5.4%
0.1%
$2,060,045,317
17.02
$1,408,304,205
24.75
$35,064,485
98.4%
94.4%
$35,883,902
$8,850,880
$46,017,760
$0
$46,017,760
$30,419,090
$14,348,355
$44,767,445
$1,022,563
$45,790,008
$227,752
$0
$706,342
$6,355,464
13,013
2,026
Aa2
4.8%
0.1%
$2,078,413,013
17.20
$1,426,288,805
24.87
$35,758,406
98.5%
94.4%
$35,798,527
$8,642,457
$46,460,320
$0
$46,460,320
$30,525,846
$15,066,762
$45,592,608
$1,126,000
$46,718,608
($258,288)
$0
$753,000
$5,233,092
$6,097,176
2016
12,984
2,037
Aa2
4.2%
0.1%
$2,121,407,917
17.04
$1,442,578,157
24.96
$36,140,159
98.4%
94.7%
$36,410,153
$8,541,198
$49,171,149
$31,260
$55,355,409
$31,084,769
$16,261,680
$47,346,449
$1,774,000
$49,120,449
$6,234,960
$0
$1,221,677
$11,106,427
$12,332,136
12,819
2,216
Aa2
6.6%
0.1%
2012
$1,995,523,927
16.26
$1,396,510,989
23.21
$32,456,789
98.1%
88.2%
$32,541,059
$8,938,426
$42,718,153
$40,000
$42,758,153
$27,912,746
$13,212,315
$41,125,061
$373,129
$41,498,190
$1,259,963
$0
$0
$4,727,663
Committed $0 $0
Nonspendable $4,032 $111,084 $0
$0
$4,727,663
$0
$0$105,258
$0
$5,543,864
Restricted
Assigned
Unassigned
$24,766,853
$2,966,279
$20,929,228
$3,742,213
Bonded Long-Term Debt
Annual Debt Service
$27,816,662
$3,072,257
$26,804,955
$2,891,863
$22,670,312
$2,988,942

PLAINFIELD
Bond Rating (Moody's, as of July 1)
Population (State Dept. of Public Health)
Equalized Net Grand List
Equalized Mill Rate
Mill Rate
Total Revenues
Intergovernmental Revenues
Current Year Collection %
Total Expenditures
Education Expenditures
Unemployment (Annual Average)
School Enrollment (State Education Dept.)
TANF Recipients (As a % of Population)
Total Fund Balance (Deficit)
Total Expenditures and Other Financing Uses
Total Revenues and Other Financing Sources
Grand List Data
Property Tax Collection Data
Property Tax Revenues
Net Change In Fund Balance
FISCAL YEARS ENDED 2012 TO 2016
Operating Expenditures
Current Year Adjusted Tax Levy
Net Grand List
Economic Data
Operating Results - General Fund
Fund Balance - General Fund
Total Taxes Collected as a % of Total Outstanding
D - 110
Total Transfers In From Other Funds
Debt Measures
Total Transfers Out To Other Funds
2015
15,228
2,394
Aa3
9.6%
1.1%
2013
$1,139,986,603
19.55
$1,034,874,050
21.52
$22,289,566
97.0%
93.8%
$22,460,749
$22,456,817
$47,189,996
$0
$47,189,996
$36,236,087
$10,366,817
$46,602,904
$15,583
$46,618,487
$571,509
$0
$200,000
$6,580,247
$6,834,190
2014
15,135
2,350
Aa3
8.3%
1.0%
$1,194,642,329
19.89
$835,558,360
28.36
$23,766,415
96.7%
93.8%
$23,881,192
$22,397,613
$48,893,663
$0
$54,541,003
$37,742,762
$10,745,347
$48,488,109
$19,082
$53,921,677
$619,326
$0
$700,000
$7,453,516
15,077
2,277
Aa3
7.2%
1.0%
$1,327,203,231
19.45
$906,915,290
28.36
$25,813,988
97.3%
94.8%
$26,169,980
$22,338,181
$51,239,143
$144,500
$51,489,235
$39,308,971
$10,850,015
$50,158,986
$954,305
$51,113,291
$375,944
$8,921
$1,900,000
$5,915,560
$7,829,460
2016
15,067
2,294
Aa3
6.0%
0.8%
$1,315,005,038
19.66
$910,620,960
28.36
$25,855,061
97.8%
95.0%
$26,039,694
$22,220,524
$50,690,564
$359,000
$51,049,564
$39,109,612
$11,286,009
$50,395,621
$15,583
$50,411,204
$638,360
$7,747
$2,100,000
$6,355,407
$8,467,820
15,267
2,474
Aa3
10.2%
1.3%
2012
$1,382,986,125
15.46
$1,030,619,800
20.79
$21,383,467
96.8%
93.4%
$21,769,554
$22,623,295
$47,856,935
$0
$48,005,935
$35,711,515
$10,801,400
$46,512,915
$29,230
$46,542,145
$1,463,790
$0
$200,000
$6,262,681
Committed $0 $0
Nonspendable $4,666 $4,979 $40,287
$0
$6,022,394
$0
$53,943$9,696
$0
$6,743,820
Restricted
Assigned
Unassigned
$11,688,692
$1,740,596
$9,652,628
$1,507,800
Bonded Long-Term Debt
Annual Debt Service
$14,170,339
$2,726,756
$12,839,078
$1,907,444
$10,713,090
$1,553,515

PLAINVILLE
Bond Rating (Moody's, as of July 1)
Population (State Dept. of Public Health)
Equalized Net Grand List
Equalized Mill Rate
Mill Rate
Total Revenues
Intergovernmental Revenues
Current Year Collection %
Total Expenditures
Education Expenditures
Unemployment (Annual Average)
School Enrollment (State Education Dept.)
TANF Recipients (As a % of Population)
Total Fund Balance (Deficit)
Total Expenditures and Other Financing Uses
Total Revenues and Other Financing Sources
Grand List Data
Property Tax Collection Data
Property Tax Revenues
Net Change In Fund Balance
FISCAL YEARS ENDED 2012 TO 2016
Operating Expenditures
Current Year Adjusted Tax Levy
Net Grand List
Economic Data
Operating Results - General Fund
Fund Balance - General Fund
Total Taxes Collected as a % of Total Outstanding
D - 111
Total Transfers In From Other Funds
Debt Measures
Total Transfers Out To Other Funds
2015
17,820
2,401
Aa3
7.5%
0.6%
2013
$1,911,842,160
21.59
$1,336,143,552
30.89
$41,281,930
97.6%
94.3%
$41,481,988
$15,895,074
$58,926,610
$1,757,683
$60,684,293
$36,498,345
$19,334,876
$55,833,221
$2,154,648
$57,987,869
$2,696,424
$0
$757,006
$5,863,288
$6,798,329
2014
17,801
2,368
Aa3
6.3%
0.7%
$1,884,896,086
22.24
$1,339,175,184
31.38
$41,919,332
97.8%
95.3%
$42,459,637
$16,527,208
$60,083,483
$4,987,858
$65,071,341
$37,928,248
$19,560,214
$57,488,462
$2,346,712
$59,835,174
$5,236,167
$0
$707,402
$12,034,496
17,773
2,417
Aa3
5.3%
0.6%
$1,996,265,966
21.33
$1,353,751,450
31.38
$42,584,731
97.7%
94.8%
$42,676,572
$15,660,130
$59,578,204
$305,670
$59,883,874
$37,599,680
$20,441,436
$58,041,116
$2,820,911
$60,862,027
($978,153)
$0
$445,166
$10,443,073
$11,056,343
2016
17,677
2,415
Aa3
4.8%
0.5%
$1,936,585,287
22.55
$1,363,370,576
31.83
$43,669,442
97.9%
94.9%
$44,113,227
$16,214,440
$61,995,041
$320,221
$67,786,239
$38,395,769
$21,033,061
$59,428,830
$3,143,704
$67,933,951
($147,712)
$0
$1,173,970
$9,487,712
$10,908,631
17,819
2,444
Aa3
8.1%
0.5%
2012
$1,936,121,474
20.93
$1,400,251,680
28.98
$40,514,611
97.5%
94.8%
$40,212,765
$15,944,124
$57,075,385
$292,462
$70,317,130
$36,497,815
$19,526,761
$56,024,576
$747,336
$69,812,003
$505,127
$0
$829,164
$4,101,905
Committed $198,387 $147,710
Nonspendable $48,562 $20,394 $131,039
$171,312
$2,970,390
$171,666
$6,369$13,767
$147,672
$11,165,655
Restricted
Assigned
Unassigned
$52,418,042
$6,026,533
$43,663,334
$6,042,767
Bonded Long-Term Debt
Annual Debt Service
$60,379,701
$6,517,468
$56,866,695
$6,004,097
$48,429,353
$6,099,523

PLYMOUTH
Bond Rating (Moody's, as of July 1)
Population (State Dept. of Public Health)
Equalized Net Grand List
Equalized Mill Rate
Mill Rate
Total Revenues
Intergovernmental Revenues
Current Year Collection %
Total Expenditures
Education Expenditures
Unemployment (Annual Average)
School Enrollment (State Education Dept.)
TANF Recipients (As a % of Population)
Total Fund Balance (Deficit)
Total Expenditures and Other Financing Uses
Total Revenues and Other Financing Sources
Grand List Data
Property Tax Collection Data
Property Tax Revenues
Net Change In Fund Balance
FISCAL YEARS ENDED 2012 TO 2016
Operating Expenditures
Current Year Adjusted Tax Levy
Net Grand List
Economic Data
Operating Results - General Fund
Fund Balance - General Fund
Total Taxes Collected as a % of Total Outstanding
D - 112
Total Transfers In From Other Funds
Debt Measures
Total Transfers Out To Other Funds
2015
12,047
1,797
Aa3
9.1%
0.6%
2013
$1,081,692,950
24.37
$756,780,585
34.90
$26,362,764
96.3%
90.1%
$26,663,027
$13,523,084
$40,810,009
$350,000
$41,160,009
$25,466,681
$13,560,457
$39,027,138
$1,938,414
$40,965,552
$194,457
$0
$1,423,169
$2,163,609
$3,586,778
2014
11,914
1,748
Aa3
7.9%
0.6%
$1,029,418,266
26.03
$757,086,852
35.45
$26,796,701
97.3%
92.6%
$28,144,326
$13,704,348
$42,564,272
$0
$46,485,447
$26,530,771
$15,018,363
$41,549,134
$978,380
$46,305,352
($98,254)
$0
$992,663
$2,880,000
11,813
1,716
Aa3
6.9%
0.7%
$1,011,116,331
26.13
$760,896,938
34.85
$26,416,624
98.0%
95.9%
$27,022,201
$12,988,070
$41,136,707
$0
$41,136,707
$25,479,888
$15,688,624
$41,168,512
$843,225
$42,011,737
($606,681)
$0
$529,681
$1,643,638
$2,273,319
2016
11,749
1,678
6.0%
0.5%
$1,052,827,086
25.65
$764,173,358
35.43
$27,003,099
97.9%
96.3%
$27,131,451
$13,674,264
$41,311,237
$60,000
$41,371,237
$25,806,526
$15,525,879
$41,332,405
$691,000
$42,023,405
($652,168)
$0
$1,096,211
$424,940
$1,621,151
12,089
1,820
Aa3
9.7%
0.5%
2012
$1,075,877,169
24.04
$823,527,223
31.50
$25,865,788
95.9%
89.5%
$25,774,406
$13,940,909
$40,453,516
$350,000
$40,803,516
$25,174,301
$14,648,822
$39,823,123
$817,315
$40,640,438
$163,078
$0
$1,538,968
$3,392,321
Committed $100,000 $100,000
Nonspendable $0 $0 $0
$0
$1,853,353
$0
$0$0
$100,000
$1,787,337
Restricted
Assigned
Unassigned
$25,325,000
$2,930,565
$21,912,407
$3,028,129
Bonded Long-Term Debt
Annual Debt Service
$15,485,000
$3,146,549
$23,850,000
$1,785,177
$23,025,000
$3,013,365

POMFRET
Bond Rating (Moody's, as of July 1)
Population (State Dept. of Public Health)
Equalized Net Grand List
Equalized Mill Rate
Mill Rate
Total Revenues
Intergovernmental Revenues
Current Year Collection %
Total Expenditures
Education Expenditures
Unemployment (Annual Average)
School Enrollment (State Education Dept.)
TANF Recipients (As a % of Population)
Total Fund Balance (Deficit)
Total Expenditures and Other Financing Uses
Total Revenues and Other Financing Sources
Grand List Data
Property Tax Collection Data
Property Tax Revenues
Net Change In Fund Balance
FISCAL YEARS ENDED 2012 TO 2016
Operating Expenditures
Current Year Adjusted Tax Levy
Net Grand List
Economic Data
Operating Results - General Fund
Fund Balance - General Fund
Total Taxes Collected as a % of Total Outstanding
D - 113
Total Transfers In From Other Funds
Debt Measures
Total Transfers Out To Other Funds
2015
4,198
679
5.6%
0.2%
2013
$454,037,339
18.07
$357,238,604
22.98
$8,204,203
98.3%
97.3%
$8,265,535
$4,579,093
$13,019,591
$20,037
$13,039,628
$10,583,518
$1,495,519
$12,079,037
$706,100
$12,785,137
$254,491
$0
$366,177
$852,004
$1,218,181
2014
4,179
633
4.8%
0.1%
$424,281,528
20.15
$358,044,798
23.79
$8,549,374
98.5%
97.3%
$8,638,528
$4,658,385
$13,523,183
$74,302
$13,597,485
$10,876,672
$1,927,965
$12,804,637
$375,111
$13,179,748
$417,737
$0
$419,108
$1,635,920
4,163
608
4.2%
0.2%
$505,702,079
17.20
$360,278,691
24.13
$8,698,880
99.0%
98.2%
$8,871,446
$4,760,838
$13,819,838
$71,716
$13,891,554
$11,246,794
$2,042,191
$13,288,985
$410,422
$13,699,407
$192,147
$0
$307,550
$1,520,517
$1,828,067
2016
4,149
602
3.4%
0.2%
$469,782,177
18.79
$363,706,721
24.24
$8,826,456
99.1%
98.7%
$8,953,068
$4,165,929
$13,344,694
$33,611
$13,378,305
$10,594,981
$2,109,912
$12,704,893
$389,492
$13,094,385
$283,920
$0
$338,550
$1,773,437
$2,111,987
4,217
693
6.3%
0.2%
2012
$485,554,110
16.27
$355,587,972
22.26
$7,899,074
98.1%
97.1%
$7,895,000
$4,495,615
$12,634,109
$16,782
$12,650,891
$10,355,646
$1,507,352
$11,862,998
$701,100
$12,564,098
$86,793
$0
$363,907
$963,692
Committed $0 $0
Nonspendable $0 $0 $0
$0
$599,785
$0
$0$0
$0
$1,216,812
Restricted
Assigned
Unassigned
$4,459,000
$422,839
$7,371,000
$411,679
Bonded Long-Term Debt
Annual Debt Service
$4,966,000
$549,503
$4,712,000
$429,510
$4,206,000
$417,071

PORTLAND
Bond Rating (Moody's, as of July 1)
Population (State Dept. of Public Health)
Equalized Net Grand List
Equalized Mill Rate
Mill Rate
Total Revenues
Intergovernmental Revenues
Current Year Collection %
Total Expenditures
Education Expenditures
Unemployment (Annual Average)
School Enrollment (State Education Dept.)
TANF Recipients (As a % of Population)
Total Fund Balance (Deficit)
Total Expenditures and Other Financing Uses
Total Revenues and Other Financing Sources
Grand List Data
Property Tax Collection Data
Property Tax Revenues
Net Change In Fund Balance
FISCAL YEARS ENDED 2012 TO 2016
Operating Expenditures
Current Year Adjusted Tax Levy
Net Grand List
Economic Data
Operating Results - General Fund
Fund Balance - General Fund
Total Taxes Collected as a % of Total Outstanding
D - 114
Total Transfers In From Other Funds
Debt Measures
Total Transfers Out To Other Funds
2015
9,456
1,428
Aa3
6.2%
0.4%
2013
$1,138,755,293
21.52
$796,696,045
30.73
$24,508,177
98.6%
97.6%
$24,748,282
$6,777,356
$32,474,671
$36,995
$32,727,903
$20,216,816
$10,423,549
$30,640,365
$1,180,446
$31,820,811
$907,092
$0
$504,569
$5,048,238
$5,660,128
2014
9,444
1,436
Aa3
5.4%
0.3%
$1,123,640,030
22.24
$795,869,961
31.28
$24,985,915
98.5%
97.1%
$24,993,223
$6,797,856
$32,710,977
$37,215
$32,748,192
$20,983,986
$10,505,918
$31,489,904
$1,520,441
$33,010,345
($262,153)
$0
$321,620
$5,397,975
9,391
1,383
Aa3
4.8%
0.3%
$1,139,281,295
22.49
$801,938,884
31.78
$25,626,817
98.3%
96.8%
$25,715,084
$6,788,227
$33,450,128
$0
$33,450,128
$21,094,353
$10,897,121
$31,991,474
$1,106,737
$33,098,211
$351,917
$0
$474,056
$5,108,122
$5,749,892
2016
9,349
1,401
Aa3
4.6%
0.3%
$1,124,230,415
23.25
$804,546,811
32.34
$26,142,320
98.7%
97.2%
$26,303,134
$6,731,383
$34,206,154
$0
$34,206,154
$21,778,087
$11,086,709
$32,864,796
$1,101,445
$33,966,241
$239,913
$0
$344,556
$5,473,132
$5,989,805
9,472
1,420
Aa3
6.7%
0.3%
2012
$1,117,214,797
21.62
$855,869,519
28.15
$24,154,606
98.6%
97.4%
$24,467,163
$6,347,357
$32,127,450
$35,900
$32,163,350
$19,793,291
$10,530,835
$30,324,126
$997,516
$31,321,642
$841,708
$0
$345,783
$4,753,036
Committed $172,117 $167,714
Nonspendable $0 $0 $0
$97,668
$4,309,585
$107,321
$0$0
$136,565
$4,939,790
Restricted
Assigned
Unassigned
$15,905,860
$2,520,086
$12,625,110
$2,695,142
Bonded Long-Term Debt
Annual Debt Service
$19,740,476
$2,688,267
$17,931,472
$2,637,759
$14,932,412
$2,803,149

PRESTON
Bond Rating (Moody's, as of July 1)
Population (State Dept. of Public Health)
Equalized Net Grand List
Equalized Mill Rate
Mill Rate
Total Revenues
Intergovernmental Revenues
Current Year Collection %
Total Expenditures
Education Expenditures
Unemployment (Annual Average)
School Enrollment (State Education Dept.)
TANF Recipients (As a % of Population)
Total Fund Balance (Deficit)
Total Expenditures and Other Financing Uses
Total Revenues and Other Financing Sources
Grand List Data
Property Tax Collection Data
Property Tax Revenues
Net Change In Fund Balance
FISCAL YEARS ENDED 2012 TO 2016
Operating Expenditures
Current Year Adjusted Tax Levy
Net Grand List
Economic Data
Operating Results - General Fund
Fund Balance - General Fund
Total Taxes Collected as a % of Total Outstanding
D - 115
Total Transfers In From Other Funds
Debt Measures
Total Transfers Out To Other Funds
2015
4,755
609
7.8%
0.4%
2013
$550,789,648
16.14
$456,396,638
19.43
$8,889,980
98.3%
97.8%
$8,941,779
$5,631,824
$15,862,316
$0
$15,862,316
$11,017,203
$3,866,863
$14,884,066
$423,520
$15,307,586
$554,730
$824
$892,072
$2,193,494
$3,117,091
2014
4,748
617
6.8%
0.4%
$545,559,501
16.75
$381,825,751
23.70
$9,137,163
97.8%
97.3%
$9,159,588
$6,093,850
$16,298,468
$5
$16,298,473
$12,065,450
$3,852,195
$15,917,645
$123,853
$16,041,498
$256,975
$2,112
$551,338
$3,374,066
4,707
609
5.6%
0.4%
$550,138,881
16.57
$392,192,485
23.14
$9,115,447
98.1%
96.1%
$9,207,560
$5,644,492
$16,078,431
$4
$16,078,435
$11,560,965
$3,918,350
$15,479,315
$315,155
$15,794,470
$283,965
$2,112
$757,060
$2,879,784
$3,658,031
2016
4,685
648
4.9%
0.3%
$538,805,849
16.92
$394,076,849
23.00
$9,116,594
98.1%
97.2%
$9,150,633
$5,818,194
$16,169,516
$1,181
$16,170,697
$12,070,980
$4,079,873
$16,150,853
$256,800
$16,407,653
($236,956)
$2,112
$787,116
$2,631,847
$3,421,075
4,753
610
8.4%
0.4%
2012
$556,056,278
15.84
$451,688,224
19.43
$8,809,312
98.0%
97.3%
$8,968,685
$5,603,798
$15,644,869
$41,961
$15,686,830
$11,166,085
$3,600,977
$14,767,062
$163,141
$14,930,203
$756,627
$930
$297,300
$2,562,361
Committed $0 $0
Nonspendable $0 $19,075 $0
$0
$2,264,131
$0
$30,701$19,075
$0
$2,801,541
Restricted
Assigned
Unassigned
$6,373,000
$650,535
$5,385,000
$680,114
Bonded Long-Term Debt
Annual Debt Service
$3,668,766
$684,679
$4,828,000
$799,938
$5,923,000
$688,833

PROSPECT
Bond Rating (Moody's, as of July 1)
Population (State Dept. of Public Health)
Equalized Net Grand List
Equalized Mill Rate
Mill Rate
Total Revenues
Intergovernmental Revenues
Current Year Collection %
Total Expenditures
Education Expenditures
Unemployment (Annual Average)
School Enrollment (State Education Dept.)
TANF Recipients (As a % of Population)
Total Fund Balance (Deficit)
Total Expenditures and Other Financing Uses
Total Revenues and Other Financing Sources
Grand List Data
Property Tax Collection Data
Property Tax Revenues
Net Change In Fund Balance
FISCAL YEARS ENDED 2012 TO 2016
Operating Expenditures
Current Year Adjusted Tax Levy
Net Grand List
Economic Data
Operating Results - General Fund
Fund Balance - General Fund
Total Taxes Collected as a % of Total Outstanding
D - 116
Total Transfers In From Other Funds
Debt Measures
Total Transfers Out To Other Funds
2015
9,671
1,474
A1
5.9%
0.2%
2013
$1,121,080,439
19.33
$783,893,087
27.58
$21,675,928
98.9%
97.9%
$21,841,375
$5,999,797
$28,263,522
$175,376
$28,537,220
$20,746,911
$7,333,624
$28,080,535
$17,340
$28,097,875
$439,345
$0
$0
$757,332
$757,332
2014
9,723
1,431
A2
5.2%
0.2%
$1,192,847,706
18.94
$806,651,649
28.08
$22,589,086
98.9%
98.4%
$22,805,109
$5,891,822
$29,173,307
$244,748
$29,418,055
$21,486,385
$7,887,404
$29,373,789
$0
$29,373,789
$44,266
$0
$0
$801,598
9,739
1,409
A2
4.8%
0.2%
$1,175,864,778
20.10
$812,671,708
28.98
$23,634,467
98.9%
98.5%
$23,746,587
$5,723,898
$30,060,866
$405,358
$31,695,063
$22,117,025
$9,214,609
$31,331,634
$35,000
$31,366,634
$328,429
$0
$0
$1,124,085
$1,130,027
2016
9,755
1,391
A2
4.0%
0.2%
$1,212,916,005
19.85
$823,909,411
29.23
$24,076,621
99.1%
98.7%
$24,272,060
$5,725,934
$31,309,518
$445,070
$33,012,921
$22,604,656
$9,709,123
$32,313,779
$315,000
$32,628,779
$384,142
$0
$376,590
$1,137,579
$1,514,169
9,642
1,507
A1
6.9%
0.2%
2012
$1,170,631,255
17.90
$829,485,284
25.20
$20,950,481
98.8%
97.8%
$21,110,172
$6,012,381
$27,509,182
$214,764
$27,723,946
$20,218,427
$7,684,046
$27,902,473
$6,000
$27,908,473
($184,527)
$0
$0
$317,987
Committed $0 $5,942
Nonspendable $0 $0 $0
$0
$317,987
$0
$0$0
$0
$801,598
Restricted
Assigned
Unassigned
$18,243,343
$508,886
$22,236,180
$1,237,965
Bonded Long-Term Debt
Annual Debt Service
$15,145,036
$547,844
$15,586,772
$544,885
$21,401,878
$596,936

PUTNAM
Bond Rating (Moody's, as of July 1)
Population (State Dept. of Public Health)
Equalized Net Grand List
Equalized Mill Rate
Mill Rate
Total Revenues
Intergovernmental Revenues
Current Year Collection %
Total Expenditures
Education Expenditures
Unemployment (Annual Average)
School Enrollment (State Education Dept.)
TANF Recipients (As a % of Population)
Total Fund Balance (Deficit)
Total Expenditures and Other Financing Uses
Total Revenues and Other Financing Sources
Grand List Data
Property Tax Collection Data
Property Tax Revenues
Net Change In Fund Balance
FISCAL YEARS ENDED 2012 TO 2016
Operating Expenditures
Current Year Adjusted Tax Levy
Net Grand List
Economic Data
Operating Results - General Fund
Fund Balance - General Fund
Total Taxes Collected as a % of Total Outstanding
D - 117
Total Transfers In From Other Funds
Debt Measures
Total Transfers Out To Other Funds
2015
9,465
1,222
9.5%
1.4%
2013
$730,010,176
12.85
$626,596,465
14.94
$9,382,379
97.4%
93.7%
$9,462,249
$11,313,912
$24,142,205
$0
$24,142,205
$18,493,953
$4,665,741
$23,159,694
$333,263
$23,492,957
$649,248
$0
$0
$3,394,535
$3,485,788
2014
9,416
1,226
7.6%
1.4%
$789,672,372
12.00
$627,661,365
15.07
$9,474,026
97.3%
93.4%
$9,547,593
$11,342,659
$24,576,186
$0
$24,576,186
$19,139,288
$4,759,227
$23,898,515
$211,462
$24,109,977
$466,209
$0
$0
$3,951,997
9,372
1,197
6.9%
1.4%
$833,480,943
11.73
$640,264,705
15.07
$9,777,586
97.1%
92.8%
$9,768,262
$11,351,549
$24,762,837
$13,825
$24,776,662
$18,932,080
$4,744,558
$23,676,638
$315,281
$23,991,919
$784,743
$0
$0
$4,389,723
$5,433,447
2016
9,333
1,166
5.8%
1.0%
$873,806,123
11.51
$610,075,511
16.42
$10,058,833
97.8%
93.7%
$10,283,467
$11,336,152
$25,321,834
$66,017
$25,387,851
$19,502,945
$5,003,130
$24,506,075
$470,228
$24,976,303
$411,548
$0
$0
$4,612,775
$5,666,218
9,491
1,257
10.0%
1.2%
2012
$806,863,164
10.72
$621,229,620
13.94
$8,650,051
97.5%
93.9%
$8,669,054
$11,189,842
$23,310,596
$90,000
$23,400,596
$18,099,219
$4,325,378
$22,424,597
$211,495
$22,636,092
$764,504
$0
$0
$2,836,540
Committed $1,053,443 $72,710
Nonspendable $0 $971,014 $0
$156,315
$2,680,225
$91,253
$0$0
$83,193
$3,868,804
Restricted
Assigned
Unassigned
$0
$0
$640,000
$44,860
Bonded Long-Term Debt
Annual Debt Service
$0
$0
$0
$0
$0
$0

REDDING
Bond Rating (Moody's, as of July 1)
Population (State Dept. of Public Health)
Equalized Net Grand List
Equalized Mill Rate
Mill Rate
Total Revenues
Intergovernmental Revenues
Current Year Collection %
Total Expenditures
Education Expenditures
Unemployment (Annual Average)
School Enrollment (State Education Dept.)
TANF Recipients (As a % of Population)
Total Fund Balance (Deficit)
Total Expenditures and Other Financing Uses
Total Revenues and Other Financing Sources
Grand List Data
Property Tax Collection Data
Property Tax Revenues
Net Change In Fund Balance
FISCAL YEARS ENDED 2012 TO 2016
Operating Expenditures
Current Year Adjusted Tax Levy
Net Grand List
Economic Data
Operating Results - General Fund
Fund Balance - General Fund
Total Taxes Collected as a % of Total Outstanding
D - 118
Total Transfers In From Other Funds
Debt Measures
Total Transfers Out To Other Funds
2015
9,312
1,663
Aa1
5.9%
0.0%
2013
$2,284,785,227
19.73
$1,994,881,936
23.28
$45,072,306
98.3%
95.6%
$45,701,489
$3,546,997
$50,528,657
$0
$53,399,126
$35,982,664
$12,963,667
$48,946,331
$104,856
$51,832,146
$1,566,980
$0
$180,519
$6,549,618
$6,940,679
2014
9,309
1,609
Aa1
4.9%
0.0%
$2,323,953,484
19.70
$1,626,710,439
28.95
$45,791,419
98.6%
95.1%
$45,676,124
$3,801,388
$50,860,131
$0
$50,894,680
$36,823,250
$13,290,912
$50,114,162
$104,856
$50,219,018
$675,662
$0
$91,466
$7,160,082
9,293
1,535
4.3%
0.0%
$2,374,930,561
19.25
$1,628,096,295
28.91
$45,720,390
98.7%
95.1%
$45,698,262
$4,064,199
$51,182,117
$0
$51,182,117
$36,249,453
$13,516,524
$49,765,977
$87,500
$49,853,477
$1,328,640
$0
$159,412
$6,594,466
$8,488,722
2016
9,216
1,488
Aa1
4.0%
0.0%
$2,302,598,148
19.85
$1,631,023,118
28.91
$45,708,421
98.6%
94.4%
$45,448,399
$3,786,491
$50,709,756
$0
$58,144,973
$36,254,652
$13,685,795
$49,940,447
$296,000
$57,327,543
$817,430
$0
$224,909
$7,139,238
$9,306,152
9,299
1,726
Aa1
6.1%
0.0%
2012
$2,423,819,354
18.17
$1,989,614,198
22.79
$44,044,397
97.9%
95.0%
$43,547,989
$3,558,675
$48,441,769
$0
$48,447,630
$35,106,197
$12,485,084
$47,591,281
$547,856
$48,139,137
$308,493
$0
$73,685
$6,514,368
Committed $200,000 $208,822
Nonspendable $1,742,005 $1,526,022 $1,661
$0
$6,439,022
$208,822
$1,720$1,272,748
$208,822
$5,587,046
Restricted
Assigned
Unassigned
$25,272,726
$2,049,173
$19,669,532
$2,149,046
Bonded Long-Term Debt
Annual Debt Service
$29,500,035
$2,264,829
$27,561,809
$2,265,134
$22,382,431
$2,190,217

RIDGEFIELD
Bond Rating (Moody's, as of July 1)
Population (State Dept. of Public Health)
Equalized Net Grand List
Equalized Mill Rate
Mill Rate
Total Revenues
Intergovernmental Revenues
Current Year Collection %
Total Expenditures
Education Expenditures
Unemployment (Annual Average)
School Enrollment (State Education Dept.)
TANF Recipients (As a % of Population)
Total Fund Balance (Deficit)
Total Expenditures and Other Financing Uses
Total Revenues and Other Financing Sources
Grand List Data
Property Tax Collection Data
Property Tax Revenues
Net Change In Fund Balance
FISCAL YEARS ENDED 2012 TO 2016
Operating Expenditures
Current Year Adjusted Tax Levy
Net Grand List
Economic Data
Operating Results - General Fund
Fund Balance - General Fund
Total Taxes Collected as a % of Total Outstanding
D - 119
Total Transfers In From Other Funds
Debt Measures
Total Transfers Out To Other Funds
2015
25,164
5,287
Aaa
5.5%
0.0%
2013
$6,861,675,340
16.44
$5,602,283,978
20.37
$112,820,333
98.5%
95.8%
$113,464,133
$13,105,503
$134,883,793
$111,555
$134,995,348
$90,046,458
$44,836,184
$134,882,642
$1,084,883
$135,967,525
($972,177)
$0
$2,941,188
$11,709,896
$14,651,084
2014
25,205
5,260
Aaa
4.8%
0.0%
$6,598,704,716
17.63
$4,618,881,301
25.38
$116,316,191
98.7%
96.5%
$116,757,863
$15,098,029
$140,890,400
$25,000
$140,915,400
$92,761,909
$45,743,070
$138,504,979
$1,005,216
$139,510,195
$1,405,205
$0
$3,158,728
$16,056,289
25,244
5,140
Aaa
3.9%
0.0%
$7,297,420,054
16.65
$4,700,389,133
26.01
$121,507,726
98.8%
96.5%
$121,797,734
$12,774,311
$143,866,822
$179,589
$144,046,411
$94,568,454
$47,954,889
$142,523,343
$1,079,854
$143,603,197
$443,214
$0
$3,228,924
$13,270,579
$16,499,503
2016
25,063
5,015
Aaa
3.6%
0.0%
$7,212,648,901
16.83
$4,711,745,970
26.01
$121,415,526
98.9%
96.9%
$122,758,353
$13,768,527
$145,507,107
$55,443
$145,562,550
$96,082,052
$47,466,249
$143,548,301
$1,438,738
$144,987,039
$575,511
$0
$3,000,480
$14,074,534
$17,075,014
25,045
5,370
Aaa
5.8%
0.0%
2012
$7,092,960,130
15.98
$5,552,991,756
20.61
$113,330,243
98.5%
95.8%
$113,029,057
$12,297,794
$137,971,648
$0
$137,971,648
$87,248,296
$44,205,936
$131,454,232
$1,168,820
$132,623,052
$5,348,596
$0
$4,116,077
$15,623,261
Committed $0 $0
Nonspendable $0 $0 $0
$0
$11,507,184
$0
$0$0
$0
$12,897,561
Restricted
Assigned
Unassigned
$88,549,410
$13,496,025
$79,604,661
$12,067,557
Bonded Long-Term Debt
Annual Debt Service
$89,939,924
$14,347,941
$90,661,364
$13,439,259
$78,983,264
$13,210,471

ROCKY HILL
Bond Rating (Moody's, as of July 1)
Population (State Dept. of Public Health)
Equalized Net Grand List
Equalized Mill Rate
Mill Rate
Total Revenues
Intergovernmental Revenues
Current Year Collection %
Total Expenditures
Education Expenditures
Unemployment (Annual Average)
School Enrollment (State Education Dept.)
TANF Recipients (As a % of Population)
Total Fund Balance (Deficit)
Total Expenditures and Other Financing Uses
Total Revenues and Other Financing Sources
Grand List Data
Property Tax Collection Data
Property Tax Revenues
Net Change In Fund Balance
FISCAL YEARS ENDED 2012 TO 2016
Operating Expenditures
Current Year Adjusted Tax Levy
Net Grand List
Economic Data
Operating Results - General Fund
Fund Balance - General Fund
Total Taxes Collected as a % of Total Outstanding
D - 120
Total Transfers In From Other Funds
Debt Measures
Total Transfers Out To Other Funds
2015
19,915
2,600
Aa2
5.7%
0.1%
2013
$2,741,368,613
20.46
$2,156,334,725
25.90
$56,093,759
99.1%
98.5%
$56,453,949
$9,052,449
$67,892,323
$0
$75,672,080
$33,885,126
$31,893,168
$65,778,294
$648,828
$74,102,850
$1,569,230
$0
$1,198,823
$4,671,860
$5,870,683
2014
20,094
2,589
Aa2
4.9%
0.3%
$2,784,951,675
20.75
$2,161,927,354
26.60
$57,774,467
99.0%
98.5%
$57,822,637
$10,206,932
$70,428,000
$0
$70,428,000
$35,566,626
$32,415,824
$67,982,450
$2,177,382
$70,159,832
$268,168
$0
$1,552,335
$6,138,851
20,021
2,646
Aa2
4.2%
0.2%
$2,841,314,800
20.88
$1,988,502,360
29.70
$59,329,833
99.4%
99.0%
$59,840,044
$9,434,186
$72,019,191
$0
$72,019,191
$38,973,084
$31,490,585
$70,463,669
$1,405,502
$71,869,171
$150,020
$0
$1,084,837
$5,204,034
$6,288,871
2016
20,119
2,762
Aa2
3.9%
0.2%
$3,193,390,993
18.81
$2,018,435,060
29.70
$60,060,008
99.3%
98.9%
$60,302,037
$10,581,229
$72,666,162
$0
$72,666,162
$41,398,116
$30,987,212
$72,385,328
$567,117
$72,952,445
($286,283)
$0
$1,733,105
$4,269,483
$6,002,588
19,729
2,621
Aa2
6.1%
0.2%
2012
$2,763,696,337
19.11
$2,155,868,126
24.50
$52,823,294
99.0%
98.3%
$53,019,340
$9,149,211
$63,826,221
$0
$63,826,221
$32,952,537
$30,323,058
$63,275,595
$497,548
$63,773,143
$53,078
$0
$245,955
$4,301,453
Committed $0 $0
Nonspendable $0 $0 $0
$0
$4,055,498
$0
$0$0
$0
$4,586,516
Restricted
Assigned
Unassigned
$11,963,170
$1,671,560
$26,468,603
$3,675,133
Bonded Long-Term Debt
Annual Debt Service
$15,114,034
$2,385,319
$13,332,512
$2,235,379
$28,538,944
$1,962,439

ROXBURY
Bond Rating (Moody's, as of July 1)
Population (State Dept. of Public Health)
Equalized Net Grand List
Equalized Mill Rate
Mill Rate
Total Revenues
Intergovernmental Revenues
Current Year Collection %
Total Expenditures
Education Expenditures
Unemployment (Annual Average)
School Enrollment (State Education Dept.)
TANF Recipients (As a % of Population)
Total Fund Balance (Deficit)
Total Expenditures and Other Financing Uses
Total Revenues and Other Financing Sources
Grand List Data
Property Tax Collection Data
Property Tax Revenues
Net Change In Fund Balance
FISCAL YEARS ENDED 2012 TO 2016
Operating Expenditures
Current Year Adjusted Tax Levy
Net Grand List
Economic Data
Operating Results - General Fund
Fund Balance - General Fund
Total Taxes Collected as a % of Total Outstanding
D - 121
Total Transfers In From Other Funds
Debt Measures
Total Transfers Out To Other Funds
2015
2,229
269
5.2%
0.0%
2013
$936,257,043
9.75
$756,359,718
12.10
$9,129,764
99.3%
98.8%
$9,199,825
$263,073
$9,875,796
$0
$9,875,796
$6,658,466
$2,666,217
$9,324,683
$306,118
$9,630,801
$244,995
$0
$195,422
$1,542,688
$1,831,467
2014
2,201
247
3.8%
0.0%
$991,561,414
9.24
$694,043,380
13.30
$9,159,490
99.2%
99.0%
$9,248,574
$268,555
$9,940,141
$0
$9,940,141
$6,790,721
$2,562,117
$9,352,838
$314,458
$9,667,296
$272,845
$0
$223,957
$2,104,312
2,187
230
3.3%
0.0%
$970,743,203
9.58
$694,544,900
13.40
$9,295,118
99.5%
99.3%
$9,337,031
$206,168
$9,954,919
$0
$9,954,919
$6,978,595
$2,594,517
$9,573,112
$269,670
$9,842,782
$112,137
$0
$238,764
$1,808,780
$2,216,449
2016
2,176
215
3.2%
0.0%
$944,561,939
10.11
$698,225,720
13.70
$9,548,602
99.4%
99.2%
$9,598,004
$188,982
$10,292,835
$0
$10,292,835
$7,119,534
$2,623,860
$9,743,394
$333,500
$10,076,894
$215,941
$0
$0
$2,095,092
$2,432,390
2,237
284
5.2%
0.0%
2012
$1,029,198,632
8.62
$747,823,781
11.90
$8,866,630
99.1%
98.5%
$8,905,085
$214,250
$9,464,593
$0
$9,464,593
$6,557,435
$2,498,180
$9,055,615
$438,897
$9,494,512
($29,919)
$0
$127,383
$1,586,472
Committed $331,981 $168,905
Nonspendable $5,317 $0 $67
$86,903
$1,372,119
$93,357
$0$0
$120,878
$1,759,477
Restricted
Assigned
Unassigned
$789,906
$0
$453,195
$6,626
Bonded Long-Term Debt
Annual Debt Service
$1,222,993
$96,793
$965,380
$95,531
$622,744
$0

SALEM
Bond Rating (Moody's, as of July 1)
Population (State Dept. of Public Health)
Equalized Net Grand List
Equalized Mill Rate
Mill Rate
Total Revenues
Intergovernmental Revenues
Current Year Collection %
Total Expenditures
Education Expenditures
Unemployment (Annual Average)
School Enrollment (State Education Dept.)
TANF Recipients (As a % of Population)
Total Fund Balance (Deficit)
Total Expenditures and Other Financing Uses
Total Revenues and Other Financing Sources
Grand List Data
Property Tax Collection Data
Property Tax Revenues
Net Change In Fund Balance
FISCAL YEARS ENDED 2012 TO 2016
Operating Expenditures
Current Year Adjusted Tax Levy
Net Grand List
Economic Data
Operating Results - General Fund
Fund Balance - General Fund
Total Taxes Collected as a % of Total Outstanding
D - 122
Total Transfers In From Other Funds
Debt Measures
Total Transfers Out To Other Funds
2015
4,201
699
A1
7.5%
0.4%
2013
$512,891,607
20.75
$358,888,125
29.60
$10,643,547
97.9%
96.8%
$10,829,411
$4,367,583
$15,472,354
$90,312
$15,562,666
$11,116,008
$3,230,286
$14,346,294
$1,343,730
$15,690,024
($127,358)
$31,664
$0
$1,254,677
$1,286,341
2014
4,184
675
A1
6.2%
0.3%
$489,335,928
22.22
$360,941,990
30.10
$10,872,146
97.8%
96.7%
$10,971,381
$4,567,932
$15,811,096
$381,536
$16,192,632
$11,258,315
$3,199,829
$14,458,144
$983,675
$15,441,819
$750,813
$29,938
$0
$2,037,154
4,183
649
A1
5.4%
0.4%
$506,358,607
22.30
$362,175,579
31.10
$11,289,461
98.4%
97.2%
$11,340,498
$4,577,707
$16,185,118
$0
$16,393,236
$11,559,640
$3,436,522
$14,996,162
$802,556
$15,798,718
$594,518
$31,306
$536,100
$2,064,266
$2,631,672
2016
4,167
630
A1
4.7%
0.2%
$496,154,901
23.36
$366,624,276
31.70
$11,588,834
98.7%
97.4%
$11,659,288
$4,577,988
$16,527,256
$8,718
$16,535,974
$11,748,904
$3,238,711
$14,987,615
$1,357,785
$16,345,400
$190,574
$28,072
$355,917
$2,438,257
$2,822,246
4,188
705
A1
8.2%
0.5%
2012
$557,332,251
19.01
$429,139,917
24.50
$10,595,639
98.1%
96.2%
$10,573,859
$4,093,867
$14,942,507
$46,360
$14,988,867
$10,625,583
$2,836,569
$13,462,152
$1,462,058
$14,924,210
$64,657
$26,894
$44,363
$1,413,699
Committed $0 $0
Nonspendable $0 $0 $0
$0
$1,342,442
$0
$0$0
$0
$2,007,216
Restricted
Assigned
Unassigned
$5,900,000
$3,791,919
$4,711,136
$302,814
Bonded Long-Term Debt
Annual Debt Service
$855,673
$90,630
$4,128,816
$347,655
$4,740,679
$5,925,240

SALISBURY
Bond Rating (Moody's, as of July 1)
Population (State Dept. of Public Health)
Equalized Net Grand List
Equalized Mill Rate
Mill Rate
Total Revenues
Intergovernmental Revenues
Current Year Collection %
Total Expenditures
Education Expenditures
Unemployment (Annual Average)
School Enrollment (State Education Dept.)
TANF Recipients (As a % of Population)
Total Fund Balance (Deficit)
Total Expenditures and Other Financing Uses
Total Revenues and Other Financing Sources
Grand List Data
Property Tax Collection Data
Property Tax Revenues
Net Change In Fund Balance
FISCAL YEARS ENDED 2012 TO 2016
Operating Expenditures
Current Year Adjusted Tax Levy
Net Grand List
Economic Data
Operating Results - General Fund
Fund Balance - General Fund
Total Taxes Collected as a % of Total Outstanding
D - 123
Total Transfers In From Other Funds
Debt Measures
Total Transfers Out To Other Funds
2015
3,693
385
4.9%
0.1%
2013
$1,561,736,123
7.50
$1,148,319,453
10.20
$11,717,501
99.4%
98.7%
$11,792,720
$1,044,352
$13,492,129
$15,624
$13,507,753
$8,054,951
$3,973,929
$12,028,880
$1,393,090
$13,421,970
$85,783
$42,674
$570,520
$1,214,183
$1,867,340
2014
3,665
347
4.0%
0.2%
$1,569,991,945
7.67
$1,156,066,100
10.40
$12,045,991
99.4%
98.9%
$12,090,458
$996,819
$13,887,956
$0
$13,887,956
$8,414,292
$3,890,734
$12,305,026
$1,466,999
$13,772,025
$115,931
$44,361
$601,300
$1,983,271
3,638
342
3.5%
0.1%
$1,608,901,918
7.64
$1,168,534,540
10.50
$12,298,145
99.3%
98.8%
$12,354,606
$1,133,784
$14,424,717
$276,154
$14,700,871
$8,230,306
$4,537,082
$12,767,388
$1,523,732
$14,291,120
$409,751
$45,831
$586,414
$1,313,104
$2,393,022
2016
3,618
342
3.1%
0.0%
$1,644,012,796
7.69
$1,179,704,370
10.70
$12,646,957
99.4%
98.8%
$12,674,139
$1,473,804
$14,829,653
$25,198
$14,854,851
$8,702,313
$4,668,972
$13,371,285
$1,715,262
$15,086,547
($231,696)
$47,382
$240,526
$1,601,472
$2,161,326
3,701
385
5.5%
0.1%
2012
$1,628,238,829
7.00
$1,139,574,180
10.00
$11,404,216
99.3%
98.5%
$11,441,249
$1,488,571
$13,772,590
$23,919
$13,796,509
$7,959,258
$4,888,684
$12,847,942
$793,596
$13,641,538
$154,971
$80,340
$243,856
$1,781,557
Committed $271,946 $447,673
Nonspendable $0 $0 $0
$49,974
$1,407,387
$39,963
$0$0
$39,963
$1,297,647
Restricted
Assigned
Unassigned
$4,154,684
$435,233
$3,260,273
$422,882
Bonded Long-Term Debt
Annual Debt Service
$4,646,440
$3,529,159
$4,498,318
$591,527
$3,818,458
$191,981

SCOTLAND
Bond Rating (Moody's, as of July 1)
Population (State Dept. of Public Health)
Equalized Net Grand List
Equalized Mill Rate
Mill Rate
Total Revenues
Intergovernmental Revenues
Current Year Collection %
Total Expenditures
Education Expenditures
Unemployment (Annual Average)
School Enrollment (State Education Dept.)
TANF Recipients (As a % of Population)
Total Fund Balance (Deficit)
Total Expenditures and Other Financing Uses
Total Revenues and Other Financing Sources
Grand List Data
Property Tax Collection Data
Property Tax Revenues
Net Change In Fund Balance
FISCAL YEARS ENDED 2012 TO 2016
Operating Expenditures
Current Year Adjusted Tax Levy
Net Grand List
Economic Data
Operating Results - General Fund
Fund Balance - General Fund
Total Taxes Collected as a % of Total Outstanding
D - 124
Total Transfers In From Other Funds
Debt Measures
Total Transfers Out To Other Funds
2015
1,699
212
A1
4.6%
0.5%
2013
$151,122,287
25.84
$129,257,750
30.07
$3,905,709
97.2%
95.4%
$3,957,220
$1,918,623
$5,949,974
$5,379
$5,955,353
$4,513,899
$1,264,386
$5,778,285
$46,219
$5,824,504
$130,849
$0
$0
$833,304
$833,304
2014
1,694
225
A1
5.6%
0.5%
$153,397,640
25.64
$127,867,900
30.36
$3,933,365
96.9%
95.2%
$3,968,275
$1,995,387
$6,029,452
$1,136
$6,030,588
$4,498,536
$1,406,490
$5,905,026
$87,939
$5,992,965
$37,623
$0
$45,742
$870,927
1,686
219
A1
5.2%
0.3%
$161,392,096
24.55
$112,924,860
35.00
$3,961,693
98.0%
96.5%
$4,042,884
$1,983,643
$6,094,488
$93,252
$6,187,740
$4,691,725
$1,433,532
$6,125,257
$173,041
$6,298,298
($110,558)
$0
$122,289
$557,696
$760,369
2016
1,678
209
A1
4.6%
0.2%
$151,789,305
26.79
$113,163,615
35.75
$4,066,647
97.9%
96.6%
$4,126,784
$1,828,593
$6,047,374
$530
$6,132,454
$4,673,197
$1,534,744
$6,207,941
$18,000
$6,225,941
($93,487)
$0
$13,282
$652,261
$665,543
1,710
228
A1
4.9%
0.2%
2012
$157,056,218
24.70
$128,720,730
30.07
$3,879,540
97.3%
95.3%
$3,876,133
$1,892,936
$5,865,842
$11,123
$5,876,965
$4,545,284
$1,363,677
$5,908,961
$23,000
$5,931,961
($54,996)
$0
$0
$701,893
Committed $0 $80,000
Nonspendable $0 $384 $0
$0
$701,893
$0
$0$250
$0
$824,935
Restricted
Assigned
Unassigned
$2,930,000
$391,210
$2,470,459
$368,867
Bonded Long-Term Debt
Annual Debt Service
$3,438,000
$394,357
$3,195,000
$381,078
$2,665,000
$379,871

SEYMOUR
Bond Rating (Moody's, as of July 1)
Population (State Dept. of Public Health)
Equalized Net Grand List
Equalized Mill Rate
Mill Rate
Total Revenues
Intergovernmental Revenues
Current Year Collection %
Total Expenditures
Education Expenditures
Unemployment (Annual Average)
School Enrollment (State Education Dept.)
TANF Recipients (As a % of Population)
Total Fund Balance (Deficit)
Total Expenditures and Other Financing Uses
Total Revenues and Other Financing Sources
Grand List Data
Property Tax Collection Data
Property Tax Revenues
Net Change In Fund Balance
FISCAL YEARS ENDED 2012 TO 2016
Operating Expenditures
Current Year Adjusted Tax Levy
Net Grand List
Economic Data
Operating Results - General Fund
Fund Balance - General Fund
Total Taxes Collected as a % of Total Outstanding
D - 125
Total Transfers In From Other Funds
Debt Measures
Total Transfers Out To Other Funds
2015
16,571
2,407
Aa3
8.0%
0.4%
2013
$1,710,743,807
22.99
$1,195,045,790
32.83
$39,327,332
98.0%
95.8%
$39,820,165
$14,495,662
$55,528,100
$0
$55,736,408
$33,091,150
$21,095,776
$54,186,926
$617,593
$54,804,519
$931,889
$0
$951,965
$4,391,954
$5,343,919
2014
16,537
2,432
Aa3
7.1%
0.4%
$1,663,013,492
24.20
$1,208,751,805
33.23
$40,243,964
98.0%
95.5%
$40,467,801
$15,102,416
$56,791,772
$0
$56,791,772
$35,087,291
$21,470,097
$56,557,388
$508,349
$57,065,737
($273,965)
$0
$458,652
$5,069,954
16,475
2,399
6.1%
0.3%
$1,707,834,886
24.41
$1,221,159,820
34.04
$41,691,686
98.1%
95.8%
$42,069,189
$15,026,084
$58,304,783
$115,793
$64,237,464
$36,132,376
$21,999,821
$58,132,197
$215,793
$64,080,639
$156,825
$0
$552,768
$4,674,011
$5,226,779
2016
16,553
2,323
5.5%
0.3%
$1,702,581,361
25.06
$1,233,217,428
34.59
$42,668,022
98.3%
96.6%
$43,329,387
$15,037,154
$59,765,806
$340,793
$60,106,599
$36,363,723
$22,402,748
$58,766,471
$496,792
$59,263,263
$843,336
$0
$953,421
$5,116,694
$6,070,115
16,561
2,411
Aa3
8.6%
0.5%
2012
$1,787,642,556
21.38
$1,382,589,920
27.62
$38,213,590
97.8%
95.3%
$38,472,193
$14,272,163
$54,222,888
$59,847
$57,695,247
$32,887,244
$19,903,511
$52,790,755
$712,408
$56,863,023
$832,224
$0
$434,196
$4,412,030
Committed $0 $0
Nonspendable $0 $0 $0
$0
$3,977,834
$0
$0$0
$0
$4,611,302
Restricted
Assigned
Unassigned
$37,780,209
$5,181,212
$35,347,897
$5,363,078
Bonded Long-Term Debt
Annual Debt Service
$39,345,000
$4,274,452
$37,669,689
$4,676,033
$37,397,622
$5,540,734

SHARON
Bond Rating (Moody's, as of July 1)
Population (State Dept. of Public Health)
Equalized Net Grand List
Equalized Mill Rate
Mill Rate
Total Revenues
Intergovernmental Revenues
Current Year Collection %
Total Expenditures
Education Expenditures
Unemployment (Annual Average)
School Enrollment (State Education Dept.)
TANF Recipients (As a % of Population)
Total Fund Balance (Deficit)
Total Expenditures and Other Financing Uses
Total Revenues and Other Financing Sources
Grand List Data
Property Tax Collection Data
Property Tax Revenues
Net Change In Fund Balance
FISCAL YEARS ENDED 2012 TO 2016
Operating Expenditures
Current Year Adjusted Tax Levy
Net Grand List
Economic Data
Operating Results - General Fund
Fund Balance - General Fund
Total Taxes Collected as a % of Total Outstanding
D - 126
Total Transfers In From Other Funds
Debt Measures
Total Transfers Out To Other Funds
2015
2,743
241
Aa2
5.3%
0.3%
2013
$986,489,881
9.78
$847,351,980
11.35
$9,645,672
97.2%
93.4%
$9,579,925
$609,850
$10,526,550
$190,146
$10,716,696
$6,450,506
$3,023,344
$9,473,850
$212,280
$9,686,130
$1,030,566
$0
$0
$2,757,398
$2,949,627
2014
2,725
239
Aa2
4.3%
0.2%
$985,900,864
10.10
$851,634,816
11.70
$9,957,533
97.7%
94.2%
$10,110,941
$611,714
$11,152,815
$12,200
$11,165,015
$6,377,957
$4,026,852
$10,404,809
$209,532
$10,614,341
$550,674
$0
$1,800
$3,500,302
2,706
232
Aa2
3.5%
0.1%
$1,029,649,366
9.28
$720,510,556
13.25
$9,556,585
97.8%
94.0%
$9,632,171
$645,482
$10,735,764
$10,180
$10,745,944
$6,819,517
$4,445,961
$11,265,478
$240,037
$11,505,515
($759,571)
$0
$7,937
$2,523,163
$2,740,731
2016
2,714
230
Aa2
3.2%
0.0%
$926,930,282
10.74
$725,223,484
13.70
$9,955,836
97.8%
94.0%
$10,097,120
$563,923
$11,008,037
$7,220
$11,015,257
$6,969,515
$3,962,318
$10,931,833
$340,954
$11,272,787
($257,530)
$0
$0
$1,993,441
$2,323,570
2,747
261
Aa2
5.4%
0.2%
2012
$1,109,074,374
8.64
$843,796,767
11.35
$9,583,631
97.9%
94.9%
$9,638,534
$533,379
$10,514,774
$41,160
$10,555,934
$6,656,208
$3,188,993
$9,845,201
$219,236
$10,064,437
$491,497
$0
$1,936
$1,919,061
Committed $330,129 $209,631
Nonspendable $0 $0 $0
$132,763
$1,784,362
$192,229
$0$0
$171,526
$3,326,976
Restricted
Assigned
Unassigned
$7,912,228
$893,530
$6,581,810
$773,595
Bonded Long-Term Debt
Annual Debt Service
$8,568,474
$476,129
$8,776,684
$311,744
$7,025,728
$1,055,238

SHELTON
Bond Rating (Moody's, as of July 1)
Population (State Dept. of Public Health)
Equalized Net Grand List
Equalized Mill Rate
Mill Rate
Total Revenues
Intergovernmental Revenues
Current Year Collection %
Total Expenditures
Education Expenditures
Unemployment (Annual Average)
School Enrollment (State Education Dept.)
TANF Recipients (As a % of Population)
Total Fund Balance (Deficit)
Total Expenditures and Other Financing Uses
Total Revenues and Other Financing Sources
Grand List Data
Property Tax Collection Data
Property Tax Revenues
Net Change In Fund Balance
FISCAL YEARS ENDED 2012 TO 2016
Operating Expenditures
Current Year Adjusted Tax Levy
Net Grand List
Economic Data
Operating Results - General Fund
Fund Balance - General Fund
Total Taxes Collected as a % of Total Outstanding
D - 127
Total Transfers In From Other Funds
Debt Measures
Total Transfers Out To Other Funds
2015
40,999
5,247
Aa2
7.3%
0.3%
2013
$6,393,817,344
15.73
$4,473,838,501
22.40
$100,574,316
98.8%
97.6%
$101,470,466
$14,302,128
$119,137,983
$225,000
$121,176,860
$70,066,838
$46,875,629
$116,942,467
$1,151,019
$118,093,486
$3,083,374
$0
$212,000
$11,868,923
$17,018,404
2014
41,295
5,150
Aa2
6.3%
0.3%
$6,470,363,305
15.48
$4,495,499,170
22.31
$100,175,548
98.9%
97.6%
$102,904,882
$15,826,286
$123,167,743
$240,000
$129,142,823
$74,300,492
$51,453,667
$125,754,159
$1,151,019
$126,905,178
$2,237,645
$0
$212,000
$19,256,049
41,296
5,154
Aa2
5.5%
0.3%
$6,665,777,222
15.16
$4,514,471,490
22.31
$101,063,257
98.7%
97.3%
$101,284,259
$15,753,536
$121,073,698
$0
$122,181,383
$75,053,250
$46,910,361
$121,963,611
$2,146,019
$124,109,630
($1,928,247)
$0
$212,000
$11,722,531
$17,327,802
2016
41,334
5,179
Aa2
4.9%
0.3%
$6,691,388,869
15.23
$4,552,405,520
22.31
$101,891,070
99.0%
97.8%
$103,118,237
$15,574,065
$122,379,640
$0
$122,379,640
$76,887,536
$48,950,943
$125,838,479
$1,151,019
$126,989,498
($4,609,858)
$0
$362,000
$4,973,401
$12,717,944
40,261
5,368
Aa2
7.9%
0.3%
2012
$6,465,685,754
15.09
$5,242,912,390
18.57
$97,544,404
98.9%
97.6%
$97,299,584
$15,116,799
$116,364,658
$608,571
$117,050,754
$71,812,630
$42,185,546
$113,998,176
$1,466,019
$115,464,195
$1,586,559
$0
$212,000
$13,935,030
Committed $7,319,250 $5,329,978
Nonspendable $63,293 $63,293 $63,293
$5,397,184
$8,262,553
$4,874,188
$63,293$683,683
$6,085,821
$12,274,545
Restricted
Assigned
Unassigned
$55,373,222
$12,146,413
$45,802,103
$11,279,206
Bonded Long-Term Debt
Annual Debt Service
$59,375,000
$11,080,779
$56,958,536
$11,963,674
$51,672,666
$12,568,421

SHERMAN
Bond Rating (Moody's, as of July 1)
Population (State Dept. of Public Health)
Equalized Net Grand List
Equalized Mill Rate
Mill Rate
Total Revenues
Intergovernmental Revenues
Current Year Collection %
Total Expenditures
Education Expenditures
Unemployment (Annual Average)
School Enrollment (State Education Dept.)
TANF Recipients (As a % of Population)
Total Fund Balance (Deficit)
Total Expenditures and Other Financing Uses
Total Revenues and Other Financing Sources
Grand List Data
Property Tax Collection Data
Property Tax Revenues
Net Change In Fund Balance
FISCAL YEARS ENDED 2012 TO 2016
Operating Expenditures
Current Year Adjusted Tax Levy
Net Grand List
Economic Data
Operating Results - General Fund
Fund Balance - General Fund
Total Taxes Collected as a % of Total Outstanding
D - 128
Total Transfers In From Other Funds
Debt Measures
Total Transfers Out To Other Funds
2015
3,670
573
Aa2
5.9%
0.0%
2013
$901,271,767
13.54
$755,549,608
16.10
$12,201,952
99.3%
99.0%
$12,249,304
$1,168,586
$13,884,544
$0
$13,884,544
$9,169,574
$4,182,337
$13,351,911
$215,049
$13,566,960
$317,584
$10,750
$0
$1,182,363
$1,193,244
2014
3,671
564
Aa2
4.9%
0.0%
$970,811,488
13.27
$763,304,091
16.85
$12,878,481
99.3%
99.0%
$12,923,314
$1,382,841
$14,677,745
$0
$14,677,745
$9,540,965
$4,503,651
$14,044,616
$361,065
$14,405,681
$272,064
$10,750
$0
$1,465,308
3,668
538
Aa2
4.1%
0.1%
$953,756,781
13.95
$667,551,747
19.84
$13,309,122
99.4%
99.0%
$13,371,415
$1,251,577
$14,977,813
$0
$14,977,813
$9,615,620
$4,303,026
$13,918,646
$598,256
$14,516,902
$460,911
$10,750
$0
$1,915,469
$1,926,219
2016
3,641
502
Aa2
4.0%
0.1%
$993,367,439
13.64
$675,106,868
20.04
$13,550,914
99.7%
99.5%
$13,674,668
$1,216,580
$15,269,632
$0
$15,269,632
$9,589,213
$4,307,833
$13,897,046
$1,071,556
$14,968,602
$301,030
$10,750
$0
$2,216,499
$2,227,249
3,648
592
Aa2
6.3%
0.0%
2012
$963,531,156
12.27
$747,382,770
15.80
$11,823,560
99.1%
99.0%
$11,838,808
$1,109,021
$13,300,390
$0
$13,300,390
$8,941,173
$4,087,514
$13,028,687
$877,622
$13,906,309
($605,919)
$10,750
$0
$875,660
Committed $0 $0
Nonspendable $0 $0 $7,678
$0
$857,232
$0
$131$131
$0
$1,454,427
Restricted
Assigned
Unassigned
$10,720,000
$1,335,945
$7,500,000
$1,074,720
Bonded Long-Term Debt
Annual Debt Service
$11,680,000
$1,240,195
$11,750,000
$1,237,645
$8,320,000
$1,106,095

SIMSBURY
Bond Rating (Moody's, as of July 1)
Population (State Dept. of Public Health)
Equalized Net Grand List
Equalized Mill Rate
Mill Rate
Total Revenues
Intergovernmental Revenues
Current Year Collection %
Total Expenditures
Education Expenditures
Unemployment (Annual Average)
School Enrollment (State Education Dept.)
TANF Recipients (As a % of Population)
Total Fund Balance (Deficit)
Total Expenditures and Other Financing Uses
Total Revenues and Other Financing Sources
Grand List Data
Property Tax Collection Data
Property Tax Revenues
Net Change In Fund Balance
FISCAL YEARS ENDED 2012 TO 2016
Operating Expenditures
Current Year Adjusted Tax Levy
Net Grand List
Economic Data
Operating Results - General Fund
Fund Balance - General Fund
Total Taxes Collected as a % of Total Outstanding
D - 129
Total Transfers In From Other Funds
Debt Measures
Total Transfers Out To Other Funds
2015
23,824
4,600
Aaa
5.0%
0.1%
2013
$3,505,330,154
23.27
$2,599,467,918
31.37
$81,566,288
99.4%
99.1%
$81,850,788
$13,789,313
$97,137,998
$253,545
$97,391,543
$70,434,246
$23,676,124
$94,110,370
$1,877,103
$95,987,473
$1,404,070
$365,516
$374,590
$10,840,687
$12,000,578
2014
23,975
4,446
Aaa
4.3%
0.1%
$3,192,698,507
26.09
$2,234,667,295
37.29
$83,294,253
99.6%
99.1%
$83,460,141
$14,265,662
$99,794,245
$256,150
$100,050,395
$73,703,266
$24,572,155
$98,275,421
$2,140,354
$100,415,775
($365,380)
$2,368
$21,309
$11,635,198
24,348
4,358
Aaa
3.7%
0.1%
$3,577,008,150
23.41
$2,251,625,275
37.14
$83,746,697
99.6%
99.0%
$83,958,850
$12,761,784
$98,216,557
$444,358
$98,660,915
$71,510,265
$24,727,036
$96,237,301
$1,366,260
$97,603,561
$1,057,354
$0
$183,461
$11,870,091
$12,692,552
2016
24,407
4,253
Aaa
3.4%
0.1%
$3,586,049,744
23.54
$2,268,971,299
37.12
$84,403,852
99.5%
98.9%
$84,535,118
$13,884,108
$100,917,731
$101,446
$101,019,177
$74,054,959
$23,878,005
$97,932,964
$2,316,462
$100,249,426
$769,751
$0
$1,787,133
$11,247,572
$13,462,303
23,620
4,733
Aaa
5.4%
0.1%
2012
$3,607,413,059
22.24
$2,599,506,658
30.86
$80,214,546
99.4%
99.0%
$80,548,378
$12,534,007
$94,833,517
$0
$94,833,517
$68,933,265
$23,532,753
$92,466,018
$2,027,617
$94,493,635
$339,882
$121,950
$510,907
$10,596,508
Committed $427,598 $639,000
Nonspendable $0 $0 $0
$267,341
$9,696,310
$400,120
$19,665$0
$0
$11,611,521
Restricted
Assigned
Unassigned
$38,609,436
$7,557,907
$31,689,473
$6,909,415
Bonded Long-Term Debt
Annual Debt Service
$45,386,539
$7,379,506
$45,062,527
$7,137,682
$37,731,882
$7,480,695

SOMERS
Bond Rating (Moody's, as of July 1)
Population (State Dept. of Public Health)
Equalized Net Grand List
Equalized Mill Rate
Mill Rate
Total Revenues
Intergovernmental Revenues
Current Year Collection %
Total Expenditures
Education Expenditures
Unemployment (Annual Average)
School Enrollment (State Education Dept.)
TANF Recipients (As a % of Population)
Total Fund Balance (Deficit)
Total Expenditures and Other Financing Uses
Total Revenues and Other Financing Sources
Grand List Data
Property Tax Collection Data
Property Tax Revenues
Net Change In Fund Balance
FISCAL YEARS ENDED 2012 TO 2016
Operating Expenditures
Current Year Adjusted Tax Levy
Net Grand List
Economic Data
Operating Results - General Fund
Fund Balance - General Fund
Total Taxes Collected as a % of Total Outstanding
D - 130
Total Transfers In From Other Funds
Debt Measures
Total Transfers Out To Other Funds
2015
11,320
1,569
Aa2
6.3%
0.2%
2013
$1,169,982,972
15.89
$830,716,205
23.12
$18,591,286
98.8%
97.9%
$19,088,274
$12,300,540
$32,441,434
$175,000
$40,689,387
$22,526,248
$8,606,276
$31,132,524
$695,579
$39,703,269
$986,118
$0
$246,729
$4,878,614
$6,100,866
2014
11,303
1,519
Aa2
5.5%
0.3%
$1,110,037,653
17.38
$834,794,596
23.37
$19,288,638
98.7%
97.7%
$19,400,489
$12,786,529
$32,941,084
$240,000
$33,181,084
$23,416,325
$8,657,590
$32,073,915
$391,746
$32,465,661
$715,423
$0
$160,167
$6,816,289
11,432
1,485
Aa2
4.8%
0.3%
$1,200,742,780
16.31
$851,728,169
23.37
$19,584,592
98.8%
98.4%
$19,918,176
$12,535,916
$33,257,780
$175,000
$33,850,104
$24,073,247
$8,471,253
$32,544,500
$350,000
$32,894,500
$955,604
$0
$611,645
$6,182,226
$7,771,893
2016
11,092
1,441
Aa2
4.4%
0.2%
$1,243,529,110
16.23
$866,472,730
23.37
$20,179,886
98.7%
98.2%
$20,216,216
$12,199,915
$33,119,999
$196,399
$33,861,827
$24,017,924
$9,673,635
$33,691,559
$200,000
$33,891,559
($29,732)
$0
$629,566
$6,144,025
$7,693,740
11,451
1,613
Aa2
6.9%
0.1%
2012
$1,137,464,430
15.57
$820,346,488
22.12
$17,707,631
99.0%
98.0%
$18,065,407
$13,133,908
$32,029,576
$335,799
$32,365,375
$21,936,853
$9,395,134
$31,331,987
$415,999
$31,747,986
$617,389
$194,587
$179,364
$5,114,749
Committed $787,237 $814,624
Nonspendable $132,912 $163,398 $93,474
$840,737
$3,806,587
$900,737
$74,786$185,098
$846,845
$5,624,179
Restricted
Assigned
Unassigned
$13,274,331
$1,815,635
$14,985,087
$2,059,426
Bonded Long-Term Debt
Annual Debt Service
$14,168,996
$2,338,931
$12,964,196
$2,188,458
$16,027,771
$1,660,509

SOUTH WINDSOR
Bond Rating (Moody's, as of July 1)
Population (State Dept. of Public Health)
Equalized Net Grand List
Equalized Mill Rate
Mill Rate
Total Revenues
Intergovernmental Revenues
Current Year Collection %
Total Expenditures
Education Expenditures
Unemployment (Annual Average)
School Enrollment (State Education Dept.)
TANF Recipients (As a % of Population)
Total Fund Balance (Deficit)
Total Expenditures and Other Financing Uses
Total Revenues and Other Financing Sources
Grand List Data
Property Tax Collection Data
Property Tax Revenues
Net Change In Fund Balance
FISCAL YEARS ENDED 2012 TO 2016
Operating Expenditures
Current Year Adjusted Tax Levy
Net Grand List
Economic Data
Operating Results - General Fund
Fund Balance - General Fund
Total Taxes Collected as a % of Total Outstanding
D - 131
Total Transfers In From Other Funds
Debt Measures
Total Transfers Out To Other Funds
2015
25,846
4,425
Aa2
5.8%
0.2%
2013
$3,386,291,507
24.11
$2,771,257,781
29.43
$81,652,659
98.7%
96.1%
$81,674,471
$21,232,260
$104,583,233
$63,367
$104,646,600
$71,405,984
$30,728,622
$102,134,606
$888,605
$103,023,211
$1,623,389
$0
$1,616,470
$5,042,748
$6,676,726
2014
25,823
4,463
Aa2
5.1%
0.1%
$3,525,312,497
24.47
$2,466,560,488
34.90
$86,279,650
98.6%
95.8%
$86,482,924
$22,758,513
$110,615,994
$60,310
$110,744,477
$76,012,600
$33,547,118
$109,559,718
$831,980
$110,391,698
$352,779
$0
$1,772,742
$7,029,505
25,789
4,401
Aa2
4.5%
0.1%
$3,692,855,076
24.21
$2,505,704,902
35.51
$89,399,738
98.4%
95.4%
$89,316,302
$20,827,429
$111,719,918
$55,258
$111,853,716
$75,058,105
$35,255,531
$110,313,636
$1,711,223
$112,024,859
($171,143)
$0
$1,527,753
$5,329,639
$6,858,362
2016
25,737
4,321
Aa2
4.1%
0.1%
$3,624,125,847
25.36
$2,500,561,611
36.54
$91,894,135
98.9%
96.4%
$92,999,372
$21,589,783
$117,077,453
$57,537
$117,342,057
$76,768,518
$35,585,041
$112,353,559
$1,714,980
$114,068,539
$3,273,518
$0
$2,096,625
$8,035,255
$10,131,880
25,835
4,506
Aa2
6.3%
0.2%
2012
$3,598,807,424
21.90
$2,740,393,996
28.78
$78,796,861
98.7%
96.3%
$79,552,717
$20,555,762
$101,752,531
$60,213
$102,014,892
$70,996,075
$31,215,999
$102,212,074
$1,126,605
$103,338,679
($1,323,787)
$0
$1,413,432
$5,053,337
Committed $0 $0
Nonspendable $0 $970 $135,863
$0
$3,504,042
$0
$17,508$18,722
$0
$5,238,041
Restricted
Assigned
Unassigned
$61,644,876
$5,598,435
$64,937,503
$6,874,897
Bonded Long-Term Debt
Annual Debt Service
$35,885,575
$5,043,160
$59,328,865
$4,418,905
$62,897,475
$6,255,201

SOUTHBURY
Bond Rating (Moody's, as of July 1)
Population (State Dept. of Public Health)
Equalized Net Grand List
Equalized Mill Rate
Mill Rate
Total Revenues
Intergovernmental Revenues
Current Year Collection %
Total Expenditures
Education Expenditures
Unemployment (Annual Average)
School Enrollment (State Education Dept.)
TANF Recipients (As a % of Population)
Total Fund Balance (Deficit)
Total Expenditures and Other Financing Uses
Total Revenues and Other Financing Sources
Grand List Data
Property Tax Collection Data
Property Tax Revenues
Net Change In Fund Balance
FISCAL YEARS ENDED 2012 TO 2016
Operating Expenditures
Current Year Adjusted Tax Levy
Net Grand List
Economic Data
Operating Results - General Fund
Fund Balance - General Fund
Total Taxes Collected as a % of Total Outstanding
D - 132
Total Transfers In From Other Funds
Debt Measures
Total Transfers Out To Other Funds
2015
19,859
2,791
Aa2
6.7%
0.1%
2013
$2,728,456,232
20.12
$2,605,255,257
21.20
$54,908,421
99.2%
98.4%
$55,006,508
$3,816,018
$60,227,211
$80,000
$63,560,144
$40,999,183
$15,261,792
$56,260,975
$3,304,095
$62,734,098
$826,046
$0
$6,117,464
$1,998,314
$8,416,198
2014
19,881
2,756
Aa2
5.7%
0.1%
$3,000,056,220
18.43
$2,099,284,584
26.40
$55,288,750
99.2%
98.8%
$55,282,468
$3,431,029
$60,253,578
$100,000
$60,353,578
$42,098,268
$16,134,107
$58,232,375
$3,436,240
$61,668,615
($1,315,037)
$0
$5,731,679
$7,101,161
19,675
2,657
Aa2
5.2%
0.1%
$3,206,264,994
18.06
$2,099,835,796
27.60
$57,891,678
99.2%
98.7%
$57,950,667
$3,508,992
$62,919,891
$75,000
$62,994,891
$43,729,317
$16,621,873
$60,351,190
$3,138,052
$63,489,242
($494,351)
$0
$5,255,385
$697,402
$6,606,810
2016
19,572
2,582
Aa2
4.8%
0.1%
$3,186,299,045
18.87
$2,119,764,540
28.40
$60,118,678
99.3%
98.8%
$60,597,395
$3,804,091
$66,119,809
$100,000
$66,219,809
$44,646,554
$16,498,418
$61,144,972
$3,471,311
$64,616,283
$1,603,526
$0
$5,505,058
$1,961,766
$8,210,336
19,877
2,910
Aa2
7.0%
0.1%
2012
$3,167,605,345
17.43
$2,601,545,366
21.40
$55,212,445
99.5%
99.1%
$55,519,321
$3,851,708
$60,790,250
$50,000
$60,840,250
$41,344,692
$15,059,326
$56,404,018
$3,136,150
$59,540,168
$1,300,082
$0
$5,411,498
$7,590,152
Committed $487,531 $393,408
Nonspendable $255,981 $260,615 $8,532
$0
$2,170,122
$280,000
$20,420$23,816
$618,080
$727,586
Restricted
Assigned
Unassigned
$20,801,580
$1,382,295
$15,279,382
$1,283,505
Bonded Long-Term Debt
Annual Debt Service
$26,227,660
$1,151,749
$23,497,887
$1,506,186
$18,087,129
$1,346,076

SOUTHINGTON
Bond Rating (Moody's, as of July 1)
Population (State Dept. of Public Health)
Equalized Net Grand List
Equalized Mill Rate
Mill Rate
Total Revenues
Intergovernmental Revenues
Current Year Collection %
Total Expenditures
Education Expenditures
Unemployment (Annual Average)
School Enrollment (State Education Dept.)
TANF Recipients (As a % of Population)
Total Fund Balance (Deficit)
Total Expenditures and Other Financing Uses
Total Revenues and Other Financing Sources
Grand List Data
Property Tax Collection Data
Property Tax Revenues
Net Change In Fund Balance
FISCAL YEARS ENDED 2012 TO 2016
Operating Expenditures
Current Year Adjusted Tax Levy
Net Grand List
Economic Data
Operating Results - General Fund
Fund Balance - General Fund
Total Taxes Collected as a % of Total Outstanding
D - 133
Total Transfers In From Other Funds
Debt Measures
Total Transfers Out To Other Funds
2015
43,661
6,769
Aa2
6.4%
0.3%
2013
$5,316,762,764
19.17
$3,714,867,214
27.48
$101,940,000
98.6%
97.5%
$102,129,000
$31,920,000
$138,333,000
$38,000
$146,000,000
$91,796,000
$41,674,000
$133,470,000
$2,031,000
$142,778,000
$3,222,000
$0
$1,328,000
$18,487,000
$19,886,000
2014
43,815
6,751
Aa2
5.5%
0.4%
$5,286,801,017
19.43
$3,731,644,512
27.46
$102,716,000
98.7%
97.6%
$103,597,000
$33,581,000
$141,396,000
$69,000
$142,185,000
$95,632,000
$41,398,000
$137,030,000
$3,510,000
$140,540,000
$1,645,000
$0
$5,252,000
$21,531,000
43,817
6,721
Aa2
4.6%
0.3%
$5,446,032,327
19.67
$3,773,777,166
28.36
$107,104,000
98.8%
97.9%
$108,052,000
$31,392,000
$144,100,000
$77,000
$156,907,000
$95,625,000
$57,263,000
$152,888,000
$6,443,000
$159,331,000
($2,424,000)
$0
$1,250,000
$17,801,000
$19,107,000
2016
43,685
6,648
Aa2
4.2%
0.2%
$5,705,132,586
19.61
$3,828,716,963
29.14
$111,851,000
98.9%
97.7%
$111,979,000
$33,321,000
$150,107,000
$40,000
$150,640,000
$99,479,000
$45,923,000
$145,402,000
$3,830,000
$149,232,000
$1,408,000
$0
$598,000
$19,738,000
$20,515,000
43,434
6,789
Aa2
7.1%
0.3%
2012
$5,622,660,761
17.57
$4,063,217,317
24.28
$98,794,000
98.6%
97.6%
$99,615,000
$31,838,000
$134,749,000
$72,000
$135,534,000
$88,326,000
$42,223,000
$130,549,000
$3,385,000
$133,934,000
$1,600,000
$0
$496,000
$16,664,000
Committed $146,000 $0
Nonspendable $33,000 $56,000 $84,000
$0
$16,084,000
$0
$71,000$64,000
$0
$16,215,000
Restricted
Assigned
Unassigned
$88,234,000
$6,850,000
$130,880,000
$9,428,000
Bonded Long-Term Debt
Annual Debt Service
$71,634,000
$8,975,000
$64,926,000
$8,247,000
$120,933,000
$8,358,000

SPRAGUE
Bond Rating (Moody's, as of July 1)
Population (State Dept. of Public Health)
Equalized Net Grand List
Equalized Mill Rate
Mill Rate
Total Revenues
Intergovernmental Revenues
Current Year Collection %
Total Expenditures
Education Expenditures
Unemployment (Annual Average)
School Enrollment (State Education Dept.)
TANF Recipients (As a % of Population)
Total Fund Balance (Deficit)
Total Expenditures and Other Financing Uses
Total Revenues and Other Financing Sources
Grand List Data
Property Tax Collection Data
Property Tax Revenues
Net Change In Fund Balance
FISCAL YEARS ENDED 2012 TO 2016
Operating Expenditures
Current Year Adjusted Tax Levy
Net Grand List
Economic Data
Operating Results - General Fund
Fund Balance - General Fund
Total Taxes Collected as a % of Total Outstanding
D - 134
Total Transfers In From Other Funds
Debt Measures
Total Transfers Out To Other Funds
2015
2,979
453
A1
9.6%
1.5%
2013
$277,001,389
17.72
$187,971,090
26.75
$4,907,229
96.7%
94.0%
$5,012,035
$3,608,375
$8,873,509
$24,647
$8,898,156
$6,351,215
$2,467,998
$8,819,213
$85,763
$8,904,976
($6,820)
$0
$0
$423,170
$438,316
2014
2,980
445
A2
7.8%
1.9%
$234,574,730
21.09
$163,859,991
30.00
$4,946,649
97.5%
95.2%
$5,025,077
$4,106,057
$9,273,811
$684,151
$9,957,962
$6,657,148
$2,250,342
$8,907,490
$135,424
$9,692,483
$265,479
$0
$37,886
$703,796
2,951
453
A2
6.7%
1.7%
$232,205,842
22.17
$165,459,070
31.00
$5,148,379
93.4%
91.4%
$5,043,815
$3,841,555
$9,019,812
$135,063
$9,154,875
$6,544,087
$2,795,137
$9,339,224
$28,800
$9,368,024
($213,149)
$0
$131
$405,697
$490,646
2016
2,921
462
A2
5.7%
1.5%
$254,681,402
21.14
$170,748,310
31.00
$5,382,997
90.7%
86.7%
$5,055,478
$3,912,985
$9,198,373
$155,922
$9,354,295
$6,849,721
$2,775,963
$9,625,684
$37,500
$9,663,184
($308,889)
$0
$21,802
$136,289
$181,755
2,988
457
A1
11.0%
1.1%
2012
$256,724,061
18.66
$185,457,280
25.75
$4,791,589
96.8%
93.8%
$4,867,518
$3,786,149
$8,890,022
$25,652
$8,915,674
$6,406,349
$2,551,165
$8,957,514
$101,171
$9,058,685
($143,011)
$0
$0
$445,136
Committed $0 $0
Nonspendable $23,664 $84,818 $5,202
$0
$439,934
$0
$15,146$14,992
$0
$650,918
Restricted
Assigned
Unassigned
$8,253,226
$368,790
$9,013,788
$2,004,292
Bonded Long-Term Debt
Annual Debt Service
$5,630,000
$892,088
$6,738,107
$2,819,234
$8,711,959
$947,116

STAFFORD
Bond Rating (Moody's, as of July 1)
Population (State Dept. of Public Health)
Equalized Net Grand List
Equalized Mill Rate
Mill Rate
Total Revenues
Intergovernmental Revenues
Current Year Collection %
Total Expenditures
Education Expenditures
Unemployment (Annual Average)
School Enrollment (State Education Dept.)
TANF Recipients (As a % of Population)
Total Fund Balance (Deficit)
Total Expenditures and Other Financing Uses
Total Revenues and Other Financing Sources
Grand List Data
Property Tax Collection Data
Property Tax Revenues
Net Change In Fund Balance
FISCAL YEARS ENDED 2012 TO 2016
Operating Expenditures
Current Year Adjusted Tax Levy
Net Grand List
Economic Data
Operating Results - General Fund
Fund Balance - General Fund
Total Taxes Collected as a % of Total Outstanding
D - 135
Total Transfers In From Other Funds
Debt Measures
Total Transfers Out To Other Funds
2015
11,928
1,746
A1
7.9%
0.6%
2013
$1,097,801,514
22.40
$767,123,195
32.29
$24,595,606
96.1%
92.3%
$24,514,358
$14,192,045
$40,410,347
$1,847,559
$55,584,296
$28,209,133
$10,585,969
$38,795,102
$950,000
$53,855,356
$1,728,940
$0
$229,668
$3,281,949
$4,810,530
2014
11,881
1,652
A1
6.8%
0.4%
$1,046,410,611
24.14
$763,713,549
33.06
$25,257,188
96.2%
92.4%
$25,436,394
$14,681,202
$41,652,637
$210,000
$47,434,666
$29,246,051
$11,672,020
$40,918,071
$4,004,500
$46,557,571
$877,095
$0
$250,211
$5,747,057
11,837
1,628
A1
6.1%
0.5%
$1,097,754,329
23.03
$765,337,048
33.03
$25,286,135
96.4%
92.2%
$26,295,285
$14,075,480
$41,624,778
$6,796
$47,293,463
$29,723,966
$17,214,530
$46,938,496
$180,552
$47,119,048
$174,415
$0
$1,099,512
$5,082,537
$6,182,049
2016
11,758
1,596
A1
5.4%
0.5%
$1,101,177,516
23.14
$769,249,636
33.37
$25,481,291
97.2%
94.3%
$25,944,840
$14,705,231
$42,323,060
$233,131
$49,938,025
$29,837,976
$17,529,788
$47,367,764
$2,045,000
$49,412,764
$525,261
$25,347
$988,270
$5,731,816
$6,745,433
11,987
1,836
A1
8.5%
0.5%
2012
$1,127,409,492
20.43
$795,563,870
28.96
$23,036,961
96.4%
93.2%
$22,853,056
$13,888,783
$37,765,410
$1,136,588
$47,091,570
$27,449,756
$10,576,731
$38,026,487
$0
$46,746,487
$345,083
$0
$163,758
$3,081,590
Committed $0 $0
Nonspendable $0 $0 $0
$341,521
$2,576,311
$1,298,913
$0$0
$1,133,353
$4,363,493
Restricted
Assigned
Unassigned
$22,464,406
$2,002,224
$38,326,782
$7,489,662
Bonded Long-Term Debt
Annual Debt Service
$22,092,373
$1,718,246
$19,756,423
$1,780,155
$37,958,258
$7,730,610

STAMFORD
Bond Rating (Moody's, as of July 1)
Population (State Dept. of Public Health)
Equalized Net Grand List
Equalized Mill Rate
Mill Rate
Total Revenues
Intergovernmental Revenues
Current Year Collection %
Total Expenditures
Education Expenditures
Unemployment (Annual Average)
School Enrollment (State Education Dept.)
TANF Recipients (As a % of Population)
Total Fund Balance (Deficit)
Total Expenditures and Other Financing Uses
Total Revenues and Other Financing Sources
Grand List Data
Property Tax Collection Data
Property Tax Revenues
Net Change In Fund Balance
FISCAL YEARS ENDED 2012 TO 2016
Operating Expenditures
Current Year Adjusted Tax Levy
Net Grand List
Economic Data
Operating Results - General Fund
Fund Balance - General Fund
Total Taxes Collected as a % of Total Outstanding
D - 136
Total Transfers In From Other Funds
Debt Measures
Total Transfers Out To Other Funds
2015
126,456
15,491
Aa1
6.4%
0.6%
2013
$28,845,672,604
14.99
$24,294,406,240
17.89
$432,391,167
98.5%
97.2%
$432,104,549
$48,397,667
$512,394,133
$2,865,332
$515,259,465
$255,459,497
$204,633,665
$460,093,162
$52,869,315
$512,962,477
$2,296,988
$0
$3,345,960
$0
$14,418,143
2014
128,278
15,624
Aa1
5.5%
0.6%
$27,068,336,287
16.53
$18,839,166,277
24.04
$447,390,857
98.7%
97.9%
$448,384,626
$54,069,259
$536,955,206
$3,079,068
$540,034,274
$276,434,644
$210,854,256
$487,288,900
$52,243,953
$539,532,853
$501,421
$0
$27,462,937
$33,168,310
128,874
15,774
Aa1
4.7%
0.6%
$31,452,286,889
14.75
$18,989,740,227
24.79
$463,857,225
98.7%
98.1%
$460,727,865
$48,297,407
$544,435,260
$2,798,761
$547,234,021
$272,876,527
$216,351,327
$489,227,854
$49,197,066
$538,424,920
$8,809,101
$0
$34,156,520
$1,421,627
$41,977,411
2016
129,113
15,642
Aa1
4.2%
0.6%
$32,163,709,171
15.06
$19,303,915,067
25.43
$484,534,634
98.7%
98.1%
$477,337,508
$49,990,949
$556,311,786
$2,779,647
$559,091,433
$285,987,017
$221,899,093
$507,886,110
$51,548,119
$559,434,229
($342,796)
$0
$32,902,500
$1,421,310
$41,634,615
125,109
15,269
Aa1
7.0%
0.7%
2012
$29,591,423,350
14.12
$24,028,752,392
17.49
$417,787,311
98.5%
97.1%
$423,093,113
$45,996,081
$497,505,346
$3,214,641
$500,719,987
$252,544,074
$195,288,718
$447,832,792
$49,393,618
$497,226,410
$3,493,577
$0
$3,590,708
$12,121,155
Committed $3,810,091 $3,388,867
Nonspendable $3,500,714 $3,010,397 $154,240
$8,376,207
$0
$10,912,936
$159,247$2,502,277
$1,211,283
$1,991,813
Restricted
Assigned
Unassigned
$380,989,264
$53,189,935
$419,242,793
$52,986,592
Bonded Long-Term Debt
Annual Debt Service
$403,527,696
$48,296,195
$417,857,437
$51,310,199
$392,289,279
$52,455,482

STERLING
Bond Rating (Moody's, as of July 1)
Population (State Dept. of Public Health)
Equalized Net Grand List
Equalized Mill Rate
Mill Rate
Total Revenues
Intergovernmental Revenues
Current Year Collection %
Total Expenditures
Education Expenditures
Unemployment (Annual Average)
School Enrollment (State Education Dept.)
TANF Recipients (As a % of Population)
Total Fund Balance (Deficit)
Total Expenditures and Other Financing Uses
Total Revenues and Other Financing Sources
Grand List Data
Property Tax Collection Data
Property Tax Revenues
Net Change In Fund Balance
FISCAL YEARS ENDED 2012 TO 2016
Operating Expenditures
Current Year Adjusted Tax Levy
Net Grand List
Economic Data
Operating Results - General Fund
Fund Balance - General Fund
Total Taxes Collected as a % of Total Outstanding
D - 137
Total Transfers In From Other Funds
Debt Measures
Total Transfers Out To Other Funds
2015
3,780
664
A1
9.5%
0.7%
2013
$345,122,763
19.94
$321,796,785
21.34
$6,883,006
95.8%
94.7%
$6,844,370
$4,210,875
$11,189,963
$55,798
$11,309,761
$8,274,645
$2,652,293
$10,926,938
$228,364
$11,155,302
$154,459
$20,518
$0
$2,538,228
$2,558,746
2014
3,773
633
A1
8.6%
0.8%
$320,405,687
22.06
$224,123,451
31.50
$7,067,575
96.2%
94.5%
$7,182,560
$4,291,324
$11,629,061
$595
$11,629,656
$8,540,868
$2,567,941
$11,108,809
$319,151
$11,427,960
$201,696
$19,318
$0
$2,760,442
3,764
607
A1
7.4%
0.8%
$332,141,431
21.39
$224,150,120
31.50
$7,104,670
97.1%
96.6%
$7,450,493
$4,172,963
$11,786,287
$0
$11,786,287
$8,378,283
$2,537,842
$10,916,125
$151,723
$11,067,848
$718,439
$16,501
$0
$3,460,499
$3,478,880
2016
3,741
583
A1
6.1%
0.6%
$320,149,040
22.51
$225,629,668
31.60
$7,207,848
97.1%
96.6%
$7,396,849
$4,256,995
$11,796,071
$0
$18,960,206
$8,504,359
$2,519,399
$11,023,758
$126,577
$18,179,968
$780,238
$19,771
$29,138
$4,210,211
$4,259,120
3,799
644
A1
10.5%
0.5%
2012
$361,140,930
18.71
$318,051,089
21.11
$6,757,708
96.4%
95.9%
$6,620,039
$4,266,013
$11,006,706
$6
$11,006,712
$8,082,820
$2,398,388
$10,481,208
$330,372
$10,811,580
$195,132
$14,444
$0
$2,404,286
Committed $0 $0
Nonspendable $0 $1,880 $0
$0
$2,389,842
$0
$0$0
$0
$2,741,124
Restricted
Assigned
Unassigned
$8,690,000
$932,206
$7,295,000
$886,946
Bonded Long-Term Debt
Annual Debt Service
$9,845,000
$955,343
$9,270,000
$946,424
$8,100,000
$923,768

STONINGTON
Bond Rating (Moody's, as of July 1)
Population (State Dept. of Public Health)
Equalized Net Grand List
Equalized Mill Rate
Mill Rate
Total Revenues
Intergovernmental Revenues
Current Year Collection %
Total Expenditures
Education Expenditures
Unemployment (Annual Average)
School Enrollment (State Education Dept.)
TANF Recipients (As a % of Population)
Total Fund Balance (Deficit)
Total Expenditures and Other Financing Uses
Total Revenues and Other Financing Sources
Grand List Data
Property Tax Collection Data
Property Tax Revenues
Net Change In Fund Balance
FISCAL YEARS ENDED 2012 TO 2016
Operating Expenditures
Current Year Adjusted Tax Levy
Net Grand List
Economic Data
Operating Results - General Fund
Fund Balance - General Fund
Total Taxes Collected as a % of Total Outstanding
D - 138
Total Transfers In From Other Funds
Debt Measures
Total Transfers Out To Other Funds
2015
18,541
2,441
Aa1
5.9%
0.5%
2013
$3,636,910,156
13.91
$3,188,057,519
15.89
$50,579,257
98.9%
98.3%
$50,793,373
$5,827,721
$59,639,677
$45,000
$59,684,677
$36,055,893
$22,702,248
$58,758,141
$1,263,733
$60,021,874
($337,197)
$0
$1,665,601
$12,144,077
$13,809,678
2014
18,512
2,388
Aa1
5.7%
0.7%
$3,708,545,647
13.89
$2,592,616,626
19.88
$51,505,144
99.0%
98.4%
$51,736,929
$6,672,590
$61,507,006
$0
$61,507,006
$37,748,407
$22,049,605
$59,798,012
$2,453,712
$62,251,724
($744,718)
$0
$427,574
$13,064,960
18,370
2,339
Aa1
4.9%
0.6%
$3,653,849,292
14.59
$2,600,089,853
20.43
$53,310,452
98.9%
98.7%
$53,836,879
$5,473,746
$62,246,533
$45,000
$62,432,435
$37,234,199
$22,626,749
$59,860,948
$1,665,122
$61,526,070
$906,365
$0
$431,163
$13,540,162
$13,971,325
2016
18,647
2,250
Aa1
4.0%
0.6%
$3,994,188,057
14.03
$2,622,270,316
21.32
$56,039,548
98.7%
98.6%
$56,448,889
$5,989,782
$65,993,278
$45,000
$66,038,278
$38,884,087
$23,786,616
$62,670,703
$2,149,561
$64,820,264
$1,218,014
$0
$854,412
$14,334,927
$15,189,339
18,556
2,458
Aa1
6.2%
0.4%
2012
$4,074,206,314
12.15
$3,166,252,253
15.63
$49,487,774
98.5%
98.0%
$49,741,364
$5,544,730
$58,286,738
$0
$58,672,693
$35,002,770
$20,886,078
$55,888,848
$1,361,315
$57,250,163
$1,422,530
$0
$2,005,146
$14,146,875
Committed $0 $0
Nonspendable $0 $0 $0
$0
$12,141,729
$0
$0$0
$0
$12,637,386
Restricted
Assigned
Unassigned
$43,812,157
$4,720,607
$39,028,195
$5,129,384
Bonded Long-Term Debt
Annual Debt Service
$39,619,464
$4,283,347
$36,276,538
$4,689,081
$42,111,291
$4,859,490

STRATFORD
Bond Rating (Moody's, as of July 1)
Population (State Dept. of Public Health)
Equalized Net Grand List
Equalized Mill Rate
Mill Rate
Total Revenues
Intergovernmental Revenues
Current Year Collection %
Total Expenditures
Education Expenditures
Unemployment (Annual Average)
School Enrollment (State Education Dept.)
TANF Recipients (As a % of Population)
Total Fund Balance (Deficit)
Total Expenditures and Other Financing Uses
Total Revenues and Other Financing Sources
Grand List Data
Property Tax Collection Data
Property Tax Revenues
Net Change In Fund Balance
FISCAL YEARS ENDED 2012 TO 2016
Operating Expenditures
Current Year Adjusted Tax Levy
Net Grand List
Economic Data
Operating Results - General Fund
Fund Balance - General Fund
Total Taxes Collected as a % of Total Outstanding
D - 139
Total Transfers In From Other Funds
Debt Measures
Total Transfers Out To Other Funds
2015
52,112
7,354
A1
8.8%
0.6%
2013
$6,121,995,817
25.38
$4,525,385,543
34.48
$155,392,622
97.7%
95.7%
$154,052,416
$42,309,903
$204,674,279
$700,000
$207,471,443
$104,421,589
$101,080,541
$205,502,130
$1,880,220
$207,382,350
$89,093
$0
$1,666,093
$9,497,442
$11,163,535
2014
52,734
7,475
A1
7.5%
0.4%
$6,517,575,795
24.05
$4,531,278,020
34.64
$156,748,314
97.5%
95.4%
$157,303,762
$40,821,397
$206,367,490
$830,000
$388,463,234
$108,317,705
$257,095,962
$365,413,667
$5,670,684
$389,223,311
($760,077)
$115,669
$612,143
$10,403,458
52,609
7,323
A1
6.5%
0.5%
$6,545,374,298
24.86
$4,558,232,784
35.63
$162,727,443
97.4%
95.3%
$163,762,613
$41,072,498
$212,990,275
$3,330,040
$217,583,041
$110,427,752
$106,910,133
$217,337,885
$1,651,477
$218,989,362
($1,406,321)
$115,669
$126,991
$7,984,818
$8,997,137
2016
52,148
7,246
A1
5.9%
0.4%
$6,353,037,221
25.86
$4,442,837,825
36.98
$164,272,933
97.5%
95.1%
$164,688,249
$41,912,560
$214,593,744
$4,957,546
$219,965,372
$112,764,984
$104,596,870
$217,361,854
$3,275,034
$220,636,888
($671,516)
$0
$16,710
$7,237,796
$8,325,621
52,077
7,493
A1
9.3%
0.7%
2012
$6,257,705,490
24.44
$4,513,223,658
34.15
$152,921,577
98.2%
96.9%
$152,926,235
$36,862,714
$197,726,616
$700,000
$217,912,196
$102,808,638
$91,896,990
$194,705,628
$1,391,114
$215,421,117
$2,491,079
$0
$2,284,297
$11,074,442
Committed $0 $0
Nonspendable $1,071,115 $769,659 $0
$0
$8,790,145
$0
$0$669,812
$0
$9,005,834
Restricted
Assigned
Unassigned
$284,797,261
$22,483,674
$281,082,298
$31,379,528
Bonded Long-Term Debt
Annual Debt Service
$131,914,206
$17,297,140
$138,654,684
$19,102,989
$306,724,607
$31,330,630

SUFFIELD
Bond Rating (Moody's, as of July 1)
Population (State Dept. of Public Health)
Equalized Net Grand List
Equalized Mill Rate
Mill Rate
Total Revenues
Intergovernmental Revenues
Current Year Collection %
Total Expenditures
Education Expenditures
Unemployment (Annual Average)
School Enrollment (State Education Dept.)
TANF Recipients (As a % of Population)
Total Fund Balance (Deficit)
Total Expenditures and Other Financing Uses
Total Revenues and Other Financing Sources
Grand List Data
Property Tax Collection Data
Property Tax Revenues
Net Change In Fund Balance
FISCAL YEARS ENDED 2012 TO 2016
Operating Expenditures
Current Year Adjusted Tax Levy
Net Grand List
Economic Data
Operating Results - General Fund
Fund Balance - General Fund
Total Taxes Collected as a % of Total Outstanding
D - 140
Total Transfers In From Other Funds
Debt Measures
Total Transfers Out To Other Funds
2015
15,788
2,384
6.2%
0.1%
2013
$1,892,114,160
18.53
$1,407,054,334
24.84
$35,062,754
98.8%
97.7%
$35,158,618
$17,289,320
$55,005,844
$1,093,000
$56,619,637
$35,308,503
$15,475,823
$50,784,326
$3,735,334
$54,519,660
$2,099,977
$176,611
$3,214,471
$7,753,141
$11,530,223
2014
15,814
2,314
5.4%
0.1%
$1,948,350,556
18.51
$1,428,862,977
25.16
$36,059,468
98.9%
97.8%
$36,225,744
$17,337,295
$56,217,727
$391,585
$56,609,312
$35,732,506
$16,024,425
$51,756,931
$5,376,693
$57,133,624
($524,312)
$176,611
$1,282,437
$11,005,911
15,662
2,278
4.5%
0.2%
$1,919,627,780
19.04
$1,343,190,541
27.12
$36,554,636
98.7%
97.5%
$36,687,209
$16,357,768
$56,288,342
$2,056,302
$58,344,644
$35,848,599
$17,965,844
$53,814,443
$4,673,074
$58,487,517
($142,873)
$0
$812,017
$9,701,021
$10,863,038
2016
15,625
2,261
4.1%
0.2%
$1,994,576,433
19.11
$1,367,017,452
27.78
$38,122,479
99.1%
97.9%
$38,381,113
$16,623,110
$58,377,893
$215,883
$58,593,776
$37,292,260
$17,591,796
$54,884,056
$4,261,179
$59,145,235
($551,459)
$0
$648,557
$9,313,022
$10,311,579
15,868
2,426
6.8%
0.1%
2012
$1,953,267,664
17.28
$1,396,589,754
24.17
$33,755,515
99.0%
98.1%
$34,156,785
$17,887,712
$55,222,780
$410,000
$55,632,780
$34,204,716
$16,155,314
$50,360,030
$3,740,032
$54,100,062
$1,532,718
$0
$688,901
$9,430,246
Committed $350,000 $350,000
Nonspendable $0 $0 $0
$386,000
$8,355,345
$386,000
$0$0
$0
$9,546,863
Restricted
Assigned
Unassigned
$18,941,183
$2,406,951
$14,734,618
$2,700,920
Bonded Long-Term Debt
Annual Debt Service
$12,903,912
$2,248,430
$20,496,565
$2,184,530
$16,818,247
$2,780,436

THOMASTON
Bond Rating (Moody's, as of July 1)
Population (State Dept. of Public Health)
Equalized Net Grand List
Equalized Mill Rate
Mill Rate
Total Revenues
Intergovernmental Revenues
Current Year Collection %
Total Expenditures
Education Expenditures
Unemployment (Annual Average)
School Enrollment (State Education Dept.)
TANF Recipients (As a % of Population)
Total Fund Balance (Deficit)
Total Expenditures and Other Financing Uses
Total Revenues and Other Financing Sources
Grand List Data
Property Tax Collection Data
Property Tax Revenues
Net Change In Fund Balance
FISCAL YEARS ENDED 2012 TO 2016
Operating Expenditures
Current Year Adjusted Tax Levy
Net Grand List
Economic Data
Operating Results - General Fund
Fund Balance - General Fund
Total Taxes Collected as a % of Total Outstanding
D - 141
Total Transfers In From Other Funds
Debt Measures
Total Transfers Out To Other Funds
2015
7,761
1,163
Aa3
7.1%
0.3%
2013
$751,534,593
23.48
$525,998,215
32.83
$17,645,073
98.4%
96.3%
$17,943,306
$8,104,930
$26,319,519
$20,310
$26,339,829
$15,702,579
$6,769,092
$22,471,671
$3,177,031
$25,648,702
$691,127
$0
$315,000
$2,701,438
$3,016,438
2014
7,683
1,097
Aa3
6.0%
0.2%
$751,015,892
23.81
$527,643,734
33.13
$17,879,100
98.5%
96.5%
$18,134,271
$8,298,939
$26,737,178
$15,000
$26,752,178
$15,838,445
$7,252,472
$23,090,917
$3,537,590
$26,628,507
$123,671
$0
$250,000
$3,140,109
7,621
1,044
Aa3
5.0%
0.3%
$724,533,057
24.96
$523,056,807
33.63
$18,080,787
98.7%
97.0%
$18,337,484
$8,030,707
$26,761,277
$15,000
$26,776,277
$15,560,482
$7,527,900
$23,088,382
$3,660,821
$26,749,203
$27,074
$0
$160,000
$3,007,183
$3,167,183
2016
7,595
1,014
Aa3
4.3%
0.3%
$773,308,066
23.66
$540,190,445
33.63
$18,294,050
98.8%
98.1%
$18,477,767
$8,198,506
$27,078,296
$39,736
$27,126,340
$15,809,352
$7,492,170
$23,301,522
$3,549,412
$26,850,934
$275,406
$0
$102,266
$3,340,323
$3,442,589
7,788
1,194
Aa3
7.6%
0.3%
2012
$730,261,208
22.77
$599,951,403
26.98
$16,626,776
98.2%
95.1%
$16,932,230
$8,001,718
$25,226,210
$19,000
$25,245,210
$15,360,953
$6,759,601
$22,120,554
$2,970,021
$25,090,575
$154,635
$0
$84,533
$2,325,311
Committed $0 $0
Nonspendable $0 $0 $0
$0
$2,240,778
$0
$0$0
$0
$2,890,109
Restricted
Assigned
Unassigned
$29,196,264
$3,188,821
$24,373,139
$3,460,239
Bonded Long-Term Debt
Annual Debt Service
$20,624,694
$2,618,945
$25,481,941
$2,791,846
$27,030,667
$3,260,835

THOMPSON
Bond Rating (Moody's, as of July 1)
Population (State Dept. of Public Health)
Equalized Net Grand List
Equalized Mill Rate
Mill Rate
Total Revenues
Intergovernmental Revenues
Current Year Collection %
Total Expenditures
Education Expenditures
Unemployment (Annual Average)
School Enrollment (State Education Dept.)
TANF Recipients (As a % of Population)
Total Fund Balance (Deficit)
Total Expenditures and Other Financing Uses
Total Revenues and Other Financing Sources
Grand List Data
Property Tax Collection Data
Property Tax Revenues
Net Change In Fund Balance
FISCAL YEARS ENDED 2012 TO 2016
Operating Expenditures
Current Year Adjusted Tax Levy
Net Grand List
Economic Data
Operating Results - General Fund
Fund Balance - General Fund
Total Taxes Collected as a % of Total Outstanding
D - 142
Total Transfers In From Other Funds
Debt Measures
Total Transfers Out To Other Funds
2015
9,354
1,190
A1
7.7%
0.7%
2013
$807,310,836
16.70
$608,364,372
22.20
$13,480,856
97.8%
94.6%
$13,613,575
$10,242,444
$24,481,842
$543,990
$25,100,832
$17,999,046
$5,919,167
$23,918,213
$359,649
$24,277,862
$822,970
$426,490
$216,220
$2,084,784
$2,727,494
2014
9,308
1,108
A1
6.1%
0.6%
$813,723,910
16.78
$613,190,008
22.42
$13,650,569
98.0%
94.7%
$13,886,301
$10,141,990
$24,781,208
$122,600
$24,903,808
$18,544,267
$5,830,621
$24,374,888
$491,572
$24,866,460
$37,348
$266,490
$145,684
$2,764,842
9,290
1,061
A1
5.3%
0.6%
$830,639,786
16.87
$615,056,976
22.87
$14,009,675
98.0%
94.1%
$14,130,718
$9,980,410
$24,700,624
$64,389
$24,765,013
$18,736,722
$6,117,138
$24,853,860
$359,300
$25,213,160
($448,147)
$146,490
$216,709
$1,953,496
$2,316,695
2016
9,266
1,043
A1
5.1%
0.4%
$834,528,271
17.27
$583,238,930
24.80
$14,413,827
98.2%
94.4%
$14,673,714
$9,943,392
$25,382,886
$21,500
$34,584,386
$19,162,844
$5,800,852
$24,963,696
$440,000
$34,516,135
$68,251
$66,490
$165,826
$2,152,630
$2,384,946
9,373
1,214
A1
8.6%
0.5%
2012
$838,281,622
15.10
$606,299,218
21.01
$12,660,868
98.1%
95.2%
$12,789,596
$10,131,313
$23,531,413
$38,500
$23,569,913
$17,604,208
$5,776,014
$23,380,222
$260,000
$23,640,222
($70,309)
$0
$114,487
$1,904,524
Committed $0 $0
Nonspendable $0 $0 $0
$0
$1,790,037
$0
$0$0
$0
$2,352,668
Restricted
Assigned
Unassigned
$10,200,910
$1,053,259
$9,841,473
$1,029,419
Bonded Long-Term Debt
Annual Debt Service
$11,335,942
$1,113,642
$10,826,597
$1,032,528
$9,751,687
$1,007,713

TOLLAND
Bond Rating (Moody's, as of July 1)
Population (State Dept. of Public Health)
Equalized Net Grand List
Equalized Mill Rate
Mill Rate
Total Revenues
Intergovernmental Revenues
Current Year Collection %
Total Expenditures
Education Expenditures
Unemployment (Annual Average)
School Enrollment (State Education Dept.)
TANF Recipients (As a % of Population)
Total Fund Balance (Deficit)
Total Expenditures and Other Financing Uses
Total Revenues and Other Financing Sources
Grand List Data
Property Tax Collection Data
Property Tax Revenues
Net Change In Fund Balance
FISCAL YEARS ENDED 2012 TO 2016
Operating Expenditures
Current Year Adjusted Tax Levy
Net Grand List
Economic Data
Operating Results - General Fund
Fund Balance - General Fund
Total Taxes Collected as a % of Total Outstanding
D - 143
Total Transfers In From Other Funds
Debt Measures
Total Transfers Out To Other Funds
2015
14,915
2,950
Aa2
5.4%
0.1%
2013
$1,781,574,139
21.80
$1,293,240,010
29.99
$38,831,162
99.1%
98.7%
$39,100,634
$16,502,034
$56,290,219
$0
$56,349,900
$40,346,946
$15,824,571
$56,171,517
$310,853
$56,482,370
($132,470)
$170,722
$1,086,458
$6,649,387
$7,906,567
2014
14,872
2,874
Aa2
4.5%
0.2%
$1,779,999,108
22.01
$1,295,797,756
30.19
$39,180,222
99.2%
99.0%
$39,438,201
$17,105,210
$57,368,477
$0
$57,368,477
$41,193,428
$15,500,521
$56,693,949
$185,991
$56,879,940
$488,537
$59,680
$1,281,734
$8,395,104
14,849
2,792
Aa2
3.8%
0.2%
$1,824,222,787
22.18
$1,300,919,626
31.05
$40,469,272
99.1%
98.7%
$40,552,478
$16,383,122
$57,670,027
$86,820
$57,756,847
$41,845,358
$15,629,917
$57,475,275
$210,456
$57,685,731
$71,116
$0
$1,537,737
$6,853,234
$8,466,220
2016
14,791
2,710
Aa2
3.5%
0.1%
$1,793,859,607
23.40
$1,255,176,745
33.36
$41,981,338
99.2%
98.9%
$42,183,337
$16,861,099
$59,775,912
$88,196
$59,864,108
$43,158,871
$15,576,536
$58,735,407
$652,482
$59,387,889
$476,219
$0
$1,764,973
$7,113,653
$8,942,439
14,964
3,018
Aa2
5.6%
0.1%
2012
$1,842,304,335
20.68
$1,281,961,185
29.73
$38,100,458
99.0%
98.6%
$38,322,762
$16,850,972
$55,823,239
$0
$55,964,101
$39,416,894
$16,053,627
$55,470,521
$265,810
$55,736,331
$227,770
$140,862
$1,309,480
$8,039,037
Committed $63,813 $75,249
Nonspendable $0 $0 $0
$0
$6,588,695
$0
$0$0
$0
$7,053,690
Restricted
Assigned
Unassigned
$45,664,352
$4,955,883
$46,027,377
$4,747,632
Bonded Long-Term Debt
Annual Debt Service
$41,869,133
$5,017,690
$39,671,210
$4,974,766
$47,315,223
$4,814,034

TORRINGTON
Bond Rating (Moody's, as of July 1)
Population (State Dept. of Public Health)
Equalized Net Grand List
Equalized Mill Rate
Mill Rate
Total Revenues
Intergovernmental Revenues
Current Year Collection %
Total Expenditures
Education Expenditures
Unemployment (Annual Average)
School Enrollment (State Education Dept.)
TANF Recipients (As a % of Population)
Total Fund Balance (Deficit)
Total Expenditures and Other Financing Uses
Total Revenues and Other Financing Sources
Grand List Data
Property Tax Collection Data
Property Tax Revenues
Net Change In Fund Balance
FISCAL YEARS ENDED 2012 TO 2016
Operating Expenditures
Current Year Adjusted Tax Levy
Net Grand List
Economic Data
Operating Results - General Fund
Fund Balance - General Fund
Total Taxes Collected as a % of Total Outstanding
D - 144
Total Transfers In From Other Funds
Debt Measures
Total Transfers Out To Other Funds
2015
35,611
4,533
Aa3
8.4%
0.8%
2013
$3,163,588,444
24.96
$2,359,143,335
33.47
$78,960,342
100.0%
100.0%
$79,225,876
$35,757,107
$120,661,061
$1,250,980
$121,912,041
$71,882,551
$47,530,357
$119,412,908
$1,270,473
$120,683,381
$1,228,660
$0
$721,028
$5,334,739
$6,430,424
2014
35,190
4,460
Aa3
7.2%
0.8%
$2,999,332,916
27.17
$2,360,288,625
34.46
$81,497,980
100.0%
100.0%
$81,734,315
$36,531,569
$125,384,894
$1,497,860
$126,882,754
$76,389,179
$48,610,487
$124,999,666
$1,465,791
$126,465,457
$417,297
$0
$207,895
$6,847,721
34,906
4,482
Aa3
6.3%
0.9%
$2,876,842,027
30.04
$2,373,788,485
36.32
$86,433,955
100.0%
100.0%
$86,608,504
$34,990,554
$128,056,737
$1,501,272
$129,558,009
$76,790,078
$49,253,532
$126,043,610
$1,549,930
$127,593,540
$1,964,469
$0
$230,674
$8,337,813
$8,812,190
2016
34,646
4,466
Aa3
5.9%
0.6%
$2,760,539,379
32.35
$1,928,446,385
45.75
$89,292,132
100.0%
100.0%
$89,078,644
$36,409,678
$131,258,361
$1,400,000
$137,696,013
$78,294,333
$48,754,015
$127,048,348
$3,056,617
$135,116,437
$2,579,576
$0
$211,387
$9,873,604
$10,378,749
35,808
4,623
Aa3
9.1%
1.0%
2012
$3,280,718,564
23.21
$2,344,000,030
32.50
$76,135,568
100.0%
100.0%
$76,366,984
$36,025,609
$117,492,864
$1,700,000
$119,192,864
$69,524,879
$46,757,597
$116,282,476
$1,293,748
$117,576,224
$1,616,640
$0
$497,431
$5,201,764
Committed $293,758 $243,703
Nonspendable $0 $0 $0
$343,629
$4,360,704
$374,657
$0$0
$337,772
$6,302,054
Restricted
Assigned
Unassigned
$27,358,572
$4,185,554
$21,991,162
$3,679,420
Bonded Long-Term Debt
Annual Debt Service
$33,618,822
$5,234,089
$29,979,821
$5,058,596
$24,673,333
$3,808,649

TRUMBULL
Bond Rating (Moody's, as of July 1)
Population (State Dept. of Public Health)
Equalized Net Grand List
Equalized Mill Rate
Mill Rate
Total Revenues
Intergovernmental Revenues
Current Year Collection %
Total Expenditures
Education Expenditures
Unemployment (Annual Average)
School Enrollment (State Education Dept.)
TANF Recipients (As a % of Population)
Total Fund Balance (Deficit)
Total Expenditures and Other Financing Uses
Total Revenues and Other Financing Sources
Grand List Data
Property Tax Collection Data
Property Tax Revenues
Net Change In Fund Balance
FISCAL YEARS ENDED 2012 TO 2016
Operating Expenditures
Current Year Adjusted Tax Levy
Net Grand List
Economic Data
Operating Results - General Fund
Fund Balance - General Fund
Total Taxes Collected as a % of Total Outstanding
D - 145
Total Transfers In From Other Funds
Debt Measures
Total Transfers Out To Other Funds
2015
36,571
6,759
Aa2
6.3%
0.1%
2013
$6,339,433,163
21.38
$4,436,178,214
30.71
$135,527,523
98.0%
96.9%
$135,506,647
$17,524,070
$159,869,929
$601,317
$160,757,621
$105,090,812
$54,887,815
$159,978,627
$0
$159,978,627
$778,994
$0
$803,684
$17,173,299
$20,827,677
2014
36,578
6,668
Aa2
5.4%
0.1%
$6,635,054,926
20.85
$4,465,363,903
31.29
$138,338,088
98.2%
96.7%
$138,268,546
$18,329,424
$163,930,660
$805,176
$173,480,002
$109,704,266
$57,322,390
$167,026,656
$0
$175,520,915
($2,040,913)
$0
$369,264
$18,786,764
36,628
6,587
Aa2
4.7%
0.1%
$6,660,963,078
21.51
$4,517,559,428
32.16
$143,277,980
98.9%
98.1%
$144,465,175
$18,574,675
$170,470,944
$1,267,366
$172,573,224
$111,191,120
$59,306,549
$170,497,669
$0
$171,105,554
$1,467,670
$0
$374,390
$16,620,913
$20,254,434
2016
36,237
6,616
Aa2
4.2%
0.1%
$6,760,747,989
21.66
$4,520,675,882
32.87
$146,416,744
99.1%
98.5%
$147,288,829
$19,724,597
$174,688,646
$1,046,418
$179,701,127
$113,968,828
$59,736,584
$173,705,412
$0
$177,614,459
$2,086,668
$0
$80,999
$19,757,957
$22,341,102
36,514
6,799
Aa2
6.8%
0.1%
2012
$6,674,400,349
19.41
$5,209,460,523
25.00
$129,537,844
98.7%
97.8%
$129,929,396
$16,295,453
$152,597,114
$487,812
$153,084,926
$99,657,036
$51,655,202
$151,312,238
$0
$151,312,238
$1,772,688
$0
$626,129
$20,048,683
Committed $861,526 $1,617,278
Nonspendable $1,640,620 $1,641,853 $1,684,983
$875,572
$16,861,999
$1,181,446
$1,669,248$1,655,056
$1,527,635
$15,234,809
Restricted
Assigned
Unassigned
$91,105,180
$12,124,084
$90,259,050
$12,797,229
Bonded Long-Term Debt
Annual Debt Service
$83,068,580
$11,081,897
$92,286,720
$11,432,679
$90,938,640
$13,053,134

UNION
Bond Rating (Moody's, as of July 1)
Population (State Dept. of Public Health)
Equalized Net Grand List
Equalized Mill Rate
Mill Rate
Total Revenues
Intergovernmental Revenues
Current Year Collection %
Total Expenditures
Education Expenditures
Unemployment (Annual Average)
School Enrollment (State Education Dept.)
TANF Recipients (As a % of Population)
Total Fund Balance (Deficit)
Total Expenditures and Other Financing Uses
Total Revenues and Other Financing Sources
Grand List Data
Property Tax Collection Data
Property Tax Revenues
Net Change In Fund Balance
FISCAL YEARS ENDED 2012 TO 2016
Operating Expenditures
Current Year Adjusted Tax Levy
Net Grand List
Economic Data
Operating Results - General Fund
Fund Balance - General Fund
Total Taxes Collected as a % of Total Outstanding
D - 146
Total Transfers In From Other Funds
Debt Measures
Total Transfers Out To Other Funds
2015
848
100
5.8%
0.0%
2013
$128,609,416
17.91
$97,609,850
23.59
$2,302,943
98.3%
97.6%
$2,312,286
$546,054
$2,882,477
$145,200
$3,038,962
$1,739,301
$1,304,319
$3,043,620
$0
$3,043,620
($4,658)
$0
$230,000
$272,811
$502,811
2014
846
110
5.2%
0.0%
$125,904,473
19.02
$98,614,334
24.37
$2,395,165
98.2%
97.2%
$2,399,233
$608,064
$3,052,984
$200
$3,053,184
$1,958,719
$1,158,108
$3,116,827
$48,321
$3,165,148
($111,964)
$0
$140,000
$390,847
843
110
4.8%
0.0%
$128,390,261
20.27
$89,854,183
29.00
$2,602,383
98.5%
97.7%
$2,641,477
$604,346
$3,295,667
$40,500
$3,336,167
$2,111,063
$1,205,795
$3,316,858
$0
$3,316,858
$19,309
$0
$140,000
$270,156
$410,156
2016
840
113
4.3%
0.0%
$118,614,798
22.53
$90,011,560
29.60
$2,671,799
98.6%
96.8%
$2,648,659
$589,749
$3,287,278
$20,500
$3,307,778
$2,137,583
$1,153,623
$3,291,206
$22,110
$3,313,316
($5,538)
$0
$160,000
$244,618
$404,618
852
103
6.1%
0.1%
2012
$139,771,359
15.85
$96,797,167
23.05
$2,215,932
99.0%
98.2%
$2,260,471
$535,465
$2,835,799
$200
$2,863,073
$1,667,621
$1,112,710
$2,780,331
$43,868
$2,824,199
$38,874
$0
$140,000
$507,468
Committed $0 $0
Nonspendable $0 $0 $0
$0
$367,468
$0
$0$0
$0
$250,847
Restricted
Assigned
Unassigned
$2,934,556
$868,850
$2,573,059
$251,178
Bonded Long-Term Debt
Annual Debt Service
$3,839,650
$323,120
$3,678,800
$316,406
$2,708,983
$344,362

VERNON
Bond Rating (Moody's, as of July 1)
Population (State Dept. of Public Health)
Equalized Net Grand List
Equalized Mill Rate
Mill Rate
Total Revenues
Intergovernmental Revenues
Current Year Collection %
Total Expenditures
Education Expenditures
Unemployment (Annual Average)
School Enrollment (State Education Dept.)
TANF Recipients (As a % of Population)
Total Fund Balance (Deficit)
Total Expenditures and Other Financing Uses
Total Revenues and Other Financing Sources
Grand List Data
Property Tax Collection Data
Property Tax Revenues
Net Change In Fund Balance
FISCAL YEARS ENDED 2012 TO 2016
Operating Expenditures
Current Year Adjusted Tax Levy
Net Grand List
Economic Data
Operating Results - General Fund
Fund Balance - General Fund
Total Taxes Collected as a % of Total Outstanding
D - 147
Total Transfers In From Other Funds
Debt Measures
Total Transfers Out To Other Funds
2015
29,161
3,710
Aa2
7.4%
0.9%
2013
$2,484,656,177
23.62
$1,738,439,714
33.63
$58,684,540
98.5%
97.1%
$58,939,088
$25,275,405
$86,474,509
$528,085
$87,047,424
$54,365,055
$30,674,985
$85,040,040
$1,717,721
$86,757,761
$289,663
$0
$1,388,542
$10,015,648
$11,404,190
2014
29,098
3,659
Aa2
6.4%
0.9%
$2,402,677,895
25.89
$1,734,380,865
35.40
$62,210,620
98.6%
97.2%
$62,683,962
$25,613,730
$90,829,489
$222,961
$91,052,450
$56,788,058
$30,723,766
$87,511,824
$2,261,474
$89,773,298
$1,279,152
$0
$1,540,633
$12,683,342
28,959
3,582
Aa2
5.5%
0.9%
$2,520,764,900
25.39
$1,762,050,886
36.11
$63,997,909
98.7%
97.4%
$64,116,182
$25,776,430
$92,741,578
$167,162
$92,908,740
$57,008,315
$32,115,915
$89,124,230
$2,183,065
$91,307,295
$1,601,445
$0
$2,003,342
$12,151,945
$14,284,787
2016
29,148
3,512
Aa2
4.9%
0.8%
$2,546,983,355
25.82
$1,767,087,018
36.91
$65,758,703
98.9%
97.8%
$66,502,928
$25,120,365
$95,243,807
$237,180
$95,480,987
$56,591,613
$33,354,195
$89,945,808
$2,859,710
$92,805,518
$2,675,469
$0
$2,729,466
$14,230,790
$16,960,256
29,122
3,750
Aa2
8.0%
0.9%
2012
$2,540,965,785
22.59
$1,914,573,272
29.90
$57,407,016
98.6%
97.2%
$57,327,038
$27,838,711
$87,500,671
$329,270
$88,002,442
$52,300,137
$34,060,542
$86,360,679
$1,605,301
$87,965,980
$36,462
$0
$1,820,141
$11,114,527
Committed $0 $0
Nonspendable $0 $129,500 $0
$0
$9,294,386
$0
$0$0
$0
$11,142,709
Restricted
Assigned
Unassigned
$42,419,484
$5,805,886
$46,075,942
$6,148,280
Bonded Long-Term Debt
Annual Debt Service
$49,396,447
$6,603,831
$46,747,238
$6,056,353
$38,016,495
$5,708,537

VOLUNTOWN
Bond Rating (Moody's, as of July 1)
Population (State Dept. of Public Health)
Equalized Net Grand List
Equalized Mill Rate
Mill Rate
Total Revenues
Intergovernmental Revenues
Current Year Collection %
Total Expenditures
Education Expenditures
Unemployment (Annual Average)
School Enrollment (State Education Dept.)
TANF Recipients (As a % of Population)
Total Fund Balance (Deficit)
Total Expenditures and Other Financing Uses
Total Revenues and Other Financing Sources
Grand List Data
Property Tax Collection Data
Property Tax Revenues
Net Change In Fund Balance
FISCAL YEARS ENDED 2012 TO 2016
Operating Expenditures
Current Year Adjusted Tax Levy
Net Grand List
Economic Data
Operating Results - General Fund
Fund Balance - General Fund
Total Taxes Collected as a % of Total Outstanding
D - 148
Total Transfers In From Other Funds
Debt Measures
Total Transfers Out To Other Funds
2015
2,611
415
9.0%
0.5%
2013
$266,836,147
17.97
$194,954,334
24.25
$4,793,824
97.2%
95.3%
$4,815,884
$3,537,975
$8,536,148
$50,001
$8,586,149
$6,716,929
$1,602,153
$8,319,082
$265,001
$8,584,083
$2,066
$0
$41,114
$1,493,412
$2,111,666
2014
2,593
401
6.9%
0.6%
$268,254,971
18.05
$199,289,624
24.25
$4,841,497
97.5%
95.6%
$4,907,463
$3,492,893
$8,507,079
$0
$8,507,079
$6,927,162
$1,857,151
$8,784,313
$56,028
$8,840,341
($333,262)
$0
$29,594
$1,778,404
2,579
406
5.9%
0.8%
$283,651,329
17.23
$200,681,842
24.25
$4,888,366
98.2%
95.9%
$4,928,100
$3,594,485
$8,656,046
$82,000
$8,738,046
$7,048,859
$1,532,356
$8,581,215
$1,006,304
$9,587,519
($849,473)
$0
$29,654
$899,277
$928,931
2016
2,565
388
5.0%
0.7%
$275,601,575
19.59
$201,730,728
26.61
$5,398,512
98.3%
96.0%
$5,427,435
$3,939,000
$9,493,346
$12,613
$9,505,959
$7,215,736
$1,448,717
$8,664,453
$15,000
$8,679,453
$826,506
$0
$33,530
$1,626,907
$1,755,437
2,611
436
10.2%
0.7%
2012
$276,837,569
17.19
$193,511,868
24.17
$4,759,345
97.0%
95.3%
$4,846,485
$3,341,400
$8,305,595
$0
$8,305,595
$6,573,552
$1,296,756
$7,870,308
$75,000
$7,945,308
$360,287
$0
$6,962
$2,109,600
Committed $0 $0
Nonspendable $95,000 $0 $0
$525,359
$1,577,279
$577,140
$0$0
$164,626
$1,584,184
Restricted
Assigned
Unassigned
$0
$275,058
$0
$0
Bonded Long-Term Debt
Annual Debt Service
$381,533
$84,500
$260,000
$81,250
$0
$0

WALLINGFORD
Bond Rating (Moody's, as of July 1)
Population (State Dept. of Public Health)
Equalized Net Grand List
Equalized Mill Rate
Mill Rate
Total Revenues
Intergovernmental Revenues
Current Year Collection %
Total Expenditures
Education Expenditures
Unemployment (Annual Average)
School Enrollment (State Education Dept.)
TANF Recipients (As a % of Population)
Total Fund Balance (Deficit)
Total Expenditures and Other Financing Uses
Total Revenues and Other Financing Sources
Grand List Data
Property Tax Collection Data
Property Tax Revenues
Net Change In Fund Balance
FISCAL YEARS ENDED 2012 TO 2016
Operating Expenditures
Current Year Adjusted Tax Levy
Net Grand List
Economic Data
Operating Results - General Fund
Fund Balance - General Fund
Total Taxes Collected as a % of Total Outstanding
D - 149
Total Transfers In From Other Funds
Debt Measures
Total Transfers Out To Other Funds
2015
45,141
6,289
Aaa
6.6%
0.3%
2013
$5,908,424,628
18.46
$4,180,327,454
25.98
$109,079,000
98.1%
95.8%
$109,255,000
$37,299,000
$151,652,000
$2,104,000
$153,756,000
$99,391,000
$50,114,000
$149,505,000
$2,091,000
$151,596,000
$2,160,000
$0
$5,626,000
$18,265,000
$24,804,000
2014
45,074
6,121
Aaa
5.7%
0.3%
$6,075,318,040
18.30
$4,217,052,785
26.22
$111,148,000
98.3%
95.8%
$111,543,000
$39,188,000
$155,748,000
$1,974,000
$157,722,000
$103,194,000
$51,477,000
$154,671,000
$2,291,000
$156,962,000
$760,000
$0
$4,869,000
$25,564,000
44,893
6,233
Aaa
4.8%
0.3%
$6,009,145,362
19.15
$4,250,582,165
26.89
$115,054,000
98.5%
96.0%
$115,657,000
$37,190,000
$158,100,000
$1,997,000
$160,097,000
$102,504,000
$53,455,000
$155,959,000
$2,131,000
$158,090,000
$2,007,000
$0
$4,871,000
$19,811,000
$27,571,000
2016
44,660
6,135
Aaa
4.3%
0.2%
$6,194,564,722
19.05
$4,268,211,000
27.47
$118,024,000
98.6%
96.6%
$119,376,000
$38,240,000
$163,550,000
$1,965,000
$177,797,000
$106,678,000
$54,626,000
$161,304,000
$2,677,000
$176,118,000
$1,679,000
$0
$5,098,000
$22,509,000
$29,250,000
45,179
6,572
Aaa
7.2%
0.3%
2012
$5,959,102,100
17.72
$4,169,070,630
25.22
$105,608,000
98.2%
96.2%
$105,948,000
$36,020,000
$148,180,000
$1,997,000
$167,257,000
$95,875,000
$50,484,000
$146,359,000
$2,273,000
$165,575,000
$1,682,000
$0
$6,008,000
$22,644,000
Committed $1,517,000 $2,889,000
Nonspendable $126,000 $0 $4,000
$295,000
$16,337,000
$911,000
$2,000$0
$1,858,000
$18,837,000
Restricted
Assigned
Unassigned
$31,114,000
$4,511,000
$34,310,000
$4,375,000
Bonded Long-Term Debt
Annual Debt Service
$37,738,000
$5,210,000
$34,299,000
$4,807,000
$27,595,000
$4,729,000

WARREN
Bond Rating (Moody's, as of July 1)
Population (State Dept. of Public Health)
Equalized Net Grand List
Equalized Mill Rate
Mill Rate
Total Revenues
Intergovernmental Revenues
Current Year Collection %
Total Expenditures
Education Expenditures
Unemployment (Annual Average)
School Enrollment (State Education Dept.)
TANF Recipients (As a % of Population)
Total Fund Balance (Deficit)
Total Expenditures and Other Financing Uses
Total Revenues and Other Financing Sources
Grand List Data
Property Tax Collection Data
Property Tax Revenues
Net Change In Fund Balance
FISCAL YEARS ENDED 2012 TO 2016
Operating Expenditures
Current Year Adjusted Tax Levy
Net Grand List
Economic Data
Operating Results - General Fund
Fund Balance - General Fund
Total Taxes Collected as a % of Total Outstanding
D - 150
Total Transfers In From Other Funds
Debt Measures
Total Transfers Out To Other Funds
2015
1,447
171
Aa2
6.2%
0.0%
2013
$471,325,950
9.83
$357,792,660
13.00
$4,632,127
99.3%
99.0%
$4,663,154
$167,000
$4,946,692
$0
$4,946,692
$3,158,921
$1,578,427
$4,737,348
$133,801
$4,871,149
$75,543
$0
$84,216
$1,437,327
$1,524,970
2014
1,427
166
Aa2
5.4%
0.1%
$489,722,357
9.68
$342,705,650
13.90
$4,740,754
99.1%
98.5%
$4,752,037
$166,064
$5,111,191
$0
$5,111,191
$3,128,812
$1,658,205
$4,787,017
$167,000
$4,954,017
$157,174
$0
$74,646
$1,682,144
1,417
154
Aa2
4.9%
0.1%
$549,898,358
8.92
$346,550,150
14.20
$4,906,438
99.2%
98.4%
$4,915,979
$139,249
$5,261,825
$0
$5,261,825
$3,311,693
$1,648,034
$4,959,727
$173,896
$5,133,623
$128,202
$0
$36,220
$1,770,699
$1,810,346
2016
1,408
163
Aa2
4.2%
0.0%
$535,161,654
9.34
$352,843,140
14.20
$4,997,981
99.7%
99.6%
$5,111,414
$110,900
$5,427,167
$0
$5,427,167
$3,260,832
$1,742,055
$5,002,887
$175,500
$5,178,387
$248,780
$0
$8,300
$1,963,034
$2,059,126
1,447
177
Aa2
6.2%
0.3%
2012
$597,859,438
7.19
$352,983,080
12.25
$4,295,920
99.1%
98.9%
$4,308,297
$154,090
$4,604,394
$0
$4,604,394
$2,995,840
$2,394,768
$5,390,608
$124,967
$5,515,575
($911,181)
$0
$146,647
$1,449,427
Committed $87,792 $3,427
Nonspendable $0 $0 $0
$23,319
$1,279,461
$3,427
$0$0
$3,427
$1,604,071
Restricted
Assigned
Unassigned
$2,837,609
$235,688
$2,785,161
$229,313
Bonded Long-Term Debt
Annual Debt Service
$3,356,927
$241,688
$3,105,199
$238,688
$2,594,045
$232,688

WASHINGTON
Bond Rating (Moody's, as of July 1)
Population (State Dept. of Public Health)
Equalized Net Grand List
Equalized Mill Rate
Mill Rate
Total Revenues
Intergovernmental Revenues
Current Year Collection %
Total Expenditures
Education Expenditures
Unemployment (Annual Average)
School Enrollment (State Education Dept.)
TANF Recipients (As a % of Population)
Total Fund Balance (Deficit)
Total Expenditures and Other Financing Uses
Total Revenues and Other Financing Sources
Grand List Data
Property Tax Collection Data
Property Tax Revenues
Net Change In Fund Balance
FISCAL YEARS ENDED 2012 TO 2016
Operating Expenditures
Current Year Adjusted Tax Levy
Net Grand List
Economic Data
Operating Results - General Fund
Fund Balance - General Fund
Total Taxes Collected as a % of Total Outstanding
D - 151
Total Transfers In From Other Funds
Debt Measures
Total Transfers Out To Other Funds
2015
3,526
372
Aa2
5.3%
0.1%
2013
$1,539,044,495
9.37
$1,254,868,260
11.50
$14,415,527
98.6%
97.7%
$14,378,729
$374,888
$15,650,048
$0
$15,790,048
$9,532,203
$4,738,159
$14,270,362
$1,869,377
$16,139,739
($349,691)
$0
$197,873
$2,464,751
$2,831,679
2014
3,487
346
4.7%
0.1%
$1,527,331,924
9.64
$1,254,795,221
11.75
$14,723,517
98.8%
98.0%
$14,962,418
$364,425
$16,112,099
$0
$16,706,493
$9,402,789
$4,834,795
$14,237,584
$2,014,000
$16,251,584
$454,909
$0
$331,163
$3,286,588
3,466
328
3.9%
0.1%
$1,564,162,547
9.44
$1,094,809,783
13.50
$14,767,890
99.0%
98.1%
$14,902,224
$472,882
$16,251,415
$0
$16,588,101
$9,681,272
$5,187,996
$14,869,268
$1,783,750
$16,653,018
($64,917)
$0
$343,165
$2,636,365
$3,221,671
2016
3,452
326
3.2%
0.1%
$1,735,039,846
8.73
$1,096,164,724
13.75
$15,153,140
99.2%
98.3%
$15,484,826
$264,860
$16,681,554
$0
$16,681,554
$9,716,505
$4,504,251
$14,220,756
$1,746,631
$15,967,387
$714,167
$0
$1,003,965
$2,646,341
$3,935,838
3,534
400
Aa2
5.6%
0.1%
2012
$1,688,543,864
8.13
$1,252,101,590
11.00
$13,734,945
99.1%
98.5%
$13,861,023
$302,399
$14,949,998
$0
$14,949,998
$9,328,359
$4,177,002
$13,505,361
$980,500
$14,485,861
$464,137
$0
$507,009
$3,181,370
Committed $267,016 $242,141
Nonspendable $18,516 $0 $0
$80,809
$2,593,552
$169,055
$0$0
$203,216
$2,752,209
Restricted
Assigned
Unassigned
$1,094,208
$56,348
$618,570
$0
Bonded Long-Term Debt
Annual Debt Service
$1,717,040
$61,738
$1,436,165
$59,043
$863,917
$0

WATERBURY
Bond Rating (Moody's, as of July 1)
Population (State Dept. of Public Health)
Equalized Net Grand List
Equalized Mill Rate
Mill Rate
Total Revenues
Intergovernmental Revenues
Current Year Collection %
Total Expenditures
Education Expenditures
Unemployment (Annual Average)
School Enrollment (State Education Dept.)
TANF Recipients (As a % of Population)
Total Fund Balance (Deficit)
Total Expenditures and Other Financing Uses
Total Revenues and Other Financing Sources
Grand List Data
Property Tax Collection Data
Property Tax Revenues
Net Change In Fund Balance
FISCAL YEARS ENDED 2012 TO 2016
Operating Expenditures
Current Year Adjusted Tax Levy
Net Grand List
Economic Data
Operating Results - General Fund
Fund Balance - General Fund
Total Taxes Collected as a % of Total Outstanding
D - 152
Total Transfers In From Other Funds
Debt Measures
Total Transfers Out To Other Funds
2015
109,676
17,787
A1
12.3%
3.3%
2013
$5,511,932,369
39.81
$5,307,801,573
41.82
$219,431,000
97.8%
93.9%
$224,710,000
$159,594,000
$403,119,000
$0
$403,119,000
$174,373,000
$180,005,000
$354,378,000
$48,720,000
$403,098,000
$21,000
$0
$3,000,000
$19,422,000
$22,422,000
2014
109,307
17,970
A1
10.7%
3.4%
$5,758,088,707
39.17
$4,016,431,515
56.98
$225,554,000
98.4%
95.1%
$230,789,000
$160,392,000
$410,162,000
$0
$410,162,000
$180,634,000
$180,506,000
$361,140,000
$48,982,000
$410,122,000
$40,000
$0
$3,000,000
$22,462,000
108,802
18,236
A1
9.4%
3.3%
$5,705,672,883
40.71
$4,011,521,890
58.22
$232,261,000
98.5%
96.0%
$237,112,000
$156,592,000
$413,440,000
$0
$413,440,000
$174,838,000
$188,917,000
$363,755,000
$49,512,000
$413,267,000
$173,000
$0
$3,000,000
$19,635,000
$22,635,000
2016
108,272
18,383
A1
8.1%
2.9%
$5,554,511,500
42.58
$4,074,848,477
58.22
$236,493,000
98.4%
96.5%
$238,780,000
$156,610,000
$417,071,000
$0
$417,071,000
$178,411,000
$189,259,000
$367,670,000
$49,375,000
$417,045,000
$26,000
$0
$3,000,000
$19,661,000
$22,661,000
109,915
17,533
A1
12.9%
3.4%
2012
$6,105,411,822
36.13
$5,300,145,561
41.82
$220,594,000
96.8%
92.8%
$218,688,000
$160,695,000
$399,066,000
$0
$399,066,000
$175,180,000
$177,114,000
$352,294,000
$46,757,000
$399,051,000
$15,000
$0
$3,000,000
$22,401,000
Committed $0 $0
Nonspendable $0 $0 $18,000
$0
$19,383,000
$0
$0$0
$0
$19,462,000
Restricted
Assigned
Unassigned
$461,824,000
$47,226,000
$450,233,000
$47,194,000
Bonded Long-Term Debt
Annual Debt Service
$476,544,000
$46,172,000
$456,735,000
$46,104,000
$441,631,000
$46,661,000

WATERFORD
Bond Rating (Moody's, as of July 1)
Population (State Dept. of Public Health)
Equalized Net Grand List
Equalized Mill Rate
Mill Rate
Total Revenues
Intergovernmental Revenues
Current Year Collection %
Total Expenditures
Education Expenditures
Unemployment (Annual Average)
School Enrollment (State Education Dept.)
TANF Recipients (As a % of Population)
Total Fund Balance (Deficit)
Total Expenditures and Other Financing Uses
Total Revenues and Other Financing Sources
Grand List Data
Property Tax Collection Data
Property Tax Revenues
Net Change In Fund Balance
FISCAL YEARS ENDED 2012 TO 2016
Operating Expenditures
Current Year Adjusted Tax Levy
Net Grand List
Economic Data
Operating Results - General Fund
Fund Balance - General Fund
Total Taxes Collected as a % of Total Outstanding
D - 153
Total Transfers In From Other Funds
Debt Measures
Total Transfers Out To Other Funds
2015
19,505
3,014
Aa2
7.3%
0.3%
2013
$4,426,753,188
16.54
$3,712,635,087
19.77
$73,236,786
99.0%
97.9%
$73,303,784
$8,260,186
$84,376,189
$0
$84,376,189
$49,169,506
$31,721,695
$80,891,201
$2,556,748
$83,447,949
$928,240
$0
$568,685
$2,236,209
$11,838,734
2014
19,427
2,975
Aa2
5.9%
0.3%
$4,533,877,854
16.80
$3,173,071,768
24.05
$76,149,928
99.2%
98.0%
$76,355,601
$8,945,437
$88,233,247
$0
$88,233,247
$50,512,081
$33,937,945
$84,450,026
$2,676,001
$87,126,027
$1,107,220
$0
$496,774
$12,945,954
19,281
2,918
Aa2
5.1%
0.3%
$4,602,445,285
17.15
$3,197,421,928
24.80
$78,944,587
99.2%
98.1%
$78,906,899
$9,225,639
$90,488,494
$0
$101,300,115
$50,850,012
$36,652,800
$87,502,812
$5,357,624
$103,672,057
($2,371,942)
$0
$368,856
$10,138,379
$10,574,012
2016
19,101
2,902
Aa2
4.6%
0.3%
$4,639,975,435
17.57
$3,158,331,722
25.83
$81,543,116
99.2%
97.8%
$81,756,013
$8,196,982
$92,445,293
$0
$92,445,293
$50,785,687
$38,051,422
$88,837,109
$2,259,332
$91,096,441
$1,348,852
$0
$513,400
$10,948,107
$11,922,864
19,533
3,048
Aa2
7.8%
0.3%
2012
$4,640,714,679
14.92
$3,699,831,413
18.79
$69,258,247
99.0%
98.0%
$68,989,797
$7,847,691
$79,098,430
$0
$79,098,430
$47,785,199
$29,889,626
$77,674,825
$1,710,198
$79,385,023
($286,593)
$0
$533,283
$10,910,494
Committed $0 $0
Nonspendable $461,357 $66,777 $30,891
$9,454,871
$891,449
$8,990,627
$43,213$28,708
$10,436,689
$1,983,783
Restricted
Assigned
Unassigned
$94,885,000
$5,271,356
$85,715,000
$7,415,134
Bonded Long-Term Debt
Annual Debt Service
$49,890,000
$2,045,875
$81,625,000
$4,495,654
$90,145,000
$7,061,610

WATERTOWN
Bond Rating (Moody's, as of July 1)
Population (State Dept. of Public Health)
Equalized Net Grand List
Equalized Mill Rate
Mill Rate
Total Revenues
Intergovernmental Revenues
Current Year Collection %
Total Expenditures
Education Expenditures
Unemployment (Annual Average)
School Enrollment (State Education Dept.)
TANF Recipients (As a % of Population)
Total Fund Balance (Deficit)
Total Expenditures and Other Financing Uses
Total Revenues and Other Financing Sources
Grand List Data
Property Tax Collection Data
Property Tax Revenues
Net Change In Fund Balance
FISCAL YEARS ENDED 2012 TO 2016
Operating Expenditures
Current Year Adjusted Tax Levy
Net Grand List
Economic Data
Operating Results - General Fund
Fund Balance - General Fund
Total Taxes Collected as a % of Total Outstanding
D - 154
Total Transfers In From Other Funds
Debt Measures
Total Transfers Out To Other Funds
2015
22,228
3,040
Aa2
6.3%
0.4%
2013
$2,400,494,080
19.62
$1,941,581,278
24.23
$47,107,017
98.4%
97.3%
$47,229,837
$18,523,914
$68,260,379
$187,386
$78,570,807
$42,983,391
$26,238,644
$69,222,035
$284,300
$78,953,111
($382,304)
$0
$797,675
$5,574,608
$6,372,283
2014
22,046
2,940
Aa2
5.5%
0.4%
$2,460,853,869
19.99
$1,957,587,145
25.09
$49,196,092
98.6%
97.6%
$49,654,477
$18,760,371
$70,892,451
$130,787
$71,615,675
$43,236,872
$26,952,316
$70,189,188
$282,359
$70,471,547
$1,144,128
$0
$563,130
$7,516,411
21,911
2,870
Aa2
4.9%
0.3%
$2,456,280,339
20.44
$1,718,188,237
29.12
$50,217,165
98.6%
97.7%
$50,856,154
$18,117,139
$72,723,052
$43,579
$79,923,006
$44,456,479
$27,847,265
$72,303,744
$668,631
$79,580,022
$342,984
$0
$488,840
$7,370,555
$7,859,395
2016
21,790
2,830
Aa2
4.4%
0.3%
$2,612,679,887
20.11
$1,737,024,668
30.10
$52,529,932
98.6%
97.6%
$52,586,977
$19,352,704
$74,942,672
$33,031
$75,459,337
$45,068,233
$29,150,660
$74,218,893
$616,125
$74,835,018
$624,319
$0
$467,589
$8,016,125
$8,483,714
22,261
3,098
Aa2
7.0%
0.4%
2012
$2,560,355,224
17.53
$1,921,498,490
23.32
$44,879,018
98.5%
97.6%
$44,991,044
$18,470,161
$66,064,565
$280,908
$81,914,356
$39,592,522
$27,035,168
$66,627,690
$286,541
$81,583,574
$330,782
$0
$981,642
$6,754,587
Committed $0 $0
Nonspendable $0 $0 $0
$0
$5,772,945
$0
$0$0
$0
$6,953,281
Restricted
Assigned
Unassigned
$58,288,043
$6,857,649
$51,443,099
$6,948,972
Bonded Long-Term Debt
Annual Debt Service
$65,163,934
$7,345,894
$62,857,593
$6,811,471
$56,409,469
$7,016,270

WEST HARTFORD
Bond Rating (Moody's, as of July 1)
Population (State Dept. of Public Health)
Equalized Net Grand List
Equalized Mill Rate
Mill Rate
Total Revenues
Intergovernmental Revenues
Current Year Collection %
Total Expenditures
Education Expenditures
Unemployment (Annual Average)
School Enrollment (State Education Dept.)
TANF Recipients (As a % of Population)
Total Fund Balance (Deficit)
Total Expenditures and Other Financing Uses
Total Revenues and Other Financing Sources
Grand List Data
Property Tax Collection Data
Property Tax Revenues
Net Change In Fund Balance
FISCAL YEARS ENDED 2012 TO 2016
Operating Expenditures
Current Year Adjusted Tax Levy
Net Grand List
Economic Data
Operating Results - General Fund
Fund Balance - General Fund
Total Taxes Collected as a % of Total Outstanding
D - 155
Total Transfers In From Other Funds
Debt Measures
Total Transfers Out To Other Funds
2015
63,371
10,334
Aaa
5.5%
0.3%
2013
$8,400,921,331
25.01
$5,878,019,742
35.75
$210,066,000
99.1%
98.6%
$210,571,000
$39,853,000
$256,217,000
$790,000
$257,007,000
$155,074,000
$84,432,000
$239,506,000
$16,413,000
$255,919,000
$1,088,000
$0
$333,000
$18,931,000
$19,443,000
2014
63,324
10,297
Aaa
4.7%
0.4%
$9,035,908,810
23.72
$5,888,535,750
36.30
$214,310,000
99.2%
98.6%
$214,923,000
$43,115,000
$263,810,000
$849,000
$264,659,000
$160,266,000
$86,977,000
$247,243,000
$16,654,000
$263,897,000
$762,000
$0
$374,000
$20,205,000
63,053
10,252
Aaa
4.1%
0.3%
$9,156,172,567
24.27
$5,924,661,849
37.37
$222,213,000
99.2%
98.7%
$223,062,000
$41,016,000
$270,915,000
$922,000
$271,837,000
$162,477,000
$90,074,000
$252,551,000
$18,436,000
$270,987,000
$850,000
$0
$262,000
$20,621,000
$21,055,000
2016
62,903
10,132
Aaa
3.7%
0.3%
$9,323,512,094
24.57
$5,946,170,476
38.31
$229,112,000
99.3%
98.8%
$229,630,000
$44,086,000
$280,946,000
$928,000
$295,427,000
$167,362,000
$93,479,000
$260,841,000
$20,425,000
$294,690,000
$737,000
$0
$441,000
$21,094,000
$21,792,000
63,274
10,439
Aaa
6.0%
0.4%
2012
$7,244,491,864
27.50
$5,034,401,821
39.44
$199,192,000
99.1%
98.5%
$200,033,000
$46,477,000
$252,935,000
$994,000
$253,929,000
$149,600,000
$91,094,000
$240,694,000
$13,591,000
$254,285,000
($356,000)
$0
$355,000
$18,355,000
Committed $0 $0
Nonspendable $257,000 $172,000 $169,000
$0
$17,831,000
$0
$179,000$178,000
$0
$19,653,000
Restricted
Assigned
Unassigned
$140,830,000
$17,232,000
$148,675,000
$32,133,000
Bonded Long-Term Debt
Annual Debt Service
$145,620,000
$19,933,000
$133,085,000
$17,952,000
$149,280,000
$17,527,000

WEST HAVEN
Bond Rating (Moody's, as of July 1)
Population (State Dept. of Public Health)
Equalized Net Grand List
Equalized Mill Rate
Mill Rate
Total Revenues
Intergovernmental Revenues
Current Year Collection %
Total Expenditures
Education Expenditures
Unemployment (Annual Average)
School Enrollment (State Education Dept.)
TANF Recipients (As a % of Population)
Total Fund Balance (Deficit)
Total Expenditures and Other Financing Uses
Total Revenues and Other Financing Sources
Grand List Data
Property Tax Collection Data
Property Tax Revenues
Net Change In Fund Balance
FISCAL YEARS ENDED 2012 TO 2016
Operating Expenditures
Current Year Adjusted Tax Levy
Net Grand List
Economic Data
Operating Results - General Fund
Fund Balance - General Fund
Total Taxes Collected as a % of Total Outstanding
D - 156
Total Transfers In From Other Funds
Debt Measures
Total Transfers Out To Other Funds
2015
55,046
7,224
Baa1
9.5%
1.3%
2013
$3,861,225,600
22.82
$2,823,550,390
31.25
$88,111,713
98.1%
94.4%
$88,645,476
$62,176,447
$154,029,523
$2,178,416
$156,659,939
$89,015,764
$63,903,792
$152,919,556
$980,366
$153,899,922
$2,760,017
$0
$0
($13,313,968)
($7,776,649)
2014
54,905
7,195
Baa1
8.1%
1.3%
$3,920,079,059
22.55
$2,819,622,036
31.25
$88,395,137
98.1%
94.0%
$89,495,114
$65,232,537
$158,677,468
$2,150,518
$160,827,986
$95,107,522
$65,413,063
$160,520,585
$1,024,747
$161,545,332
($717,346)
$0
$0
($8,493,995)
54,927
7,081
Baa1
6.9%
1.2%
$3,840,876,745
23.08
$2,818,890,997
31.25
$88,651,979
98.4%
95.7%
$89,293,315
$66,698,261
$160,455,479
$1,460,977
$201,551,956
$96,506,345
$67,173,432
$163,679,777
$1,197,360
$203,255,058
($1,703,102)
$0
$0
($16,313,098)
($10,197,097)
2016
54,516
7,017
Baa1
6.0%
1.1%
$3,964,415,227
22.63
$2,853,371,008
31.25
$89,720,548
98.5%
96.4%
$90,455,343
$74,083,784
$168,760,901
$1,727,948
$170,903,849
$106,292,923
$66,576,556
$172,869,479
$4,573,337
$177,442,816
($6,538,967)
$0
$0
($16,888,415)
($16,736,064)
55,404
7,227
Baa1
10.3%
1.2%
2012
$4,014,297,653
21.91
$2,805,812,357
31.25
$87,970,800
97.9%
94.7%
$88,103,965
$58,881,010
$150,479,200
$2,450,915
$152,969,630
$89,048,477
$63,706,589
$152,755,066
$200,000
$152,955,066
$14,564
$0
$0
($10,536,666)
Committed $0 $0
Nonspendable $152,351 $6,116,001 $3,935,324
$0
($14,471,990)
$0
$5,537,319$1,760,849
$0
($10,254,844)
Restricted
Assigned
Unassigned
$141,191,281
$20,825,627
$120,367,619
$17,688,591
Bonded Long-Term Debt
Annual Debt Service
$132,379,860
$18,682,064
$149,188,976
$18,017,398
$133,230,703
$25,073,237

WESTBROOK
Bond Rating (Moody's, as of July 1)
Population (State Dept. of Public Health)
Equalized Net Grand List
Equalized Mill Rate
Mill Rate
Total Revenues
Intergovernmental Revenues
Current Year Collection %
Total Expenditures
Education Expenditures
Unemployment (Annual Average)
School Enrollment (State Education Dept.)
TANF Recipients (As a % of Population)
Total Fund Balance (Deficit)
Total Expenditures and Other Financing Uses
Total Revenues and Other Financing Sources
Grand List Data
Property Tax Collection Data
Property Tax Revenues
Net Change In Fund Balance
FISCAL YEARS ENDED 2012 TO 2016
Operating Expenditures
Current Year Adjusted Tax Levy
Net Grand List
Economic Data
Operating Results - General Fund
Fund Balance - General Fund
Total Taxes Collected as a % of Total Outstanding
D - 157
Total Transfers In From Other Funds
Debt Measures
Total Transfers Out To Other Funds
2015
6,906
889
Aa2
6.5%
0.1%
2013
$1,607,615,430
14.61
$1,124,402,551
20.98
$23,482,906
98.9%
97.7%
$23,608,365
$2,641,702
$27,461,153
$8,935
$27,470,088
$16,815,605
$10,483,096
$27,298,701
$398,970
$27,697,671
($227,583)
$0
$0
$3,714,727
$3,733,659
2014
6,902
852
Aa2
5.6%
0.1%
$1,628,977,476
14.59
$1,134,261,597
20.98
$23,762,610
99.0%
97.8%
$24,021,456
$3,070,160
$28,378,852
$4,109
$28,382,961
$17,868,817
$9,756,380
$27,625,197
$693,608
$28,318,805
$64,156
$0
$0
$3,797,815
6,902
818
Aa2
4.9%
0.1%
$1,867,531,995
13.36
$1,147,052,221
21.79
$24,955,043
99.1%
98.1%
$25,107,242
$3,016,078
$29,349,506
$0
$29,349,506
$17,767,390
$9,964,789
$27,732,179
$706,016
$28,438,195
$911,311
$0
$0
$4,190,266
$4,709,126
2016
6,933
783
Aa2
4.6%
0.1%
$1,714,853,284
15.15
$1,160,197,692
22.51
$25,987,148
99.4%
98.8%
$26,161,999
$3,085,411
$30,583,650
$0
$30,583,650
$19,167,229
$10,473,914
$29,641,143
$883,500
$30,524,643
$59,007
$0
$0
$4,252,045
$4,768,133
6,914
942
Aa2
7.2%
0.1%
2012
$1,699,819,090
13.33
$1,340,777,578
16.96
$22,650,090
98.7%
97.7%
$22,821,938
$3,067,410
$27,097,716
$437,501
$37,880,538
$15,984,126
$10,501,421
$26,485,547
$383,000
$37,092,677
$787,861
$0
$0
$3,961,242
Committed $500,000 $500,000
Nonspendable $16,088 $18,860 $10,167
$0
$3,951,075
$0
$18,932$789,391
$0
$3,008,424
Restricted
Assigned
Unassigned
$22,645,000
$2,504,301
$18,985,000
$2,516,025
Bonded Long-Term Debt
Annual Debt Service
$21,990,000
$3,888,993
$19,435,000
$3,277,809
$20,815,000
$2,579,082

WESTON
Bond Rating (Moody's, as of July 1)
Population (State Dept. of Public Health)
Equalized Net Grand List
Equalized Mill Rate
Mill Rate
Total Revenues
Intergovernmental Revenues
Current Year Collection %
Total Expenditures
Education Expenditures
Unemployment (Annual Average)
School Enrollment (State Education Dept.)
TANF Recipients (As a % of Population)
Total Fund Balance (Deficit)
Total Expenditures and Other Financing Uses
Total Revenues and Other Financing Sources
Grand List Data
Property Tax Collection Data
Property Tax Revenues
Net Change In Fund Balance
FISCAL YEARS ENDED 2012 TO 2016
Operating Expenditures
Current Year Adjusted Tax Levy
Net Grand List
Economic Data
Operating Results - General Fund
Fund Balance - General Fund
Total Taxes Collected as a % of Total Outstanding
D - 158
Total Transfers In From Other Funds
Debt Measures
Total Transfers Out To Other Funds
2015
10,372
2,421
Aaa
5.9%
0.0%
2013
$3,423,962,878
18.56
$2,654,820,848
24.02
$63,543,227
99.0%
98.1%
$63,966,155
$5,788,270
$71,254,107
$158,000
$71,412,107
$50,549,481
$18,003,723
$68,553,204
$2,331,119
$70,884,323
$527,784
$0
$253,312
$9,310,310
$11,406,272
2014
10,388
2,405
Aaa
5.0%
0.0%
$3,587,402,584
17.68
$2,660,640,912
23.89
$63,422,136
98.6%
97.4%
$63,361,808
$6,500,404
$71,705,555
$168,000
$71,873,555
$51,229,491
$18,253,968
$69,483,459
$1,368,386
$70,851,845
$1,021,710
$0
$554,753
$12,427,982
10,387
2,389
Aaa
4.3%
0.0%
$3,325,816,654
19.76
$2,328,033,052
28.24
$65,727,856
98.9%
97.2%
$66,047,652
$6,815,652
$74,483,789
$200,000
$74,683,789
$53,337,314
$18,630,725
$71,968,039
$1,767,424
$73,735,463
$948,326
$0
$690,389
$11,707,430
$13,376,308
2016
10,302
2,383
Aaa
4.0%
0.0%
$3,584,903,135
18.74
$2,341,794,069
28.67
$67,168,117
98.7%
96.6%
$66,993,811
$6,964,897
$75,755,510
$168,000
$76,404,790
$55,344,610
$18,914,712
$74,259,322
$1,522,119
$75,781,441
$623,349
$0
$148,347
$12,511,772
$13,811,128
10,350
2,485
Aaa
6.1%
0.1%
2012
$3,614,143,912
17.41
$2,635,349,349
23.93
$62,936,877
98.9%
97.8%
$63,176,813
$5,694,609
$71,011,083
$107,000
$73,944,144
$50,570,007
$17,929,633
$68,499,640
$1,569,966
$72,855,107
$1,089,037
$0
$460,884
$10,878,488
Committed $544,403 $329,500
Nonspendable $606,606 $648,989 $757,209
$775,424
$8,884,971
$419,229
$1,423,421$846,156
$329,500
$10,697,573
Restricted
Assigned
Unassigned
$48,158,537
$6,554,632
$39,420,291
$6,390,963
Bonded Long-Term Debt
Annual Debt Service
$56,732,417
$6,748,200
$52,283,007
$6,772,976
$43,672,273
$6,487,869

WESTPORT
Bond Rating (Moody's, as of July 1)
Population (State Dept. of Public Health)
Equalized Net Grand List
Equalized Mill Rate
Mill Rate
Total Revenues
Intergovernmental Revenues
Current Year Collection %
Total Expenditures
Education Expenditures
Unemployment (Annual Average)
School Enrollment (State Education Dept.)
TANF Recipients (As a % of Population)
Total Fund Balance (Deficit)
Total Expenditures and Other Financing Uses
Total Revenues and Other Financing Sources
Grand List Data
Property Tax Collection Data
Property Tax Revenues
Net Change In Fund Balance
FISCAL YEARS ENDED 2012 TO 2016
Operating Expenditures
Current Year Adjusted Tax Levy
Net Grand List
Economic Data
Operating Results - General Fund
Fund Balance - General Fund
Total Taxes Collected as a % of Total Outstanding
D - 159
Total Transfers In From Other Funds
Debt Measures
Total Transfers Out To Other Funds
2015
27,308
5,762
Aaa
5.9%
0.1%
2013
$14,306,009,245
12.06
$9,647,133,363
17.91
$172,477,712
98.3%
93.9%
$173,863,514
$4,478,950
$205,384,384
$564,729
$238,161,472
$115,994,712
$83,636,203
$199,630,915
$938,764
$232,414,451
$5,747,021
$280,679
$6,660,518
$26,158,189
$33,535,432
2014
27,561
5,746
Aaa
5.0%
0.1%
$14,803,064,448
11.97
$9,799,546,479
18.07
$177,158,678
98.5%
94.2%
$178,097,978
$4,098,193
$212,309,371
$483,039
$212,792,410
$121,252,479
$87,786,941
$209,039,420
$1,400,790
$210,440,210
$2,352,200
$274,652
$9,189,698
$35,887,632
27,899
5,716
Aaa
4.2%
0.0%
$16,108,614,141
11.09
$9,938,196,216
17.94
$178,586,782
98.3%
93.9%
$179,504,226
$4,106,375
$215,303,240
$363,039
$215,666,279
$125,459,324
$88,654,252
$214,113,576
$1,624,162
$215,737,738
($71,459)
$411,931
$9,840,556
$24,785,716
$35,816,173
2016
27,840
5,717
Aaa
3.7%
0.1%
$16,602,814,905
11.01
$10,089,688,656
18.09
$182,788,558
98.7%
94.5%
$185,227,581
$3,565,024
$219,101,390
$437,039
$228,547,692
$126,750,713
$87,792,385
$214,543,098
$2,113,802
$225,463,110
$3,084,582
$491,129
$10,114,752
$27,518,345
$38,900,755
27,068
5,721
Aaa
6.2%
0.1%
2012
$13,636,314,583
12.18
$9,545,029,208
17.43
$166,067,052
97.9%
93.6%
$165,268,513
$4,305,131
$196,640,642
$408,000
$212,401,452
$113,131,404
$85,351,670
$198,483,074
$434,425
$214,119,007
($1,717,555)
$232,935
$6,647,675
$27,788,411
Committed $372,382 $419,970
Nonspendable $404,147 $358,000 $0
$394,952
$20,512,849
$436,046
$0$0
$290,922
$26,132,360
Restricted
Assigned
Unassigned
$121,612,981
$17,473,798
$100,942,368
$17,184,778
Bonded Long-Term Debt
Annual Debt Service
$142,625,922
$19,086,793
$134,649,531
$18,314,630
$108,845,766
$17,104,607

WETHERSFIELD
Bond Rating (Moody's, as of July 1)
Population (State Dept. of Public Health)
Equalized Net Grand List
Equalized Mill Rate
Mill Rate
Total Revenues
Intergovernmental Revenues
Current Year Collection %
Total Expenditures
Education Expenditures
Unemployment (Annual Average)
School Enrollment (State Education Dept.)
TANF Recipients (As a % of Population)
Total Fund Balance (Deficit)
Total Expenditures and Other Financing Uses
Total Revenues and Other Financing Sources
Grand List Data
Property Tax Collection Data
Property Tax Revenues
Net Change In Fund Balance
FISCAL YEARS ENDED 2012 TO 2016
Operating Expenditures
Current Year Adjusted Tax Levy
Net Grand List
Economic Data
Operating Results - General Fund
Fund Balance - General Fund
Total Taxes Collected as a % of Total Outstanding
D - 160
Total Transfers In From Other Funds
Debt Measures
Total Transfers Out To Other Funds
2015
26,510
3,878
Aa2
6.5%
0.2%
2013
$3,146,435,531
24.07
$2,329,645,400
32.58
$75,725,740
99.0%
97.1%
$75,019,911
$16,262,260
$93,202,556
$50,000
$99,971,676
$58,303,580
$32,878,755
$91,182,335
$1,842,525
$99,635,539
$336,137
$0
$796,624
$9,311,165
$10,481,582
2014
26,446
3,921
Aa2
5.7%
0.2%
$3,147,128,675
24.82
$2,335,601,900
33.46
$78,123,896
99.0%
97.4%
$78,321,007
$17,339,290
$97,817,583
$123,429
$97,941,012
$60,950,236
$33,398,573
$94,348,809
$2,285,085
$96,633,894
$1,307,118
$0
$1,126,833
$11,788,700
26,367
3,933
Aa2
4.9%
0.3%
$3,153,114,691
25.65
$2,205,813,324
36.74
$80,862,756
99.1%
97.8%
$80,702,609
$16,368,042
$99,119,001
$90,000
$99,209,001
$61,943,559
$34,700,867
$96,644,426
$2,721,597
$99,366,023
($157,022)
$0
$517,910
$10,725,165
$11,631,678
2016
26,195
3,971
Aa2
4.5%
0.2%
$3,104,460,582
27.16
$2,213,400,730
38.19
$84,329,250
99.1%
97.7%
$83,457,895
$17,549,567
$103,830,445
$90,000
$103,920,445
$64,994,570
$36,017,433
$101,012,003
$2,707,239
$103,719,242
$201,203
$0
$481,480
$10,910,168
$11,832,881
26,710
3,857
Aa2
7.1%
0.2%
2012
$3,128,048,308
23.20
$2,314,769,170
31.42
$72,558,938
98.9%
97.1%
$72,867,903
$16,674,045
$91,040,488
$672,465
$91,712,953
$55,269,575
$32,735,912
$88,005,487
$3,356,751
$91,362,238
$350,715
$0
$829,460
$10,145,445
Committed $441,233 $388,603
Nonspendable $0 $0 $0
$405,817
$8,910,168
$373,793
$0$0
$414,179
$10,247,688
Restricted
Assigned
Unassigned
$27,005,052
$3,647,328
$54,535,886
$5,191,229
Bonded Long-Term Debt
Annual Debt Service
$28,537,453
$4,284,890
$26,137,658
$4,372,005
$46,843,060
$4,313,034

WILLINGTON
Bond Rating (Moody's, as of July 1)
Population (State Dept. of Public Health)
Equalized Net Grand List
Equalized Mill Rate
Mill Rate
Total Revenues
Intergovernmental Revenues
Current Year Collection %
Total Expenditures
Education Expenditures
Unemployment (Annual Average)
School Enrollment (State Education Dept.)
TANF Recipients (As a % of Population)
Total Fund Balance (Deficit)
Total Expenditures and Other Financing Uses
Total Revenues and Other Financing Sources
Grand List Data
Property Tax Collection Data
Property Tax Revenues
Net Change In Fund Balance
FISCAL YEARS ENDED 2012 TO 2016
Operating Expenditures
Current Year Adjusted Tax Levy
Net Grand List
Economic Data
Operating Results - General Fund
Fund Balance - General Fund
Total Taxes Collected as a % of Total Outstanding
D - 161
Total Transfers In From Other Funds
Debt Measures
Total Transfers Out To Other Funds
2015
5,965
738
Aa3
5.7%
0.4%
2013
$599,333,683
19.21
$479,079,625
23.96
$11,514,988
99.7%
99.5%
$11,633,950
$4,980,306
$16,807,054
$0
$16,807,054
$12,924,389
$3,057,809
$15,982,198
$796,430
$16,778,628
$28,426
$0
$454,926
$1,946,688
$2,910,870
2014
5,934
710
Aa3
5.2%
0.3%
$629,316,327
18.67
$479,609,789
24.38
$11,748,116
99.3%
99.1%
$11,710,518
$5,137,701
$17,098,266
$0
$17,391,708
$12,886,316
$3,300,051
$16,186,367
$1,034,162
$17,220,529
$171,179
$208,124
$459,175
$3,082,049
5,908
678
Aa3
4.3%
0.2%
$619,774,907
19.28
$433,789,804
27.34
$11,948,410
99.6%
99.4%
$11,995,834
$5,157,470
$17,370,803
$0
$17,532,389
$12,994,977
$3,663,122
$16,658,099
$1,245,719
$17,903,818
($371,429)
$208,124
$342,097
$1,588,620
$2,710,620
2016
5,872
673
Aa3
3.9%
0.2%
$615,677,862
19.61
$439,156,890
27.34
$12,072,954
99.6%
99.2%
$12,147,592
$5,047,739
$17,474,206
$0
$18,299,081
$12,973,852
$4,170,938
$17,144,790
$971,089
$18,115,879
$183,202
$0
$401,335
$1,966,148
$2,893,822
5,994
791
Aa3
6.4%
0.4%
2012
$654,109,289
17.15
$474,899,858
23.58
$11,219,031
99.4%
99.0%
$11,325,330
$5,042,271
$16,652,528
$0
$16,669,328
$12,568,247
$3,325,086
$15,893,333
$387,566
$16,280,899
$388,429
$0
$448,670
$2,882,444
Committed $526,339 $571,779
Nonspendable $0 $0 $0
$557,088
$1,876,686
$509,256
$0$0
$468,486
$1,946,264
Restricted
Assigned
Unassigned
$4,406,855
$352,838
$3,730,546
$505,887
Bonded Long-Term Debt
Annual Debt Service
$5,824,821
$478,371
$5,090,372
$401,315
$3,799,096
$396,872

WILTON
Bond Rating (Moody's, as of July 1)
Population (State Dept. of Public Health)
Equalized Net Grand List
Equalized Mill Rate
Mill Rate
Total Revenues
Intergovernmental Revenues
Current Year Collection %
Total Expenditures
Education Expenditures
Unemployment (Annual Average)
School Enrollment (State Education Dept.)
TANF Recipients (As a % of Population)
Total Fund Balance (Deficit)
Total Expenditures and Other Financing Uses
Total Revenues and Other Financing Sources
Grand List Data
Property Tax Collection Data
Property Tax Revenues
Net Change In Fund Balance
FISCAL YEARS ENDED 2012 TO 2016
Operating Expenditures
Current Year Adjusted Tax Levy
Net Grand List
Economic Data
Operating Results - General Fund
Fund Balance - General Fund
Total Taxes Collected as a % of Total Outstanding
D - 162
Total Transfers In From Other Funds
Debt Measures
Total Transfers Out To Other Funds
2015
18,657
4,297
Aaa
5.6%
0.0%
2013
$6,134,734,484
17.46
$5,112,946,800
21.06
$107,138,324
99.2%
98.1%
$107,158,963
$11,311,495
$120,895,615
$0
$121,360,369
$82,539,363
$39,054,005
$121,593,368
$311,551
$121,904,919
($544,550)
$0
$5,627,533
$14,718,189
$20,648,440
2014
18,692
4,313
Aaa
4.6%
0.0%
$6,054,409,014
18.12
$4,237,894,310
25.99
$109,682,703
99.4%
98.4%
$110,433,298
$13,140,788
$126,110,106
$0
$126,110,106
$85,352,764
$39,143,531
$124,496,295
$125,995
$124,622,290
$1,487,816
$0
$3,619,058
$22,136,256
18,714
4,269
Aaa
4.1%
0.0%
$6,802,945,694
16.57
$4,265,632,050
26.51
$112,749,790
99.3%
98.4%
$112,997,545
$11,115,023
$126,761,675
$0
$136,885,709
$86,677,283
$39,998,509
$126,675,792
$410,976
$136,240,946
$644,763
$0
$6,359,222
$15,326,862
$22,781,019
2016
18,560
4,155
Aaa
3.9%
0.0%
$6,535,481,935
17.60
$4,296,191,050
26.83
$115,047,609
99.3%
98.2%
$115,159,880
$11,964,934
$130,646,516
$0
$130,646,516
$89,568,730
$41,083,848
$130,652,578
$1,013,042
$131,665,620
($1,019,104)
$0
$4,513,735
$15,889,294
$21,761,915
18,617
4,310
Aaa
5.9%
0.0%
2012
$6,346,437,727
16.47
$5,081,605,300
20.85
$104,546,443
99.2%
98.2%
$105,831,966
$11,141,142
$119,238,013
$815,681
$120,465,713
$80,058,760
$37,937,871
$117,996,631
$212,589
$118,209,220
$2,256,493
$0
$4,861,264
$21,192,990
Committed $1,252,447 $1,002,447
Nonspendable $106,439 $92,488 $57,478
$0
$16,274,248
$223,735
$78,983$55,107
$760,026
$17,702,065
Restricted
Assigned
Unassigned
$59,241,326
$9,120,335
$83,700,219
$10,784,705
Bonded Long-Term Debt
Annual Debt Service
$60,001,969
$8,691,039
$61,363,610
$9,013,918
$74,505,725
$9,083,680

WINCHESTER
Bond Rating (Moody's, as of July 1)
Population (State Dept. of Public Health)
Equalized Net Grand List
Equalized Mill Rate
Mill Rate
Total Revenues
Intergovernmental Revenues
Current Year Collection %
Total Expenditures
Education Expenditures
Unemployment (Annual Average)
School Enrollment (State Education Dept.)
TANF Recipients (As a % of Population)
Total Fund Balance (Deficit)
Total Expenditures and Other Financing Uses
Total Revenues and Other Financing Sources
Grand List Data
Property Tax Collection Data
Property Tax Revenues
Net Change In Fund Balance
FISCAL YEARS ENDED 2012 TO 2016
Operating Expenditures
Current Year Adjusted Tax Levy
Net Grand List
Economic Data
Operating Results - General Fund
Fund Balance - General Fund
Total Taxes Collected as a % of Total Outstanding
D - 163
Total Transfers In From Other Funds
Debt Measures
Total Transfers Out To Other Funds
2015
11,013
1,301
8.7%
0.8%
2013
$976,395,144
21.32
$818,214,774
25.43
$20,812,765
97.6%
96.7%
$20,900,669
$9,857,387
$31,235,493
$3
$31,235,496
$20,997,178
$9,638,428
$30,635,606
$310,599
$30,946,205
$218,584
$0
$0
($1,205,348)
($1,205,348)
2014
10,929
1,263
7.2%
1.0%
$983,598,186
24.03
$688,379,460
31.20
$23,634,868
97.4%
96.5%
$23,758,932
$11,021,018
$36,816,762
$41,040
$38,857,802
$21,815,738
$10,133,051
$31,948,789
$836,314
$34,785,103
$4,072,699
$0
$0
$3,526,109
10,829
1,218
6.0%
0.9%
$956,082,771
23.08
$690,947,171
31.91
$22,065,050
97.0%
95.8%
$22,479,091
$10,670,631
$34,216,964
$39,874
$34,256,838
$21,792,130
$9,983,625
$31,775,755
$732,117
$32,507,872
$1,748,966
$0
$0
$5,163,031
$5,163,031
2016
10,754
1,186
5.3%
0.7%
$931,621,000
24.32
$692,625,587
32.70
$22,653,061
98.1%
97.5%
$22,967,681
$10,841,687
$34,659,810
$39,080
$34,698,890
$22,235,653
$10,816,424
$33,052,077
$635,333
$33,687,410
$1,011,480
$0
$0
$5,724,511
$6,174,511
11,071
1,342
9.2%
0.9%
2012
$1,032,016,716
20.04
$813,012,563
25.43
$20,684,500
97.8%
96.5%
$20,667,970
$10,786,092
$31,961,662
$94,508
$32,056,170
$20,783,947
$11,624,220
$32,408,167
$211,048
$32,619,215
($965,023)
$0
$0
($1,423,932)
Committed $450,000 $0
Nonspendable $0 $0 $3,050
$0
($1,426,982)
$0
$0$0
$0
$3,526,109
Restricted
Assigned
Unassigned
$4,405,047
$728,831
$3,469,894
$724,522
Bonded Long-Term Debt
Annual Debt Service
$5,458,092
$778,484
$4,865,856
$710,821
$3,902,779
$701,892

WINDHAM
Bond Rating (Moody's, as of July 1)
Population (State Dept. of Public Health)
Equalized Net Grand List
Equalized Mill Rate
Mill Rate
Total Revenues
Intergovernmental Revenues
Current Year Collection %
Total Expenditures
Education Expenditures
Unemployment (Annual Average)
School Enrollment (State Education Dept.)
TANF Recipients (As a % of Population)
Total Fund Balance (Deficit)
Total Expenditures and Other Financing Uses
Total Revenues and Other Financing Sources
Grand List Data
Property Tax Collection Data
Property Tax Revenues
Net Change In Fund Balance
FISCAL YEARS ENDED 2012 TO 2016
Operating Expenditures
Current Year Adjusted Tax Levy
Net Grand List
Economic Data
Operating Results - General Fund
Fund Balance - General Fund
Total Taxes Collected as a % of Total Outstanding
D - 164
Total Transfers In From Other Funds
Debt Measures
Total Transfers Out To Other Funds
2015
25,213
3,255
Aa3
10.0%
2.7%
2013
$1,205,543,088
26.89
$947,434,595
28.63
$32,411,684
97.8%
97.2%
$32,599,107
$36,815,328
$72,801,357
$238,724
$73,040,081
$48,653,356
$22,637,285
$71,290,641
$782,119
$72,072,760
$967,321
$520,331
$542,260
$10,109,251
$11,425,751
2014
25,005
3,261
Aa3
8.4%
2.9%
$1,191,547,481
28.07
$962,400,175
29.06
$33,441,340
98.0%
97.3%
$33,826,651
$37,271,487
$74,574,235
$239,683
$74,813,918
$49,414,612
$23,599,459
$73,014,071
$535,000
$73,549,071
$1,264,847
$587,352
$898,389
$12,690,598
24,799
3,133
Aa3
7.1%
2.4%
$1,231,071,101
27.02
$861,229,521
32.41
$33,259,244
97.7%
96.7%
$33,313,631
$36,520,351
$72,888,188
$249,494
$73,137,682
$48,972,918
$23,822,231
$72,795,149
$131,606
$72,926,755
$210,927
$654,380
$676,980
$11,453,914
$12,901,525
2016
24,727
3,207
Aa3
6.1%
1.8%
$1,256,841,394
28.30
$877,917,109
34.35
$35,573,741
98.8%
98.2%
$35,834,457
$36,765,536
$75,641,325
$250,887
$75,892,212
$50,733,767
$25,618,606
$76,352,373
$2,105,000
$78,457,373
($2,565,161)
$722,080
$0
$9,495,320
$10,336,364
25,091
3,263
Aa3
10.6%
2.8%
2012
$1,468,464,619
21.32
$935,162,574
28.15
$31,309,499
97.7%
96.1%
$31,383,589
$36,112,329
$70,098,853
$330,569
$70,429,422
$47,650,608
$20,710,546
$68,361,154
$992,001
$69,353,155
$1,076,267
$453,283
$612,761
$10,458,430
Committed $0 $0
Nonspendable $118,964 $116,251 $109,026
$822,457
$8,460,903
$142,165
$111,744$112,351
$0
$11,092,506
Restricted
Assigned
Unassigned
$22,157,772
$3,331,914
$16,736,500
$3,596,130
Bonded Long-Term Debt
Annual Debt Service
$21,096,595
$2,808,518
$18,586,944
$3,578,800
$22,393,869
$3,366,394

WINDSOR
Bond Rating (Moody's, as of July 1)
Population (State Dept. of Public Health)
Equalized Net Grand List
Equalized Mill Rate
Mill Rate
Total Revenues
Intergovernmental Revenues
Current Year Collection %
Total Expenditures
Education Expenditures
Unemployment (Annual Average)
School Enrollment (State Education Dept.)
TANF Recipients (As a % of Population)
Total Fund Balance (Deficit)
Total Expenditures and Other Financing Uses
Total Revenues and Other Financing Sources
Grand List Data
Property Tax Collection Data
Property Tax Revenues
Net Change In Fund Balance
FISCAL YEARS ENDED 2012 TO 2016
Operating Expenditures
Current Year Adjusted Tax Levy
Net Grand List
Economic Data
Operating Results - General Fund
Fund Balance - General Fund
Total Taxes Collected as a % of Total Outstanding
D - 165
Total Transfers In From Other Funds
Debt Measures
Total Transfers Out To Other Funds
2015
29,142
4,020
Aa1
7.6%
0.6%
2013
$4,026,157,221
20.22
$2,907,640,693
27.95
$81,403,784
98.7%
98.3%
$82,159,015
$21,410,871
$108,233,721
$105,150
$108,338,871
$68,251,357
$31,560,801
$99,812,158
$6,219,500
$106,031,658
$2,307,213
$0
$3,939,957
$16,928,714
$20,911,350
2014
29,069
3,936
Aa1
6.4%
0.6%
$4,026,160,993
20.60
$3,014,228,046
27.33
$82,919,994
98.6%
97.8%
$82,937,213
$22,298,413
$110,221,210
$95,510
$110,316,720
$70,387,913
$32,826,327
$103,214,240
$6,824,000
$110,038,240
$278,480
$0
$3,795,689
$21,189,830
29,016
3,889
5.5%
0.6%
$4,047,961,669
21.38
$2,831,162,216
30.47
$86,548,952
98.8%
98.4%
$87,600,034
$22,366,478
$114,937,769
$99,540
$115,037,309
$72,051,878
$32,731,619
$104,783,497
$7,816,760
$112,600,257
$2,437,052
$0
$4,621,032
$18,974,637
$23,626,882
2016
28,875
3,937
4.9%
0.6%
$4,259,039,357
20.85
$2,849,933,303
30.92
$88,799,152
98.8%
98.2%
$89,012,808
$21,906,514
$114,990,555
$78,508
$115,069,063
$72,839,199
$33,748,611
$106,587,810
$7,715,704
$114,303,514
$765,549
$0
$4,727,980
$19,642,852
$24,392,431
29,140
4,074
Aa1
8.1%
0.6%
2012
$4,003,835,033
19.78
$2,841,048,444
28.03
$79,201,381
98.8%
98.0%
$79,806,333
$21,115,541
$104,442,171
$903,038
$105,345,209
$67,390,801
$30,523,019
$97,913,820
$7,196,210
$105,110,030
$235,179
$0
$3,238,973
$18,604,137
Committed $0 $0
Nonspendable $21,599 $31,213 $48,934
$0
$15,316,230
$0
$42,679$46,154
$0
$17,347,987
Restricted
Assigned
Unassigned
$39,390,000
$6,135,301
$38,520,000
$6,672,435
Bonded Long-Term Debt
Annual Debt Service
$38,470,000
$5,925,093
$39,140,000
$5,726,409
$39,765,000
$6,201,403

WINDSOR LOCKS
Bond Rating (Moody's, as of July 1)
Population (State Dept. of Public Health)
Equalized Net Grand List
Equalized Mill Rate
Mill Rate
Total Revenues
Intergovernmental Revenues
Current Year Collection %
Total Expenditures
Education Expenditures
Unemployment (Annual Average)
School Enrollment (State Education Dept.)
TANF Recipients (As a % of Population)
Total Fund Balance (Deficit)
Total Expenditures and Other Financing Uses
Total Revenues and Other Financing Sources
Grand List Data
Property Tax Collection Data
Property Tax Revenues
Net Change In Fund Balance
FISCAL YEARS ENDED 2012 TO 2016
Operating Expenditures
Current Year Adjusted Tax Levy
Net Grand List
Economic Data
Operating Results - General Fund
Fund Balance - General Fund
Total Taxes Collected as a % of Total Outstanding
D - 166
Total Transfers In From Other Funds
Debt Measures
Total Transfers Out To Other Funds
2015
12,573
1,835
Aa1
7.4%
0.7%
2013
$1,598,600,472
19.58
$1,153,481,514
24.27
$31,295,874
97.9%
95.2%
$31,479,654
$15,521,733
$47,899,212
$133,209
$48,032,421
$31,350,999
$14,331,292
$45,682,291
$685,283
$46,367,574
$1,664,847
$0
$1,084,965
$10,200,012
$11,284,977
2014
12,565
1,783
Aa1
6.3%
0.6%
$1,833,714,636
17.62
$1,269,830,949
24.54
$32,306,689
98.1%
96.2%
$32,868,278
$15,923,535
$50,171,300
$133,196
$50,442,634
$32,609,424
$15,383,898
$47,993,322
$1,223,490
$49,216,812
$1,225,822
$0
$636,260
$12,510,799
12,537
1,715
Aa1
5.5%
0.6%
$1,741,395,744
18.70
$1,218,347,021
26.23
$32,568,005
98.2%
96.8%
$33,342,550
$14,563,701
$49,251,423
$164,344
$56,398,927
$32,258,906
$15,851,068
$48,109,974
$1,443,944
$56,443,133
($44,206)
$0
$1,642,681
$10,823,912
$12,466,593
2016
12,512
1,703
Aa1
5.2%
0.4%
$1,699,667,421
19.34
$1,177,295,207
26.79
$32,876,532
98.3%
96.5%
$33,011,198
$14,887,378
$49,450,604
$165,437
$50,137,084
$33,117,510
$14,987,266
$48,104,776
$1,442,270
$49,547,046
$590,038
$0
$1,026,584
$12,030,047
$13,056,631
12,546
1,861
Aa1
8.0%
0.6%
2012
$1,686,160,158
17.61
$1,247,545,501
23.40
$29,699,635
97.8%
95.4%
$29,941,636
$16,318,822
$47,322,569
$131,912
$47,454,481
$30,503,362
$15,864,243
$46,367,605
$615,700
$46,983,305
$471,176
$0
$151,165
$9,620,130
Committed $0 $0
Nonspendable $0 $0 $0
$0
$9,468,965
$0
$0$0
$0
$11,874,539
Restricted
Assigned
Unassigned
$15,118,102
$2,485,907
$21,075,002
$2,708,314
Bonded Long-Term Debt
Annual Debt Service
$13,881,968
$2,516,127
$12,079,464
$2,377,967
$13,896,565
$2,809,443

WOLCOTT
Bond Rating (Moody's, as of July 1)
Population (State Dept. of Public Health)
Equalized Net Grand List
Equalized Mill Rate
Mill Rate
Total Revenues
Intergovernmental Revenues
Current Year Collection %
Total Expenditures
Education Expenditures
Unemployment (Annual Average)
School Enrollment (State Education Dept.)
TANF Recipients (As a % of Population)
Total Fund Balance (Deficit)
Total Expenditures and Other Financing Uses
Total Revenues and Other Financing Sources
Grand List Data
Property Tax Collection Data
Property Tax Revenues
Net Change In Fund Balance
FISCAL YEARS ENDED 2012 TO 2016
Operating Expenditures
Current Year Adjusted Tax Levy
Net Grand List
Economic Data
Operating Results - General Fund
Fund Balance - General Fund
Total Taxes Collected as a % of Total Outstanding
D - 167
Total Transfers In From Other Funds
Debt Measures
Total Transfers Out To Other Funds
2015
16,725
2,812
A1
6.6%
0.3%
2013
$1,794,715,471
17.72
$1,254,860,310
25.27
$31,801,822
98.2%
97.3%
$32,153,900
$20,168,083
$53,109,249
$582,347
$54,113,426
$36,419,835
$17,044,258
$53,464,093
$276,000
$53,740,093
$373,333
$0
$183,534
$2,911,362
$3,094,896
2014
16,716
2,720
A1
5.4%
0.3%
$1,846,423,677
17.72
$1,257,541,104
25.91
$32,715,206
98.2%
97.3%
$32,875,640
$20,711,146
$54,641,282
$712,518
$55,561,005
$37,034,923
$18,014,010
$55,048,933
$54,569
$55,103,502
$457,503
$0
$102,984
$3,552,399
16,673
2,586
A1
4.7%
0.2%
$1,809,585,593
19.10
$1,265,322,865
27.17
$34,555,784
98.2%
97.1%
$34,705,469
$20,699,671
$56,261,679
$508,980
$61,335,472
$37,739,030
$18,511,524
$56,250,554
$415,000
$61,075,374
$260,098
$0
$56,882
$3,755,615
$3,812,497
2016
16,643
2,547
A1
4.3%
0.1%
$1,821,732,370
19.71
$1,271,057,987
28.08
$35,905,630
98.1%
96.8%
$35,996,804
$20,092,505
$57,021,088
$685,917
$58,530,775
$37,563,529
$20,263,298
$57,826,827
$70,000
$57,896,827
$633,948
$0
$140,367
$4,306,078
$4,446,445
16,724
2,908
A1
7.5%
0.3%
2012
$1,999,758,230
15.49
$1,363,377,222
22.68
$30,979,059
98.0%
97.0%
$31,276,936
$19,263,593
$51,428,413
$991,110
$53,093,987
$35,565,637
$17,168,159
$52,733,796
$136,000
$52,869,796
$224,191
$0
$178,564
$2,721,563
Committed $0 $0
Nonspendable $0 $0 $0
$0
$2,542,999
$0
$0$0
$0
$3,449,415
Restricted
Assigned
Unassigned
$30,121,645
$3,956,037
$28,837,441
$4,509,191
Bonded Long-Term Debt
Annual Debt Service
$28,835,177
$3,336,427
$26,042,314
$4,040,692
$26,770,205
$3,705,548

WOODBRIDGE
Bond Rating (Moody's, as of July 1)
Population (State Dept. of Public Health)
Equalized Net Grand List
Equalized Mill Rate
Mill Rate
Total Revenues
Intergovernmental Revenues
Current Year Collection %
Total Expenditures
Education Expenditures
Unemployment (Annual Average)
School Enrollment (State Education Dept.)
TANF Recipients (As a % of Population)
Total Fund Balance (Deficit)
Total Expenditures and Other Financing Uses
Total Revenues and Other Financing Sources
Grand List Data
Property Tax Collection Data
Property Tax Revenues
Net Change In Fund Balance
FISCAL YEARS ENDED 2012 TO 2016
Operating Expenditures
Current Year Adjusted Tax Levy
Net Grand List
Economic Data
Operating Results - General Fund
Fund Balance - General Fund
Total Taxes Collected as a % of Total Outstanding
D - 168
Total Transfers In From Other Funds
Debt Measures
Total Transfers Out To Other Funds
2015
8,955
1,464
Aaa
5.0%
0.1%
2013
$1,631,618,463
24.79
$1,197,919,870
33.73
$40,442,516
99.5%
99.4%
$41,016,791
$2,939,803
$46,986,688
$12,872
$46,999,560
$26,719,822
$18,432,058
$45,151,880
$1,762,574
$46,914,454
$85,106
$0
$1,194,160
$4,821,442
$6,050,372
2014
8,925
1,484
Aaa
4.2%
0.1%
$1,693,844,166
24.24
$1,201,171,700
34.14
$41,057,655
99.6%
99.4%
$41,484,475
$2,753,321
$46,852,591
$334,298
$47,186,889
$27,642,754
$17,600,169
$45,242,923
$2,064,286
$47,307,209
($120,320)
$0
$1,360,507
$5,930,052
8,886
1,497
Aaa
3.9%
0.1%
$1,640,624,009
25.69
$1,202,451,150
34.97
$42,152,886
99.6%
99.5%
$42,721,174
$2,789,596
$47,643,390
$26,928
$47,670,318
$28,571,588
$17,411,272
$45,982,860
$1,951,064
$47,933,924
($263,606)
$0
$989,289
$4,591,338
$5,666,446
2016
8,842
1,488
Aaa
3.4%
0.2%
$1,637,008,171
26.23
$1,145,716,220
37.66
$42,933,994
99.6%
99.6%
$43,412,488
$2,769,051
$48,957,985
$0
$56,139,960
$29,222,217
$18,479,021
$47,701,238
$1,409,273
$55,419,699
$720,261
$0
$1,435,596
$4,867,473
$6,386,707
8,965
1,487
Aaa
4.9%
0.2%
2012
$1,643,255,100
23.95
$1,188,913,710
33.08
$39,352,844
99.6%
99.2%
$39,924,202
$2,628,553
$44,568,176
$129,252
$44,697,428
$26,627,017
$16,294,708
$42,921,725
$1,332,098
$44,253,823
$443,605
$0
$1,001,915
$5,965,266
Committed $0 $0
Nonspendable $83,638 $85,819 $33,521
$0
$4,929,830
$0
$34,770$85,502
$0
$4,484,043
Restricted
Assigned
Unassigned
$26,680,971
$2,104,680
$31,367,122
$7,936,071
Bonded Long-Term Debt
Annual Debt Service
$27,742,058
$2,263,410
$24,584,359
$2,299,623
$29,408,499
$2,167,368

WOODBURY
Bond Rating (Moody's, as of July 1)
Population (State Dept. of Public Health)
Equalized Net Grand List
Equalized Mill Rate
Mill Rate
Total Revenues
Intergovernmental Revenues
Current Year Collection %
Total Expenditures
Education Expenditures
Unemployment (Annual Average)
School Enrollment (State Education Dept.)
TANF Recipients (As a % of Population)
Total Fund Balance (Deficit)
Total Expenditures and Other Financing Uses
Total Revenues and Other Financing Sources
Grand List Data
Property Tax Collection Data
Property Tax Revenues
Net Change In Fund Balance
FISCAL YEARS ENDED 2012 TO 2016
Operating Expenditures
Current Year Adjusted Tax Levy
Net Grand List
Economic Data
Operating Results - General Fund
Fund Balance - General Fund
Total Taxes Collected as a % of Total Outstanding
D - 169
Total Transfers In From Other Funds
Debt Measures
Total Transfers Out To Other Funds
2015
9,822
1,268
Aa2
6.0%
0.2%
2013
$1,489,047,858
19.05
$1,231,244,157
22.58
$28,362,557
98.1%
95.7%
$28,368,663
$1,371,945
$30,446,285
$0
$30,446,285
$20,965,425
$9,029,987
$29,995,412
$43,164
$30,038,576
$407,709
$0
$396,737
$3,039,501
$3,436,238
2014
9,719
1,241
Aa2
5.1%
0.2%
$1,491,656,595
19.45
$1,237,661,106
23.40
$29,011,852
97.9%
95.0%
$29,053,641
$1,412,375
$31,067,032
$200,205
$31,270,117
$22,010,784
$9,235,496
$31,246,280
$15,235
$31,261,515
$8,602
$0
$356,733
$3,444,840
9,636
1,165
Aa2
4.3%
0.2%
$1,610,306,026
18.04
$1,127,091,418
25.69
$29,041,986
98.3%
95.0%
$29,274,806
$1,400,020
$31,352,868
$65,123
$31,421,991
$22,021,433
$8,893,938
$30,915,371
$12,820
$30,928,191
$493,800
$0
$559,943
$3,378,697
$3,938,640
2016
9,591
1,149
Aa2
3.9%
0.1%
$1,548,752,497
19.13
$1,132,215,258
26.07
$29,629,544
98.1%
94.9%
$29,858,650
$1,681,290
$32,246,988
$22,000
$32,270,288
$22,479,871
$9,019,566
$31,499,437
$320,659
$31,820,096
$450,192
$0
$504,224
$3,884,608
$4,388,832
9,848
1,331
Aa2
6.2%
0.2%
2012
$1,586,206,887
17.32
$1,222,726,720
22.46
$27,479,740
98.3%
96.3%
$27,646,132
$1,317,658
$29,490,009
$31,960
$29,521,969
$20,480,193
$8,480,185
$28,960,378
$26,909
$28,987,287
$534,682
$0
$457,203
$3,028,529
Committed $0 $0
Nonspendable $0 $0 $0
$0
$2,571,326
$0
$0$0
$0
$3,088,107
Restricted
Assigned
Unassigned
$5,417,964
$643,960
$6,761,297
$514,250
Bonded Long-Term Debt
Annual Debt Service
$4,486,056
$339,015
$6,639,649
$402,316
$4,580,104
$528,750

WOODSTOCK
Bond Rating (Moody's, as of July 1)
Population (State Dept. of Public Health)
Equalized Net Grand List
Equalized Mill Rate
Mill Rate
Total Revenues
Intergovernmental Revenues
Current Year Collection %
Total Expenditures
Education Expenditures
Unemployment (Annual Average)
School Enrollment (State Education Dept.)
TANF Recipients (As a % of Population)
Total Fund Balance (Deficit)
Total Expenditures and Other Financing Uses
Total Revenues and Other Financing Sources
Grand List Data
Property Tax Collection Data
Property Tax Revenues
Net Change In Fund Balance
FISCAL YEARS ENDED 2012 TO 2016
Operating Expenditures
Current Year Adjusted Tax Levy
Net Grand List
Economic Data
Operating Results - General Fund
Fund Balance - General Fund
Total Taxes Collected as a % of Total Outstanding
D - 170
Total Transfers In From Other Funds
Debt Measures
Total Transfers Out To Other Funds
2015
7,897
1,313
Aa3
6.7%
0.2%
2013
$963,537,919
15.12
$674,083,343
21.78
$14,567,089
98.4%
97.3%
$14,565,613
$7,561,764
$22,651,597
$27,132
$22,983,653
$16,844,128
$5,601,205
$22,445,333
$339,221
$22,784,554
$199,099
$0
$263,599
$2,692,044
$2,955,643
2014
7,860
1,320
Aa3
5.6%
0.1%
$937,571,433
15.98
$667,366,070
22.28
$14,978,760
98.5%
97.6%
$15,163,436
$7,272,547
$22,924,854
$7
$23,235,279
$17,459,851
$5,283,251
$22,743,102
$335,307
$23,078,409
$156,870
$0
$283,946
$3,112,513
7,838
1,302
Aa3
4.8%
0.1%
$995,518,070
15.72
$674,008,761
23.10
$15,648,683
98.4%
97.6%
$15,685,017
$7,061,438
$23,211,644
$768
$23,392,434
$17,492,430
$5,475,961
$22,968,391
$343,949
$23,312,340
$80,094
$0
$169,946
$3,022,661
$3,192,607
2016
7,823
1,265
Aa3
4.3%
0.1%
$972,558,229
16.43
$679,415,130
23.36
$15,975,226
98.4%
97.5%
$16,035,480
$7,059,787
$23,627,875
$0
$23,996,932
$17,577,537
$5,869,211
$23,446,748
$326,314
$23,773,062
$223,870
$0
$169,419
$3,247,058
$3,416,477
7,904
1,338
Aa3
7.4%
0.1%
2012
$976,470,972
14.95
$790,368,642
18.42
$14,598,858
98.5%
97.6%
$14,721,950
$7,267,052
$22,471,650
$12,391
$22,954,133
$16,588,443
$5,767,359
$22,355,802
$220,639
$22,576,441
$377,692
$0
$617,820
$2,756,545
Committed $0 $0
Nonspendable $0 $0 $0
$0
$2,138,725
$0
$0$0
$0
$2,828,567
Restricted
Assigned
Unassigned
$4,462,956
$514,766
$3,709,046
$442,243
Bonded Long-Term Debt
Annual Debt Service
$4,772,400
$1,025,194
$4,825,331
$964,327
$3,978,691
$503,776

MUNICIPAL FISCAL INDICATORS
[End]