Embed Size (px)
Citation preview

Danish University Colleges
Inhibition of intestinal disaccharidase activity by pentoses - with special reference tothe uptake of glucose from starch and sucrose and the insulin secretion in humans
Halschou-Jensen, Kia
Publication date:2013
Document VersionPublisher's PDF, also known as Version of record with the publisher's layout.
Link to publication
Citation for pulished version (APA):Halschou-Jensen, K. (2013). Inhibition of intestinal disaccharidase activity by pentoses - with special referenceto the uptake of glucose from starch and sucrose and the insulin secretion in humans.
General rightsCopyright and moral rights for the publications made accessible in the public portal are retained by the authors and/or other copyright ownersand it is a condition of accessing publications that users recognise and abide by the legal requirements associated with these rights.
• Users may download and print one copy of any publication from the public portal for the purpose of private study or research. • You may not further distribute the material or use it for any profit-making activity or commercial gain • You may freely distribute the URL identifying the publication in the public portal
Download policyIf you believe that this document breaches copyright please contact us providing details, and we will remove access to the work immediatelyand investigate your claim.
Download date: 12. Mar. 2019

Inhibition of intestinal disaccharidase activity by pentoses
– with special reference to the uptake of glucose from starch and sucrose
and the insulin secretion in humans
PhD Thesis · 2013Kia Halschou-Jensen
D E PA R T M E N T O F N U T R I T I O N , E X E R C I S E A N D S P O R T SFA C U LT Y O F S C I E N C EU N I V E R S I T Y O F C O P E N H A G E NP H D T H E S I S · 2 0 1 3
I S B N 9 7 8 - 8 7 - 7 6 1 1 - 6 3 8 - 5
K I A H A L S C H O U - J E N S E N
Inhibition of intestinal disaccharidase activity by pentoses– with special reference to the uptake of glucose from starch and sucrose and the insulin secretion in humans
KIA
HA
LSCH
OU
-JENSN
E
Inhibition of intestinal disaccharidase activity by pentoses
fac u lt y o f s c i e n c eu n i ve r s i t y o f co pe n h ag e n

1
F A C U L T Y O F S C I E N C E U N I V E R S I T Y O F C O P E N H A G E N
PhD thesis Kia Halschou‐Jensen
Department of Nutrition, Exercise and Sports
Faculty of Science, University of Copenhagen
Inhibition of intestinal disaccharidase activity by pentoses
- with special reference to the uptake of glucose from starch
and sucrose and the insulin secretion in humans
Submitted: 09/08/2013
Inhibition of intestinal disaccharidase activity by pentoses– with special reference to the uptake of glucose from starch
and sucrose and the insulin secretion in humans
PhD thesis · 2013Kia Halshou-Jensen
Submitted: 09/08/2013

2
Inhibition of intestinal disaccharidase activity by pentoses. Effects on glucose uptake from starch and disaccharides and on insulin secretion in man
The PhD is financially supported by 2/3 of the budget from Nordic Sugar A/S and 1/3 from the University of Copenhagen.
Principal supervisor: Jens Rikardt Andersen, MD, MPA, Associate Professor, Department of Nutrition, Exercise and Sports, Faculty of Science, University of Copenhagen and Senior Physician at Nutrition Unit 5711, Rigshospitalet, Copenhagen.
Supervisors: Klaus Bukhave, MSc, Dr Med Sci, Højdevej 8, 2830 Virum. Søren Nielsen, MD, Dr Med Sci, Consultant, Department of Endocrinology M, Aarhus University Hospital, Aar‐hus.
Evaluation committee
Associate Professor, MD, PhD, Christian Mølgaard University of Copenhagen, Denmark
Adjunct Professor, MD, Senior Physician Ingvar Bosaeus University of Göteborg and University Hospital Shalgrenska, Sweden
Associate Professor, Susanne Jacobsen Technical University of Denmark, Denmark
Copyright © Kia Halschou‐Jensen
ISBN 978‐87‐7611‐638‐5
Department of Nutrition, Exercise and Sports Faculty of Science University of Copenhagen Rolighedsvej 30 1958 Frederiksberg C
Printed by SL grafik, Frederiksberg C, Denmark (www.sslgrafik.dk)

3
PREFACEThis PhD thesis is submitted for evaluation, with the purpose of obtaining the degree as Doctor of
Philosophy at the University of Copenhagen.
The work has been carried out during my employment at the Department of Nutrition, Exercise and Sports, Faculty of Science in the period September 2009 ‐ July 2013 with maternity leave May 2011 – May 2012.
This thesis covers topics related to the search for natural functional food components, and the effects of these on health problems related to Diabetes Mellitus. The focus is on investigations of the post‐prandial effects of the pentoses L‐arabinose, D‐xylose as well as polyphenols on carbohydrate diges‐tive enzymes in vitro and in vivo.
All in vitro and human intervention studies were conducted at the Department of Nutrition, Exercise and Sports, Faculty of Science, University of Copenhagen.
The meal test products were produced by the Nordic Sugar test bakery in Arlöv Sweden, and the anal‐
ysis of L‐arabinose content in the test products was carried out at the Department of Animal Science,
Aarhus University, Foulum, Denmark. The thesis includes a review and three publications.
Kia Halschou‐Jensen Frederiksberg, August 2013

4
LISTOFPUBLICATIONS
The PhD thesis includes the following three original papers, which will be referred to as:
Paper 1:
Kia Halschou Hansen, Klaus Bukhave & Jens Rikardt Andersen. Intestinal
disaccharidase activity and uptake of glucose from sucrose, in A Lazinica,
S Chackrewarthy (eds): Glucose Tolerance, InTech, 2012: 149‐62
ISBN 978‐953‐51‐0891‐7.
Paper 2:
Kia Halschou‐Jensen, Knud Erik Bach Knudsen, Søren Nielsen, Klaus Bukhave & Jens
Rikardt Andersen. Effect of L‐arabinose on glucose uptake from mixed meals.
Status: Manuscript ready for submission, Br J Nutr.
Paper 3:
Inger Krog‐Mikkelsen, Sesilje Bondo Petersen, Kia Halschou‐Jensen, Ole Hels, Jens Juul
Holst, Jens Rikardt Andersen& Klaus Bukhave: Effects of xylose on intestinal sucrase
activity, in vitro and in humans.
Status: Manuscript submitted, Am J ClinNutr

5
ACKNOWLEDGEMENTI would like to thank Nordic Sugar AS for the financial support and three years of productive collabo‐ration, which are greatly appreciated. Especially thanks to Bjarne Fallesen and Inge Weiergang for laboratory work, help and mentoring. Thanks to the Bakery in Arlöv, Sweden, Lennart Axelsson and Karin Farstrup, for making all the test products.
I owe my deepest gratitude to my supervisors, Associate Professor, Senior Physician Jens Rikardt An‐dersen for encouraging me and being an inspiration with your great scientific competences as well as for your availability at any time during the last four years. Associate Professor emeritus Klaus Bukha‐ve, thank you for your expert guidance through the lab and for all the discussions and extensive knowledge you have provided. Furthermore, thanks to my co‐supervisor Senior Physician Søren Niel‐sen. Thank you for the critical advice during the practical studies. Thanks to Knud Erik Bach Knudsen for laboratory work.
Furthermore, I am thankful to all my colleagues at the Department of Nutrition, Exercise and Sports for the professional contribution to my interventions studies. Special gratitude to laboratory techni‐cians Inge Rasmussen, Elin Skytte and Kristina Møller for expert technical assistance, the kitchen per‐sonnel Mona Pedersen, Yvonne Fatum, Karina G Rossen, Kira HB Hamann, Charlotte Kostecki for skilled work with the meal tests and Marianne Bold Kristensen for assistance during the intervention studies
Special thanks to my office companion Camilla Spagner for great scientific discussions, personal sup‐port, friendship and humorous working hours. Furthermore, a special thanks to the dietician group, Marianne J Hansen, Maria R Andersen, Bettina B Marisola, Anne Wengler and Ulla S Pedersen for fab‐ulous breakfast meetings once in a while. A special thanks to the subjects for their willing participa‐tion.
Last but not least, I am especially grateful to my family and friends for keeping me in touch with eve‐ryday life and showing sympathy for this PhD mission. Special thanks to my amazing husband Peter for all your unconditional love and support and our two little boys Hjalte and Magnus for making me smile, laugh and love my life ‐ I could not have finished this without you.

6
SUMMARYINENGLISHThe current health problems regarding the obesity epidemic, development of type 2 diabetes mellitus (T2D) and cardiovascular disease are a major challenge for healthcare systems worldwide. No simple or unique cure has been documented to prevent or treat this major health problem regard‐ing T2D and the risk factors related to this disease. There is therefore an immediate need for preven‐tion methods and effective approaches to overcome these serious health issues. It will need a combination of several interventions. The treatment of T2D today is primarily lifestyle changes like increased physical activity and change of diet, which corresponds to the treatment of insulin resistance, IGT and obesity. Secondly, a variety of medicine is used. Within nutrition, one of the research areas is preventive or therapeutic aims against development of T2D. A better glycaemic control is one preventive target and furthermore it seems to be able to delay the incidence of T2D.Prandial regulation of glucose is a complex process and there are several meth‐ods to assess glycaemic control and thereby affect the blood glucose concentration. The prandial glu‐cose regulation depends on factors including physical activity, the nature of ingested food, gastric emptying, intraluminal glucose concentration, and enzymatic activity in the brush border. The focus in this review is on evidence provided by in vitro studies, animal models and human studies on L‐arabinose, D‐xylose and polyphenols. The focus is on their effects on carbohydrate‐ ingesting enzymes activity in vitro and possible effects on human postprandial blood response. In paper 1 the effects of sugar beet polyphenols from molasses and the potential inhibition of sucrase activity in vitro, was investigated. Two different polyphenol‐rich fractions from chromatographic sepa‐ration of molasses from sugar beets and pure ferulic acid were tested. We found no effects of the two fractions of molasses. The pure ferulic acid indicated an inhibition of sucrase in vitro. Both in vitro and in vivo studies have investigated the effects of L‐arabinose and D‐xylose on carbohy‐drate digestive enzymes. In paper 3, D‐xylose and L‐arabinose was investigated in vitro and in vivo. This study found that D‐xylose and L‐arabinose inhibit both sucrase and maltase when tested in a Caco‐2 cell model. In addi‐tion, 13 healthy subjects completed a randomized double‐blinded cross‐over study with sucrose drinks supplemented with 4, 8 w/w% xylose or 8 w/w% L‐arabinose. This showed that supplementa‐

7
tion of 8% D‐xylose and L‐arabinose compared to pure sucrose produced a decline in blood glucose peak, as well as a decreased and delayed insulin peak. These results from a sucrose drink added L‐arabinose and D‐xylose constituted the basis for the fur‐ther investigations of L‐arabinose. However, the use of higher dietary doses of sucrose would be un‐feasible in terms of palatability in the human population. In paper 2, the purpose was to investigate if the positive effects of L‐arabinose added to a sugar drink could be reproduced in a mixed meal containing sucrose and/or starch. Furthermore the consistencies of the ingested meals and the possible effect on gastric emptying and thereby postprandial blood concentrations of glucose, insulin and C‐peptide, were investigated.
In conclusion, this PhD thesis found no evidence that L‐arabinose affects post prandial blood glucose, insulin and C‐peptide when mixed in a meal. This might be due to the difference in gastric emptying rate between the fluid and solid meals, but the conclusion is associated with certain reservations re‐garding sample size (n=6) in the study and the method for measuring gastric emptying. Furthermore, the fluid maltose drink could not validate the in vitro studies on maltase activity. The overall concluding perspective must be that L‐arabinose has the greatest potential to effect glu‐cose and insulin secretion when added to a sucrose drink.

8
DANSKSAMMENDRAG(DANISHSUMMARY)Den nuværende fedme epidemi, udvikling af Type 2 diabetes (T2D) og hjertekarsygdomme giver på verdensplanstore sundhedsmæssige udfordringer.
Der er på nuværende tidspunkt ikke påvist nogen simpel kur, forebyggelse eller behandling af T2D og de risikofaktorer der er relateret til sygdommen.
Det kræver en kombination af flere interventioner for at behandle og/eller forebygge T2D. I dag er den primære behandling livstilsændringer i form af øget fysisk aktivitet og kostomlægning, hvilket stemmer overens med behandlingen af insulinresistens, IGT og fedme. Sekundært bliver farmakolo‐gisk behandling anvendt i de situationer hvor livsstilændringer ikke er tilstrækkeligt.
Et af forskningsområderne inden for ernæring er forebyggelse og behandling af T2D. Her er optimeret glykæmisk kontrol et af de forebyggende tiltag der kan være med til at forsinke incidensen af T2D.
Den postprandiale regulering af glukose er en kompleks proces, og der er flere metoder hvorpå den glykæmiske kontrol kan påvirkes. Den postprandiale regulering af glukose afhænger af faktorer som fysisk aktivitet, fødeindtag, mavetømningshastighed, den intraluminale glukose koncentration og akti‐viteten af fordøjelsesenzymerne i brush border membranen.
I denne PhD afhandling, fokuseres der på enzymaktiviteten i brush border membranen og evidens fra in vitro studier, dyrestudier og1 humane studier omhandlende L‐arabinose, D‐xylose og polyphenolers effekt på de kulhydrat‐ nedbrydende enzymer, og derved mulige effekt på det postprandiale respons.
Effekten af sukkerroe melasse på sukraseaktiviteten blev undersøgt in vitro og præsenteret i paper 1. To melassefraktioner fra sukkerroer, indeholdende polyphenoler samt ren ferulasyre blev testet. Vi fandt ingen inhiberende effekt af de to melassefraktioner. Den rene ferulasyre indikerede en hæm‐mende effekt af sukrase in vitro.
D‐xylose og L‐arabinose blev undersøgt in vitro og in vivoi paper 3. Dette studie fandt at D‐xylose og L‐arabinose hæmmer både sukrase og maltase i caco‐2 celle homogenat. Yderligere, blev 13 raske for‐søgspersoner randomiseret til et dobbeltblindet cross‐over studie. Her indtog de en sukrose drik (75 g sukrose i 300 ml vand) tilsat 4 og 8 vægtprocent D‐xylose og 8 vægtprocent L‐arabinose. Resultaterne viste et nedsat glukose peak så vel som nedsat og forsinket insulin peak.
Disse resultater fra sukroseholdige drikke tilsat L‐arabinose og D‐xylose gav anledning til videre un‐dersøgelser af L‐arabinose. Dog er så høje doser af sukrose ikke klinisk relevant og praktiske formål uspiseligt på grund af smagen, hvorfor der i de videre undersøgelser blev brugt L‐arabinose tilsat fast føde indeholdende normaliserede mængder af sukrose.

9
Formålet i paper 2 var at undersøge om L‐arabinose, og de positive effekter fundet i sukkerholdige drikke, er mulige at reproducere ved at tilsætte L‐arabinose i et sammensat måltid indeholdende sukrose og/eller stivelse. Derudover blev konsistensen af måltidet og den mulige effekt på mavetøm‐ningshastigheden og dermed den postprandiale koncentration af glukose, insulin og C‐peptid, under‐søgt.
Der blev ikke fundet signifikante effekter på niveauet af postprandial glukose, insulin og C‐peptid, når L‐arabinose blev tilsat et sammensat måltid. Årsagen hertil kan ligge i forskellen på mavetømningsha‐stigheden efter indtag af flydende og fast føde. Dog er denne antagelse forbundet med flere usikker‐heder såsom stikprøvestørrelsen (n=6) og selve metoden til måling af tømningshastigheden.
Konklusionen og det videre perspektiv må derfor være, at L‐arabinose har det største potentiale for at påvirke det postprandiale glukose respons og dermed insulinsekretionen når det bliver tilsat en sukroserig drik.

10
ABBREVIATIONS T2D Type 2 diabetesMellitus
CVD Cardiovasculardisease
SI Sucrase‐isomaltase
BBM Brush border membrane
AUC Area under the curve
iAUC Incremental area under the curve
GE Gastric emptying
GER Gastric emptying rate
IGT impaired glucose tolerance
IR Insulin resistance
Cmax Maximum concentration
Tmax Time for maximum concentration

11
AIMSANDOBJECTIVESPostprandial hyperglycaemia is now established as an independent risk factor for the development of at least macro vascular complications in diabetes mellitus (1). One of many ways to decrease this postprandial hyperglycaemia is by modulating the absorption of glucose from digested carbohydrates. The main favourable consequence of the lowering of postprandial glucose concentrations in the blood is most likely a decrease in the production of insulin, meaning that the same amount of glucose can be metabolized by a smaller amount of insulin.
Based on studies with L‐arabinose and D‐xylose, it is evident that these specific naturally occurring pentoses hold the potential to inhibit carbohydrate digestive enzymes and thereby reduce postpran‐dial blood glucose levels, as well as insulin‐ and C‐peptide production when added to sugar‐containing drinks. However, ingestion of drinks with high content of sugar is rather unusual for diabetic patients, but probably very frequent for persons at high risk of Diabetes Mellitus, i.e. persons/patients with insulin resistance.
Besides pentose, polyphenols have also been a candidate for positive effects.
For public health purposes, the main effects would be expected if the blood glucose‐lowering compo‐nents could be incorporated in the usual and recommended diet for most of the population. Another practical aspect is that adding a component to sugar has much less effect than addition to our main glucose‐supplying carbohydrate; starch.
Accordingly, the primary aim of this PhD thesis was to examine the potential of the pentose L‐arabinose added in a mixed meal to inhibit carbohydrate digestive enzymes and the relation to post‐prandial blood glucose, insulin and C‐peptide, as it is a widely accepted experience that it is more dif‐ficult to decrease the postprandial blood glucose than the fasting concentrations.
The secondary aims were to search for similar effects in polyphenols from molasses, which is a bi‐product in the production of sucrose from sugar beets, and to look for effects on the handling of starch/maltose in the small bowel, in‐vitro and in‐vivo.

12
The hypothesis in the dissertation:
In vitro studies with maltase:
Does L‐arabinose and D‐xylose inhibit maltase activity in vitro with maltose as a substrate? The pur‐pose was to investigate if L‐arabinose and D‐xylose additionally could have an inhibiting effect on starch digestion similar to the one shown in sucrose digestion.
In vitro studies with polyphenols:
Do sugar beet polyphenols from molasses inhibit sucrase activity in vitro?
Intervention study 1:
Does L‐arabinose added to a solid, mixed meal inhibit sucrase and maltase activity in humans judged from postprandial plasma glucose, insulin and C‐peptide? The purpose was to investigate if the posi‐tive effects of L‐arabinose added to a sugar drink could be reproduced in a mixed meal containing sucrose and/or starch
Intervention study 2:
Does the consistence of the ingested meal affect gastric emptying and thereby postprandial blood concentrations of glucose, insulin and C‐peptide, and does an increase in arabinose dose give better results?

13
CONTENTSPREFACE ............................................................................................................................................................................ 3
LIST OF PUBLICATIONS ...................................................................................................................................................... 4
ACKNOWLEDGEMENT ........................................................................................................................................................ 5
SUMMARY IN ENGLISH ...................................................................................................................................................... 6
DANSK SAMMENDRAG (DANISH SUMMARY) .................................................................................................................... 8
ABBREVIATIONS .............................................................................................................................................................. 10
AIMS AND OBJECTIVES .................................................................................................................................................... 11
REVIEW: .......................................................................................................................................................................... 15
1 INTRODUCTION ...................................................................................................................................................... 15
2 INSULIN RESISTANCE AND TYPE 2 DIABETES ........................................................................................................... 17
2.1 INSULIN RESISTANCE, GLUCOSE INTOLERANCE AND TYPE 2 DIABETES MELLITUS .......................................................................... 17
2.2 PREVENTION AND TREATMENT .......................................................................................................................................... 17
3 DISACCHARIDES AND DIGESTIVE ENZYMES (ALFA‐GLUCOSIDASES) ........................................................................ 21
3.1 DISACCHARIDES – SUCROSE AND MALTOSE .......................................................................................................................... 21
3.2 DISACCHARIDASES .......................................................................................................................................................... 22
3.3 DISACCHARIDASE ACTIVITY IN VITRO ................................................................................................................................... 23
3.4 CACO‐2 CELLS ................................................................................................................................................................ 24
3.5 ENZYME KINETIC ............................................................................................................................................................. 25
3.5.1 Enzyme activity assay ...................................................................................................................................... 26
4 WHAT ARE THE PROPERTIES OF PENTOSES – L‐ARABINOSE AND D‐XYLOSE? .......................................................... 31
4.1 OCCURRENCE,ABSORPTION AND METABOLISM ..................................................................................................................... 31
4.2 TOLERABILITY OF L‐ARABINOSE AND D‐XYLOSE ..................................................................................................................... 31
5 INFLUENCE OF PENTOSES ON DISACCHARIDASE ACTIVITY ...................................................................................... 33
5.1 EVIDENCE FROM IN VITRO STUDIES AND ANIMAL MODELS ....................................................................................................... 33
5.2 EVIDENCE FROM HUMAN INTERVENTION STUDIES .................................................................................................................. 34
6 MEAL DESIGN ......................................................................................................................................................... 49
6.1 L‐ARABINOSE RECOVERY ................................................................................................................................................. 51
7 INFLUENCE OF GASTRIC EMPTYING ........................................................................................................................ 53
8 POLYPHENOLS – INFLUENCE ON DISACCHARIDASES ............................................................................................... 57

14
8.1 POLYPHENOLS IN SUGAR BEETS .......................................................................................................................................... 58
9 CONCLUSIONS AND PERSPECTIVES FOR FURTHER RESEARCH ................................................................................. 63
10 REFERENCES ........................................................................................................................................................... 65
11 APPENDIX PAPER 1‐3 .............................................................................................................................................. 75
15
REVIEW:Inhibition of intestinal disaccharidase activity by pentoses. Effects on glucose uptake from starch and disaccharides and insulin secretion in man
1 INTRODUCTIONThe current health problems regarding the obesity epidemic, development of type 2 diabetes mellitus (T2D) and cardiovascular disease are a major challenge for the healthcare systems worldwide. It has been estimated by the International Diabetes Federation that 366 million people worldwide had dia‐betes mellitus in 2011 and by 2030 this will have risen to 552 million (2). A total of 306,638 persons were diagnosed with diabetes in 2011 In Denmark; a twofold increase in ten years (3). T2D accounted for around 80%, and 200,000 persons were undiagnosed with T2D. A total of 750,000 Danes had pre‐diabetes in 2010 and it is expected that 30 ‐ 40% of these will develop T2D within 3‐5 years Rasmussen, 2008 286 /id.
The fight against this growing health problem requires the academic sector to work innovatively to improve and develop tools for preventive or therapeutic aims. Within nutrition, one of the research areas is better glycaemic control. The glucose metabolism is in focus, as even a slight increase in the normal postprandial glucose response after food intake correlates with the mechanism behind devel‐oping T2D (5;6) and actually poses a risk for developing insulin resistance (7). Furthermore, several studies indicate that the development of insulin resistance is a major risk factor for developing T2D, hypertension and cardiovascular diseases (8;9).
With insulin resistance being a key factor in T2D, the same risk factors for T2D generally apply for in‐sulin resistance. The 750,000 prediabetic persons with impaired glucose tolerance and insulin re‐sistance become an interesting group for a health promoting intervention to prevent the develop‐ment of T2D and the risk of early deathfrom CVD.
A diet in which fruit, non‐starch vegetables, and dairy products has been emphasized as being useful for people with T2D patients compared to high starch meals or typical “American” western diets (10) which leads to an interest in modifying the intake or digestion of starch and sugar. Altering the intake of sugar and starch would probably be a challenge in the industrialized countries, such as Denmark, where the overall intake of starch and sugar are high (11). Nutritional scientists and food industry have been working with the nature of ingested food and possible carbohydrate digestive inhibitors. Pentoses and polyphenols are among of the inhibitor candidates. The pentose types L‐arabinose and D‐xylose are poorly‐absorbed, readily‐available sweet‐tasting pentose sugars. They have both showed an inhibiting effect on sucrase activity in vitro (12‐14) and studies with different polyphenols have

16
reported similar effects. The proper application of pentoses or polyphenolic compounds in different sucrose‐based products may lessen the undesired effects of sucrose and starch.
The focus in this review is on evidence provided by in vitro studies, animal models and human studies on L‐arabinose, D‐xylose and polyphenols. The focus is on their effects on carbohydrate ingesting en‐zymes in vitro and possible effects on human postprandial blood response. The review has four aims:
1) Investigation of the effect of L‐arabinose and D‐xylose on maltase activity in vitro.
2) Investigation of sugar beet molasses or fractions of sugar beet molasses, containing a variety of different polyphenols, for inhibiting effect on brush border sucrase and maltase in vitro
3) Investigation of L‐arabinose added to a solid mixed meal and the inhibition of sucrase and maltase activity evaluated from blood glucose, insulin and C‐peptide after ingestion.
4) Investigation of gastric emptying and the possible effects on postprandial blood parameters after ingesting L‐arabinose in mixed meals with different structures.

17
2 INSULINRESISTANCEANDTYPE2DIABETES
2.1 INSULINRESISTANCE,GLUCOSEINTOLERANCEANDTYPE2DIABETESMELLITUSThe incidence of T2D is rising and enhanced by increased incidence of obesity and lack of physical activity. T2D is a complex metabolic disorder, complicated by microvascular and macrovascular dis‐eases (8). The development of T2D is a slow process involving both genetics, environmental factors and beta cell dysfunction (15).
Insulin resistance (IR) is one of the central abnormalities in the pathogenesis of T2D (16). Several stud‐ies agree that development of insulin resistance is a massive risk factor in developing T2D, high blood pressure and cardio vascular diseases (CVD) (8;9). IR is described as decreased insulin sensitivity and normal insulin concentrations will not induce a normal glucose response leading to hyperinsulinaemia (8). A study investigating offspring of two parents diagnosed with T2D showed that, up to two dec‐ades before type II diabetes is diagnosed, reduced glucose clearance is already present. This reduced clearance is accompanied by compensatory hyperinsulinemia, not hypoinsulinemia, suggesting that the primary defect is in the periphery tissue and the response to insulin and utilization of glucose, not in the pancreatic beta cell (17). Based on epidemiological observations, approximately half of the population will develop T2D in their lifetime and 30‐35% will develop impaired glucose tolerance (IGT), also known as pre‐diabetes (18). IGT is a precursor for T2D and it is well known that IGT is relat‐ed to increased cardiovascular morbidity and mortality (19) and that postprandial hyperglycaemia plays a central role in progression from IGT to T2D (20). Furthermore, several studies show that IR is present at the stage of IGT (21;22), and even before any abnormality in glucose tolerance is observed (23). This gives reason to assume that an unidentified number of persons have undiagnosed insulin resistance and thereby are at risk of developing T2D.
Apart from IR and IGT, the body composition is an important predictor of these metabolic abnormali‐ties, where accumulation of upper‐body/visceral fat is closely related to insulin resistance, develop‐ment of T2D, hypertension, and dyslipidaemia, which is not the case for persons with a lower‐body fat composition (8;24).
2.2 PREVENTIONANDTREATMENT
No simple or unique cure has been documented to prevent or treat this major health problem regard‐ing T2D and the risk factors related to this disease. It will need a combination of several interventions.

18
The treatment of T2D today is primarily lifestyle changes like increased physical activity and change of diet, which corresponds to the treatment of insulin resistance, IGT and obesity. Secondly, a variety of medicine is used.
The aim of this thesis was to affect the glycaemic control, as it is possible to delay the appearance of T2D and cardiovascular diseases in IGT patients by good glycaemic control (25‐29). Furthermore, it is now well established that even a minor rise in blood glucose after an ingested meal is an important component in the mechanism behind T2D (5;30). Prandial regulation of glucose is a complex process and there are several methods to assess glycaemic control and thereby affect the blood glucose con‐centration. It depends on factors including physical activity, the nature of ingested food, gastric emp‐tying, intraluminal glucose concentration, and enzymatic activity in the brush border.
By increasing physical activity, it is possible to improve glycaemic control (31). During exercise the major metabolic fate of blood glucose after entry into skeletal muscle cells is glycolysis followed by oxidation (32). In individuals with T2D, a single round of exercise can reduce blood glucose concentra‐tion (33).
Ingestion of a meal triggers a range of physiological responses to optimize the digestion, absorption, distribution and metabolism of nutrients, e.g. modulation of glucose homeostasis. Ingestion of sugar and starch has a huge impact on the glycaemic homeostasis and is part of the average western diet consisting of excessive fat (saturated fat, trans fatty acid), protein and simple carbohydrates (sweets, refined cereals) and low in fibre (34). Ingesting a western diet is associated with development of T2D (35).
One way to address this is modifying the intake of starch and sugar, leading to decreased amounts of glucose available in the small intestine and thereby a decreased blood glucose concentration, result‐ing in decreased need for insulin. Lowering the intake of simple carbohydrates could be a challenge in the industrialized countries, such as Denmark, where the overall intake of starch and sugar is high. In Denmark, 50% of children (4‐14 years) and about 25% of the adults consume more added sugars than the recommended 10 E%. One‐fifth of all ingested carbohydrates are added sugars, which contribute with 10% of all energy (11). This taken into account, searching for long lasting methods to prevent and/or treat T2D is desirable.
Another way to address glycaemic control is to replace the high Glycaemic Index (GI) foods with low GI foods. The GI was developed to provide a classification of carbohydrate foods in terms of their im‐pact on glycaemic control, which can show up to a five‐fold difference (36). The concept of GI is well investigated in different populations and several studies have showed the ability of a low‐GI diet to improve insulin sensitivity (37;38) and furthermore the ability of similar diets to improve glycaemic control in diabetic patients (36). These effects resemble the effects of fibre consumption. It has been

19
known for many years that dietary fibres reduce postprandial glucose concentrations in the blood and insulin response. This effect has been established for a variety of fibres, but most markedly for soluble fibres with the delay in gastric emptying as a dominating factor (39‐41).
The aspect of gastric emptying rate (GER) is worth mentioning, as it is an important step in digestion, being a rate‐limiting step in delivering the disintegrated foods to the duodenum and the small intes‐tine for further digestion. Several factors can affect the rate of gastric emptying such as food volume, fluid viscosity, caloric content, acidity and physical properties such as texture and density (42). The rate of gastric emptying could provide a delay in carbohydrate availability in the small intestine and as a result affect the blood glucose concentration and insulin secretion.
These possible preventing and curative dietary concepts regarding glycaemic control are followed by the approach of slowing carbohydrate absorption using inhibitors of the carbohydrate digestive en‐zymes e.g. α‐glucosidases. In this PhD thesis, the point of action is the carbohydrate digestive en‐zymes, sucrase and maltase, as they are the key enzymes responsible for the hydrolysis of maltose and sucrose to absorbable glucose. Several naturally occurring agents have been widely investigated for inhibiting effect and the following part will focus on the two pentoses, L‐arabinose and D‐xylose, as well as polyphenol compounds from sugar beet molasses.

20
21
3 DISACCHARIDESANDDIGESTIVEENZYMES(ALFA‐GLUCOSIDASES)
3.1 DISACCHARIDES–SUCROSEANDMALTOSESucrose consists of two molecules, glucose and fructose, bound together with alfa‐1.2‐glycosidebonds and traditionally known as sugar. Maltose is two glucose molecules bound together with an alfa‐1.4‐glycosidebond. Maltose and isomaltose are formed from hydrolysis of starch. Sucrose and maltose are hydrolysed in the intestine to free glucose and fructose, followed by active transport for glucose and facilitated transport for fructose over the brush border membrane (BBM) and released to the blood through facilitated transport over the basolaterale membrane (43).
Fructose is utilized in the liver in the glycolytic pathway, with products like glucose, glycogen, lactate and pyruvate. Fructose is more lipogenic than glucose, an effect that might contribute to the devel‐opment of cardiovascular diseases (CVD), insulin resistance and T2D (44). Fructose does not stimulate insulin secretion as glucose, and it is recommended to diabetes and heart patients to have a modest intake of fructose due to the lipogenicity (44;45). Recently, a meta‐analysis stated that fructose intake at a level of ≤ 36g/d, which is equivalent to daily intake of fruit, could have beneficial effects by de‐creasing endogenous glucose production and increasing glycogen synthesis, and thereby improving glycaemic control. This benefit is seen without the adverse cardio metabolic effects reported when fructose is ingested in high doses or as excess energy (46).
22
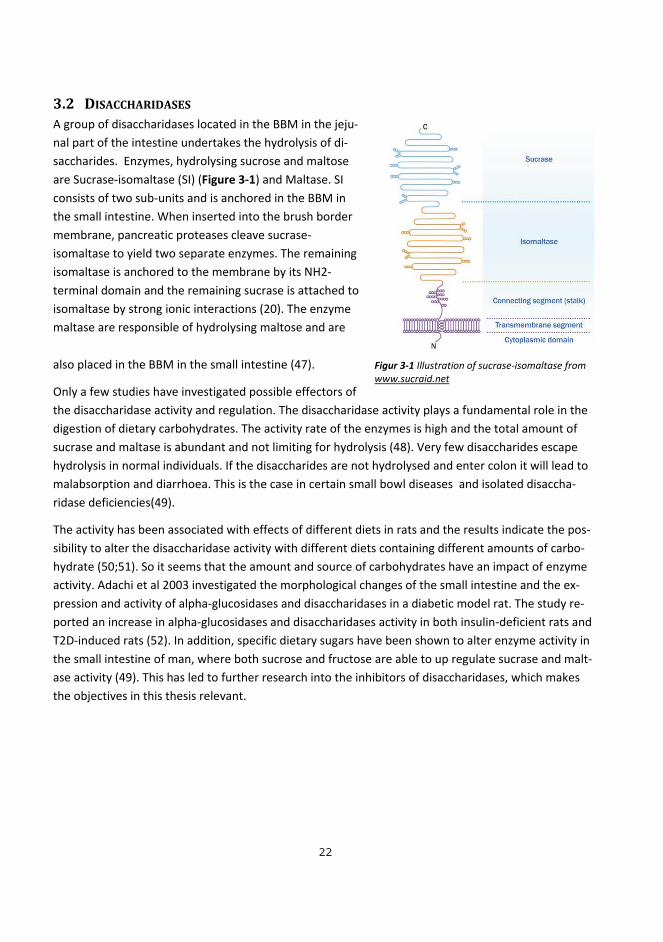
3.2 DISACCHARIDASESA group of disaccharidases located in the BBM in the jeju‐nal part of the intestine undertakes the hydrolysis of di‐saccharides. Enzymes, hydrolysing sucrose and maltose are Sucrase‐isomaltase (SI) (Figure 3‐1) and Maltase. SI consists of two sub‐units and is anchored in the BBM in the small intestine. When inserted into the brush border membrane, pancreatic proteases cleave sucrase‐isomaltase to yield two separate enzymes. The remaining isomaltase is anchored to the membrane by its NH2‐terminal domain and the remaining sucrase is attached to isomaltase by strong ionic interactions (20). The enzyme maltase are responsible of hydrolysing maltose and are
also placed in the BBM in the small intestine (47).
Only a few studies have investigated possible effectors of the disaccharidase activity and regulation. The disaccharidase activity plays a fundamental role in the digestion of dietary carbohydrates. The activity rate of the enzymes is high and the total amount of sucrase and maltase is abundant and not limiting for hydrolysis (48). Very few disaccharides escape hydrolysis in normal individuals. If the disaccharides are not hydrolysed and enter colon it will lead to malabsorption and diarrhoea. This is the case in certain small bowl diseases and isolated disaccha‐ridase deficiencies(49).
The activity has been associated with effects of different diets in rats and the results indicate the pos‐sibility to alter the disaccharidase activity with different diets containing different amounts of carbo‐hydrate (50;51). So it seems that the amount and source of carbohydrates have an impact of enzyme activity. Adachi et al 2003 investigated the morphological changes of the small intestine and the ex‐pression and activity of alpha‐glucosidases and disaccharidases in a diabetic model rat. The study re‐ported an increase in alpha‐glucosidases and disaccharidases activity in both insulin‐deficient rats and T2D‐induced rats (52). In addition, specific dietary sugars have been shown to alter enzyme activity in the small intestine of man, where both sucrose and fructose are able to up regulate sucrase and malt‐ase activity (49). This has led to further research into the inhibitors of disaccharidases, which makes the objectives in this thesis relevant.
Figur 3‐1 Illustration of sucrase‐isomaltase from www.sucraid.net

23
3.3 DISACCHARIDASEACTIVITYINVITROScientists have growing interest in the use of cell models and finding a reliable in vitro model as a sub‐stitute for the in vivo environment. Therefore, cell lines involved in models investigating specific pro‐teins or other physiological mechanisms must be sufficiently characterized prior to its use. This re‐gards epithelial markers, brush border enzymes, formation of tight junctions, molecular transporters etc. (53) In food and nutritional science, the application of intestinal cell models is getting more im‐pact and various in vitro models for determination of disaccaharidases inhibitors have been described. These methods represent quick and cheap screening procedures and include among others mucosa homogenates (54;55), intestinal brush border preparations from different experimental animals(56), and homogenates of human intestinal cell line Caco‐2 (14). Primary cell cultures are rarely used due to short lifespan and limitations in repeatability, and most of the current cell lines for intestinal mod‐els are transformed cell lines, isolated from cancer (53).
One of them, Caco‐2 cell line, is the most widely used, established and studied cell line, especially in examining the disaccharidase activity.
The Caco‐2 cell line originates from a colonic tumour in a 72 year‐old male who died in the 1960. The cell line morphology is well known and studied, and after confluence (a monolayer is formed) the cells differentiate into small intestinal‐like cells with the morphological characteristics of brush border mi‐crovilli and tight junctions. Differentiation is complete after 25‐30 days in culture. To evaluate the Caco‐2, monolayer integrity e.g. development of tight junctions, Trans epithelial electrical resistance (TEER) can be measured (57).It appears, that Caco‐2 monolayer display much higher TEER values than commonly reported from intestinal tissues. This, is especially important to consider when using Caco‐2 cells for transport studies (57)
However, it is a cancer‐derived cell line and it has some limitations such as altered glycosylation, un‐responsiveness to hormones and cytokines and inadequate expression of proteins defining the epi‐thelial character. It is important to be aware of these limitations of the model when planning experi‐ments. Additionally, culture‐related factors can influence cell growth, differentiation and morphology. These factors are seeding density, culture environment, medium, and time for harvest. Furthermore, the cell passage may have an impact. All these factors are important to take into account regarding the aim of the study and must be standardized in order to obtain reproducible experimental models and comparable results.

24
3.4 CACO‐2CELLSIn paper 1 and paper 3 the Caco‐2 cell line was chosen as the model for examination of sucrase and maltase activity and the effect of different inhibitors. Despite of the fact that the Caco‐2 cell line orig‐inates from a cancer cell, it was chosen anyway because of the human origin and the ability of the cells to differentiate as enterocytes with development of brush border enzymes (57). Furthermore, the Caco‐2 cell line is well described and used in several previous studies. In these experiments, the focus was to culture the Caco‐2 cells in optimal conditions for differentiation into entorocytes with brush border enzymes.
The Caco‐2 cells used in the experiments in paper 1 and paper 3 were cultured on sterile Transwell®dishes with polycarbonate membranes (pore size: 0.4 μm; area: 44 cm2; diameter: 75 mm). Several studies have investigated different materials for culturing Caco‐2 cells and the overall conclu‐sion is that Caco‐2 cells retain their ability to proliferate and differentiate as intestinal cells when grown on porous membranes. However, the quality and specifications of the membranes, as well as the coating of the filter, will greatly influence cellular proliferation and differentiation (57). The dishes used here meet the optimal conditions for cell growth and favoured the purpose of the method e.g. measuring activity of disaccharidases in the cell homogenates. To simulate in vivo conditions, all cell cultures were incubated at 37°C in 5/95% CO2/air humidifying incubator.
The seeding density is important regarding time to differentiation. Several seeding densities have been reported ranging from 3.5 x 10³cells/cm2 up to 5 x 10³cells/cm2 (58). Higher seeding density has been connected with a guarantee that all areas in the cell monolayer reach confluence at approxi‐mately the same time (58). In these experiments, the density was of 5 x 10³cells/cm2.
The cells were cultured for 20‐21 days, as during differentiation enzyme activity reaches a maximum at day 15‐21 after confluence (57). Especially activity of the SI enzyme is low during the proliferation phase, and increases once confluence is reached (57;59). During cell culture procedures, cells are kept in flasks until a monolayer is formed following detachment and seeding on either filters or bigger flasks. This cycle is called a passage. The cell passage can influence the protein expression, as the cell characteristics can vary from passage to passage; thus, at a higher passage number, cells are more likely to exhibit variations of phenotype compared to the parental cells (57). All cells used in paper 1 were passage number 38 and 39 and in paper 3 passage number 42‐43 which in both cases are de‐fined as low passage numbers(60). Caco‐2 cells were cultured in Dulbecco’s Modified Eagle’s Medium (DMEM) supplemented with 10% of foetal bovine serum, 1% non‐essential amino acids, 1% penicil‐lin/streptomycin solution and 1% L‐Glutamine. The serum is found to be important for sucrase activi‐ty, as the activity is lower when cultured in serum‐free medium (61). Trypsinization and subcultivating

25
were performed at 90% of confluence. Growth medium was removed with a Pasteur pipette and Ca‐co‐2 cells were rinsed twice in Dulbecco’s Phosphate Buffered Saline (PBS).
Measuring the confluence during growth, TEER was measured by a volt‐ohmmeter. The TEER meas‐urements vary from laboratory to laboratory and are associated with several error sources such as cell density, passage number and conditions at time of measurement, e.g. temperature (57). The TEER measurements were conducted every second day before change of media after exactly 10 minutes in the LAF bench. At day 20‐21, TEER had reached steady state levels at 2‐300 Ω*cm2 and the cells were harvested from the dishes. Before harvesting the cells, the growth medium was removed and the Ca‐co‐2 cells were rinsed 5 times in PBS. Then the cells were scraped off the membrane and moved to a nunc tube with PBS. After spinning (1400 rpm/10 min /20 ° C), the rest of PBS was removed. The cells were mixed in 1 ml PBS and sonicated (15X, amplitude: 100%; cycle: 75) and frozen at ‐20°C. The Ca‐co‐2 homogenates were now ready for further experiments and an enzyme kinetic assay was devel‐oped.
3.5 ENZYMEKINETICTo understand how enzymes function, a kinetic description of their activity is needed. A mathematical model derived in 1913 by a German biochemist, Leonor Michaelis, and Canadian physician, Maud Menten, further known as the Michaelis‐Menten model, can describe the rate of reaction for many enzymes (62). They proposed a reaction in which an enzyme E binds to a substrate S to form a com‐plex ES, and this in turn is converted into a product P and the enzyme. Represented schematically as follows:
For further evaluation of the enzyme activity, they stated that the rate of catalysis V, defined as the number of moles of product formed per second, varies with the substrate concentration (S) in a spe‐cial way shown in Figure 3‐2.

26
Figure 3‐2 Visual Michalis‐Menten curve from depts.washington.edu
For further evaluation of the activity of the disaccharidases and possible inhibitors effect, the catalytic capacity of the enzyme and affinity for substrate termed as Km (mol/l), Vmax (maximum reaction ve‐locity for a given enzyme concentration) and Vo (the initial velocity) is defined. Examples of the use of these terms will be described later in this chapter, despite the results from paper 1 and paper 3.
3.5.1 EnzymeactivityassayThe assay used in the in vitro experiments in papers 1 and 3 is modified from Dahlqvist 1968 (63). This study described an assay for analysing intestinal disaccharidases.
Preparation of cell homogenates All the cell homogenate was pooled in one, and protein was estimated by the method of Lowry et al. using bovine serum albumin (BSA) as the standard (64). Using BSA as a standard demands a precise weighing of BSA for the standard solution. It was validated by the standard curve from measured ab‐sorbance. The absorbance for the cell homogenates read was converted to mg protein/mL from the linearity of the standard curve as showed below.
Y (absstandard) = a x Konc. standard + b,
Konc. Prøve = (Abs prøve / a) – b

27
Caco‐2 cell homogenates corresponding to 3 mg protein/mL were thawed and sonicated and placed on ice, ready for incubation with specific substrate and possible inhibitors.
Incubation conditions Analysing a specific enzyme and how the enzyme works is influenced by several incubation factors e.g. the concentration of substrate molecules, the temperature and pH in the assay.
For kinetic studies of sucrase and maltase, Caco‐2 cell homogenates were used in an assay established with a sucrose or maltose substrate solution at final concentrations of 7, 14, 28, 140, and 280 mM in 0.1 M maleate buffer with pH=6.0. The substrate concentration was determined based on a study investigating the influence of substrate concentration on pig intestinal disaccharidases. It stated that certain intestinal disaccharidases show a marked “substrate inhibition” in too concentrated substrate solutions. Additionally, the study found that a substrate concentration at 280 mM gave an insignifi‐cant “substrate inhibition” and recommend this as a final substrate concentration (65).
The pH can influence the conformation of a protein, and as enzyme activity is crucially dependent on its conformation, its activity will be affected if incubated with incorrect pH uptimum.
Dahlqvist 1964 found that the human intestinal disaccharidases have an optimum at pH 6.0 (66), and based on this a 0.1 M maleate buffer with pH 6.0 was used in this assay.
The temperature is very important, as enzymes are proteins and will denaturate as the upper limit of temperature are reached. Working with human cells leads to a temperature of 37°, and 144 μl of the homogenate was moved to a 1.5 ml eppendorf tube and kept in a 37°C warm water bath.
Then 56 μl of substrate solution was added. After exactly 30 minutes, the released glucose was meas‐ured. No stop reagent was used, as it was difficult to find a suitable reagent which would not alter the pH of the solution. Instead, a very precise time schedule was used based on observations of the la‐boratory equipment (ABX Pentra 400) “finding” the time spent before the actual measurement of released glucose was performed.
Different compounds, L‐arabinose, D‐xylose and fractions of molasses from sugar beets were used as possible inhibitors.

28
Sucrose Sucrase Glucose + Fructose
Glucose + ATP HK Glucose ‐ 6 ‐ Phosphate
Glucose ‐ 6‐ Phosphate + NAD G‐6‐P‐DH Glucose‐6‐ phosphate + NADPH + H+
Released glucose was measured by a reaction with NADP
Principle of measured glucose The released glucose was measured at an ABX Pentra 400 (Horiba, Austria). The principle of measured glucose is an enzymatic method using hexokinase coupled with glucose‐6‐phosphate dehydrogenase (Figure 3‐3).
The amount of glucose released by the enzymatic reaction was linear with the time up to 60 min, so a 30 min reaction time was used. Using an automated machine for glucose determination added some sources of errors to the assay. The ABX Pentra is designed to measure human blood parameters in serum and plasma. The special reagent for measuring glucose was used as well as control and calibra‐tors. In this assay the areas for measuring glucose concentration were all in the low area as the limit of detection is 0.11 mM. Therefore, to ensure constant measurements in the low area, control solu‐tions of 1.0 mM and 0.5 mM were designed and measured before every test in cell homogenates.
Figure 3‐3 The principle of measured glucose. The enzymatic reaction described

29
In figure 3‐4 the results from paper 3 regarding inhibition of maltase are shown. This reflects the Michaelis‐ Menten kinetics and is an indicator of a well‐established assay for measuring disaccha‐ridase activity. L‐arabinose and D‐xylose as inhibitors of maltase activity where Vmax decreased from 29.2 to 25.9 and 24.1 mM substrate cleaved/(min*mg protein) for maltose without inhibitor, 5.6 mM L‐arabinose and 5.6 mM D‐xylose, respectively.
Figure 3‐4 Michaelis‐Menten curves for the substrate (maltose) concentrations 0 – 280 mM without inhibitor (◊) and with 5.6 mM D‐xylose (∆) or 5.6 mM arabinose () as inhibitors of maltase activity. Data are mean±SEM (n=6). S is the substrate concentration and V is the initial velocity of the reaction.
For evaluation of inhibition characteristics and determination of Km, the Michaelis–Menten constant, and Vmax, the maximum reaction velocity, a Lineweaver Burk plot and Hanes plot can be used. A Hanes plot revealed Vmax for L‐arabinose and D‐xylose as inhibitors of maltase activity where Vmax decreased from 29.2 to 25.9 and 24.1 mM substrate cleaved/(min*mg protein) for maltose without inhibitor, 5.6 mM L‐arabinose and 5.6 mM D‐xylose, respectively.
0
0,01
0,02
0,03
0,04
0,05
0,06
0,07
0,08
0,09
0 0,02 0,04 0,06 0,08 0,1 0,12 0,14 0,16
1/Vo
1/[S]
Maltose
5.6 mmol L‐arabinose
5.6 mmol D‐xylose
0
5
10
15
20
25
30
35
0 50 100 150 200 250 300Vo nmol cleved
maltose/(min*m
g protein)
[S] mM maltose
Maltose
5,6 mM Arabinose
5,6 mM Xylose

30
An example of a Lineweaver‐Burke plot with and without L‐arabinose as inhibitor of maltase is showed in figure 3‐5. Lineweaver‐Burke plots showed nearly parallel lines for maltose without inhibi‐tor, 5.6 mM L‐arabinose and 5.6 mM D‐xylose, since the slopes of the lines were not significantly dif‐ferent, thus again indicating uncompetitive inhibition.
Figure 3‐5 Lineweaver‐Burk plot.Maltose with 0.0 mM inhibitor and with 5.6 mM D‐xylose or 5.6 mM arabinose as inhibi‐tors of maltase activity. Data are mean±SEM (n=6).
0
0,01
0,02
0,03
0,04
0,05
0,06
0,07
0,08
0,09
0 0,02 0,04 0,06 0,08 0,1 0,12 0,14 0,16
1/Vo
1/[S]
Malto
5.6 m
5.6 m
0
5
10
15
20
25
30
35
0 50 100 150 200 250 300Vo nmol clev
ed m
altose/(min*m
g protein)
[S] mM maltose

31
4 WHATARETHEPROPERTIESOFPENTOSES–L‐ARABINOSEANDD‐XYLOSE?
Several efforts have been made to identify possible α‐glucosidase inhibitors, and interest in replace‐ment of synthetic foods by natural foods has fostered research into vegetable sources and screening of raw materials to identify these α‐glucosidase inhibitors (67‐70).
4.1 OCCURRENCE,ABSORPTIONANDMETABOLISML‐arabinose and D‐xylose are pentoses composed of five carbon atoms. The pentoses are naturally occurring and part of cell walls in plants as a component in hemicellulose. They are found in plant products like grain, rice, fruit, vegetables and trees (71).
L‐ arabinose is slowly absorbed by simple diffusion in the proximal part of the small intestine (72). A study showed that 85% and 93% of L‐arabinose is absorbed when ingested with wheat bran and psyl‐lium husk, respectively (73). Another study showed that intake of pure L‐arabinose resulted in 58% absorbed when ingesting 5 g L‐arabinose. Furthermore 50% of this was excreted in urine and the rest metabolized in the body (72). This corresponded with the findings of Wyngaarden et al (1958), where ingestion of 10‐20 g L‐arabinose resulted in 51% excreted in the urine(74). Additionally, Andersen et al 1988 found that all absorbed L‐arabinose was metabolized. However the ingested dose in this study was only 4 g and this could lead to speculation about a limited possibility of metabolization in the human body (74).
A study found that D‐xylose is transported over BBM by simple diffusion in humans (75). The excre‐tion is mainly through urine (e.g. 50%) and a small amount is excreted through the bile (e.g. 5%)(74;76). A few animal studies have investigated the energy value of L‐arabinose. These studies indicate that the energy value of L‐arabinose is less than for glucose (15.4 KL/g) (77).
4.2 TOLERABILITYOFL‐ARABINOSEANDD‐XYLOSEL‐arabinose and D‐xylose are naturally occurring in plant materials and eaten every day, which indi‐cates that these pentoses are nontoxic. Although, the tolerated dose has not yet been found, theoret‐ically, L‐arabinose in higher doses can lead to fermentation in the bowl, leading to side effects such as gas production, loose stools and diarrhoea (78). Studies with a dose of 20 g L‐arabinose did not result in diarrhoea (79). An animal study showed that the LD50‐value (median lethal dose, where 50% of the

32
exposed subjects will die) of L‐arabinose in a mice was about 20g /kg (55). This translated to an aver‐age male subject from the interventions in paper 2, with weight 76 kg and height 1.84 m and an esti‐mated LBM of 80%, corresponding to 60.8 kg, leads to an estimated LD50‐value at 20g x 60.8, corre‐sponding to 1.23 kg L‐arabinose. This estimate is the closest we can get to a deadly dose in humans and far from the dose used in paper 2.
Several animal studies have investigated the side effects of ingested D‐xylose and found no side ef‐fects in rats eating a diet containing up to 50% D‐xylose (71). A study by Krog‐Mikkelsen et al investi‐gated the side effects of L‐arabinose after ingesting 1‐3 g of L‐arabinose. Only two out of 15 reported gastrointestinal symptoms like mild diarrhoea, mild flatulence and mild stomach ache. One subject reported severe stomach ache and diarrhoea (13). In paper 2 and paper 3 there were no significant side effects reported. In paper 2, investigating L‐arabinose in a mixed meal, one person reported moderate stomach pain an hour after ingesting test meal A with 5% L‐arabinose added. One person reported moderate rumbling from the intestine after ingesting test meal B with 5% L‐arabinose. An‐other person reported moderate flatulence and diarrhoea after ingested the fluid meal with 20% L‐arabinose added e.g. 15 g of L‐arabinose. In paper 3, two out of 13 subjects reported symptoms after the treatment with pure sucrose, 4 out of 13 subjects reported symptoms after the treatment with 3 g D‐xylose, 5 out of 13 subjects reported symptoms after the treatment with 6 g D‐xylose, and finally 5 out of 13 subjects reported symptoms after the treatment with 6 g L‐arabinose.

33
5 INFLUENCEOFPENTOSESONDISACCHARIDASEACTIVITY
In vitro studies have investigated the effects of L‐arabinose and other pentoses on disaccharidases in cell cultures. The effects on blood sugar and insulin responses have been studied in animals and hu‐mans.
5.1 EVIDENCEFROMINVITROSTUDIESANDANIMALMODELSSeri and collages 1996 investigated L‐arabinose as a potent inhibitor of sucrase and maltase activity using pork intestine mucosa homogenates and pancreatic homogenates from mice (80). The study revealed that L‐arabinose inhibited sucrase in an uncompetitive manner. Furthermore, the study showed a 64.9% inhibition of sucrase activity and 9.6% inhibition of maltase with 10 mM L‐arabinose added and adding 10 mM D‐xylose results in a 57.6% inhibition of sucrase activity and 12.0% inhibi‐tion of maltase (80).
Furthermore, the in vitro studies with Caco‐2 cells showed that L‐arabinose and D‐xylose are potential inhibitors of sucrase and maltase activity, possibly in an uncompetitive way (13;14). A study with Ca‐co‐2 cell homogenates, using the same enzyme kinetic assay as described earlier in this review, re‐vealed that L‐arabinose added in concentrations of 0.84. 1.4, 2.8 mmol L‐arabinose/L resulted in 25, 29 and 38% inhibition of sucrase (13), respectively. In paper 3, we investigated the effects of D‐xylose using the same assay and concentrations of 1.4, 2.8, 5.6 mmol D‐xylose/L revealed an enzyme inhibi‐tion of 24.6, 37.9 and 48.7%, respectively. Additionally, we investigated L‐arabinose and D‐xylose and their effect on maltase activity in the caco2 cells homogenate and found that 5.6 mM L‐arabinose and D‐xylose inhibits maltase activity by 11.3 and 17.4%, respectively (14).
These results were further investigated in mice and rats. Seri and colleagues 1996 investigated L‐arabinose and D‐xylose in mice and rats as well. They found that mice given 0, 12.5, 25, 50 mg /kg L‐arabinose or D‐xylose in a 1 g /kg sucrose load suppressed the increase of plasma glucose levels. However, the effect of D‐xylose was 2,4 times less pronounced. They found no effects after 1 g/kg starch loading. Furthermore, they found that 100 g/kg L‐arabinose in a 2.5 g/kg sucrose solution sig‐nificantly suppressed the increase in plasma glucose and insulin levels in fasted rats (55)
Another study with rats fed with sucrose and L‐arabinose found a reduced plasma insulin level and a significant reduced triacylglycerol concentration in both the liver and in plasma after a feeding (81).
Preuss and colleagues performed both acute and subchronic studies on rats, examining the ability of different enzyme inhibitors, including L‐arabinose, to affect alpha‐glucosidase activity when ingesting a rice starch. The rats were gavaged with either water or water plus inhibitors, followed by a meal

34
containing sucrose, rice starch or both. The overall conclusion for inhibition in the different meals for L‐arabinose was a significant reduction in blood glucose levels after sucrose challenges and a non‐significant reduction after rice starch (82). In a later study, Preuss and collages showed that the inhibi‐tory effects found in the first study last, even after weeks of constant intake in rats (83). An abstract from a Japanese study found similar effects in rats ingesting sucrose added D‐xylose or L‐arabinose. Here, an inhibiting effect of both sucrase and maltase was found, but the inhibitory activities of malt‐ase was weaker than that of sucrase (84)
5.2 EVIDENCEFROMHUMANINTERVENTIONSTUDIESA few human studies have investigated the effects of both L‐arabinose and D‐xylose. To verify the promising in vitro results and results from animal studies, L‐arabinose and D –xylose were investigat‐ed in humans. The focus in the few studies has been L‐arabinose added to sucrose drinks or different high sucrose containing beverages,e.g. jelly. An abstract from a Japanese study reported the effects of sucrose beverage or meal supplemented with L‐arabinose in both healthy individuals and T2D pa‐tients(85). The first experiment included 8 healthy subjects, and after ingesting a sucrose beverage added 2% L‐arabinose, a decrease in blood glucose was found. The second experiment included an evaluation of the dose response in 40 healthy subjects given a jelly containing 30 g of sucrose with or without 2%, 3% or 4% added L‐arabinose. A parallel design with 10 subjects in each group showed a decrease in blood glucose after intake of 3% and 4% added L‐arabinose. The third experiment includ‐ed T2D patients and found a similar decrease in blood glucose when given jelly added 3% L‐arabinose (85). These results agree with the results in a study done by Krog‐Mikkelsen and colleagues. Fifteen healthy subjects were enrolled in this study, a randomized double‐blinded, crossover study. The sub‐jects were given a sucrose drink (75g sucrose in 300 ml water) supplemented with 0%, 1.3%, 2.7% and 4% L‐arabinose. Supplementation with 4% L‐arabinose gave a decreased glucose peak (Figure 5‐1), a decreased and delayed insulin peak and a reduction in the incremental area under the curve (iAUC) for insulin (Figure 5‐1). Furthermore a lower and delayed C‐peptide peak and reduction in iAUC for c‐peptide were found (14), meaning that a given amount of sugar supplemented with L‐arabinose can lead to favourable postprandial response of both blood glucose fluctuations and insulin secretion.

35
Figure 5‐1 Mean (6SEM) serum concentrations of glucose, insulin, and C‐peptide in 15 normal‐weight to slightly overweight men after intakeof sucrose beverages supplemented with 0 (), 1 (◊), 2 (x), or 3 (∆) g L‐arabinose. Glucose [peak, P = 0.001; time to peak, P = 0.133; incremental area under the curve (iAUC), P = 0.245], insulin (peak, P , 0.0001; time to peak, P = 0.002; iAUC, P = 0.017), C‐peptide (peak, P , 0.0001; time to peak, P = 0.07; iAUC, P = 0.36). Peak values and iAUC were evaluated by using ANCOVA, with fasting values as covariates; time to peak values were evaluated by using ANOVA. Post‐prandial response curves were evaluated by repeated‐measures ANCOVA.
0
250
500
750
1000
1250
1500
1750
2000
0 15 30 45 60 75 90 105 120 135 150 165 180
Ser
um C
-pep
tid (p
mol
/L)
Time (min)
3,5
4
4,5
5
5,5
6
6,5
7
7,5
0 15 30 45 60 75 90 105 120 135 150 165 180
Ser
um g
luco
se (m
mol
/L)
Time (min)
0
50
100
150
200
250
300
0 15 30 45 60 75 90 105 120 135 150 165 180
Ser
um in
sulin
(pm
ol/L
)
Time (min)

36
In addition, D‐xylose was tested as an alpha‐glucosidase inhibitor in humans. Bae and colleagues 2011 investigated the inhibitory effects of D‐xylose in two different concentrations and mixed with other macronutrients. The first experiment included 49 healthy subjects ingesting 50 g of sucrose in 130 ml of water containing 0, 5 or 7.5g and D‐xylose powder. The second experiment (n=50) tested a meal supplemented with 10% and 15% D‐xylose. In all cases postprandial glucose and insulin decreased significantly (12). Similar results were found in a randomized double blinded cross–over study with 13 healthy subjects given 4 and 8 w/w% D‐xylose in a sucrose drink (75g sucrose in 300 ml water) and 8 w/w % L‐arabinose (Paper 3) (14). Here a declined blood glucose peak, as well as a decreased and delayed insulin peak was found (Figure 5‐2). The 8 w/w % L‐arabinose was an addition to the earlier mentioned study with 4 w/w % added L‐arabinose(13) and the resultsshow a dose‐response effect.

37
Figure 5‐2 Serum concentrations of glucose, insulin and C‐peptide in 13 normal male subjects after intake of sucrose bever‐ages supplemented with 0 (∆), 3 (), 6 (x) grams D‐xylose or 6 (◊) grams of L‐arabinose. Data are mean (± SEM). iAUC = incremental area under the curves. S‐Glucose: Peak, P=001. Time to peak, P=0.133. iAUC, P=0.245. S‐Insulin: Peak, P<0.0001. Time to peak, P=0.002. iAUC, P=0.017. S‐C‐Peptide: Peak, P < 0.0001. Time to peak, P=0.07. iAUC, P=0.36. Peak values and iAUC were evaluated using analysis of covariance with fasting values as covariates, and time to peak values using analysis of variance. Postprandial response curves were evaluated by repeated measurements analysis of covariance.
These results from a sucrose drink added L‐arabinose and D‐xylose constituted the basis for the fur‐ther investigations of L‐arabinose. However, the use of higher dietary doses of sucrose would be un‐feasible in terms of palatability in the human population. Such research would have little clinical ap‐plication because very few people consume sugars in the quantities, e.g. 75 g of sucrose, used in the
38
previously mentioned studies. Furthermore, we wanted to investigate our main glucose supplying carbohydrate, starch, and the possible inhibiting effects of L‐arabinose on maltase.
These considerations led to investigation of effects of L‐arabinose in a food matrix resembling normal meals rather than sucrose drink.
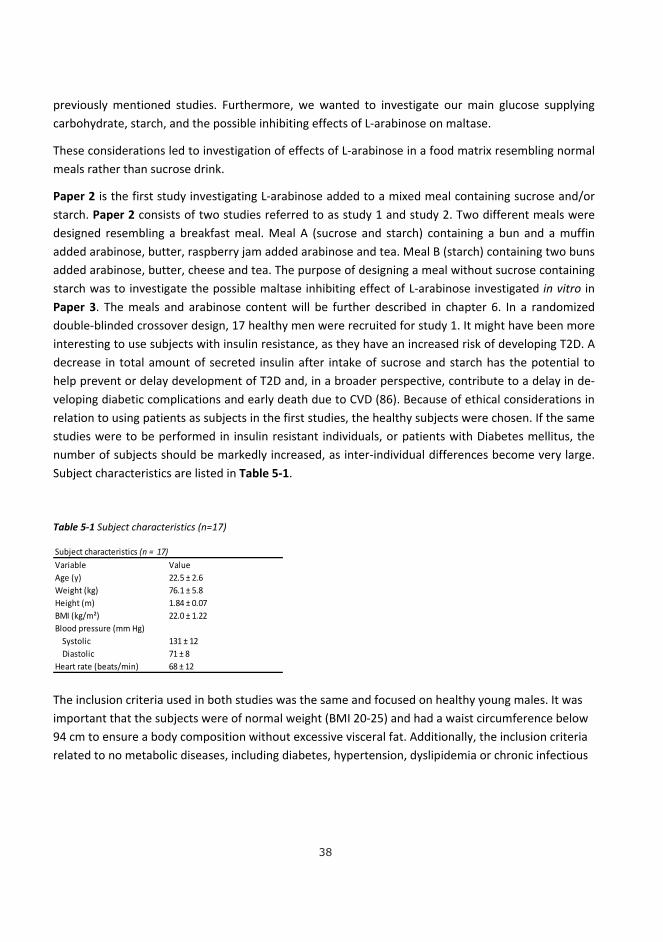
Paper 2 is the first study investigating L‐arabinose added to a mixed meal containing sucrose and/or starch. Paper 2 consists of two studies referred to as study 1 and study 2. Two different meals were designed resembling a breakfast meal. Meal A (sucrose and starch) containing a bun and a muffin added arabinose, butter, raspberry jam added arabinose and tea. Meal B (starch) containing two buns added arabinose, butter, cheese and tea. The purpose of designing a meal without sucrose containing starch was to investigate the possible maltase inhibiting effect of L‐arabinose investigated in vitro in Paper 3. The meals and arabinose content will be further described in chapter 6. In a randomized double‐blinded crossover design, 17 healthy men were recruited for study 1. It might have been more interesting to use subjects with insulin resistance, as they have an increased risk of developing T2D. A decrease in total amount of secreted insulin after intake of sucrose and starch has the potential to help prevent or delay development of T2D and, in a broader perspective, contribute to a delay in de‐veloping diabetic complications and early death due to CVD (86). Because of ethical considerations in relation to using patients as subjects in the first studies, the healthy subjects were chosen. If the same studies were to be performed in insulin resistant individuals, or patients with Diabetes mellitus, the number of subjects should be markedly increased, as inter‐individual differences become very large. Subject characteristics are listed in Table 5‐1.
Table 5‐1 Subject characteristics (n=17)
The inclusion criteria used in both studies was the same and focused on healthy young males. It was important that the subjects were of normal weight (BMI 20‐25) and had a waist circumference below 94 cm to ensure a body composition without excessive visceral fat. Additionally, the inclusion criteria related to no metabolic diseases, including diabetes, hypertension, dyslipidemia or chronic infectious
Variable ValueAge (y) 22.5 ± 2.6Weight (kg) 76.1 ± 5.8Height (m) 1.84 ± 0.07BMI (kg/m²) 22.0 ± 1.22Blood pressure (mm Hg) Systolic 131 ± 12 Diastolic 71 ± 8Heart rate (beats/min) 68 ± 12
Subject characteristics (n = 17)

39
diseases, as this could disturb the glucose metabolism. No subjects with gastrointestinal diseases were included, as this could disturb the digestion process and thereby affect the postprandial re‐sponse. No women were included because of the possible disturbance of their hormonal cycle.
Sample size was calculated from the minimum difference to be detected for postprandial C‐peptide concentrations reached in the study by Krog‐ Mikkelsen et al 2011.
Postprandial glucose, insulin and C‐peptide were measured and peak, time to peak and iAUC were used as endpoints. C‐peptide and insulin are secreted in equivalent amounts, and as insulin is elimi‐nated from the blood much faster than C‐peptide, it is possible to use C‐peptide as a more precise measurement of serum insulin concentrations (87).
The postprandial response was measured over a time period of three hours. The magnitude and time of the peak plasma glucose depends on a variety of factors, including the timing of measurement and the quantity and composition of the meal. It rarely exceeds 7.7 mmol/l. In non‐diabetic individuals, plasma glucose peaks about 30‐60 minutes after the start of a meal, and because of this the blood samples were drawn within every 15 minutes in the first hour. Normally plasma glucose returns to pre‐prandial levels within 2 – 3 hours.
L‐arabinose was added as w/w% of sucrose and/or starch and in a dose‐response setup. Concentra‐tions of 5% and 10% L‐arabinose were added to the meals in study 1 based on the study in paper 3, where 8 w/w% L‐arabinose was added to a sucrose drink and showed a lower and delayed insulin and c‐peptide peak as well as a reduction in iAUC (14). See figure 5‐1. In study 1, L‐arabinose correspond‐ing to 3 ‐ 6 g was added to a meal, which is a tolerable dose and possible to administrate in a normal meal.
The overall results from study 1 in paper 2 showed no effect on post prandial blood glucose, insulin and C‐peptide when 5 w/w % and 10 w/w % L‐arabinose were added to mixed meals containing either sucrose and/or starch.
All statistical analyses and calculations were performed using the Statistical Analysis System software package, version 9.2 (SAS Institute Inc., Cary, NC). For the incremental area under the curve (iAUC) or above the curve (iAOC), ignoring the area beneath (or above in the case of iAOC), the fasting concen‐tration was calculated geometrically by applying the trapezoid rule. The iAUC or the iAOC were calcu‐lated for the entire test period for 0 to 180 minutes. Postprandial response curves were evaluated by comparing peak values and the incremental area under the curve (iAUC) using analysis of covariance with fasting values as covariates, and time to peak values using analysis of variance. A repeated measures ANCOVA analysis was used to examine the effect of meal and time on the postprandial re‐sponse curves. Data were controlled for homogeneity of variance veried by residual plots, and as‐

40
sumption of normal distribution was investigated using normal probability plots and histogram plots. A significant result was followed by using a Tukey‐Kramer test for post hoc analysis. All data are pre‐sented as means ± SEM, unless otherwise indicated, and the statistical signicance level is dened as p < 0.05. The main findings for meal A containing sucrose and starch were no difference in postpran‐dial blood glucose, insulin and C‐peptide, regardless of the dose of L‐arabinose added. See Figure 5‐3.

41
Figure 5‐3 Mean (±SEM) plasma and serum concentrations of glucose, insulin, and C‐peptide in 17 normal men after intake of Meal A consisting of a bun and a muffin added arabinose, butter, raspberry jam added arabinose and tea with 0, 5 and 10 w/w % L‐arabinose of sucrose and starch. No significant effects of peak, time to peak or iAUC.
0
50
100
150
200
250
0 50 100 150 200
Serum in
sulin
(pmol/L)
Time (min)
A controlA 5 % araA 10 % ara
0
500
1000
1500
2000
2500
0 50 100 150 200
Serum C‐pep
tide (pmol/L)
Time (min)
A controlA 5 % araA 10 % ara
4
4,5
5
5,5
6
6,5
7
7,5
0 15 30 45 60 90 120 180
Plasma glucose (m
mol/L)
Time (min)
A control
A 5 % ara
A 10 % ara
42
Meal B showed no effects on glucose, insulin or C‐peptide after ingestion of L‐arabinose mixed in a starch meal containing up to 10% L‐arabinose. A few significant results were found in Test meal B for iAUC for insulin and C‐peptide. These results were rather conflicting, showing greater insulin and C‐peptide response to meal B with 0 % L‐arabinose than meal B with 10 % L‐arabinose shown in figure 5‐4 below.

43
Figure 5‐4 Mean (±SEM) plasma and serum concentrations of glucose, insulin, and C‐peptide in 17 normal men after intake of Meal B, consisting of two buns added arabinose, butter, cheese and tea with 0, 5 and 10 w/w % L‐arabinose of sucrose and starch. No significant effects of peak, time to peak. iAUC where meal with 10 % arabinose had a 8% greater iAUC than the meal with 0% arabinose (P=0.022).
0
50
100
150
200
250
300
0 50 100 150 200
Serum in
sulin
(pmol/L)
Time (min)
B controlB 5 % araB 10 % ara
0
500
1000
1500
2000
2500
0 50 100 150 200
Serum C‐pep
tide (pmol/L)
Time (min)
B controlB 5 % araB 10 % ara
4
4,5
5
5,5
6
6,5
7
7,5
0 15 30 45 60 90 120 180
Plasma glucose (m
mol/L)
Time (min)
A control
A 5 % ara
A 10 % ara

44
To explain these results, study 2 in Paper 2 was designed. The thoughts and considerations about the results in study 1 included reflection about the effect of a solid meal compared to a fluid meal on gas‐tric emptying rate. Comparing c‐peptide time to peak from a solid meal with results from the sucrose drink meal, the solid meal showed a delay in time to peak. This indicates that the presence of sucrose and L‐arabinose in the small intestine is influenced differently between a fluid meal and a solid meal. This is most likely to have an influence on the postprandial parameters. Another reflection regarded the possible dilution of water and salt in the stomach after ingesting a mixed meal, leading to dilution of the gastric volume and a possible effect on the dose of L‐arabinose.
Based on these reflections, study 2 in paper 2 was designed. Two different versions of meal B were used, the solid version, a semi‐solid version and a fluid version with maltose and 20 % L‐arabinose added in 300 ml water. Further description of meal composition is found in chapter 6. Maltose was chosen in the fluid meal to validate the in vitro studies of maltase activity. For investigation of GER, paracetamol was ingested together with all three meals. This method is further described in chapter 7.
A randomized double blinded cross‐over design was used again with same setup and inclusion criteria as in study 1. Six healthy men were recruited, three subjects participated in both study 1 and study 2. The subject characteristics are listed in Table 5‐2.
Table 5‐2 Subject characteristics (n=6)
The postprandial results for glucose, insulin and C‐peptide revealed no effects of 20% arabinose add‐ed to the solid, the semisolid and the fluid meal. The three following figures (Figure 5‐5, Figure 5‐6, Figure 5‐7 ) show the postprandial curves for the three meals.
Variable ValueAge (y) 23.3 ± 2.9Weight (kg) 74.9 ± 3.3Height (m) 1.83 ± 0.03BMI (kg/m²) 22.4 ± 1.4Blood pressure (mm Hg) Systolic 127 ± 12 Diastolic 70 ± 4Heart rate (beats/min) 60 ± 6
Subject characteristics (n = 6)

45
Figure 5‐5 Mean (±SEM) plasma and serum concentrations of glucose, insulin, and C‐peptide in 6 normal men after intake of Solid Meal B consisting of two buns added arabinose, butter, cheese and tea with 0 and 20 w/w % L‐arabinose of starch. No significant effects of peak, time to peak, and iAUC.
4
4,5
5
5,5
6
6,5
7
0 15 30 45 60 90 120 180
Plasma glucose (m
mol/L)
Time (min)
Solid control
Solid 20 % ara
0100200300400500600700800
0 gns 15 30 45 60 90 120 180
Serum in
sulin
(pmol/L)
Time (min)
Solid contrSolid 20 %
0200400600800
100012001400160018002000
0 15 30 45 60 90 120 180
Serum C‐pep
tide (pmol/L)
Time (min)
Solid controlSolid 20 % ar

46
Figure 5‐6 Mean (±SEM) plasma and serum concentrations of glucose, insulin, and C‐peptide in 6 normal men after intake of Semi‐solid Meal B consisting of two buns added arabinose, butter, cheese and tea with 0 and 20 w/w % L‐arabinose of starch. No significant effects of peak, time to peak, and iAUC.
4
4,5
5
5,5
6
6,5
7
7,5
0 15 30 45 60 90 120 180
Plasma glucose (m
mol/L)
Time (min)
Semi solid control
Semi solid 20 % ara
0100
200300
400
500600
700800
0 gns 15 30 45 60 90 120 180
Serum in
sulin
(pmol/L)
Time (min)
Semi solid control
Semi solid 20 % ara
0
200
400
600
800
1000
1200
1400
1600
1800
2000
0 15 30 45 60 90 120 180
Serum C‐pep
tid (p
mol/L)
Time (min)
Semi solid controlSemi solid 20 % ara

47
Figure 5‐7 Mean (±SEM) plasma and serum concentrations of glucose, insulin, and C‐peptide in 6 normal men after intake of maltose drink with 75 g of maltose in 300 ml water added 0 and 20 w/w % L‐arabinose. No sig‐nificant effects of peak, time to peak, and iAUC.
Overall, it was not possible to reproduce the beneficial/favourable effects of L‐arabinose tested in sucrose drinks when L‐arabinose was mixed in a meal. Furthermore, thefluid malt‐ose drink (Figure 5‐7) could not validate the in vitro studies on maltase activity.
44,55
5,56
6,57
7,58
8,59
0 15 30 45 60 90 120 180
Plasma glucose (m
mol/L)
Time (min)
Fluid control
Fluid 20 % ara
0100200300400500600700800
0 gns 15 30 45 60 90 120 180
Serum in
sulin
(pmol/L)
Time (min)
Fluid controlFluid 20 % ara
‐100100300500700900
11001300150017001900210023002500
0 15 30 45 60 90 120 180
Serum C‐pep
tid (p
mol/L)
Time (min)
Fluid control
Fluid 20 % ara

48

49
6 MEALDESIGNThe design of the test meals was based on sucrose and starch containing foods and the pos‐sibility of adding L‐arabinose to the foods. Two test meals, referred to as A and B, were de‐signed and used in study 1 and study 2 in paper 2. The test products used were buns and muffins and L‐arabinose was baked in the buns and muffins. The recipes are described in Table 6‐1 and Table 6‐2.
Buns and muffins were chosen for technical reasons as the bakery was able to mix arabinose into the dough.
At the same time these starch containing products are known in most of the world and in‐gested in most cultures in considerable amounts. One may worry what would be the effect of long baking time at high temperature, as would be the case in different types of bread.
Table 6‐1 Recipes for buns. Weight 70 g/ bun
Table 6‐2 Recipes for muffins. Weight 50 g/muffin.
Muffin (g) w % starch % sucrose % starch+sucrose %Ingredients Margarine 1000 14.29Milk 850 12.14Sugar 2200 31.43 31.43Egg 1000 14.29Wheat flour* 1600 22.86 15.45 0.09Baking powder** 50 0.71 0.29Crème powder incl. vani 300 4.29 3.69Total 7000 100 19.42 31.52 50.94* 67.6 % starch, 0.4 % sucrose and 2.5 % fiber ** 40 % starch *** 86 % starch Weight 50 gram/muffin
Bun (g) w % starch % sucrose % starch+sucrose % Ingredients Water 1000 29.94Yeast 80 2.40Yellow baking syrup* 100 2.99 0.99Fibrex 595 30 0.90Margarine 200 5.99Milk powder 100 2.99Salt 30 0.90Wheat flour** 1800 53.89 36.43 0.22Total 3340 100 36.43 1.20 37.63* 33% sucrose** 67.6 % starch, 0.4 % sucrose and 2.5 % fiberWeight 70 gram/bun
Muffin (g) w % starch % sucrose % starch+sucrose %Ingredients Margarine 1000 14.29Milk 850 12.14Sugar 2200 31.43 31.43Egg 1000 14.29Wheat flour* 1600 22.86 15.45 0.09Baking powder** 50 0.71 0.29Crème powder incl. vanilla 300 4.29 3.69Total 7000 100 19.42 31.52 50.94* 67.6 % starch, 0.4 % sucrose and 2.5 % fiber ** 40 % starch *** 86 % starch Weight 50 gram/muffin

50
The test products were combined in a meal with butter, cheese or jam and tea in the at‐tempt to design a meal resembling a breakfast meal. The meal designs are shown in Table 6‐3.
Table 6‐3 Meal design for meal A and meal B.L‐Arabinose is added to the raspberry jam in 5 and 10 w/w% of sucrose and starch.
Meal A with sucrose and starch contained 2 MJ in total with 8.4 E% of protein, 34.3 E% fat and 57.4 E% carbohydrate. The test meal B with starch contained 2.1 MJ in total, with 13.5 E% protein, 29.1 E% fat and 57.4 E% carbohydrate. The official Danish dietary recommenda‐tions for the distribution of energy are 50 – 60 E% from carbohydrate, maximum 30 E% from fat and 10 – 15 E% from protein. Accordingly, the energy in the two test meals did not quite meet the recommendations for fat and protein content. A larger survey from the Danish Technical University showed that 15‐19 year old persons consume on average 29 E% fat, 9 E% protein and 57 E% carbohydrate for breakfast(88),equivalent to the meal design in this investigation.
The focus was on the content of sucrose and starch and the acceptable size of the meals, having the postprandial plasma glucose and insulin response as the endpoints. Juntunen KS et al showed that a meal containing wheat bread with 50 g of available carbohydrate in‐duced a rise of up to 7 mmol/l in glucose levels and a return to basal level within 3 hours in healthy persons (89). This was desirable conditions and the design of the two meals corre‐sponded to a minimum of 50 g of available sucrose and/or starch.
Buns and muffins were baked with 0%, 5%, 10%, and 20% L‐arabinose. The bakery at Nordic Sugar A/S in Arløv, Sweden provided the buns and muffins and L‐arabinose was purchased from Danisco, Denmark. Sucrose, starch and L‐arabinose contents for meal A and B are
Meal A: Ingrediens control 5% L‐arabinose 10% L‐arabinose
Bun 1 1 1
Butter, Lurpak (g) 10 10 10
Rasberry jam (g) 20 20 20
Muffin 1 1 1
Water (ml ) 200 200 200
Tea (ml) 100 100 100
Meal B: Ingrediens control 5% L‐arabinose 10% L‐arabinose
Bun 2 2 2
Butter, Lurpak 10 10 10
Cheese 45+ 20 20 20
Water 200 200 200
Tea 100 100 100
Meal A: Ingrediens control 5% L‐arabinose 10% L‐arabinose
Bun 1 1 1
Butter, Lurpak (g) 10 10 10
Rasberry jam (g) 20 20 20
Muffin 1 1 1
Water (ml) 200 200 200Tea (ml) 100 100 100
Meal B: Ingrediens control 5% L‐arabinose 10% L‐arabinose
Bun 2 2 2
Butter, Lurpak 10 10 10
Cheese 45+ 20 20 20
Water 200 200 200Tea 100 100 100

51
shown in table 6‐4. L‐arabinose was additionally added to the jam in meal A, in balance with the sucrose content in raspberry jam.
Table 6‐4 Sucrose, starch and L‐arabinose content in Meal A and Meal B.
In study 2, one of the objectives was to evaluate the texture of the meal and the effect on GER measured by adding paracetamol. A solid meal, a semi sold meal and a fluid meal were designed using the design in test Meal B with 20% L‐arabinose.
Another issue to discuss is the possibility of dilution with water and salt in the stomach and therefore the dose was increased to 20% of L‐arabinose, corresponding to 10 g of L‐arabinose in the solid and semisolid meal Figure 6‐4 presents the content of arabinose in the meal and 20 % L‐arabinose
The semisolid meal was prepared as a porridge where buns, cheese, butter and 150 ml of water were blended in a food processor. The fluid test meal contained 75 g of maltose in 300 ml water with and without 20%, L‐arabinose added, corresponding to 15 g L‐arabinose.
6.1 L‐ARABINOSERECOVERYTo assess the amount of arabinose in the test meals, the buns and muffins were analysed after baking to determine if the arabinose was lost during the process.
The buns and muffins were analysed for L‐arabinose content before baking to verify the added L‐arabinose. The analyses were carried out at the Department of Animal Science, Molecular Nutrition and Cell Biology, University of Aarhus.
Two different methods were used for determination of L‐arabinose. Direct hydrolysis; swell‐ing with 12 M H2SO4 followed by hydrolysis with 2 M H2SO4 (90) was used to analyse the buns. The second method applied on the muffins was direct hydrolysis following removal of lipids by extraction with acetone. L‐arabinose in the extracts or hydrolysates was reduced with
Meal A Sucrose Starch Sucrose+Starch L‐Arabinose % L‐Arabinose of (g) (g) (g) (g) Sucrose+starch
0 26,6 35,22 61,82 0 05% 26,19 34,51 60,7 2,99 4,910% 25,81 33,82 59,63 5,88 9,9
Meal B Sucrose Starch Sucrose+Starch L‐Arabinose % L‐Arabinose of (g) (g) (g) (g) Sucrose+starch
0 1,68 51,02 52,7 0 05% 1,66 50,08 51,74 2,5 4,810% 1,62 49,16 50,78 4,92 9,720% 1,68 51,02 52,7 10,2 19,4

52
potassium borohydride to the corresponding sugar alcohol, which was acetylated with acetic anhy‐dride using N‐methyl imidazole as a catalyst (91) before the gas chromatography analysis. The dry matter content in buns and muffins was determined by freeze‐drying.
The results were about 90% and 70% recovery of L‐arabinose in buns and muffins respectively (Table
6‐5).
Table 6‐5 Recovery of L‐arabinose in buns and muffins used in paper 2.The added arabinose is corrected for DM % compared with the amount of arabinose (g/100 g dm) determined by hydrolysis.
100% recovery was expected and further analyses of the dough were performed to investi‐gate if L‐arabinose was somehow affected by the baking process. Results from analysing the dough from buns and muffins revealed the same recovery. The recovery of L‐arabinose in muffins was further investigated, and the difference in fat content led to the method of ex‐tracting fat before hydrolysis.
We never found an explanation for the recovery of less than 100%, but are confident that the problem is based in the laboratory, and not in the bakery.
Accordingly, we assumed that all L‐arabinose added was available in the meal and ingested, and that the poor recovery of L‐arabinose was technical.
Bun 5% 68.395 1.79 2.62 2.45 93.5%
Bun 10 % 70.275 3.52 5.01 4.75 94.8 %
Bun 20 % 68.55 8.1 9.9 9.1 81%
Muffin 5% 83.34 2.48 2.97 2.1 70.7%
Muffin 10 % 82.31 4.85 5.89 4.5 76.4%
Recovery(%)
Added arabinose (g) Corrected for DMSampel DM (%)
Added L-arabinose (g)
Arabinoserecovered (g)*

53
7 INFLUENCEOFGASTRICEMPTYING
The disappointing results from study 1 led to an explanatory study investigating the effects of ingested foods on postprandial blood parameters to answer questions raised in paper 2
The digestive process starts by the disintegration of the food and further enzymatic break‐down into smaller nutrients to be absorbed from the intestine to the bloodstream. The en‐zymatic disintegration of solid foods starts in the mouth, followed by a gastric process that is less understood. Due to the complexity of gastric digestion of foods, which involves factors like fed/fast state, gastric acid production, enzymatic reactions and hydrodynamic and me‐chanical forces, there are several mechanisms to be considered when testing effects of sub‐stances in mixed meals (42).
The rate of gastric emptying is one of these factors, being a rate‐limiting step in delivering the disintegrated foods to the duodenum and small intestine for further digestion and ab‐sorption. Several studies have showed that the rate of gastric emptying is affected by the composition of the food and there is a longer transition time for solid foods compared with fluid foods(92). This delayed gastric emptying after ingesting solids could affect the presen‐tation of L‐arabinose, disaccharides and starch to the epithelium of the small intestine. To reveal the possible effect of GER, an indirect measurement of gastric emptying was imple‐mented in paper 2.
Various methods are available to assess emptying of the stomach; of which scintigraphy is the best validated and considered the golden standard (93;94). However, scintigraphic measurements mean exposure to radioactive isotopes. Therefore, a more simple and easy to perform method is used in this study. Willems and colleagues found that the paracetamol method generally correlates well to scintigraphy of liquid‐phase gastric emptying (95). Orally administrated paracetamol is poorly absorbed by the stomach but is rapidly absorbed from the small intestine. Since gastric emptying is a rate‐limiting step, it is believed that the rate of appearance of paracetamol in the blood reflects the rate of gastric emptying (96).
A standardization of a paracetamol absorption test for gastric absorption is not described in the literature but recently a literature study by Willems and colleges stated some guidelines for standardization of the method. Considerations include fasting prior to the test, use of meal composition and type e.g. mixed/liquid meal, dose of paracetamol and administration procedures.
The study was designed to use one of the two meals from study 1. Meal B was selected be‐cause of the above‐mentioned perspectives of starch intake and in addition the dose of L‐arabinose was increased to 20% added L‐arabinose. The texture of the meal used could lead to questions about the suitability of the paracetamol method. It is easier to measure the

54
emptying of liquid meals but the emptying of mixed fluid and solid meals is the true reflec‐tion of what happens during normal life, and thus more clinically relevant . Several studies have used the paracetamol method with solid foods, both baked into bread or given dis‐solved in water, and these studies have found the method suitable (89;97). Maddern et al 1985 found that a solid meal, a burger, and an iso‐caloric liquid meal affected the liquid markers equally (98).
Subjects were given 1.5 g of paracetamol dissolved in 50 ml water. A few studies have used this solution, but often 200‐300 ml of water is used. The reason for using the 50 ml was the concern of changing the composition of meal B in relation to fluids, as the purpose of study 2 was to help explain the lack of results in study 1.
The paracetamol test was performed after 12 hours fasting. The subjects were instructed in ingesting the paracetamol solution together with their test meal. Blood was drawn at 0, 30, 45, 60, 75, 90, 105, 120 and 180 minutes for paracetamol determination. The results are presented in Figure 7‐1 for solid, semi‐solid and fluid meals respectively. For evaluation of GER; Cmax, Tmax and AUC was calculated. Other parameters and calculations of paracetamol absorption have been proposed(95), such as a ratio C(2t)/C(t) where C(t) is the paracetamol concentration at a given time. This ratio reflects the slope of the time‐concentration curve and only requires two blood samples. The appropriate time t has not yet been settled, but 15‐30 min after dosing was reported to be suitable for the assessment of GE (99).

55
Figure 7‐1 Mean serum paracetamol concentrations in the solid, semi‐solid and fluid meals with 1.5 g of parace‐tamol in solution added. No significant results for AUC and Cmax. Tmaxsolid meal (top) 35 minutes compared to 88 minutes for the semi‐solid meal (P= 0.08) and 118 minutes for the fluid meal (P < 0.0001).
0
0,02
0,04
0,06
0,08
0,1
0,12
0 30 45 60 75 90 105 120 180
Paracetamol (m
mol/L)
Time (min)
Solid (n=12)
0
0,01
0,02
0,03
0,04
0,05
0,06
0,07
0,08
0 30 45 60 75 90 105 120 180
Paracetamol (m
mol/l)
Time (min)
Semi solid meal (n=12)
0
0,01
0,02
0,03
0,04
0,05
0,06
0,07
0,08
0 30 45 60 75 90 105 120 180
Paracetamol (m
mol/L)
Time (min)
Fluent Meal (n=12)
56
Analysing the result gives no significant difference in AUC or Cmax in the three meals, indicat‐ing that the absorbed amount/fraction is the same, and that the absorption of paracetamol is not hampered by differences in binding to food components. Tmax was different in the three meals, being fastest with the solid meal and slowest with the fluid meal. If paraceta‐mol had accompanied the meal, the opposite results would be expected. Tmax for the solid meal was 35 minutes compared to 88 minutes for the semi‐solid meal (P= 0.08) and 118 minutes for the fluid meal (P < 0.0001). Finally the C(2t)/C(t) ratio was 0.8, 1.06, and 1.48 for the solid, semi‐solid and fluid meals respectively. Further analysis of correlation between Tmax and peak values for glucose, insulin and paracetamol showed no correlation.
The GER in the fluid meal was faster than the semi‐solid meal. Analysing the GER after in‐gesting the solid meal indicates that the paracetamol is washed out/by‐passed with the fluid part of the chyme. The explanation is probably that paracetamol was administered as a drink and not processed into the bakery products. On the other hand, the differences in the pat‐tern for the appearance of paracetamol in the blood strongly indicate that gastric emptying is markedly different in our test meals, although the specificity of the findings is obviously low. We suspect that gastric emptying is one of the explanations for the lack of findings with the solid and mixed meals. Obviously, it cannot be the only explanation when no correlation between Tmax and peak values for glucose, insulin and paracetamol was found.
The rate of gastric emptying in many diabetic patients is markedly different from healthy subjects(100),but is unknown in a pre‐diabetic group of insulin‐resistant individuals.
57
8 POLYPHENOLS–INFLUENCEONDISACCHARIDASESA growing interest in functional foods has stimulated extensive research into polyphenols in plants.
Several thousand molecules with a polyphenol structure have been identified in higher plants, and several hundred in edible plants. These molecules are secondary metabolites in plants, and play a role in the defence against ultraviolet light and attacks from pathogens (101) . Polyphenols are abundant micronutrients in our diet, and are found in foods like fruits, vegetables, flour, tea, red wine, cocoa, and major antioxidants in our diet. Evidence for their role in the prevention of chronic diseases like cancer, cardiovascular diseases and diabetes mellitus is emerging (67;69;70). The antioxidant properties of polyphenols are in focus but also important effects on carbohydrate metabolism have been reported. Among other steps, intestinal brush border enzyme activities have been investigated (68).
Polyphenols represent a wide variety of compounds and the structural diversity of polyphe‐nols extends from simple one‐phenol hydroxybenzoic‐ and hydroxycinnamic acid to large polymeric macromolecules like proanthocyanidins and ellagitannins. They can be divided into classes such as: hydroxybenzoic acids, hydroxycinnamic acids, anthocyanins, proantho‐cyanidins, flavonoids, stilbenes, and lignans (102).
The variability of polyphenol content in foods differs and in most cases, foods contain com‐plex mixtures of polyphenols, which are often poorly characterized. The content is influ‐enced by numerous factors such as variety, production practices at a particular processing plant, environmental factors and by storage conditions. Also type of soil, sun exposure and water affects the content, and consequently, considerable variation is found (102).
Bioavailability of polyphenols is essential if their health effects are to be understood. The bioavailability differs greatly from one polyphenol to another, thus the most abundant poly‐phenols in our diet are not necessarily those leading to the best absorption and highest con‐centration of active metabolites in plasma (101;102).
Studies on polyphenol compounds and their effects on intestinal brush border enzymes have been investigated, including several studies in animals, especially mice, rats and rabbits. A variety of polyphenols has been shown to inhibit α‐glycosidase activity in vitro. The inhibito‐ry polyphenols include flavonoids (anthocyanin, catechins, flavanones, flavonols, flavones and isoflavones), phenolic acids (caffeic acid, chlorogenic acid, ferulic acid, gallic acid and tannic acid) and tannins (68).
The phenolic acids, gallic acid and tannic acid are well known as potential inhibitors of su‐crase and other brush border enzymes in mice and rats (56;64;103). Also Chauhan and col‐leges 2007 showed an inhibitory effect of tannic acid on brush border enzymes, not only sucrase but also lactase, maltase and trehalase were inhibited in rat intestines (104). Shin‐

58
deet al. 2008 showed a modest inhibition of maltase by gallic acid isolated from Syzygium‐cumini seed kernel extracts on rat intestines (105). Recently, Gupta et al 2009 indicated that gallic acid and tannic acid 1are potent inhibitors of the brush border sucrase in mice intes‐tines, where the enzyme undergoes conformational modifications upon binding to polyphe‐nols.
Also extracts of acerola fruit have been studied and show reduced plasma glucose level after oral administration of maltose or sucrose in mice, indicating that the inhibition of α‐glycosidase affects both sucrase and maltase in mice intestines (106‐108). The prole of phenolic acids/avonols in bitter cumin was found to be the sum of gallic acid, protocate‐chuic acid, caffeic acid, ellagic acid, ferulic acid, quercetin and kaempferol (106).
A hot water extract of leaves of NeriumIndicum, a bush from Pakistan, was found to reduce the rise in postprandial blood glucose when both maltose and sucrose was given orally to rats. It was also found that the extract inhibited α‐glycosidase, suggesting that the isolated polyphenol from the leaf extract, chlorogenic acid, is the inhibitor of both maltase and su‐crase (109).
A recent review described the impact of dietary polyphenols on the carbohydrate metabo‐lism, and included results from studies of postprandial glycaemia in vitro and in vivo (68). Inhibition of brush border hydrolytic enzymes may be one of the mechanisms by which pol‐yphenols exert their effects and thus it may play a role in the aetiology of gastrointestinal dysfunction. Whether pH‐dependent enzyme inhibition by polyphenols is associated with conformational modifications in the sucrase‐isomaltase complex is not known. Grassi and colleges 2005 found that dark chocolate flavonols, improved insulin sensitivity in healthy persons, although the mechanism responsible for the results was not elucidated (110). Two studies of T2D patients have shown lowered levels of insulin when treated with high intake of catechin rich green tea/ tea polyphenols (111;112). Thus, the preventive effects of poly‐phenols, in humans are also coupled with more negative effects like inhibition of iron ab‐sorption. One study showed that bioactive dietary polyphenols inhibit heme iron absorption, mainly by reducing basolateral iron exit rather than decreasing apical heme iron uptake in intestinal cells (113).
The review of evidence for beneficial effects of polyphenols and phenolic acids on glycaemic control raised an interest in the sugar beet polyphenols and their possible ability to contrib‐ute to preventing and reducing the burden of diabetes mellitus.
8.1 POLYPHENOLSINSUGARBEETSIn Australia, a relatively new sugar product from cane sugar, called Logicane®, has been in‐troduced to the market. It consists of 1% specific cane molasses fraction and 99% cane su‐crose. It claims to have a low Glycaemic Index, 50‐55 compared to 65 for white sucrose from

59
the sugar cane, and thereby the rise in postprandial blood glucose diminishes compared to ordinary/white cane sugar. In addition the cane sugar molasses contain phenolic compounds and, based on the evidence of the disaccharidase‐inhibiting effects of several polyphenols in rodents, it is of interest to investigate if the same effect can be found in sugar beet molasses. Studies have showed that in the process of refining sugar from beets and cane, by‐products like pulp and molasses are important sources of bioactive compounds (114‐116). The antiox‐idant properties in the sugar beet pulp have been investigated, and a study revealed that the pulp contained few polyphenolic compounds and had antioxidant properties (114;115).
Molasses is a by‐product from the process of refining sugar. Sugar beets consist of 12‐16% sucrose and the processing starts by slicing the washed beets and then extracting the sugar from the fibres in 70°C hot water. This extract contains a high concentration of sugar, and is usually called the juice while the remaining beet slices are called the pulp. Pulp is primarily used as a food for cattle and as a component in animal feedstuff (115). The juice must now be rinsed before it can be used for sugar production. This is done by a process known as car‐bonatation, where chalk and CO2are added to the juice. The chalk binds all of the non‐sugars, and filtering out the chalk also removes the non‐sugars. The juice is still very dilute and the next process is therefore to evaporate the water from the juice to form a sugar syr‐up. After evaporation the sugar syrup is boiled under special conditions. Finally the mixture of crystals and syrup is spun in centrifuges to be separated into sucrose crystals and molas‐ses. The crystals are then dried, packed and/or stored ready for dispatch. The molasses con‐sist of simple carbohydrates and are primarily used as animal feed (117)
At the time of initiating the investigations of sugar beet molasses, the evidence regarding the total content of polyphenols in sugar beet molasses was unpublished. Based on labora‐tory work at Nordic Sugar in Nakskov, Denmark (118) the sugar beet molasses contain a va‐riety of different phenolic acids, primarilyvanillic acid, syringic acid, p‐coumaric acid, gallic acid, protocatechuic acid and ferulic acid as the most abundant. This was confirmed in a re‐cently published study investigating polyphenol content in both sugar beet molasses and sugar cane molasses (116).
Using the hypothesis of the effects of sugar beet polyphenols from molasses and the poten‐tial inhibition of sucrase activity in vitro, the study in paper 1 was designed. For kinetic stud‐ies of sucrase activity, we used the aforementioned assay. As inhibitors, two different poly‐phenol‐rich fractions from chromatographic separation of molasses from sugar beets and pure ferulic acid were used. Ferulic acid was chosen as it is linked to protective effects in liver toxicity induced by drugs, and furthermore it is related to a reduction in the risk of cor‐onary artery diseases (119). In addition, hypoglycaemic effects of ferulic acid have been in‐vestigated and inhibitory effects of sucrase and maltase have been reported in a study by Adisakwattana and colleagues 2009 (120).

60
Results from the kinetic studies of EDC molasses, fraction III‐2 molasses and pure ferulic acid (obtained from Nordic Sugar Denmark) are presented in Figure 8‐1.

61
Figure 8‐1 Top: Michaelis‐Menten curves for the substrate (sucrose) concentrations 0 – 280 mM with and with‐out 3% EDC molasses as inhibitor of sucrose (n=4). Sucrose placebo represents the amount of sucrose in the EDC molasses.[ sucrose (♦) 3% EDC molasses (), Sucrose placebo (∆)]. Middle: Michaelis‐Menten curves for the substrate (sucrose) concentrations 0 – 280 mM with and without fraction III‐2 molasses as inhibitor of sucrose (n=4). [sucrose (♦) Fraction III‐2 molasses ()].Bottom: Michaelis‐Menten curves for the substrate (sucrose) concentrations 0 – 280 mM with and without 1mM ferulic acid as inhibitor of sucrase and 5.6mM arabinose as inhibitor of sucrase. [ sucrose (♦) 1mM Ferulic acid (), 5.6 mM arabinose (∆)].
02468101214
0 50 100 150 200 250 300Vo nmol/(min*m
g protein)
[S] mM Sucrose
Sucrose1 mM Ferulic acid5,6 mM Arabinose
0
2
4
6
8
10
12
14
0 50 100 150 200 250 300 350
Vo nmol/(min*m
g protein)
[S] mM sucrose
Sucrose
3% EDC Molasses
Sucrose Placebo
0
2
4
6
8
10
12
14
0 50 100 150 200 250 300Vo nmol/(min*m
g protein)
[S] mM sucrose
Sucrose

62
The raw molasses and fractions of molasses, did not show any effects on the enzyme activity for sucrase. See figure 8.1.An assay with pure ferula acid alone showed a week inhibition of sucrase activity (figure 8‐1). The concentrations were relatively low and it is not possible to hypothesize on possible effects of higher concentrations.

63
9 CONCLUSIONSANDPERSPECTIVESFORFURTHERRESEARCH
The primary aim of this PhD thesis was to examine the potential of the pentose L‐arabinose added in a mixed meal to inhibit carbohydrate digestive enzymes and the relation to post‐prandial blood glucose, insulin and C‐peptide.
The pentoses, L‐arabinose and D‐xylose are both potential inhibitors of the digestive enzyme sucrase. This is documented in several studies using animal models and cell models. Fur‐thermore, it has been documented in a few human studies that the postprandial blood glu‐cose, insulin and C‐peptide are affected after intake of 75 g sucrose drink added 1.3 w/w % up to 8 w/w % L‐arabinose. The results revealed a dose‐response effect of both L‐arabinose and D‐xylose.
However, there is very little clinical application in ingestion of 75 g of sucrose in a drink, be‐cause very few people consume sugars in that quantity. Furthermore, another aspect was that addition of a component to our main glucose‐supplying carbohydrate, starch, might provide a larger effect than adding a component to sugar as the intake of starch in the popu‐lation is relatively larger than the intake of sucrose.
The possible inhibiting effects of L‐arabinose on maltase were investigated in an in vitro study in paper 3 and it was found that L‐arabinose and D‐xylose inhibit maltase activity. Ac‐cordingly, the inhibition of sucrase activity is more pronounced than it is for maltase activity.
In paper 2 we investigated whether the positive effects of L‐arabinose added to a sugar drink could be reproduced when L‐arabinose was added to a mixed meal containing sucrose and/or starch.
Overall, it was not possible to reproduce the beneficial/favourable effects of L‐arabinose tested in sucrose drinks.
These results led us to considerations about the consistence of the ingested meal and the possible effect on gastric emptying and thereby postprandial blood concentrations of glu‐cose, insulin and C‐peptide. A solid and a semi‐solid meal were designed as well as a fluid version of starch‐containing maltose. Additionally, an increase in the dose of L‐arabinose was expected to give better results.
The fluid maltose drink with added L‐arabinose could not validate the results from in vitro studies on maltase activity.

64
The increased dose of L‐arabinose in the test meal did not affect the postprandial blood glu‐cose, insulin and C‐peptide. The effect on gastric emptying rate was markedly different after ingestion of our test‐meals. The results indicated that the paracetamol was washed out/by‐passed with the fluid part of the chyme. The explanation could probably be, that paraceta‐mol was administered as a drink and not processed into the bakery products.
We suspect that gastric emptying is one of the explanations for the lack of findings when testing L‐arabinose mixed in the solid meals. However, there was no correlation between the time of maximum paracetamol concentration and peak of plasma glucose, serum insulin and C‐peptide. Overall, the conclusion is associated with certain reservations regarding sample size (n=6) and the method for measuring gastric emptying.
The secondary aims were to search for similar effects in polyphenols from molasses, which is a bi‐product in the production of sucrose from sugar beets.
Sugar beet polyphenols from the molasses did not affect the sucrase activity in vitro investi‐gated in paper 1. The future perspectives for sugar beet molasses and the effects on glucose control depend on further research within the polyphenol concentration in the molasses. Whether this has a commercial perspective for the sugar industry is questionable.
The future perspective is to reduce the demand for insulin in society, especially in the popu‐lation with pre‐diabetes. The concluding perspectives must be that L‐arabinose has the greatest potential to effect glucose and insulin secretion when added a sucrose drink. Espe‐cially the group of people with a sedentary life style, problems with overweight and high intake of soft drinks might benefit from this.

65
10 REFERENCES 1. Gin H, Rigalleau V. Post-prandial hyperglycemia. post-prandial hyperglycemia and
diabetes. Diabetes Metab 2000;26:265-72.
2. International Diabetes Federation. The Global Burden. Available from: www.idf.org/diabetesatlas/5e/the-global-burden. 2013.
Ref Type: Online Source
3. The Danish National Health Board. Numbers on diabetes 1996 -2010. www.ssi.dk/Sundhedsdataogit/Dataformidling/Sundhedsdata/Diabetes.aspx. 2011.
Ref Type: Online Source
4. Rasmussen SS, Glümer C, Sandbaek A, Lauritzen T, Borch-Johnsen K. Determinants of progression from impaired fasting glucose and impaired glucose tolerance to diabetes in a high-risk screened population: 3-áyear follow-up in the ADDITION study, Denmark. Diabetologia 2008;51:249-57.
5. DECODE Study Group, on behalf of the European Diabetes Epidemiology Group. Glucose Tolerance and Cardiovascular Mortality: Comparison of Fasting and 2-Hour Diagnostic Criteria. Arch Intern Med 2001;161:397-405.
6. Sorkin JDM, Muller DCM, Fleg JLM, Anders RM. The Relation of Fasting and 2-h Postchallenge Plasma Glucose Concentrations to Mortality: Data from the Baltimore Longitudinal Study of Aging with a critical review of the literature. Diabetes Care 2005;28:2626-32.
7. Ceriello A, Colagiuri S, Gerich J, Tuomilehto J. Guideline for management of postmeal glucose. Nutr Metab Cardiovasc Dis 2008;18:17-33.
8. DeFronzo RA. Insulin resistance, lipotoxicity, type 2 diabetes and atherosclerosis: the missing links. The Claude Bernard Lecture 2009. Diabetologia 2010.
9. Lorenzo CM, Wagenknecht LED, D'Agostino RBJ, Rewers MJM, Karter AJP, Haffner SMM. Insulin Resistance, [beta]-Cell Dysfunction, and Conversion to Type 2 Diabetes in a Multiethnic Population: The Insulin Resistance Atherosclerosis Study. [Article]. Diabetes Care 2010;33:67-72.
10. Gannon MC, Nuttall FQ, Westphal SA, Fang S, Ercan-Fang N. Acute metabolic response to high-carbohydrate, high-starch meals compared with moderate-carbohydrate, low-starch meals in subjects with type 2 diabetes. Diabetes Care 1998;21:1619-26.
11. Pedersen, A. N, Fagt, S, Groth, M. V, Christensen, T, Biltoft-Jensen, A, Matthiessen, J, Andersen, N. L, Kørup, K, Hartkopp, H, Ygil, K. H, Hinsh, H, saxholt, E, and Trolle, E. Danskernes kostvaner 2003-2008. [Dietary habits in Denmark 2003-2008.]. 6-129. 2010. Ref Type: Report

66
12. Bae YJ, Bak YK, Kim B, Kim MS, Lee JH, Sung MK. Coconut-derived D-xylose affects postprandial glucose and insulin responses in healthy individuals. Nutrition Research and Practice 2011;5:533-9.
13. Krog-Mikkelsen I, Hels O, Holst JJ, Andersen JR, Bukhave K. The effects of l-arabinose on intestinal sucrase activity: dose-response studies in vitro and in humans. Am J Clin Nutr 2011;94:472-8.
14. Krog-Mikkelsen I, Petersen SB, Halschou-Jensen K, Hels O, Tetens I, Holst JJ, Andersen JR, Bukhave K. The effects of D-xylose on intestial sucrase and maltase activity in vitro, and on sucrase activity in humans. 2013.
Ref Type: Unpublished Work
15. Campbell RK. Fate of the beta-cell in the pathophysiology of type 2 diabetes. J Am Pharm Assoc 2009;49 Suppl 1:S10-S15.
16. Cline GW, Petersen KF, Krssak M et al. Impaired glucose transport as a cause of decreased insulin-stimulated muscle glycogen synthesis in type 2 diabetes. N Engl J Med 1999;341:240-6.
17. Warram JH, Martin BC, Krolewski AS, Soeldner JS, Kahn CR. Slow Glucose Removal Rate and Hyperinsulinemia Precede the Development of Type II Diabetes in the Offspring of Diabetic Parents. Annals of Internal Medicine 1990;113:909-15.
18. DECODA Study Group. Age- and Sex-Specific Prevalence of Diabetes and Impaired Glucose Regulation in 11 Asian Cohorts. Diabetes Care 2003;26:1770-80.
19. Haffner SM, Stern MP, Hazuda HP, Mitchell BD, Patterson JK. Cardiovascular risk factors in confirmed prediabetic individuals. Does the clock for coronary heart disease start ticking before the onset of clinical diabetes? JAMA 1990;263:2893-8.
20. Lindstrom J, Ilanne-Parikka P, Peltonen M et al. Sustained reduction in the incidence of type 2 diabetes by lifestyle intervention: follow-up of the Finnish Diabetes Prevention Study. Lancet 2006;368:1673-9.
21. Abdul-Ghani MA, Jenkinson CP, Richardson DK, Tripathy D, DeFronzo RA. Insulin secretion and action in subjects with impaired fasting glucose and impaired glucose tolerance - Results from the veterans administration genetic epidemiology study. Diabetes 2006;55:1430-5.
22. Abdul-Ghani MA, Tripathy D, DeFronzo RA. Contributions of beta-cell dysfunction and insulin resistance to the pathogenesis of impaired glucose tolerance and impaired fasting glucose. Diabetes Care 2006;29:1130-9.
23. Gulli G, Ferrannini E, Stern M, Haffner S, DeFronzo RA. The Metabolic Profile of Niddm Is Fully Established in Glucose-Tolerant Offspring of 2 Mexican-American Niddm Parents. Diabetes 1992;41:1575-86.
24. Jensen MD, Haymond MW, Rizza RA, Cryer PE, Miles JM. Influence of body fat distribution on free fatty acid metabolism in obesity. J Clin Invest 1989;83:1168-73.

67
25. Knowler WC, Hamman RF, Edelstein SL et al. Prevention of type 2 diabetes with troglitazone in the Diabetes Prevention Program. Diabetes 2005;54:1150-6.
26. Knowler WC, Barrett-Connor E, Fowler SE et al. Reduction in the incidence of type 2 diabetes with lifestyle intervention or metformin. N Engl J Med 2002;346:393-403.
27. Gerstein HC, Yusuf S, Bosch J et al. Effect of rosiglitazone on the frequency of diabetes in patients with impaired glucose tolerance or impaired fasting glucose: a randomised controlled trial. Lancet 2006;368:1096-105.
28. Pan XR, Li GW, Hu YH et al. Effects of diet and exercise in preventing NIDDM in people with impaired glucose tolerance. The Da Qing IGT and Diabetes Study. Diabetes Care 1997;20:537-44.
29. Tuomilehto J, Lindstrom J, Eriksson JG et al. Prevention of type 2 diabetes mellitus by changes in lifestyle among subjects with impaired glucose tolerance. N Engl J Med 2001;344:1343-50.
30. Sorkin JDM, Muller DCM, Fleg JLM, Andres RM. The Relation of Fasting and 2-h Postchallenge Plasma Glucose Concentrations to Mortality: Data from the Baltimore Longitudinal Study of Aging with a critical review of the literature. Diabetes Care 2005;28:2626-32.
31. Boule NG, Haddad E, Kenny GP, Wells GA, Sigal RJ. Effects of exercise on glycemic control and body mass in type 2 diabetes mellitus - A meta-analysis of controlled clinical trials. JAMA 2001;286:1218-27.
32. Rose AJ, Richter EA. Skeletal muscle glucose uptake during exercise: How is it regulated? Physiology 2005;20:260-70.
33. Musi N, Fujii N, Hirshman MF et al. AMP-activated protein kinase (AMPK) is activated in muscle of subjects with type 2 diabetes during exercise. Diabetes 2001;50:921-7.
34. Cordain L, Eaton SB, Sebastian A et al. Origins and evolution of the Western diet: health implications for the 21st century. Am J Clin Nutr 2005;81:341-54.
35. Steyn NP, Mann J, Bennett PH et al. Diet, nutrition and the prevention of type 2 diabetes. Public Health Nutrition 2004;7:147-65.
36. Brand-Miller J, Hayne S, Petocz P, Colagiuri S. LowÇôGlycemic Index Diets in the Management of Diabetes: A meta-analysis of randomized controlled trials. Diabetes Care 2003;26:2261-7.
37. Frost G, Wilding J, Beecham J. Dietary advice based on the glycaemic index improves dietary profile and metabolic control in type 2 diabetic patients. Diabet Med 1994;11:397-401.

68
38. Frost G, Keogh B, Smith D, Akinsanya K, Leeds A. The effect of low-glycemic carbohydrate on insulin and glucose response in vivo and in vitro in patients with coronary heart disease. Metabolism 1996;45:669-72.
39. Blackburn NA, Redfern JS, Jarjis H et al. The mechanism of action of guar gum in improving glucose tolerance in man. Clin Sci (Lond) 1984;66:329-36.
40. Holt S, Heading RC, Carter DC, Prescott LF, Tothill P. Effect of gel fibre on gastric emptying and absorption of glucose and paracetamol. Lancet 1979;1:636-9.
41. Papathanasopoulos A, Camilleri M. Dietary Fiber Supplements: Effects in Obesity and Metabolic Syndrome and Relationship to Gastrointestinal Functions. Gastroenterology 2010;138:65-72.
42. Kong F, Singh RP. Disintegration of solid foods in human stomach. J Food Sci 2008;73:R67-R80.
43. McMichael HB. Intestinal absorption of carbohydrates in man. Proc Nutr Soc 1971;30:248-54.
44. Elliott SS, Keim NL, Stern JS, Teff K, Havel PJ. Fructose, weight gain, and the insulin resistance syndrome. Am J Clin Nutr 2002;76:911-22.
45. Sievenpiper JL, Carleton AJ, Chatha S et al. Heterogeneous effects of fructose on blood lipids in individuals with type 2 diabetes: systematic review and meta-analysis of experimental trials in humans. Diabetes Care 2009;32:1930-7.
46. Sievenpiper JL, Chiavaroli L, de Souza RJ et al. 'Catalytic' doses of fructose may benefit glycaemic control without harming cardiometabolic risk factors: a small meta-analysis of randomised controlled feeding trials. Br J Nutr 2012;108:418-23.
47. Southgate DA. Digestion and metabolism of sugars. Am J Clin Nutr 1995;62:203S-10S.
48. Gudmand-Hoyer E, Skovbjerg H. Disaccharide digestion and maldigestion. Scand J Gastroenterol Suppl 1996;216:111-21.
49. Rosenwei NS, Herman RH. Control of Jejunal Sucrase and Maltase Activity by Dietary Sucrose Or Fructose in Man - A Model for Study of Enzyme Regulation in Man. J of Clin Invest 1968;47:2253-&.
50. Mochizuki K, Igawa-Tada M, Takase S, Goda T. Feeding rats a high fat/carbohydrate ratio diet reduces jejunal S/I activity ratio and unsialylated galactose on glycosylated chain of S-I complex. Life Sci 2010;86:524-31.
51. Deren JJ, Broitman SA, Zamcheck N. Effect of Diet upon Intestinal Disaccharidases and Disaccharide Absorption*. J Clin Invest 1967;46:186-95.
52. Adachi T, Mori C, Sakurai K, Shihara N, Tsuda K, Yasuda K. Morphological changes and increased sucrase and isomaltase activity in small intestines of insulin-deficient and type 2 diabetic rats. Endocrine Journal 2003;50:271-9.

69
53. Langerholc T, Maragkoudkis PA, Wollgast J, Gradisnik L, Cencic A. Novel and established intestinal cell line models: An indispensable tool in food science and nutrition. Trends in Foods Sci & Tec 2011;1-10 (abstr).
54. Semenza G, von Balthazar AK. Steady-state kinetics of rabbit-intestinal sucrase. Kinetic mechanism, Na+ activation, inhibition by tris(hydroxymethyl)aminomethane at the glucose subsite. Eur J Biochem 1974;41:149-62.
55. Seri K, Sanai K, Matsuo N, Kawakubo K, Xue C, Inoue S. L-arabinose selectively inhibits intestinal sucrase in an uncompetitive manner and suppresses glycemic response after sucrose ingestion in animals. Metabolism 1996;45:1368-74.
56. Welsch CA, Lachance PA, Wasserman BP. Effects of native and oxidized phenolic compounds on sucrase activity in rat brush border membrane vesicles. J Nutr 1989;119:1737-40.
57. Delie F, Rubas W. A human colonic cell line sharing similarities with enterocytes as a model to examine oral absorption: advantages and limitations of the Caco-2 model. Crit Rev Ther Drug Carrier Syst 1997;14:221-86.
58. Sambuy Y, De A, I, Ranaldi G, Scarino ML, Stammati A, Zucco F. The Caco-2 cell line as a model of the intestinal barrier: influence of cell and culture-related factors on Caco-2 cell functional characteristics. Cell Biol Toxicol 2005;21:1-26.
59. Pan GY, Huang ZJ, Wang GJ et al. The antihyperglycaemic activity of berberine arises from a decrease of glucose absorption. Planta Med 2003;69:632-6.
60. Yu H, Cook TJ, Sinko PJ. Evidence for diminished functional expression of intestinal transporters in Caco-2 cell monolayers at high passages. Pharm Res 1997;14:757-62.
61. Jumarie C, Malo C. Ornithine decarboxylase activity is associated with proliferation but not with T3-induced differentiation of Caco-2 cells. J Cell Physiol 1995;165:639-46.
62. Michaelis L, Menten ML, Johnson KA, Goody RS. The original Michaelis constant: translation of the 1913 Michaelis-Menten paper. Biochemistry 2011;50:8264-9.
63. Dahlqvist A. Assay of intestinal disaccharidases. Anal Biochem 1968;22:99-107.
64. Gupta S, Mahmood S, Khan RH, Mahmood A. Inhibition of brush border sucrase by polyphenols in mouse intestine. Biosci Rep 2010;30:111-7.
65. Dahlqvist A. Substrate Inhibition of Intestinal Glycosidases. Acta Chemica Scandinavica 1960;14:1797-808.
66. Dahlqvist A. Method for assay of intestinal disaccharidases. Anal Biochem 1964;7:18-25.
67. Keen CL, Holt RR, Oteiza PI, Fraga CG, Schmitz HH. Cocoa antioxidants and cardiovascular health. Am J Clin Nutr 2005;81(suppl):298-303.

70
68. Hanhineva K, Torronen R, Bondia-Pons I et al. Impact of Dietary Polyphenols on Carbohydrate Metabolism. Int J Mol Sci 2010;11:1365-402.
69. Sies H, Schewe T, Heiss C, Kelm M. Cocoa polyphenols and inflammatory mediators. Am J Clin Nutr 2005;81(suppl):304-12.
70. Vita JA. Polyphenols and cardiovascular disease: effects on endothelial and platelet function. Am J Clin Nutr 2005;81(suppl):292-7.
71. Demetrakopoulos GE, Amos H. Xylose and Xylitol. Metabolism, physiology and nutritional value. World Rev Nutr Diet 1978;32:96-122.
72. McCance RA, Madders K. The comparative rates of absorption of sugars from the human intestine. Biochemical Journal 1930;24:795-804.
73. Andersen JR, Bukhave K, Hojgaard L et al. Decomposition of Wheat Bran and Ispaghula Husk in the Stomach and the Small-Intestine of Healthy-Men. J Nutr 1988;118:326-31.
74. Wyngaard JA, Staton S, Foley JB. Physiological disposition and metabloic fate of infused pentoses in man. J Clin Invest. 1958;36:1395-407 (abstr).
75. Rolston DD, Mathan VI. Xylose transport in the human jejunum. Dig Dis Sci 1989;34:553-8.
76. Craig RM, Ehrenpreis ED. D-xylose testing. J Clin Gastroenterol 1999;29:143-50.
77. Schutte JB. Nutritional implications and metabolizable energy value of D-xylose and L-arabinose in chicks. Poult Sci 1990;69:1724-30.
78. Livesey G. Tolerance of low-digestible carbohydrates: a general view. Br J Nutr 2001;85 Suppl 1:S7-16.
79. McKay LF, Brydon WG, Eastwood MA, Smith JH. The influence of pentose on breath methane. Am J Clin Nutr 1981;34:2728-33.
80. Seri K, Sanai K, Matsuo N, Kawakubo K, Xue C, Inoue S. L-arabinose selectively inhibits intestinal sucrase in an uncompetitive manner and suppresses glycemic response after sucrose ingestion in animals. Metabolism 1996;45:1368-74.
81. Osaki S, Kimura T, Sugimoto T, Hizukuri S, Iritani N. L-arabinose feeding prevents increases due to dietary sucrose in lipogenic enzymes and triacylglycerol levels in rats. J Nutr 2001;131:796-9.
82. Preuss HG, Echard B, Bagchi D, Stohs S. Inhibition by Natural Dietary Substances of Gastrointestinal Absorption of Starch and Sucrose in Rats and Pigs: 1. Acute Studies. Int J Med Sci 2007;4:196-202.
83. Preuss HG, Echard B, Bagchi D, Stohs D. Inhibition by Natural Dietary Substances of Gastrointestinal Absorption of Starch and Sucrose in Rats 2. Subchronic Studies. Int J Med Sci 2007;4:209-15.

71
84. Asano T, Yoshimura Y, Kunugita K. Sucrase inhibitory activity of D-xylose and effect on the elevation og blood glucose in rats. J Jap Soci Nutr and Food Sci 1996;43:157-62 (abstr).
85. Inoue S, Sanai K, Seri K. Effect of L-arabinose on blood glucose level after ingestion of sucrose-containing food in human. J Jap Soci Nutr and Food Sci 2000;53:243-7 (abstr).
86. Del Prato S, Tiengo A. The importance of first-phase insulin secretion: implications for the therapy of type 2 diabetes mellitus. Diabetes-Metabolism Research and Reviews 2001;17:164-74.
87. Horwitz DL, Starr JI, Mako ME, Blackard WG, Rubenstein AH. Proinsulin, insulin, and C-peptide concentrations in human portal and peripheral blood. J Clin Invest 1975;55:1278-83.
88. Christensen Møller, L., Kørup, K., Trolle, E., Matthiessen, J., and Fagt, S. Childrens eating habits 2005-2008 [Børn og Unges Måltidsvaner 2005-2008]. 1-12-2012. DTU Food, National Food Institute. Ref Type: Report
89. Juntunen KS, Niskanen LK, Liukkonen KH, Poittanen KS, Holst JJ, Mykkanen HM.
Postprandial glucose, insulin, and incretin responses to grain products in healthy subjects. Am J Clin Nutr 2002;75:254-62.
90. Knudsen KEB. Carbohydrate and lignin contents of plant materials used in animal feeding. Animal Feed Science and Technology 1997;67:319-38.
91. Connors KA, Pandit NK. N-Methylimidazole As A Catalyst for Analytical Acetylations of Hydroxy Compounds. Analytical Chemistry 1978;50:1542-5.
92. Maes BD, Hiele MI, Geypens BJ, Ghoos YF, Rutgeerts PJ. Gastric emptying of the liquid, solid and oil phase of a meal in normal volunteers and patients with Billroth II gastrojejunostomy. Europ J Clin Invest 1998;28:197-204.
93. Parkman HP, Harris AD, Krevsky B, Urbain JLC, Maurer AH, Fisher RS. Gastroduodenal Motility and Dysmotility - An Update on Techniques Available for Evaluation. Am J Gastroenterology 1995;90:869-92.
94. Smout A, Horowitz M, Armstrong D. Methods to Study Gastric-Emptying. Digestive Diseases and Sciences 1994;39:S130-S132.
95. Willems M, Quartero AO, Numans ME. How useful is paracetamol absorption as a marker of gastric emptying? A systematic literature study. Digestive Diseases and Sciences 2001;46:2256-62.
96. Heading RC, Nimmo J, Prescott LF, Tothill P. Dependence of Paracetamol Absorption on Rate of Gastric Emptying. Br J Pharmacol 1973;47:415-21.
97. Heading RC, Nimmo J, Prescott LF, Tothill P. The dependence of paracetamol absorption on the rate of gastric emptying. Br J Pharmacol 1973;47:415-21.

72
98. Maddern G, Miners J, Collins PJ, Jamieson GG. Liquid Gastric-Emptying Assessed by Direct and Indirect Techniques - Radionuclide Labeled Liquid Emptying Compared with A Simple Paracetamol Marker Method. Australian and New Zealand Journal of Surgery 1985;55:203-6.
99. Sanaka M, Kuyama Y, Shimomura Y, Saitoh M, Hattori K. New mathematical model for accurate description of absorption kinetics of paracetamol given orally with a high calorie liquid meal. Int J Clin Pharmacol Ther 2002;40:499-506.
100. Krishnan B, Babu S, Walker J, Walker AB, Pappachan JM. Gastrointestinal complications of diabetes mellitus. World J Diabetes 2013;4:51-63.
101. Manach C, Williamson G, Morand C, Scalbert A, Remesy C. Bioavailability and bioefficacy of polyphenols in humans. I. Review of 97 bioavailability studies. Am J Clin Nutr 2005;81:230-42.
102. Manach C, Scalbert A, Morand C, Remesy C, Jimenez L. Polyphenols: food sources and bioavailability. Am J Clin Nutr 2004;79:727-47.
103. Navita G, Shiffalli G, Akhtar MN. Gallic acid inhibits brush border disaccharidases in mammalian intestine. Nutrition Research 2007;27:230-5.
104. Chauhan A, Gupta S, Mahmood A. Effect of tannic acid on brush border disaccharidases in mammalian intestine. Indian J Exp Biol 2007;45:353-8.
105. Shinde J, Taldone T, Barletta M et al. Alpha-glucosidase inhibitory activity of Syzygium cumini (Linn.) Skeels seed kernel in vitro and in Goto-Kakizaki (GK) rats. Carbohydr Res 2008;343:1278-81.
106. Ani V, Varadaraj MC, Naidu KA. Antioxidant and antibacterial activities of polyphenolic compounds from bitter cumin (Cuminum nigrum L.). Eur Food Res Techn 2006;224:109-15.
107. Hanamura T, Mayama C, Aoki H, Hirayama Y, Shimizu M. Antihyperglycemic effect of polyphenols from Acerola (Malpighia emarginata DC.) fruit. Biosci Biotechnol Biochem 2006;70:1813-20.
108. Matsui T, Ogunwande IA, Abesundara KJ, Matsumoto K. Anti-hyperglycemic Potential of Natural Products. Mini Rev Med Chem 2006;6:349-56.
109. Ishikawa A, Yamashita H, Hiemori M et al. Characterization of inhibitors of postprandial hyperglycemia from the leaves of Nerium indicum. J Nutr Sci Vitaminol (Tokyo) 2007;53:166-73.
110. Grassi D, Lippi C, Necozione S, Desideri G, Ferri C. Short-term administration of dark chocolate is followed by a significant increase in insulin sensitivity and a decrease in blood pressure in healthy persons. Am J Clin Nutr 2004;81:611-4.
111. Fukino Y, Shimbo M, Aoki N, Okubo T, Iso H. Randomized controlled trial for an effect of green tea consumption on insulin resistance and inflammation markers. J Nutr Sci Vitaminol (Tokyo) 2005;51:335-42.

73
112. Nagao T, Meguro S, Hase T et al. A catechin-rich beverage improves obesity and blood glucose control in patients with type 2 diabetes. Obesity (Silver Spring) 2009;17:310-7.
113. Ma Q, Kim EY, Han O. Bioactive dietary polyphenols decrease heme iron absorption by decreasing basolateral iron release in human intestinal Caco-2 cells. J Nutr 2010;140:1117-21.
114. Mohdaly AA, Sarhan MA, Smetanska I, Mahmoud A. Antioxidant properties of various solvent extracts of potato peel, sugar beet pulp and sesame cake. J Sci Food Agric 2010;90:218-26.
115. Sakac MB, Gyura JF, Misan AC, Seres ZI. Antioxidant properties of sugarbeet fibers. Zuckerindustrie 2009;134:418-25.
116. Valli V, Gomez-Caravaca AM, Di Nunzio M, Danesi F, Caboni MF, Bordoni A. Sugar Cane and Sugar Beet Molasses, Antioxidant-rich Alternatives to Refined Sugar. J Agric Food Chem 2012;60:12508-15.
117. Nordic Sugar. From sugar beet to crystal sugar. Available from: www.nordicsugar.dk/kend-dit-sukker/fra-roe-til-krystal/. 2013.
Ref Type: Online Source
118. Weiergang, I. Polyphenolic content in sugar beet molasses, laboratory work af Nordic Sugar, Nakskov, Denmark. 2010.
Ref Type: Personal Communication
119. Balasubashini MS, Rukkumani R, Menon VP. Protective effects of ferulic acid on hyperlipidemic diabetic rats. Acta Diabetol 2003;40:118-22.
120. Adisakwattana S, Chantarasinlapin P, Thammarat H, Yibchok-Anun S. A series of cinnamic acid derivatives and their inhibitory activity on intestinal alpha-glucosidase. J Enzyme Inhib Med Chem 2009;24:1194-200.

74

75
11 APPENDIXPAPER1‐3

76

77
PAPER 1
Kia Halschou Hansen, Klaus Bukhave & Jens Rikardt Andersen. Intestinal disaccharidase activity and uptake of glucose from sucrose, in A Lazinica, S Chackrewarthy (eds): Glucose Tolerance, InTech, 2012: 149-62 ISBN 978-953-51-0891-7.

78
79
Chapter 9
© 2012 Andersen et al., licensee InTech. This is an open access chapter distributed under the terms of the Creative Commons Attribution License (http://creativecommons.org/licenses/by/3.0), which permits unrestricted use, distribution, and reproduction in any medium, provided the original work is properly cited.
Intestinal Disaccharidase Activity and Uptake of Glucose from Sucrose
Kia Halschou Hansen, Klaus Bukhave and Jens Rikardt Andersen
Additional information is available at the end of the chapter
http://dx.doi.org/10.5772/53099
1. Introduction
Postprandial hyperglycemia is now established as an independent risk factor for the development of at least macro vascular complications in diabetes mellitus (1), as it is a widely accepted experience that it is more difficult to normalize postprandial blood glucose than the fasting concentrations. Furthermore, it is well known that impaired glucose tolerance (IGT) is related to increased cardiovascular morbidity and mortality (2) and that postprandial hyperglycemia plays a central role in progression from IGT to type 2 diabetes (3). It is possible to delay the appearance of type 2 diabetes and cardiovascular diseases in IGT patients by good glycemic control (4-8). The glycemic load as well as peak concentrations of glucose in the blood depend on many factors including gastric emptying, the nature of ingested food, intraluminal glucose concentration, and enzymatic activity in the brush border. On top of this several gut hormones play a role as well as the ability of the liver to reduce endogenous glucose production, being a special problem in patients with type 2 diabetes. This phenomenon increases the importance of reducing postprandial glucose uptake in type 2 diabetics. In addition, it seems possible to modify the insulin secretion after meals by addition of arabinose to the ingested sucrose (9). Sucrose contains equal amounts of glucose and fructose molecules. The absorption and metabolism of the two molecules is different. The absorbed glucose is utilized in an insulin dependent manner primarily in the peripheral tissues. Fructose is utilized in the liver in the glycolytic pathway with products like glucose, glycogen, lactate and pyruvate. Fructose is more lipogenic than glucose, an effect that might contribute to the development of cardiovascular diseases (CVD), insulin resistance and type 2 diabetes (10). Fructose does not stimulate insulin secretion as glucose why a modest intake of fructose is recomended in diabetes and heart patients due to the lipogenicity (10;11). Recently, a metaanalysis stated that fructose intake at a level of ≤ 36g/d, which is equivalent to daily intake of fruit, could have beneficial effects by decreasing endogenous glucose production and increasing glycogen synthesis, and

80
Glucose Tolerance 150
thereby improve glycaemic control. This benefit is seen without the adverse cardiometabolic effects reported when fructose is ingested in high doses or as excess energy (12).
2. Disaccharidase activity in vitro
The digestive enzymes, α-amylase and α-glucosidase are the key enzymes responsible for the digestion of carbohydrates to glucose. In search for modulators and/or inhibitors of disaccharidases various in vitro models for determination have been described in the literature. These represent quick and cheap screening procedures and include among others intestinal mucosa homogenates (13;14), intestinal brush border preparations (15) from different experimental animals, and homogenates of human intestinal cell line Caco-2 (9). The Caco-2 cells were originally derived from a human colon adenocarcinoma. In culture they proliferate and differentiate to cells resembling mature jejunocytes with high levels of brush-border enzyme activity including alkaline phosphatase, amino-peptidase, and sucrase-isomaltase (16). Although the Caco-2 cells are derived from colonic cells they represent human tissue and are thereby superior to animal tissue in relation to human studies. For kinetic studies on disaccharidase activity an in vitro model with homogenates of Caco-2 cells was established. Caco-2 cells from passage number 38 and 39 were seeded onto polycarbonate membranes (Fisher Scientific, Transwell®membrane, 75mm) and cultured at 37°C and 5/95% CO2/air. At day 20-22, when the transepithelial electrical resistance (TEER) has reached a steady state level of 3-400 Ω*cm2, the Caco-2 cells were rinsed with phosphate buffered saline, scraped off the membranes, and homogenized by sonication. Homogenates
Figure 1. Michaelis-Menten curves for the substrate (sucrose) concentrations 0 – 280 mM with and without L-arabinose as inhibitor of sucrase (0.0mM (x), 0.84mM (), 1.4mM (∆) and 2.8mM ()). Data are mean±SEM (n=6). S is the substrate concentration and V is the velocity of the reaction. (Reproduced from Krog-Mikkelsen et al (2) with permission).
0
2
4
6
8
10
12
14
16
18
0 40 80 120 160 200 240 280
V (n
mol
/(min
xmg
prot
ein)
)
S (mM)

81
Intestinal Disaccharidase Activity and Uptake of Glucose from Sucrose 151
corresponding to 2.2 mg protein/mL and disaccharide solutions at final concentrations of 7, 14, 28, 140, and 280 mM in 0.1 M maleate buffer, pH=6.0 were used. The amount of glucose released by the enzymatic reaction was linear with time up to 60 min, so a 30 min reaction time was used and glucose measured with a Cobas Mira Plus Spectrophotometer (Roche Diagnostic Systems, F Hoffmann-La Roche, Basel, Switzerland). Pentoses like L-arabinose and D-xylose were used as inhibitors at final concentrations of 0.84, 1.4, and 2.8 mM as exemplified with Michaelis-Menten curves for L-arabinose in fig 1 and Lineweaver-Burk plots in fig 2 (9).
Figure 2. Lineweaver-Burk plots with and without L-arabinose as inhibitor of sucrase (0.0mM (x), 0.84mM (), 1.4mM (∆) and 2.8mM ()). Data are mean±SEM (n=6). (Reproduced from Krog-Mikkelsen et al (2) with permission.)
Reaction velocity (v) plotted against substrate concentration (s) revealed classical Michaelis-Menten kinetics and demonstrated significant inhibition by increasing amounts of L-
0
0.02
0.04
0.06
0.08
0.1
0.12
0.14
0.16
0 0.02 0.04 0.06 0.08 0.1 0.12 0.14 0.16
1/V
(min
*mg
prot
ein/
nmol
)
1/S (1/mM)

82
Glucose Tolerance 152
arabinose (fig 1) Lineweaver-Burke analysis (fig 2) indicated uncompetitive inhibition since Vmax decreased from 19.8 over 14.7 and 14.1 to 12.2 nmol/(min*mg protein), and Km decreased from 9.8 over 7.3 and 6.1 to 5.3 mmol/L when the inhibitor concentrations increased from zero over 0.84 and 1.4 to 2.8 mM L-arabinose (data not shown). Thus, addition of 0.84, 1.4, and 2.8 mM L-arabinose resulted in 25, 29 and 38% inhibition of the sucrase activity, respectively at Vmax. The apparent Ki was calculated to 2.8±0.3 mM (mean±SEM, n=3) from the Lineweaver-Burke plots (2).
Similar results were obtained with sucrose as substrate and D-xylose as inhibitor, and with maltose as substrate and L-arabinose as inhibitor (data not shown).
The validity of the in vitro model was confirmed in a human intervention study with 15 healthy volunteers in a randomized double-blinded cross-over study. Sucrose beverages (75 g in 300 mL) supplemented with 0, 1, 2, or 3 g (0, 1.3, 2.7 and 4 w/w%, respectively) L-arabinose were tested (2). Blood was collected fasting and for 3-h postprandial with 15 minute intervals, and plasma glucose and serum insulin measured (fig 3 and 4).
Figure 3. Plasma glucose in 15 normal male subjects after intake of sucrose drinks supplemented with 0 (x), 1(), 2 (∆), or 3 () grams of L-arabinose. Data are mean (± SEM). iAUC = incremental area under the curve. Statistical differences Peak, P=0.001. Time to peak, P=0.133. iAUC, P=0.245. (Reproduced from Krog-Mikkelsen et al (9) with permission.)
4
4.5
5
5.5
6
6.5
7
7.5
8
0 15 30 45 60 75 90 105 120 135 150 165 180
Plas
ma
gluc
ose
(mm
ol/L
)
Time (min)

83
Intestinal Disaccharidase Activity and Uptake of Glucose from Sucrose 153
The present in vivo results in man strongly indicate that the Caco-2 cell model is useful in screening procedures in search for compounds which may lower the glycemic and insulimic responses in man. Importantly, because the Caco-2 cell line is of human origin, the results are more relevant for human physiology than studies with experimental animals.
Figure 4. Serum insulin in 15 normal male subjects after intake of sucrose drinks supplemented with 0 (x), 1 (), 2 (∆), or 3 () grams of L-arabinose. Data are mean (± SEM). Statistical differences Peak, P<0.0001. Time to peak, P=0.002. iAUC, P=0.017. (Reproduced from Krog-Mikkelsen et al (9) with permission.)
3. The inhibition of the uptake of maltose and sucrose by food components
In addition to the pentoses L-arabinose and D-xylose growing evidence indicates that various dietary polyphenols may influence carbohydrate metabolism. Several efforts are
0
50
100
150
200
250
300
350
0 15 30 45 60 75 90 105 120 135 150 165 180
Seru
m in
sulin
(pm
ol/L
)
Time (min)

84
Glucose Tolerance 154
made to identify new possible α-glucosidase inhibitors and interest in replacement of synthetic foods by natural ones has fostered research on vegetable sources and screening of raw materials to identify these α-glucosidase inhibitors (17-20). Polyphenols are abundant micronutrients in our diet, found in plants foods like fruits, vegetables, tea, coffee, red wine, and cacao. Studies with polyphenolic compounds, polyphenolic extracts of foods including berries, vegetables and colored grains such as black rice, green and black tea, and red wine have been shown to inhibit α-glucosidase activities and there by suppress the elevation of blood glucose concentrations when tested in especially small rodents (18). Additionally, different cell lines like Caco 2 cells mentioned above have been used in vitro. The inhibitory polyphenols includes flavonoids, phenolic acids, tannins (18). For example gallic acid and tannic acid have showed to be potential inhibitors of sucrase and other brush border enzymes in mice and rat (15;21;22). Extracts of acerola fruit have been studied and shows reduced plasma glucose level after oral administration of maltose or sucrose in mice, indicating inhibition of α-glucosidase effects on both sucrase and maltase in mice intestines (23-25). A hot water extract of leaves of Nerium Indicum, a bush from Pakistan, was found to reduce the rise in postprandial blood glucose when maltose and sucrose was given orally in rats. It was found that the extract inhibited α-glycosidase, suggesting the isolated polyphenols from the leaves extract, chlorogenic acid, to be the inhibitor of maltase and sucrose (26).
4. Sugar beets
The nutritional value of sucrose is to provide calories; nevertheless some studies have found that in the process of refining sugar from sugar beets and sugar cane some of the by products like pulp and molasses are important sources of bioactive compounds (polyphenols and pentoses). A study with sugar beet pulp revealed that the pulp contained polyphenolic compounds and had antioxidant properties (27;28). The same has been shown in studies with sugar cane products (29). The sugar beet molasses contains a variety of different phenolic acids mostly vanillic acid, syringic acid, p-coumaric acid, gallic acid, protocatechuic acid and ferulic acid the most abundant.
For kinetic studies of sucrase activity, we used the aforementioned assay (2). As inhibitors two different polyphenol-rich fractions from chromatographic separation of molasses from sugar beets and pure ferulic acid were used. Results from the kinetic studies of EDC molasses, fraction III-2 molasses and pure ferulic acid (obtained from Nordic Sugar Denmark) are represented in figure 5-7.
There were no inhibitory effects of EDC molasses or fraction III-2. Ferulic acid showed a week inhibition of 1.9 % for the concentration of 1 mM (Unpublished data). The variability of polyphenol content in foods is pronounced and in most cases, foods contain complex mixtures of polyphenols. The content is influenced by numerous factors such as variety, production practices at a particular processing plant, environmental factors and by storage variables. Even though, molasses contain a variety of different phenolic acids and pure ferulic acid inhibition of sucrose activity was weak at a relatively low concentration. This

85
Intestinal Disaccharidase Activity and Uptake of Glucose from Sucrose 155
indicates that there are still much to learn about the potential bioactivities and the bioavailabilities of polyphenolic compounds (30).
Figure 5. Michaelis-Menten curves for the substrate (sucrose) concentrations 0 – 280 mM with and without fraction III-2 molasses as inhibitor of sucrose (n=4). [sucrose (◊) Fraktion III-2 molasses ()]
Figure 6. Michaelis-Menten curves for the substrate (sucrose) concentrations 0 – 280 mM with and without 3 % EDC molasses as inhibitor of sucrose (n=4). Sucrose placebo represents the amount of sucrose in the EDC molasses.[sucrose (◊) 3% EDC molasses (), Sucrose placebo (∆)]
0
2
4
6
8
10
12
14
0 50 100 150 200 250 300
Vo
nmol
/(min
*mg
prot
ein)
[S] mM sucrose
0
2
4
6
8
10
12
14
0 50 100 150 200 250 300 350
Vo
nmol
/(min
*mg
prot
ein)
[S] mM sucrose

86
Glucose Tolerance 156
Figure 7. Michaelis-Menten curves for the substrate (sucrose) concentrations 0 – 280 mM with and without 1mM ferulic acid as inhibitor of sucrase and 5,6 mM arabinose as inhibitor of sucrase. [sucrose (◊) 1 mM ferulic acid (), 5,6 mM arabinose (∆)]
5. Intraluminal factors related to uptake of glucose
It has been known for many years that dietary fibers reduce postprandial glucose concentrations in the blood, insulin response and delay gastric emptying. These effects have been established for a variety of fibers, but most markedly for soluble fibers. The character of chemical binding to the fibers are not well elucidated, neither the questions of existing physical binding mechanisms. The different processing methods of carbohydrates such as parboiling have verified effects on the glycemic response.
One could ask whether the fiber-effects are due to the fibers, or can be explained by compensatory effects on the diet. That means if intake of fibers in the relevant amounts decreases appetite for fat and short chain carbohydrates, and thereby induces early satiety or changes food preferences towards other kinds of nutrients. These questions have only been addressed in very few publications and deserve to be discussed further. It has been very difficult to show that changes by fibers on appetite and food intake last more than around three weeks. This could be due to adaptation both to the direct effect of fibers, but also to adaption to the secondary effects such as food composition.
0
2
4
6
8
10
12
14
0 50 100 150 200 250 300
Vo
nmol
/(min
*mg
prot
ein)
[S] mM Sucrose

87
Intestinal Disaccharidase Activity and Uptake of Glucose from Sucrose 157
An additional question is the significance of formation of resistant starch during the preparation and production of food items.
During the 1980`s it was well documented that dietary fibers have beneficial effects on blood glucose levels, the postprandial values in particular. The mechanisms, however, were not clear, and chemical bindings of glucose to elements in the fibers were hypothesized. Such bindings have never been convincingly proven, and at an early point these hypothesis were questioned. A study used pectin in the glucose solution and modulated gastric emptying with propantheline (31) which demonstrated that pectin significantly reduced blood-glucose, but propantheline had a more pronounced effect. In an additional investigation in the same paper they demonstrated that both gastric emptying and paracetamol absorption were slower after inclusion of gel fiber (guar gum and pectin), but the total absorption of the drug, reflected in urinary recovery, was not significantly reduced. These results indicated that gastric emptying could be the dominating factor in the delay of glucose absorption. Later a long list of authors has contributed. Lavin and Read (32) found no difference in gastric emptying time when comparing fluent meal of 30 % glucose with or without guar gum, and speculated in an unknown mucosal receptor mechanism to explain the effects on postprandial blood glucose and insulin concentrations as well as satiety. In contradiction Horowitz et al (33) found convincing correlations between gastric emptying and peak plasma glucose as well as the total amount of glucose absorbed using a scintigraphic technique, but with almost twice the concentration of glucose in the fluent meal and a 40 % larger volume compared to Lavin and Read (32). Horowitz et al (33) calculated that gastric emptying accounts for about 34 % of the variance in postprandial peak plasma glucose. The difference between these results could be explained by the techniques used, but also by the concentrations of glucose in the test meals. A study investigated the rehydration ability of 2 and 10 % glucose-electrolyte solutions with osmolality of 189 and 654 mOsm/kg, respectively. Gastric volumes were determined via gastric aspiration at 15 min intervals. They showed that the reduced overall rate of fluid uptake following ingestion of the 10 % glucose solution was due largely to a relatively slow rate of gastric emptying (34). Hence the influence of gastric emptying on glucose uptake may only be relevant for solutions with very high concentrations of glucose, which is not relevant in relation to the human diet neither in normal persons nor in diabetic patients. This is in accordance with the hypothesis, that gastric content is only allowed access to the duodenum when iso-osmotic. Part of the delay in gastric emptying may well to allow a dilution with secreted water and sodium.
All these results indicate that gastric emptying is probably the dominating factor, but not the only one. Blackburn et al (35) had the same results as others concerning the lowering of blood glucose and insulin, but there was no correlation between the changes in the individual blood glucose responses and changes in gastric emptying rates induced by guar. By a steady-state perfusion technique, glucose absorption was found to be significantly reduced during perfusion of the jejunum with solutions containing guar. They estimated the thickness of unstirred layer in addition, and concluded that guar improves glucose tolerance predominantly by reducing glucose absorption in the small intestine. These were very

88
Glucose Tolerance 158
elegant experiments, but has not been reproduced. However, another important influence on glucose uptake may be the rate of perfusion of the small intestine which can be modulated both by hormonal effects and meal composition (36).
After glucose meals it seems like gastric emptying is a dominant intraluminal factor for glucose absorption. However, glucose is rarely ingested as glucose, and production of glucose in the stomach due to acid hydrolysis is not a predominant mechanism of glucose production. For these reasons it would be valuable to look at starch and sucrose as well.
the hypothesis was investigated In another study with focus on particle size and structural features of the food. An extract from barley was used to modify the granules and the particle size, and found a decrease in the in-vitro starch digestion and accordingly release of glucose (37). Also starch-entrapped microspheres have been used with similar beneficial effects on the postprandial blood glucose response for different starch fractions (38). In addition it would be relevant to investigate the effects on brush border sucrose activity related to the different forms of glucose suppliers.
In animal studies promising results are emerging. Kett et al (39) found that starch gelatinized with α-casein resulted in lower postprandial glucose uptake than starch gelatinized with β-casein. In rats a study found indications of an effect of addition of resistant starch to bread, but different effects for maize and wheat based bread (40).
Besides from the more or less well described factors mentioned above, we see an emerging and probably very important field of intestinal sensing of nutrients, recently reviewed by Tolhurst et al (41). Of special interest in the glucose aspect are the documented effects of psyllium fibers in the diet prolonging pancreatic polypeptide (PYY) secretion and suppressing postprandial glucagon-like peptide-1(GLP-1) concentration (42).
6. Conclusions
All together, these findings imply that there must be many possible ways of modifying food components to reduce the postprandial glucose levels in the blood. These modifications can be made both by induction of physical changes in the carbohydrates (gelatinization), additives and addition of food components already existing in nature. Arabinose is present in considerable amounts in the sugar beet along with sucrose, but the components are separated during the manufacturing process. Modifications of food components generally cost money, so it will partly be the consciousness of the consumers that will determine whether such products have a future on the market.
The simplest way of getting an effect is still to increase the amount of dietary fibers in the diet, and hypothetically the largest effects would result from a change in eating habits in the total population. The results presented are from normal volunteers, and the same effects can be measured in diabetics, whereas results are lacking from persons/patients with insulin resistance but not yet diabetic.

89
Intestinal Disaccharidase Activity and Uptake of Glucose from Sucrose 159
Author details
Kia Halschou Hansen and Klaus Bukhave Department of Human Nutrition, University of Copenhagen, Denmark
Jens Rikardt Andersen* Department of Human Nutrition, University of Copenhagen, Denmark Nutrition Unit 5711, Rigshospitalet, Copenhagen, Denmark
Conflicts of interest
Kia Halschou Hansen, MSc in clinical nutrition, is a PhD candidate, partly financed by Nordic Sugar Denmark.
7. References
[1] Gin H, Rigalleau V. Post-prandial hyperglycemia. post-prandial hyperglycemia and diabetes. Diabetes Metab 2000;26:265-72.
[2] Haffner SM, Stern MP, Hazuda HP, Mitchell BD, Patterson JK. Cardiovascular risk factors in confirmed prediabetic individuals. Does the clock for coronary heart disease start ticking before the onset of clinical diabetes? JAMA 1990;263:2893-8.
[3] Lindstrom J, Ilanne-Parikka P, Peltonen M et al. Sustained reduction in the incidence of type 2 diabetes by lifestyle intervention: follow-up of the Finnish Diabetes Prevention Study. Lancet 2006;368:1673-9.
[4] Knowler WC, Hamman RF, Edelstein SL et al. Prevention of type 2 diabetes with troglitazone in the Diabetes Prevention Program. Diabetes 2005;54:1150-6.
[5] Knowler WC, Barrett-Connor E, Fowler SE et al. Reduction in the incidence of type 2 diabetes with lifestyle intervention or metformin. N Engl J Med 2002;346:393-403.
[6] Gerstein HC, Yusuf S, Bosch J et al. Effect of rosiglitazone on the frequency of diabetes in patients with impaired glucose tolerance or impaired fasting glucose: a randomised controlled trial. Lancet 2006;368:1096-105.
[7] Pan XR, Li GW, Hu YH et al. Effects of diet and exercise in preventing NIDDM in people with impaired glucose tolerance. The Da Qing IGT and Diabetes Study. Diabetes Care 1997;20:537-44.
[8] Tuomilehto J, Lindstrom J, Eriksson JG et al. Prevention of type 2 diabetes mellitus by changes in lifestyle among subjects with impaired glucose tolerance. N Engl J Med 2001;344:1343-50.
[9] Krog-Mikkelsen I, Hels O, Tetens I, Holst JJ, Andersen JR, Bukhave K. The effects of l-arabinose on intestinal sucrase activity: dose-response studies in vitro and in humans. The American Journal of Clinical Nutrition 2011;94:472-8.
* Corresponding Author

90
Glucose Tolerance 160
[10] Elliott SS, Keim NL, Stern JS, Teff K, Havel PJ. Fructose, weight gain, and the insulin resistance syndrome. Am J Clin Nutr 2002;76:911-22.
[11] Sievenpiper JL, Carleton AJ, Chatha S et al. Heterogeneous effects of fructose on blood lipids in individuals with type 2 diabetes: systematic review and meta-analysis of experimental trials in humans. Diabetes Care 2009;32:1930-7.
[12] Sievenpiper JL, Chiavaroli L, de Souza RJ et al. 'Catalytic' doses of fructose may benefit glycaemic control without harming cardiometabolic risk factors: a small meta-analysis of randomised controlled feeding trials. Br J Nutr 2012;108:418-23.
[13] Seri K, Sanai K, Matsuo N, Kawakubo K, Xue C, Inoue S. L-arabinose selectively inhibits intestinal sucrase in an uncompetitive manner and suppresses glycemic response after sucrose ingestion in animals. Metabolism 1996;45:1368-74.
[14] Semenza G, von Balthazar AK. Steady-state kinetics of rabbit-intestinal sucrase. Kinetic mechanism, Na+ activation, inhibition by tris(hydroxymethyl)aminomethane at the glucose subsite. Eur J Biochem 1974;41:149-62.
[15] Welsch CA, Lachance PA, Wasserman BP. Effects of native and oxidized phenolic compounds on sucrase activity in rat brush border membrane vesicles. J Nutr 1989;119:1737-40.
[16] Delie F, Rubas W. A human colonic cell line sharing similarities with enterocytes as a model to examine oral absorption: advantages and limitations of the Caco-2 model. Crit Rev Ther Drug Carrier Syst 1997;14:221-86.
[17] Keen CL, Holt RR, Oteiza PI, Fraga CG, Schmitz HH. Cocoa antioxidants and cardiovascular health. Am J Clin Nutr 2005;81(suppl):298-303.
[18] Hanhineva K, Torronen R, Bondia-Pons I et al. Impact of Dietary Polyphenols on Carbohydrate Metabolism. Int J Mol Sci 2010;11:1365-402.
[19] Sies H, Schewe T, Heiss C, Kelm M. Cocoa polyphenols and inflammatory mediators. Am J Clin Nutr 2005;81(suppl):304-12.
[20] Vita JA. Polyphenols and cardiovascular disease: effects on endothelial and platelet function. Am J Clin Nutr 2005;81(suppl):292-7.
[21] Gupta S, Mahmood S, Khan RH, Mahmood A. Inhibition of brush border sucrase by polyphenols in mouse intestine. Biosci Rep 2010;30:111-7.
[22] Navita G, Shiffalli G, Akhtar MN. Gallic acid inhibits brush border disaccharidases in mammalian intestine. Nutrition Research 2007;27:230-5.
[23] Ani V, Varadaraj MC, Naidu KA. Antioxidant and antibacterial activities of polyphenolic compounds from bitter cumin (Cuminum nigrum L.). Eur Food Res Techn 2006;224:109-15.
[24] Hanamura T, Mayama C, Aoki H, Hirayama Y, Shimizu M. Antihyperglycemic effect of polyphenols from Acerola (Malpighia emarginata DC.) fruit. Biosci Biotechnol Biochem 2006;70:1813-20.
[25] Matsui T, Ogunwande IA, Abesundara KJ, Matsumoto K. Anti-hyperglycemic Potential of Natural Products. Mini Rev Med Chem 2006;6:349-56.

91
Intestinal Disaccharidase Activity and Uptake of Glucose from Sucrose 161
[26] Ishikawa A, Yamashita H, Hiemori M et al. Characterization of inhibitors of postprandial hyperglycemia from the leaves of Nerium indicum. J Nutr Sci Vitaminol 2007;53:166-73.
[27] Mohdaly AA, Sarhan MA, Smetanska I, Mahmoud A. Antioxidant properties of various solvent extracts of potato peel, sugar beet pulp and sesame cake. J Sci Food Agric 2010;90:218-26.
[28] Sakac MB, Gyura JF, Misan AC, Seres ZI. Antioxidant properties of sugarbeet fibers. Zuckerindustrie 2009;134:418-25.
[29] Ranilla LG, Kwon YI, Genovese MI, Lajolo FM, Shetty K. Antidiabetes and antihypertension potential of commonly consumed carbohydrate sweeteners using in vitro models. J Med Food 2008;11:337-48.
[30] Manach C, Scalbert A, Morand C, Remesy C, Jimenez L. Polyphenols: food sources and bioavailability. Am J Clin Nutr 2004;79:727-47.
[31] Holt S, Heading RC, Carter DC, Prescott LF, Tothill P. Effect of gel fibre on gastric emptying and absorption of glucose and paracetamol. Lancet 1979;1:636-9.
[32] Lavin JH, Read NW. The effect on hunger and satiety of slowing the absorption of glucose: relationship with gastric emptying and postprandial blood glucose and insulin responses. Appetite 1995;25:89-96.
[33] Horowitz M, Edelbroek MA, Wishart JM, Straathof JW. Relationship between oral glucose tolerance and gastric emptying in normal healthy subjects. Diabetologia 1993;36:857-62.
[34] Evans GH, Shirreffs SM, Maughan RJ. The effects of repeated ingestion of high and low glucose-electrolyte solutions on gastric emptying and blood 2H2O concentration after an overnight fast. Br J Nutr 2011;106:1732-9.
[35] Blackburn NA, Redfern JS, Jarjis H et al. The mechanism of action of guar gum in improving glucose tolerance in man. Clin Sci 1984;66:329-36.
[36] Macdonald IA. Physiological regulation of gastric emptying and glucose absorption. Diabet Med 1996;13:11-5.
[37] Razzaq HA, Sutton KH, Motoi L. Modifying glucose release from high carbohydrate foods with natural polymers extracted from cereals. J Sci Food Agric 2011;91:2621-7.
[38] Venkatachalam M, Kushnick MR, Zhang G, Hamaker BR. Starch-entrapped biopolymer microspheres as a novel approach to vary blood glucose profiles. J Am Coll Nutr 2009;28:583-90.
[39] Kett AP, Bruen CM, O'Halloran F et al. The effect of alpha- or beta-casein addition to waxy maize starch on postprandial levels of glucose, insulin, and incretin hormones in pigs as a model for humans. Food Nutr Res 2012;56.
[40] Brites CM, Trigo MJ, Carrapico B, Alvina M, Bessa RJ. Maize and resistant starch enriched breads reduce postprandial glycemic responses in rats. Nutr Res 2011;31:302-8.
[41] Tolhurst G, Reimann F, Gribble FM. Intestinal sensing of nutrients. Handb Exp Pharmacol 2012;309-35.

92
Glucose Tolerance 162
[42] Karhunen LJ, Juvonen KR, Flander SM et al. A psyllium fiber-enriched meal strongly attenuates postprandial gastrointestinal peptide release in healthy young adults. J Nutr 2010;140:737-44.

93
PAPER 2
Kia Halschou-Jensen, Knud Erik Bach Knudsen, Søren Nielsen, Klaus Bukhave & Jens Rikardt Andersen. Effect of L-arabinose on glucose uptake from mixed meals
Status: Manuscript ready for submission, Br J Nutr.

94

95
Effect of L-arabinose on glucose uptake from mixed meals
Kia Halschou-Jensen1, Knud E Bach Knudsen2, Søren Nielsen3, Klaus Bukhave1 and Jens R
Andersen1
1Department of Nutrition, Exercise and Sports, University of Copenhagen, Rolighedsvej 30 DK-
1958 Frederiksberg C, Denmark.
2Department of Animal Science, Aarhus University, Blichers Allé 20, DK-8830 Tjele, Denmark.
3Department of Endocrinology M, Aarhus University Hospital, Wilhelm Meyers Allé 3 8000
Aarhus.
Correspondence:
Jens Rikardt Andersen, Department of Nutrition, Exercise and Sports, Faculty of Sciences,
University of Copenhagen, Rolighedsvej 30, 1958 Frederiksberg C, Denmark. Phone:
+4535332504. Fax: +4535332483. Mobile +4523346654, E-mail: [email protected]
Running Head: Inhibition of sucrase by L-arabinose in a mixed meal
Clinical trial registration: ClinicalTrials.gov (ID: NCT00302302)
Keywords: Sucrose, maltose, L-arabinose, glucose, insulin, C-peptide, gastric emptying

96
ABSTRACT L-arabinose added to a sucrose rich drink have positive effects on the postprandial blood glucose, insulin and C-peptide in humans, but the effects of L-arabinose in mixed meals are unknown. In vitro studies indicate an inhibiting effect of arabinose on maltase. The purpose was to investigate if the positive effects of L-arabinose added to a sugar drink could be reproduced in a mixed meal containing sucrose and/or starch. In study 1, 17 healthy men participated in a randomized, double-blind, crossover study. Two different breakfast meals containing sucrose and starch (Meal A) or starch (Meal B) supplemented with 0 %, 5 %, and 10 % by weight of L-arabinose were tested after a 12 h fast. In study 2, 6 healthy men participated in a randomized, double-blind, crossover study. Meal B was served in two different consistence and a fluent meal with maltose supplemented with 0 % and 20 % L-arabinose. In addition, 1.5 g of paracetamol was given. Plasma glucose, insulin and C-peptide was measured regularly for 3 h postprandial. The two human studies produced no effects on glucose, insulin and C-peptide peaks, time to peak or the area under the curve. Over all, it was not possible to reproduce the beneficial/favourable effects of L-arabinose tested in sucrose drinks when L-arabinose was mixed in a solid or semi-solid meal. The inhibitory effects from the in vitro studies of arabinose on maltase could not be reproduced in vivo in humans.
INTRODUCTIONThe number of people with type 2 diabetes (T2D) is estimated to increase rapidly to reach 552 million within the next 25 years. Several studies indicate that the development of insulin resistance is a major risk factor for developing T2D, hypertension and cardiovascular diseases(1;2) Within nutritional research, the glucose metabolism is in focus and even a slight increase in the postprandial glucose response increases the risk of developing T2D(3-5). One of the methods for regulating blood glucose and insulin secretion is our intake of food components known to have a large effect on blood glucose. This is especially intake of starch and sugar and the intake should be decreased, which can be a challenge in industrialized countries including Denmark, where the overall intake of starch and sugar are high(6). Increasing interest and research have focused on substances inhibiting carbohydrate digestive enzymes(7-9), and thereby delaying absorption. Pentoses, like L-arabinose have been of interest as disaccharidase inhibitor and several animal studies with rats and pigs have demonstrated a reduction in the postprandial glucose(9) and insulin responses(9;10) following ingestion of sucrose in combination with different concentrations of L-arabinose. A human study, supplementing L-arabinose in a sucrose rich diet, in both healthy and T2D patients showed a decreased glucose response after ingestion of 3 % and 4 % L-arabinose(11). Another study demonstrated that L-arabinose in a sucrose rich drink had a decreasing effect on the postprandial blood glucose, insulin and C-peptide and that the mechanism behind probably is an uncompetitive inhibition of the brush border enzyme, sucrase(12). The use of higher dietary doses of sucrose, however, would be unfeasible in terms of palatability and with limited clinical applicability since very few people consume sucrose in quantities like 75 g in one drink as used in the previously mentioned study.

97
Greater importance would be the combination of L-arabinose with the main glucose providing carbohydrate in the diet, starch. A recently performed in vitro study with L-arabinose and D-xylose demonstrated an inhibiting effect of maltase(13). Maltase is a disaccharidase important in the breakdown of starch and is located in the brush border. The data indicated that L-arabinose may have a decreasing effect on blood glucose and insulin levels after intake not only of sucrose but also of starch. For public health purposes, the main effects would be expected, if the blood glucose-lowering components could be incorporated in the habitual and/or recommended diet for the majority of the population. It is hypothesised that similar effects on glucose and insulin responses of L-arabinose added in sucrose drinks can be found if L-arabinose is added a mixed meal containing sucrose and/or starch. Furthermore, we wanted to investigate, the possible inhibiting effects of L-arabinose on maltase separately.
EXPERIMENTAL METHODS
Design Study 1 This study had a double-blinded, controlled six-way crossover design. All subjects participated in six test days of approximately 5 hours duration. They were served two different meals with three different concentrations of L-arabinose added. Each test day was separated by a one week washout period. Subjects was instructed to refrain from alcohol and intense physical activity 24 hours before each test day and to fast from 8:00 pm the evening before the test day and only 0.5 L water was allowed in the fasting period. The subjects were instructed to avoid physical stress on the morning of each test day and told to maintain their habitual diet and other living habits throughout the study period. Study 2 To explain some the results in study 1, a smaller study was designed with focus on starch and the possible inhibition of maltase in the intestine. The study was design as a double-blinded, controlled six-way crossover intervention. All subjects participated in six test days, corresponding to approximately 5 hours. Each test day was separated by a minimum of 48 hours washout period. To assess variations of gastric emptying they were served three different meals varying from fluent to solid with 0 % or 20 % of added L-arabinose. I addition paracetamol was chosen as an indirect marker to assess gastric emptying. Paracetamol is not absorbed from the stomach but from the small intestine and measured in the blood (14) Subjects were instructed to behave exactly as in study 1 during the test period. Both studies were conducted at the Department of Nutrition, Exercise and Sports after an overnight fast.

98
Subjects Study 1 Seventeen healthy male subjects with normal fasting blood-glucose were recruited for the study. The inclusion criteria were: healthy male, between 18-30 years of age, normal weight (body mass index; in kg/m²; 18-25), waist circumference < 94 cm (defined as abnormal > 94 cm for European men), no use of dietary supplements or regular use of medicine, not an elite athlete or changes in physical activity during the study, no blood donation within the past three months before entering the study, no smoking or alcohol intake > 21 drinks/week. The characteristics for the included subjects was (mean ± SD) age 22.5 (±2.6), BMI 22 (±1.22), Blood pressure 131/71 (±12/8), pulse 68 (±12) Males were recruited from the Copenhagen area by internet advertisement and intranet at University of Copenhagen. After verbal and written information about the study, all the subjects gave their written consent. The protocols for the postprandial study was approved by the Ethics Committee of the Region of Copenhagen and registered at ClinicalTrials.gov (ID : NCT00302302). The study was carried out at the Department of Nutrition, Exercise and Sports, University of Copenhagen. Study2 Six healthy male subjects were included in study 2. The inclusion criteria were the exact same as in study 1. Baseline characteristics for the six subjects (mean ± SD) was age 23.3 (±2.9), BMI 22.4 (±1.4), Blood pressure 127/70 (±12/4), pulse 60 (±6). Males were recruited from the Copenhagen area by internet advertisement and three subjects participated in both studies. The Ethics Committee of the Region of Copenhagen approved the protocol for the postprandial study. Meal designs Study 1 Test meal A: Containing 2 MJ in total divided in to 8.4 E % of protein, 34.2 E % fat and 57.4 E % carbohydrate. The meal consisted of a bun and a cake containing either 0 %, 5 % or 10 % arabinose in weight % of the starch and sugar content, 10 g of raspberry jam with 0 %, 5% or 10% added arabinose, 10 g butter, tea of universal herbs and 300 ml of water. This corresponds to 0 g, 2.9 g or 5.9 g L-arabinose in the meal. Test meal B: Containing 2.1 MJ in total, divided in to 13.5 E% protein, 29.1 E % fat and 57.4 E% carbohydrate. The meal consisted of two buns, containing 0 %, 5 % or 10 % arabinose in weight % of starch, 20 g cheese, 10 g butter, tea of universal herbs and 300 ml of water. This corresponds to 0 g, 2.5 g or 4.9 g L-arabinose in the meal.

99
Study 2 Solid test meal: Containing 2.1 MJ in total, divided in to 13.5 E% protein, 29.1 E % fat and 57.4 E% carbohydrate. The meal consisted of two buns, containing 0 % or 20 % arabinose in weight % of starch, 20 g cheese, 10 g butter, 100 ml tea of universal herbs and 300 ml of water. This corresponds to 0 or 10.2 g arabinose in the meal. Semi-solid test meal Containing 2.1 MJ in total, divided in to 13.5 E% protein, 29.1 E % fat and 57.4 E% carbohydrate. The meal consisted of two buns, containing 0 % or 20 % arabinose in weight % of starch, 20 g cheese 45 +, 10 g butter, 100 ml tea of universal herbs and 300 ml of water. The solids were blended with 150 ml of water and served as porridge. The remaining 50 ml water was served as a drink together with the tea. This corresponds to 0 or 10.2 g arabinose in the meal. Fluent test meal: Containing 75 g of maltose in 300 ml water with and without 20 % L-arabinose added (corresponding to 15 g L-arabinose in the meal) Test products Buns and muffins were baked with 0 %, 5 %, 10 %, and 20 % arabinose, respectively at the bakery Nordic Sugar A/S in Arløv, Sweden. Arabinose was added as weight % arabinose in relation to starch and sucrose content. L-arabinose was purchased from Danisco A/S, Denmark. Table 1 and 2 present the recipes for buns and muffins. To assess the amount of arabinose in the test meals, the buns and muffins were analyzed after baking to determine the arabinose content. The analyses were carried out at the Department of Animal Science, University of Aarhus, Denmark. Two different methods were used for determination of arabinose. Direct hydrolyses; swelling with 12 M H2SO4 followed by hydrolysis with 2 M H2SO4 (15) was used to analyze the buns. The second method applied on the muffins was direct hydrolysis following removal of lipids by extraction with diethyl ether. Arabinose in the extracts or hydrolysates was reduced with potassium borohydride to the corresponding sugar alcohol, which was acetylated with acetic anhydride using N-methyl imidazole as catalyst (16) before the gas chromatographic analysis. The dry matter content in dough, buns and muffins was determined by freeze-drying. The recovery of added L-arabinose to the buns was estimated to 89±7.6 % and 73±4.0 % for the muffins. The recovery data for L-arabinose are presented in Table 3. Measurements Study 1 On every test day, the subjects were weighed to the nearest 0.05 kg on a decimal scale (Lindeltronic 8000, Copenhagen, Denmark). A venflon catheter was inserted in the antecubital vein and the

100
subjects were ordered to rest for 10 minutes before the baseline blood samples to measure glucose, insulin and C-peptide were conducted. Fasting blood samples were collected at both -15 min and again at 0 min to ensure proper baseline values. The test meal was served immediately after the blood sample at 0 min, and had to be consumed within 10 min. Further blood samples were drawn at 15, 30, 45, 60, 75, 90, 105, 120 and 180 min after the test meal. During the postprandial period the subjects should be at rest and were not allowed to sleep. Study 2 The same program as in study 1 was repeated, In addition, the subjects was served 1.5 g of paracetamol in 50 ml water together with the test meal immediately after the blood sample at 0 min, and had to consume the meal within 10 min. They were instructed in mixing the meal and the dissolved paracetamol. The following parameters were used for identifying the rate of paracetamol absorption: peak plasma concentration (Cmax), the time to reach Cmax (tmax), the area under the curve (AUC) and the slope for the three different meals. Post study On every test day side-effects: Gastrointestinal symptoms (heartburn, distension, nausea, vomiting, stomach ache and rumbling in the gut, flatulence and diarrhoea), were registered for the following 24 hours by questionnaires using a five-level scales. Laboratory analysis Blood glucose concentration was analyzed by an enzymatic colorimetric method performed in an ABX Pentra (HORIBA ABX, Montpellier, France). Insulin and C-peptide were measured by chemiluminescent immunometric assay (Immulite 1000, Dianostic Products, Los Angeles, CA). Paracetamol concentrations were analyzed by an enzyme-specific reaction method on a Horiba ABX Pentra 400 analyzer (HORIBA ABX, Montpellier, France). Statistical analysis and calculations The incremental area under the curve (iAUC) or above the curve (iAOC), ignoring the area beneath (or above in the case of iAOC) the fasting concentration was calculated geometrically by applying the trapezoid rule. The iAUC or the iAOC was calculated for the entire test period for 0 to 180 min. Postprandial response curves were evaluated by comparing peak values and incremental area under the curve (iAUC) using analysis of covariance with fasting values as covariates, and time to peak values using analysis of variance. A repeated measures ANOVA analysis was used to examine the effect of meal and time on the postprandial response curves. Data were controlled for homogeneity of variance veried by residual plots and assumption of normal distribution was investigated using normal probability plots, and histogram plots. A significant result was followed by using Tukey-Kramer test for post hoc analysis. All data are presented as means ± SEM unless otherwise indicated and the statistical signicance level is dened as p < 0.05. All statistical analyses and

101
calculations were performed using the Statistical Analysis System software package, version 9.2 (SAS Institute Inc., Cary, NC). Sample size calculations were based on a standard formula using variance data from a previous study L-arabinose added a sugar drink (12). A sample of twenty-seven subjects was sufcient to detect a difference of 60 pmol/L in concentration of C-peptide, with a power of 80 % and α=0.05. Since this study is a paired design, the number of subjects was reduced to seventeen.
RESULTS
Study 1 Glucose Postprandial plasma glucose showed no difference in peak value, time to peak or iAUC for neither test meal A nor test meal B. Figure 1 Insulin For postprandial serum insulin, there was no difference between peak value or time to peak in neither test meals. iAUC for test meal A were not different comparing doses of arabinose but meal B showed difference in iAUC (P=0.028) were meal with 10 % arabinose had a 8 % larger iAUC than the meal with 0% arabinose added (P=0.022)( Figure 1) C-peptide For postprandial serum insulin, there were no difference between peak value and time to peak between test meals. No difference in iAUC for test meal A. iAUC for Test meal B showed a difference between the meal with 0% and the 10% meal (P=0.03). In this case the iAUC was smaller with the 10 % arabinose added (Figure 1) Study 2 Glucose There was no difference between 0% and 20% arabinose in the solid meal, semisolid meal or fluent meal in plasma glucose peak, time to peak or iAUC. (Figure 2) Insulin There was no difference between 0% and 20% arabinose in the solid meal, semisolid meal or fluent meal in serum insulin peak, time to peak or iAUC. Figure 2 C-peptide There was no difference between 0% and 20% arabinose in solid meal, semisolid meal or fluent meal in serum-C-peptide peak, time to peak or iAUC. (Figure 2) Paracetamol The paracetamol concentration in plasma showed no difference between solid, semisolid and fluent meal for neither AUC nor Cmax.

102
The time to maximum concentration (Tmax) in plasma was different (P<0.0001) in the three meals. Tmax for solid meal was 35 min compared with 88 min for semisolid meal (P= 0.08) and 118min for the fluent meal (P< 0.0001). Furthermore, the slope, which describe the rate of stomach emptying, was similar for the fluent and semisolid meal (0.008 and 0.0046) whereas the slope for the solid meal was negative (- 0.006).
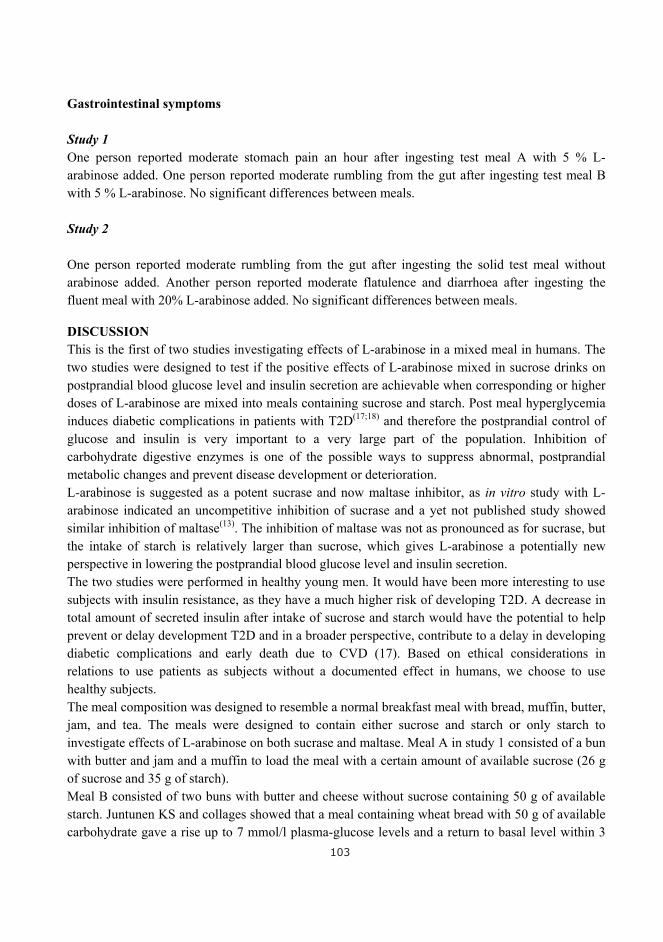
103
Gastrointestinal symptoms Study 1 One person reported moderate stomach pain an hour after ingesting test meal A with 5 % L-arabinose added. One person reported moderate rumbling from the gut after ingesting test meal B with 5 % L-arabinose. No significant differences between meals. Study 2 One person reported moderate rumbling from the gut after ingesting the solid test meal without arabinose added. Another person reported moderate flatulence and diarrhoea after ingesting the fluent meal with 20% L-arabinose added. No significant differences between meals.
DISCUSSION This is the first of two studies investigating effects of L-arabinose in a mixed meal in humans. The two studies were designed to test if the positive effects of L-arabinose mixed in sucrose drinks on postprandial blood glucose level and insulin secretion are achievable when corresponding or higher doses of L-arabinose are mixed into meals containing sucrose and starch. Post meal hyperglycemia induces diabetic complications in patients with T2D(17;18) and therefore the postprandial control of glucose and insulin is very important to a very large part of the population. Inhibition of carbohydrate digestive enzymes is one of the possible ways to suppress abnormal, postprandial metabolic changes and prevent disease development or deterioration. L-arabinose is suggested as a potent sucrase and now maltase inhibitor, as in vitro study with L-arabinose indicated an uncompetitive inhibition of sucrase and a yet not published study showed similar inhibition of maltase(13). The inhibition of maltase was not as pronounced as for sucrase, but the intake of starch is relatively larger than sucrose, which gives L-arabinose a potentially new perspective in lowering the postprandial blood glucose level and insulin secretion. The two studies were performed in healthy young men. It would have been more interesting to use subjects with insulin resistance, as they have a much higher risk of developing T2D. A decrease in total amount of secreted insulin after intake of sucrose and starch would have the potential to help prevent or delay development T2D and in a broader perspective, contribute to a delay in developing diabetic complications and early death due to CVD (17). Based on ethical considerations in relations to use patients as subjects without a documented effect in humans, we choose to use healthy subjects. The meal composition was designed to resemble a normal breakfast meal with bread, muffin, butter, jam, and tea. The meals were designed to contain either sucrose and starch or only starch to investigate effects of L-arabinose on both sucrase and maltase. Meal A in study 1 consisted of a bun with butter and jam and a muffin to load the meal with a certain amount of available sucrose (26 g of sucrose and 35 g of starch). Meal B consisted of two buns with butter and cheese without sucrose containing 50 g of available starch. Juntunen KS and collages showed that a meal containing wheat bread with 50 g of available carbohydrate gave a rise up to 7 mmol/l plasma-glucose levels and a return to basal level within 3

104
hours(19). This is desirable conditions for measuring the postprandial blood response. Serum-C-peptide is used as a measure of beta cell function and thereby insulin secretion. C-peptide and insulin are secreted in equivalent amounts but insulin is eliminated from the blood much faster than C-peptide and is extracted in the liver, making C-peptide a more precise measurement of insulin production(20). L-arabinose was added as w/w % of sucrose and starch. The concentrations - 5% and 10% L-arabinose - was added the meals, based on a previous study with L-arabinose in a sucrose drink with a maximum of 8 % arabinose added(13). In the current study, L-arabinose was baked into buns and muffins and was added to the jam in meal A. To verify the added L-arabinose concentration in the meals, the buns and muffins were analyzed for L-arabinose content after baking. It showed a 90 % and 70 % recovery of L-arabinose in buns and muffins respectively. A 100 % recovery was expected and further analyses were made. Extracting fat from muffins before hydrolyzes and analyzing the dough of both buns and muffins, revealed the same recovery. After several experiments, it was assumed that all L-arabinose added was available in the meal and presented to the intestine and that the low recovery of L-arabinose in muffins was a reflection of the method used for extracting/measuring the L-arabinose content. The disintegration of solid foods starts in the mouth, followed by a gastric disintegration that is less studied and understood(21). Due to the complexity of gastric digestion of foods, which involves several factors as fed/fast state, gastric acid, enzymatic reactions and hydrodynamic and mechanical forces, the digestion process is diverse. The rate of gastric emptying is an important step in digestion and studies have showed that the rate of gastric emptying is affected by the composition of the food and there will be a longer transition time for solid foods than for a fluent meal(22), and accordingly, a slower absorption. To reveal some of the limitations in this first study an indirect measurement of gastric emptying was investigated in study 2. At present, various methods are available to assess gastric emptying, of which scintigraphy is the best validated and considered the golden standard(23;24). However, scintigraphic measurements require medical equipment and radiation exposure. Therefore a more simple and easy method to perform is of interest in these studies. Willems and colleagues found that the paracetamol method generally correlates well to scintigraphy of liquid phase gastric emptying(14). Orally administrated paracetamol is poorly absorbed in the stomach but is rapidly absorbed from the small intestine. Since gastric emptying is a rate-limiting step, it is believed that the rate of appearance of paracetamol in the blood reflects the rate of gastric emptying(25). One of the most important conditions for measurements of gastric emptying is that the marker is emptied at the same rate as the compound in question. Whether this is true for the solid and semi-solid meals used here is questionable. Sucrose Meal A in study 1 was designed to show if L-arabinose added to a solid meal containing sucrose could affect the postprandial insulin secretion by inhibiting sucrase in the brush border membrane and thereby delay the glucose uptake.

105
The main findings for meal A were no difference in postprandial blood glucose, insulin and C-peptide regardless the dose of L-arabinose added. The delayed gastric emptying after ingesting solids could affect the presentation of L-arabinose, disaccharides and starch to the epithelium of the small intestine. Results from serum paracetamol in study 2 indicates that the gastric emptying rate (GER) is faster in the fluent meal compared to the semifluent meal and thereby a confirmation of the assumptions about GER as a factor that may affect the results for the sucrose meal. Additionally, the concentration of sucrose in the meal could be important, as the amount of sucrose in the drinking study were three times as high as in meal A. The mixture of the chyme and the gastric release, gives reasons to think, that a “wash out” of L-arabinose might be one reason of the missing results. Consequently, L-arabinose concentration in study 2 was increased to 20 % L-arabinose. Starch A not yet published in vitro study with L-arabinose and D-xylose showed an uncompetitive inhibition of maltase in Caco2 cells(13). A rat study with L-arabinose showed no effect after intake of a rice starch challenge measured on postprandial blood glucose(26). A Japanese study (abstract in English) found similar effects in rats ingesting sucrose added D-xylose or L-arabinose. Here an inhibiting effect of both sucrase and maltase was found, but the inhibitory activities of maltase was weaker than that of sucrase (27). Although the inhibitory effect of maltase activity seems to be less pronounced than for sucrase, it let us to investigate the interaction of L-arabinose with the absorption of glucose from the main glucose providing carbohydrate, starch. The perspectives in affecting the glycemic load from starch and thereby reduce hyperglycemia among pre diabetic individuals could be very important in preventing or delay the onset of diabetes mellitus (18). The effect of L-arabinose in starch was investigated in both study 1 and study 2. There were no effects on plasma glucose, serum insulin or C-peptide after ingestion of L-arabinose mixed in a starch meal containing up to 10 % L-arabinose (meal B). A few significant results were found in test meal B where iAUC for insulin and C-peptide were greater in meal B with 0 % L-arabinose than meal B with 10 % L-arabinose. These results were conflicting compared to our expectation and meal B was consequently chosen for study 2. No fluent version of starch have been tested and based on the results about gastric emptying and the probability of dilution of the gastric volume the dose were increased to 20 w/w% L-arabinose. Furthermore, the meals were designed as three different meals with different texture; a fluent maltose drink, a semi solid meal and a solid meal, all added 20 % L-arabinose. Paracetamol were added as an indirect marker for gastric emptying. However, the findings were rather contradictory in the sense that the observed difference in GER for the solid meal had a faster Tmax and a negative GER compared to the semisolid and fluent meal which both showed late Tmax. These contradictory findings could be due to the paracetamol method itself. The subjects were instructed to mix paracetamol dissolved in water with the test meal during intake. Whether paracetamol was mixed efficiently with the meal is questionable and may be one of the reasons to the findings. Other studies using this method baked paracetamol into the test products(19;28). Additionally, it could be questioned if the method is feasible using a solid meal as test meal.

106
In conclusion, the results of our study showed that L-arabinose had the highest sucrase inhibiting effect and most promising when mixed in sucrose-containing drinks compared to starch and solid mixed meals containing sucrose and starch.

107
Acknowledgements The authors thank Mona Pedersen, Elin Skytte, Kristina Møller, for expert technical assistance, and the subjects for their willing participation. Financial Support Nordic Sugar (Copenhagen, Denmark) funded the research but had no influence on the protocols, design, calculations or publishing of the manuscript. Conflict of Interest None of the other authors had any conflicts of interest. Nordic Sugar A/S (Copenhagen, Denmark) supported PhD student Kia Halschou-Jensen but had no influence on the protocols, design, calculations, or publishing of the manuscript. Authorship The contribution of each author was as follows. Ideer and protocol KH-J, JRA, KB, SN, KEBK. Data collection KH-J and data analysis KH-J, JRA, KB, KEBK. Writing the manuscript KH-J, JRA, KB, SN, KEBK and approval of manuscript KH-J, JRA, KB, SN, KEBK. None of the authors had any conflict of interest.

108
REFERENCES
(1) Lorenzo CM, Wagenknecht LED, D'Agostino RBJ et al. (2010) Insulin Resistance, [beta]-Cell Dysfunction,
and Conversion to Type 2 Diabetes in a Multiethnic Population: The Insulin Resistance Atherosclerosis Study. Diabetes Care 33(1):67-72.
(2) DeFronzo RA. (2010) Insulin resistance, lipotoxicity, type 2 diabetes and atherosclerosis: the missing links. The Claude Bernard Lecture 2009. Diabetologia 2010 53(7):1270-87
(3) DECODE Study Group, on behalf of the European Diabetes Epidemiology Group. (2001) Glucose Tolerance and Cardiovascular Mortality: Comparison of Fasting and 2-Hour Diagnostic Criteria. Arch Intern Med 12;161(3):397-405.
(4) Sorkin JDM, Muller DCM, Fleg JLM et al. (2005) The Relation of Fasting and 2-h Postchallenge Plasma Glucose Concentrations to Mortality: Data from the Baltimore Longitudinal Study of Aging with a critical review of the literature. Diabetes Care 2005 Nov;28(11):2626-32.
(5) Ceriello A, Colagiuri S, Gerich J, Tuomilehto J. (2008) Guideline for management of postmeal glucose. Nutr Metab Cardiovasc Dis 18(4):17-33.
(6) Pedersen AN, Fagt S, Groth MV et al. (2010) Danskernes kostvaner 2003-2008. [Dietary habits in Denmark 2003-2008.].
(7) Tucci SA, Boyland EJ, Halford JC. (2010) The role of lipid and carbohydrate digestive enzyme inhibitors in the management of obesity: a review of current and emerging therapeutic agents. Diabetes Metab Syndr Obes 3:125-43.
(8) McDougall GJ, Stewart D. (2005) The inhibitory effects of berry polyphenols on digestive enzymes. Biofactors 23(4):189-95.
(9) Seri K, Sanai K, Matsuo N et al. (1996) L-arabinose selectively inhibits intestinal sucrase in an uncompetitive manner and suppresses glycemic response after sucrose ingestion in animals. Metabolism 45(11):1368-74.
(10) Osaki S, Kimura T, Sugimoto T et al. 2001 L-arabinose feeding prevents increases due to dietary sucrose in lipogenic enzymes and triacylglycerol levels in rats. J Nutr 131(3):796-9.
(11) Inoue S, Sanai K, Seri K. (2000) Effect of L-Arabinose on blood glucose level after ingestion of sucrose-containing food in human. J Jpn Soc Nutr Food Sci 53, 243-247.(article in japanease)
(12) Krog-Mikkelsen I, Hels O, Tetens I et al. The effects of l-arabinose on intestinal sucrase activity: dose-
response studies in vitro and in humans. The Am J of Clin Nutr 94(2):472-8.
(13) Krog-Mikkelsen I, Petersen SB, Halschou-Jensen K et al. (2013) The effects of D-xylose on intestial sucrase and maltase activity in vitro, and on sucrase activity in humans. Ref Type: Unpublished Work
(14) Willems M, Quartero AO, Numans ME. (2001) How useful is paracetamol absorption as a marker of gastric emptying? A systematic literature study. Diges Diseases and Sci 46(10):2256-62.
(15) Knudsen KEB. (1997) Carbohydrate and lignin contents of plant materials used in animal feeding. Ani Feed Sci and Tech 67(4):319-38.

109
(16) Connors KA, Pandit NK. (1978) N-Methylimidazole As A Catalyst for Analytical Acetylations of Hydroxy Compounds. Analytical Chemistry ;50(11):1542-5.
(17) Del Prato S, Tiengo A. (2001) The importance of first-phase insulin secretion: implications for the therapy of type 2 diabetes mellitus. Diabetes-Metabolism Research and Reviews ;17(3):164-74.
(18) Salmeron J, Manson JE, Stampfer MJ et al. (1997) Dietary fiber, glycemic load, and risk of non-insulin-dependent diabetes mellitus in women. JAMA 12;277(6):472-7.
(19) Juntunen KS, Niskanen LK, Liukkonen KH et al. (2002) Postprandial glucose, insulin, and incretin responses to grain products in healthy subjects. Am J Clin Nutr 75(2):254-62.
(20) Horwitz DL, Starr JI, Mako ME et al. (1975) Proinsulin, insulin, and C-peptide concentrations in human portal and peripheral blood. J Clin Invest 55(6):1278-83.
(21) Kong F, Singh RP. (2008) Disintegration of solid foods in human stomach. J Food Sci 73(5):R67-R80.
(22) Maes BD, Hiele MI, Geypens BJ et al. (1998) Gastric emptying of the liquid, solid and oil phase of a meal in normal volunteers and patients with Billroth II gastrojejunostomy. Euro J of Clin Invest 28(3):197-204.
(23) Parkman HP, Harris AD, Krevsky B et al. (1995) Gastroduodenal Motility and Dysmotility - An Update on Techniques Available for Evaluation. Am J of Gastro 90(6):869-92.
(24) Smout A, Horowitz M, Armstrong D. (1994) Methods to Study Gastric-Emptying. Diges Diseases and Sci 39(12):S130-S132.
(25) Heading RC, Nimmo J, Prescott LF et al. (1993) Dependence of Paracetamol Absorption on Rate of Gastric Emptying. Br J of Pharm 47(2):415-21.
(26) Preuss HG. (2009) Bean Amylase Inhibitor and Other Carbohydrate Absorption Blockers: Effects on Diabesity and General Health. J of the Am Col of Nutr 28(3):266-76.
(27) Asano T, Yoshimura Y, Kunugita K. (1996) Sucrase inhibitory activity of D-xylose and effect on the elevation og blood glucose in rats. J Jpn Soc Nutr Food Sci 43[3], 157-162. (article in Japanese)
(28) Najjar AM, Parsons PM, Duncan AM et al. (2009) The acute impact of ingestion of breads of varying
composition on blood glucose, insulin and incretins following first and second meals. Br J of Nutr 101(3):391-8.

110
Tables
Table 1 Recipes for buns used in meal A and B. Weight 70 g/ bun
Ingredients (g) w % starch % sucrose % starch+sucrose % Water 1000 29.94 Yeast 80 2.40 Yellow baking syrup* 100 2.99 0.99 Fibrex 595 30 0.90 Margarine 200 5.99 Milk powder 100 2.99 Salt 30 0.90 Wheat flour** 1800 53.89 36.43 0.22 Total 3340 100 36.43 1.20 37.63 * 33% sucrose ** 67.6 % starch, 0.4 % sucrose and 2.5 % fiber Weight 70 gram/bun

111
Table 2 Recipes for muffins used in meal A. Weight 50 g/muffin
Ingredients (g) w % starch % sucrose % starch+sucrose % Margarine 1000 14.29 Milk 850 12.14 Sugar 2200 31.43 31.43 Egg 1000 14.29 Wheat flour* 1600 22.86 15.45 0.09 Baking powder** 50 0.71 0.29 Crème powder incl. vanilla*** 300 4.29 3.69 Total 7000 100 19.42 31.52 50.94 * 67.6 % starch, 0.4 % sucrose and 2.5 % fiber ** 40 % starch *** 86 % starch Weight 50 gram/muffin

112
Table 3 Recovery of L-arabinose in buns and muffins used in meal A and B.
Sampel DM (%) Added L-
arabinose (g) Added arabinose (g) Corrected for DM
Arabinose recovered (g)*
Recovery (%)
Bun 5% 68,395 1.79 2.62 2.45 93.5%
Bun 10 % 70,275 3.52 5.01 4.75 94.8 %
Bun 20 % 68.55 8.1 9.9 9.1 81%
Muffin 5% 83.34 2.48 2.97 2.1 70.7%
Muffin 10 % 82.31 4.85 5.89 4.5 76.4%

113
Legends for figures Figure 1. Mean (±SEM) plasma and serum concentrations of glucose, insulin, and C-peptide in 17 normal men after intake of Meal A consisting of a bun and a muffin added arabinose, butter, raspberry jam added arabinose and tea with 0, 5 and 10 w/w % L-arabinose of sucrose and starch. Meal B consisting of two buns added arabinose, butter, cheese and tea with 0, 5 and 10 w/w % L-arabinose of sucrose and starch. No significant effects of peak, time to peak or iAUC in meal A. No significant effects of peak, time to peak meal B. iAUC were in meal B with 10 % arabinose had a 8 % greater iAUC than the meal B with 0% arabinose (P=0.022). Figure 2. Top: Mean (±SEM) plasma and serum concentrations of glucose, insulin, and C-peptide in 6 normal men after intake of Solid Meal B consisting of two buns added arabinose, butter, cheese and tee with 0 and 20 w/w % L-arabinose of starch. No significant effects of peak, time to peak, or iAUC. Middle: Mean (±SEM) plasma and serum concentrations of glucose, insulin, and C-peptide in 6 normal men after intake of Semi-solid Meal B consisting of two buns added arabinose, butter, cheese and tee with 0 and 20 w/w % L-arabinose of starch. No significant effects of peak, time to peak, or iAUC. Bottom: Mean (±SEM) plasma and serum concentrations of glucose, insulin, and C-peptide in 6 normal men after intake of maltose drink with 75 g of maltose in 300 ml water added 0 and 20 w/w % L-arabinose. No significant effects of peak, time to peak, or iAUC.

114
Figures Figure 1
4,00
5,00
6,00
7,00
8,00
0 15 30 45 60 75 90 105 120 135 150 165 180Plasma glucose (m
mol/l)
Time (min)
A controlA 5%A 10%B controlB 5%
0,0
50,0
100,0
150,0
200,0
250,0
300,0
0 15 30 45 60 90 120 180
Seru
m in
sulin
(pm
ol/l)
Time (min)
0,0
500,0
1000,0
1500,0
2000,0
2500,0
0 15 30 45 60 90 120 180
Seru
m C
-pep
tide
(pm
ol/l)
Time (min)
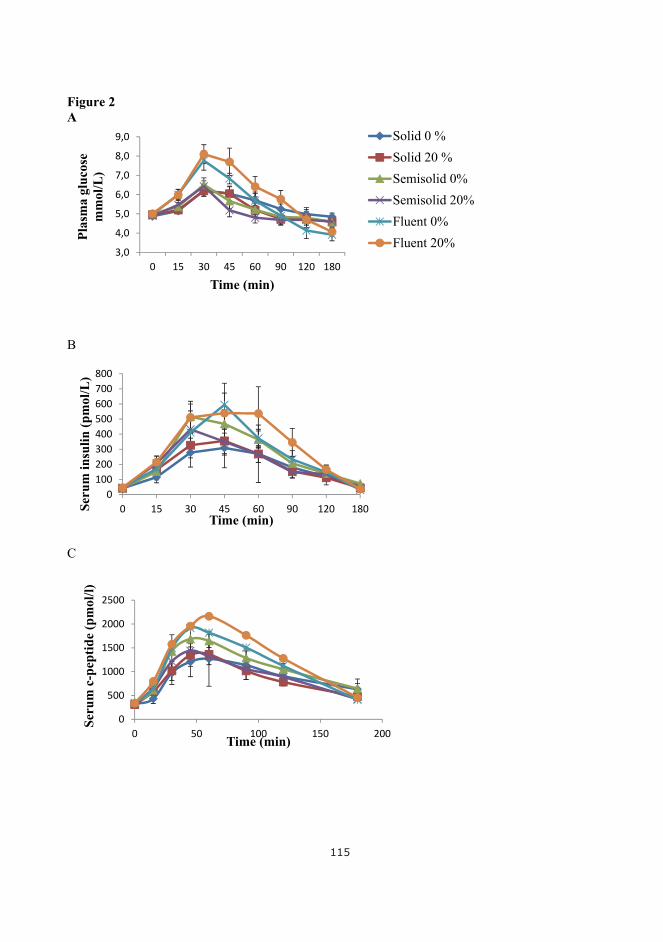
115
Figure 2 A
B
C
3,0
4,0
5,0
6,0
7,0
8,0
9,0
0 15 30 45 60 90 120 180
Plas
ma
gluc
ose
mm
ol/L
)
Time (min)
Solid 0 %Solid 20 %Semisolid 0%Semisolid 20%Fluent 0%Fluent 20%
0100200300400500600700800
0 15 30 45 60 90 120 180Seru
m in
sulin
(pm
ol/L
)
Time (min)
0
500
1000
1500
2000
2500
0 50 100 150 200
Seru
m c
-pep
tide
(pm
ol/l)
Time (min)

116

117
PAPER 3
Inger Krog-Mikkelsen, Sesilje Bondo Petersen, Kia Halschou-Jensen, Jens Juul Holst, Jens Rikardt Andersen & Klaus Bukhave: Effects of xylose on intestinal sucrase activity, in vitro and in humans. Status: Manuscript submitted, Am J Clin Nutr.

118

119
The effects of D-xylose on intestinal sucrase and maltase activity in vitro, and on sucrase
activity in humans
Inger Krog-Mikkelsen, Sesilje Bondo Petersen, Kia Halschou-Jensen, Ole Hels, Jens Juul
Holst, Jens Rikardt Andersen, and Klaus Bukhave.
Department of Nutrition, Exercise and Sports, University of Copenhagen, DK-1958
Frederiksberg C, Denmark (IK-M, SBP, KHJ, JRA, KB).
Department of Nutrition, The National Food Institute, DK-2860 Søborg, Denmark (OH).
NNF Center for basic Metabolic Research, Department of Biomedical Sciences, the Panum
Institute, University of Copenhagen, DK-2200 Copenhagen N, Denmark (JJH).
Author list for indexing: Krog-Mikkelsen, Petersen, Halschou-Jensen, Hels, Holst, Andersen,
and Bukhave.
Correspondence:
Jens Rikardt Andersen, Department of Nutrition, Exercise and Sports, University of
Copenhagen, Rolighedsvej 30, 1958 Frederiksberg C, Denmark. Phone: +4535332504. Fax:
+4535332483. Mobile +4523346654, E-mail: [email protected]
Financial support:
Nordic Sugar, Copenhagen, Denmark funded the research, but had no influence on protocols,
design, calculations or preparation of the manuscript
No conflicts of interest for any of the authors.

120
Abbreviations used: EI, energy intake; GLP-1, glucagon-like peptide-1; iAUC, incremental
area under the curve; iAOC incremental area over the curve, VAS, visual analog scale.
Approved by the Regional Ethical Committee to be in accordance with the Helsinki-II
declaration (KF) 11 324909
Running Head: Inhibition of sucrase and maltase by D-xylose

121
ABSTRACT Background: Like L-arabinose, D-xylose may inhibit intestinal disaccharidase activity, and thereby delay sucrose and maltose digestion. Objective: To investigate the effects of high doses xylose and arabinose on intestinal disaccharidase activity in vitro and on sucrase activity and glucose metabolism in vivo. Design: In vitro: Homogenized Caco-2 cells were used as enzyme preparation with sucrose as substrate in concentrations from 7 to 280 mM with 1.4, 2.8, and 5.6 mM D-xylose as inhibitor. Additionally, the effects of 5.6 mM D-xylose and L-arabinose on maltase activity were tested. Glucose released by the enzymatic reaction was measured after 30 min. In vivo: 14 healthy subjects completed a randomized double-blinded cross-over study with sucrose drinks supplemented with 4 or 8 w/w% D-xylose or 8 w/w% L-arabinose. Blood was collected during fasting and for 3-h postprandially. Appetite sensations and energy intake were registered. Results: In vitro: Concentrations of 1.4, 2.8, and 5.6 mM D-xylose resulted in 9, 16 and 29 % inhibition of the sucrase activity, respectively. In vivo: Supplementation of 8% D-xylose and L-arabinose compared to pure sucrose produced a lower blood glucose peak, a lower and delayed insulin peak (approx 23 % reduction in insulin release), and an augmented GLP-1 response. No gastrointestinal adverse effects and no major effects on appetite ratings or energy intake were detected. Conclusions: D-Xylose is a potent inhibitor of brush border disaccharidase activity from Caco-2 cells. Both 8 % D-xylose and L-arabinose in sucrose seem safe and have a positive impact on postprandial glucose, insulin, C-peptide, and GLP-1 responses in man. Keywords: Caco-2 cells, arabinose, xylose, sucrose, maltose, glucose, insulin, C-peptide, GLP-1

122
INTRODUCTION The relatively high intake of added sugar and its health consequences in the industrialized countries are currently under debate (1-6). In Denmark it is recommended that added sugar accounts for less than 10 % of the daily energy intake (2). However, the mean daily intake of added sugar corresponds to approximately 10% of the daily energy intake for adults and approximately 15 % for children (7). A high sugar intake may contribute to excess energy intake leading to overweight and is proposed to be one of the factors involved in the development of the metabolic syndrome and thereby increase the risk of developing type 2 diabetes and cardiovascular disease (8). Animal studies have indicated that several 5-carbon sugars act as inhibitors of disaccharidases (9) and human studies have demonstrated that L-arabinose suppresses postprandial glucose (10) and in addition decreased insulin and C-peptide responses and enhances GLP-1 levels in man without serious adverse effects (11). D-xylose is another naturally occurring pentose and is widely distributed as a component of complex polysaccharides as hemicelluloses in plant cell walls. This isolated 5-carbon sugar has been shown to suppress the increase of blood glucose and plasma insulin after ingestion of sucrose in rats by inhibition of sucrase activity (12). A small-scale human study (n=5) showed suppressed glucose and insulin responses 30 min after ingestion of 10 % D-xylose in sucrose solution compared to pure sucrose. No differences were observed for other time points (13). In a more recent, large human study, two different test meals with 10 and 15 % D-xylose were compared to controls with no xylose (n= 49 and 50). In all cases significant decreases in postprandial glucose and insulin responses were observed (14). The objective of these studies was to investigate if effects of D-xylose were similar to that of L-arabinose on intestinal sucrase activity in vitro in the Caco-2 cell model, and to compare the effects of D-xylose and L-arabinose on postprandial glucose, insulin, C-peptide, GLP-1, and appetite responses in healthy men. Since sucrose accounts for about 20 % of the digestible carbohydrate energy intake, and starch contributes with the remaining part, we additionally tested the effects of D-xylose and L-arabinose on intestinal maltase activity in vitro. MATERIALS AND METHODS IN VITRO For kinetic studies, we used a previously established sucrase activity assay (11). Shortly, Caco-2 cells from passage number 42 and 43 were seeded onto polycarbonate membranes and cultured at 37oC in an atmosphere of 5% CO2/95% air. At day 21, the Caco-2 cells were rinsed with phosphate buffered saline, scraped off the membranes, and homogenized by sonication. The reaction mixtures (200 µL) contained Caco-2 cell homogenates corresponding to 2.2 mg protein/mL, and sucrose at final concentrations of 7, 14, 28, 140, and 280 mM in 0.1 M malate buffer (pH=6.0) with 0, 1.4, 2.8, and 5.6 mM D-xylose as inhibitor of sucrase activity. Correspondingly, maltase activity was determined with the substrate maltose, at final concentrations of 7, 14, 28, 140, and 280 mM with 0, 5.6 mM L-arabinose and 5.6 mM D-xylose as inhibitors of maltase activity. The amount of glucose released by the enzymatic reaction was linear with time up to 60 min, why 30 min reaction time was used and glucose

123
measured with a Cobas Mira analyser (Roche Diagnostic Systems, F Hoffman-La Roche Ltd, Basel, Switzerland). IN VIVO Subjects The inclusion criteria were: healthy males, 18-30 y, normal to slightly overweight (BMI 18.5-26 kg/m2), no blood donation within the past 3 months before entering the study, no diabetes, hypertension or chronic diseases, no use of dietary supplements, alcohol intake below 21 drinks/week, no smoking, no regular use of medicine, not to be elite athletes and no change of physical activity during the study. Males were recruited from the area of Copenhagen by internet advertisement and flyers posted at local universities. Approximately 20 males responded by telephone or e-mail, and 16 of these went through a screening test with measurement of body weight, height, and blood pressure as well as an interview regarding general health and drinking and smoking habits. One did not meet the inclusion criteria. Fifteen healthy male subjects (age 19-30 y), normal weight to slightly overweight (BMI < 26 kg/m2) and no sign of gastrointestinal disorders were included. Body weight was registered before each meal and height was measured on the first morning. After having received verbal and written information about the study, all subjects gave written consent. The study was carried out at the Department of Nutrition, Exercise and Sports, University of Copenhagen, and was approved by the Regional Ethical Committee. One of the 15 subjects was withdrawn from the study since he did not adhere to the protocol as he was not-fasting 2-3 of the four times judged by high serum insulin and no indications of insulin resistance (serum C-peptid). Baseline characteristics of the 14 subjects who completed the study are presented in Table 1. Experimental design This dose-response study with 14 healthy male volunteers had a randomized double-blinded cross-over design based on four single tests separated by one week wash-out periods. Sucrose drinks, pure or supplemented with 4 % or 8 % D-xylose or 8 % L-arabinose were given in the morning and blood responses in glucose, insulin, C-peptide, and GLP-1 were followed for 3 hours postprandially. In addition, appetite was monitored and ad libitum energy intake was registered at lunch. Diets The evening prior to each test the subjects received a standardized meal consisting of spaghetti, meat sauce and 2.5 dL fruit juice to be eaten before 8:00 PM. The energy content of the meal was 4.5 MJ and distribution of energy was 60 energy per cent (E%) carbohydrates, 18 E% proteins, and 22 E% lipids. The sucrose drinks contained 75 g sucrose dissolved in 300 ml of water. The effects of D-xylose and L-arabinose were studied by adding 0, 3, 6 g D-xylose or 6 g L-arabinose corresponding to 0, 4, 8 % D-xylose or 8 % L-arabinose to the four sucrose drinks, respectively. The test drinks were made by Nordic Sugar, who also coded them with E, F, G and H. The content of the test meal was blinded for both test subject and investigator.

124
The ad libitum lunch served was a pizza with ham and cheese. The distribution of energy was 56.0 E% carbohydrates, 17.0 E% proteins and 27.0 E% lipids. All nutrient calculations of the meals were done with the computer database of foods from The National Food Agency of Denmark (Dankost 2000) (11). Measurements Protocol The subjects were not allowed to drink alcohol or perform strenuous physical activity 24 hours prior to each test day. On the test day the fasting subjects traveled to the department by car, bus or train (the least strenuous means of transportation). On arrival they were weighed, and after 10 min rest blood pressure was measured and an iv-catheter was placed in an antecubital vein. After further 10 min rest, fasting blood samples at -15 min and again at 0 min were drawn, and the sucrose beverage, which had to be consumed within 15 min, was served. Blood samples for determination of glucose, insulin and C-peptide were taken 15 and 0 min prior to the test beverage to ensure proper baseline values and again at 15, 30, 45, 60, 90, 120, and 180 min after the test beverage. Blood samples for determination of GLP-1 were collected at 0, 30, 60, 90, 120, and 180 min after ingestion of the test beverage. During the postprandial measurements, the subjects could watch TV/video or read (light entertainment) and toilet visits were allowed when necessary. Water (200 mL) was offered at 90 minutes, and intake was registered and repeated on every test day. After removal of the iv-catheter, the subject was walking (accomanied) to the lunch room, and the lunch was served approximately 195 min after the test beverages. Appetite and energy intake Visual analogue scales (VAS) expressing the most positive and the most negative rating were used to assess hunger, satiety, fullness, prospective food consumption, desire to eat something fatty, salty, sweet or some meat/fish, thirst and comfort. The questionnaires were presented as a small booklet with one question per page. Ratings of subjects’ appetite sensations were performed before serving of the test beverage and at 30, 60, 90, 120, 150 and 180 minutes after the test beverage. The ad libitum energy intake at lunch was registered as well as the ad libitum water intake on the first test day. VAS was used to assess the palatability (appearance, smell, taste, after-taste and overall palatability) of the ad libitum lunch. Post study Gastrointestinal symptoms (heartburn, distension, nausea, vomiting, stomach-ache, rumbling in the gut, flatulence and diarrhoea) were registered 21 hours following the tests by asking the subjects to fill out a questionnaire by rating symptom severity on a five-level scale. Laboratory analysis Blood was sampled 15 and 0 min before the test beverage was consumed and again 15, 30, 45, 60, 90, 120, and 180 min after the test beverage.

125
Serum glucose was measured with the use of an enzymatic colorimetric method on a Cobas Mira Plus spectrophotometer (Roche Diagnostic Systems, F Hoffmann-La Roche, Basel, Switzerland). Serum glucose concentrations were measured by using a glucoquant Glucose/HK kit (GLU Roche/Hitachi 1447513; Roche Diagnostics GmbH, Mannheim, Germany). Serum insulin concentrations were determined using an enzyme-linked immunosorbent assay technique (AutoDELFIA Insulin kit B080-101; Wallac Oy, Turku, Finland; AutoDELFIA 1235–514; Wallac Oy). Serum C-peptide was measured by using a solid phase, competitive chemiluminescent enzyme immunoassay on an Immulite 1000 Analyzer (Siemens). Plasma GLP-1 concentrations were measured after extraction of plasma with 70% ethanol (vol:vol, final concentration), and measured against standards of synthetic GLP-1 7–36 amide by using antiserum code no. 89390, which is specific for the amidated C-terminus of GLP-1 and therefore mainly reacts with GLP-1 of intestinal origin. Statistical analysis and calculations Descriptive data are reported as means SD and results are reported as means SEM. Results were considered significantly different when P < 0.05. The Lineweaver-Burke double reciprocal plot, i. e. the inverse values of substrate concentration plotted against the inverse reaction velocity, was used to determine the nature of enzyme inhibition, and parallel lines indicate uncompetitive inhibition. Incremental areas under the curve (iAUC) or above the curve (iAOC), ignoring the area beneath (or above in the case of iAOC) the fasting concentration were calculated by the trapezoid rule. The iAUC or iAOC was calculated for the entire test period from 0-180 min. Postprandial response curves were evaluated by comparing peak values and incremental area under the curve (iAUC) using analysis of covariance with fasting values as covariates, and time to peak values using analysis of variance. Furthermore, appetite ratings were evaluated with the 3-h mean and iAUC or iAOC values for ratings with increasing or decreasing ratings, respectively. In these evaluations, mixed model analysis of covariance with fasting values as covariates and subjects included as random effects was performed. In addition, the curves of glucose, insulin, C-peptide and GLP-1 were analyzed using repeated measurements analysis of covariance. Residual plots of data were examined to consider homogeneity of variance, and Shapiro-Wilk test performed for normal distribution of data and logarithmic transformation was used as appropriate. A significant result was followed by a Tukey-Kramer test for post-hoc analysis. All statistical analyses were performed by using Statistical Analysis Package version 8.02 (SAS Institute, Cary, North Carolina, USA). RESULTS IN VITRO Reaction velocity (v) plotted against substrate concentration (s) revealed classical Michaelis-Menten kinetics and demonstrated significant inhibition by increasing amounts of D-xylose, since Vmax decreased from 21.6 over 16.5 and 13.7 to 11.6 nmol/(min*mg protein) when the inhibitor concentrations increased from zero over 1.4 to 5.6 mM D-xylose (Figure 1). Thus, addition of 1.4, 2.8, and 5.6 mM D-xylose resulted in 24.6, 37.9 and 48.7 % inhibition of the

126
sucrase activity, respectively at Vmax. Lineweaver-Burke analysis indicated uncompetitive inhibition as parallel lines were obtained with the different inhibitor concentrations (Figure 1). Michaelis-Menten kinetics were also observed with L-arabinose and D-xylose as inhibitors of maltase activity where Vmax decreased from 29.2 to 25.9 and 24.1 mM substrate cleaved/(minxmg protein) for maltose without inhibitor, 5.6 mM L-arabinose and 5.6 mM D-xylose, respectively (Figure 2). Also in this case, Lineweaver-Burke plots showed nearly parallel lines for maltose without inhibitor, 5.6 mM L-arabinose and 5.6 mM D-xylose, since the slopes of the lines were not significantly different, thus again indicating uncompetitive inhibition. IN VIVO Glucose Postprandial plasma glucose showed a higher peak value after the control meal (7.71 mmol/L) than after treatment with 6 g D-xylose (6.74 mmol/L) and 6 g of L-arabinose (6.44 mmol/L) (Figure 3). The time to peak came later after treatment with 3 g of D-xylose and 6 g L-arabinose than after the treatment with pure sucrose. iAUC were not different between treatments. Repeated measurement analysis of areas showed no difference between treatments (P=0.49), but a significant dose*time interaction was observed (P=0.0003) indicating that the four treatments have different curves over time. Insulin In the control experiment the postprandial serum insulin peak (253.2 pmol/L) increased more in comparison with the three other treatments (3 g of D-xylose: 197.3 pmol/L; 6 g of D-xylose: 183.3 pmol/L; 6 g of L-arabinose: 151.8 pmol/L) (Figure 3), and the peak came sooner than in the treatments with 3 and 6 g of D-xylose. iAUC were not different between treatments. Repeated measurement analysis showed a tendency to a difference between treatments (P=0.07), and post-hoc adjustment revealed the tendency of difference to be between the treatment with pure sucrose and the treatment with 6 g L-arabinose added (P=0.06). C-peptide The treatment with pure sucrose (1907 pmol/L) and 3 g D-xylose (1689 pmol/L) showed an increased peak (P=0.0002) compared to 6 g of L-arabinose (1291 pmol/L) (Figure 3). The treatment with pure sucrose (44 min) increased the time to peak (P=0.007) compared to the other three treatments: 3 g of D-xylose (58 min), 6 g of D-xylose (57 min) and 6 g of L-arabinose (59 min). Judged by iAUC, 6 g arabinose significantly lowered C-peptide production (p=0.04), no difference was found between 6 g xylose and 6 g arabinose, but the effect of xylose (3 and 6 g) was not significant. The reduction in iAUC averaged 12% (median 16%). GLP-1 Postprandial plasma GLP-1(iAUC) increased more after treatment with 3 and 6 g of D-xylose and 6 g L-arabinose than after treatment with 0 g pentose (P=0.01), and more after treatment with 6 g L-arabinose than after treatment with 3 g D-xylose (Figure 4). The peak value was

127
higher after treatment with 6 g of D-xylose and 6 g of L-arabinose than after treatment with 0 g of pentose. The time to peak was different between the treatments with 3 g and 6 g D-xylose, peaking sooner after the 3 g D-xylose treatment. Repeated measurement analysis showed significant dose effect (P<0.0001), and post-hoc adjustment revealed that the difference was between treatments with 0 g of pentose and 3 and 6 g of D-xylose and 6 g of L-arabinose, respectively (P=0.03, P=0.0002 and P<0.0001), and between 3 g of D-xylose and 6 g of L-arabinose (P=0.006). Appetite After the treatment with 6 g of D-xylose (iAUC: 661±271 mm·min), subjects postprandial felt a larger satiety than after the treatment with 0 g of pentose (iAUC: 1360±345 mm·min; P=0.03) (Figure 4). VAS reports on prospective consumption showed less desire to eat after the treatment with 6 g of L-arabinose (iAOC: 638±151 mm·min) compared to the 3 g of D-xylose treatment (iAOC: 295±132 mm·min; P=0.01) (data not shown). VAS reports on thirst showed greater thirst after the treatment with pure sucrose (iAOC: 1144±272 mm·min) than after the treatment with 6 g of L-arabinose (iAOC: 921±415 mm·min; P=0.045) (data not shown). No other subjective mean appetite ratings nor mean ratings of comfort differed between the four treatments (data not shown). Energy intake No differences were seen in palatability ratings (appearance, smell, taste, aftertaste and overall palatability) of the ad libitum lunch (data not shown). There was no difference in energy intake between treatments (P = 0.57; 0 g pentose: 5541 ± 354 kJ; 3 g D-xylose: 5351 ± 315 kJ; 6 g D-xylose: 5728 ± 360 kJ; and 6 g L-arabinose: 5426 ± 314 kJ). Adjusting for body weight or metabolic body weight did not change this result. Gastrointestinal symptoms There were no differences in the reporting of gastrointestinal symptoms between treatments. Two of 14 subjects reported symptoms after the treatment with pure sucrose, 4 out of 14 subjects reported symptoms after the meal with 3 g D-xylose, 5 out of 14 subjects reported symptoms after the meal with 6 g D-xylose, and finally 5 out of 14 subjects reported symptoms after the meal with 6 g L-arabinose (P=0.69). DISCUSSION The present in vitro studies clearly demonstrated that D-xylose, like L-arabinose, inhibited the activity of the brush border enzyme sucrase possibly in an uncompetitive manner. This inhibiting effect was further validated in the human cross-over study, where D-xylose suppressed the increase in blood glucose, insulin, and C-peptide after sucrose ingestion and furthermore an augmented postprandial increase in the GLP-1 response was observed. Comparison between the responses to the highest amounts of inhibitors, i.e. 8 % xylose and 8

128
% arabinose, revealed no significant differences in the postprandial responses indicating that the effects are probably of the same order of magnitude. In a previous study (11) we found the effect in humans of arabinose to be dose dependent with rather low concentrations, and this finding was reproduced here, but with higher concentrations. How high the dose may be before side-effects appear is not known, and it is also unknown if the mechanism can be saturated if concentrations are sufficiently high. Ingestion of 75 g sucrose in one drink is very unusual in daily life, so the grand perspective depends on future findings in experiments with smaller doses of sucrose as well as the effects of addition of pentoses to solid meals. A major pitfall in this human study was that the healthy volunteers did not take the demand of fasting seriously, and one was excluded for this reason. Judged by plasma values of insulin and C-peptide at entrance in the study, none of volunteers had problems with insulin resistance, consistent with everybody being slim and mostly well trained, but we did not perform a clamp test to prove this. A sucrose drink with 8 % D-xylose compared to a sucrose drink without D-xylose produced a significantly lower plasma glucose peak as well as a lower and later serum insulin peak. Furthermore, a higher plasma GLP-1 peak and a larger increase in iAUC (50 %) was observed with the 8 % D-xylose supplementation. An addition of 8% L-arabinose gave comparable results. Vanis et al (15) studied eight healthy older subjects comparing the effects of drinks containing xylose, glucose or water on blood pressure, gastric emptying, incretin response, blood glucose and insulin in a cross-over, double-blinded, and randomized design. Compared to glucose, xylose had a minimal effect on blood glucose and serum insulin but a potent effect on GLP-1 response. The results from our study support these findings, although we used a small amount of D-xylose in a sucrose drinkas opposed to 50 g of D-xylose in water, quite a high dose compared to ours. In addition, they did not observe side-effects. We found that 8 % D-xylose resulted in a higher satiety compared to pure sucrose, but no gastrointestinal side effects or effects on the energy intake that could be related to the intake of any of the pentoses used. A recently published study (16) with a cross-over, double-blinded, and randomized design in twelve type 2 diabetic patients given 50 g of D-xylose or 80 mg sucralose (control) with or without sitagliptin (a DPP-4 inhibitor) followed by a meal, revealed that D-xylose reduced blood glucose and insulin and stimulated the secretion of GLP-1 in comparison with the control group. From these human studies, is seems that 8 % D-xylose and 8 % L-arabinose in sucrose, and maybe higher doses, are safe and potentially have a positive impact on postprandial glucose and insulin responses as well as a positive effect on the postprandial GLP-1 response. Both L-arabinose and D-xylose are naturally occurring in plant materials and eaten every day, which also indicates that these pentoses are nontoxic. In solid meals, however, sucrose is not very prevalent and especially in the diet of persons who potentially could benefit the most from these effects, i.e. persons with obesity and/or insulin resistance. For this reason we tested the effects on maltase in cell cultures, as the recommended diets for these high-risk groups contain large amounts of starch, and found a clear but modest inhibition of maltase. Seri and collages (17) found L-arabinose to be a potent inhibitor of sucrase and maltase activity using pork intestine mucosa homogenates and pancreatic homogenates from mice. The study showed a 64.9 % inhibition of sucrase activity and 9.6 % inhibition of maltase with 10 mM L-arabinose added and adding 10 mM D-xylose

129
results in a 57.6 % inhibition of sucrase activity and 12.0% inhibition of maltase. These findings are very similar to ours in the Caco2 cell homogenate as we found that 5.6 mM L-arabinose and D-xylose inhibited maltase activity by 11.3 and 17.4 %, respectively. The modest inhibition of maltase could potentially be clinically relevant because of the large amounts of starch ingested every day. Hopefully, future studies in humans will reveal this.

130
Acknowledgements The authors thank Inge Rasmussen, Yvonne Rasmussen, Berit Hoielt, Karina Graff Rossen, Kira Holst Bjerre Larsen and Sofie Pilgaard for expert technical assistance, and the test-subjects for their willing participation. All authors contributed to the development of the final study design and interpretation of the results, as well as writing the manuscript. IK-M performed the data collection in vivo. SBP and KHJ performed the studies on cell-cultures. None of the authors had any conflict of interest.

131
References
1. Food and Agriculture Organization of the United Nations and World Health Organization. Carbohydrates in human nutrition. Report of a Joint FAO/WHO Expert Consultation. FAO Food Nutr.Pap. 66, 1-140. 1998. Rome, FAO.
2. The health benefits from sugar (Sukkers sundhedsmæssige betydning (In Danish). 2003. Ernæringsrådet
(The Danish Nutrition council), Report #33, Søborg.
3. World Health Organization. Diet, nutrition and the prevention of chronic diseases. Joint WHO/FAO Expert Consultation. World Health Organ Tech.Rep.Series 916, 1-149. 2003. Geneva, WHO.
4. The Danish Food Based Dietary Guidelines 2005 (Kostrådene 2005 (In Danish). 2005. The Danish Nutrition Council. Report # 36. Søborg.
5. Department of Health and Human Services (HHS), Department of Agriculture (USDA). Dietary Guidelines for Americans 2005. HHS & USDA 2005. Internet: http://www.health.gov/DietaryGuidelines/
6. Kafatos A, Codrington CA. Nutrition and diet for healthy lifestyles in Europe: the 'Eurodiet' Project. Public Health Nutr 1999;2:327-8.
7. Dietary habits in Denmark 2000-2002. Main results.(Danskernes kostvaner 2000-2001. Hovedresultater (In Danish). The Danish Veterinary and Food Research Institute. 2005, Søborg.
8. Fung TT, Malik V, Rexrode KM, Manson JE, Willett WC, Hu FB. Sweetened beverage consumption and the risk of coronary heart disease in women. Am J Clin Nutr 2009;89:1037-42.
9. Minami Y, Kuriyama C, Ikeda K, Kato A, Takebayashi K, Adachi I, Fleet GW, Kettawan A, Okamoto T, Asano N. Effect of five-membered sugar mimics on glycogen-degrading enzymes and various glucosidases. Bioorg Med Chem 2008;16:2734-40.
10. Inoue S, Sanai K, Seri K. Effect of L-Arabinose on blood glucose level after ingestion of sucrose-containing food in human. J Jpn Soc Nutr Food Sci 2000;53:243-7. (article in Japanese).
11. Krog-Mikkelsen I, Hels O, Tetens I, Holst JJ, Andersen J, Bukhave K. The effects of L-arabinose on intestinal sucrase activity: dose-response studies in vitro and in humans. Am J Clin Nutr 2011;94:472-8.
12. Asano T, Yoshmura Y, Kunugita K. Sucrase inhibitory activity of D-xylose and the elevation of blood glucose in rats. J Jpn Soc Nutr Food Sci 1996;49:157-62. (article in Japanese)
13. Gruzmann A, Shamni O, Ben Yakir M, Sandovski D, Elgart A, Albert E, Cohen G, Hoffman A, Katzhendler Y, Cerasi E, Sasson S. Novel D-xylose derivatives stimulate muscle glucose uptake by activating AMP-activated protein kinase alpha. J Med Chem 2008;51:8096-108.
14. Bae YJ, Bak Y-K, Bumsik K, Min-Sun K, Lee J-H, Sung M-K. Coconut-derived D-Xylose affects postprandial glucose and insulin responses in healthy individuals. Nutr Res Prac 2011;5:533-9.
132
15. Vanis L, Hausken T, Gentilcore D, Rigda RS, Rayner CK, Feinle-Bisset C, Horowitz M, Jones KL. Comparative effects of glucose and xylose on blood pressure, gastric emptying and incretin hormones in healthy older subjects. Br J Nutr. 2011;105:1644-51.
16. Wu T, Bound MJ, Zhao BR, Standfield SD, Bellon M, Jones KL, Horowitz M, Rayner CK. Effects of a d-xylose preload with or without sitagliptin on gastric emptying, glucagon-like Peptide-1, and postprandial glycemia in type 2 diabetes. Diabetes Care. 2013;36:1913-8.
17. Seri K, Sanai K, Matsuo N, Kawakubo K, Xue C, Inoue S. L-arabinose selectively inhibits intestinal sucrase in an uncompetitive manner and suppresses glycemic response after sucrose ingestion in animals. Metabolism 1996;45:1368-74.

133
Table 1 Subject characteristics, mean (±SD)
Parameter
Subjects (Males)(n) 14
Age (y) 262.8
Weight (kg) 72.98.6
Height (m) 1.800.05
BMI (kg/m2) 22.42.3
Blood pressure
Systolic (mmHg)
Diastolic (mmHg)
1248
687
Resting heart rate (beats/min) 567

134
Legends for figures
Figure 1 A: Michaelis-Menten curves for the substrate (sucrose) concentrations 0 – 280 mM with D-xylose (0.0mM (◊), 0.84mM (), 1.4mM (∆) and 2.8mM (x)) as inhibitor of sucrase activity. Data are mean±SEM (n=6). S is the substrate concentration and V is the initial velocity of the reaction. B: Lineweaver-Burke plot. (0.0mM (◊), 1.4mM (), 2.8mM (∆) and 5.6mM (x)) with and without D-xylose as inhibitor of sucrase activity. Data are mean±SEM (n=6). Figure 2 A: Michaelis-Menten curves for the substrate (maltose) concentrations 0 – 280 mM without inhibitor (◊) and with 5.6 mM D-xylose () or 5.6 mM arabinose (∆) as inhibitors of maltase activity. Data are mean±SEM (n=6). S is the substrate concentration and V is the initial velocity of the reaction. B: Lineweaver-Burke plot. 0.0 mM inhibitor(◊) and with 5.6 mM D-xylose () or 5.6 mM arabinose (∆) as inhibitors of maltase activity. Data are mean±SEM (n=6). Figure 3 Serum concentrations of glucose (A), insulin (B) and C-peptide (C) in 13 normal to slightly overweight male subjects after intake of sucrose beverages supplemented with 0 (∆), 3 (), 6 (◊) grams D-xylose or 6 (x) grams of L-arabinose. Data are mean (± SEM). iAUC = incremental area under the curves. P-Glucose: Peak, P=0002. Time to peak, P=0.019. iAUC, P=0.402. S-Insulin: Peak, P<0.0001. Time to peak, P=0.003. iAUC, P=0.482. S-C-Peptide: Peak, P < 0.0001. Time to peak, P=0.07. iAUC, P=0.36. Peak values and iAUC were evaluated using analysis of covariance with fasting values as covariates, and time to peak values using analysis of variance. Postprandial response curves were evaluated by repeated measurements analysis of covariance. Figure 4 Plasma concentrations of GLP-1 (A) and subjective appetite ratings of satiety (B) on 100-mm visual analogue scales (VAS) in 13 normal to slightly overweight men after intake of sucrose drinks supplemented with 0 (∆),3 (), 6 (◊) grams D-xylose or 6 (x) grams of L-arabinose. Data are mean ± SEM. GLP-1: Peak, P=0.007. Time to peak, P=0.009. iAUC, P<0.0001.Satiety: iAUC, P=0.046. Peak values and iAUC were evaluated using analysis of covariance with fasting values as covariates, and time to peak values using analysis of variance. Postprandial response curves were evaluated by repeated measurements analysis of covariance.

135
Figure 1
Figure 2
0,00
5,00
10,00
15,00
20,00
25,00
0 50 100 150 200 250 300
V n
mol
/(min
*mg
prot
ein)
[S] mM
0
0,02
0,04
0,06
0,08
0,1
0,12
0,14
0,0000 0,0500 0,1000 0,1500
1/V
(min
xmg
prot
ein/
nmol
)
1/S (1/mM)
A
B

136
0,00
5,00
10,00
15,00
20,00
25,00
30,00
35,00
0 50 100 150 200 250 300
Vo n
mol
mal
tose
cle
ved/
(min
*mg
prot
ein)
[S] mM maltose
0,000
0,010
0,020
0,030
0,040
0,050
0,060
0,070
0,080
0,090
0,000 0,020 0,040 0,060 0,080 0,100 0,120 0,140 0,160
1/Vo
1/[S]
Maltose
5.6 mmol L-arabinose5.6 mmol D-xylose
A
B
Figure 1
Figure 2
0,00
5,00
10,00
15,00
20,00
25,00
0 50 100 150 200 250 300
V n
mol
/(min
*mg
prot
ein)
[S] mM
0
0,02
0,04
0,06
0,08
0,1
0,12
0,14
0,0000 0,0500 0,1000 0,1500
1/V
(min
xmg
prot
ein/
nmol
)
1/S (1/mM)
A
B
0
0,01
0,02
0,03
0,04
0,05
0,06
0,07
0,08
0,09
0 0,02 0,04 0,06 0,08 0,1 0,12 0,14 0,16
1/Vo
1/[S]
Maltose
5.6 mmol L‐arabinose
5.6 mmol D‐xylose
0
5
10
15
20
25
30
35
0 50 100 150 200 250 300Vo nmol cleved
maltose/(min*m
g protein)
[S] mM maltose
Maltose
5,6 mM Arabinose
5,6 mM Xylose

137
Figure 3
A
B
C

138
Figure 4
A
B

Inhibition of intestinal disaccharidase activity by pentoses
– with special reference to the uptake of glucose from starch and sucrose
and the insulin secretion in humans
PhD Thesis · 2013Kia Halschou-Jensen
D E PA R T M E N T O F N U T R I T I O N , E X E R C I S E A N D S P O R T SFA C U LT Y O F S C I E N C EU N I V E R S I T Y O F C O P E N H A G E NP H D T H E S I S · 2 0 1 3
I S B N 9 7 8 - 8 7 - 7 6 1 1 - 6 3 8 - 5
K I A H A L S C H O U - J E N S E N
Inhibition of intestinal disaccharidase activity by pentoses– with special reference to the uptake of glucose from starch and sucrose and the insulin secretion in humans
KIA
HA
LSCH
OU
-JENSN
E
Inhibition of intestinal disaccharidase activity by pentoses
fac u lt y o f s c i e n c eu n i ve r s i t y o f co pe n h ag e n