Embed Size (px)
Citation preview

THE RELATIONSHIP OF INITIAL ASSIGNMENT
AND PERSONAL BACKGROUND VARIABLES TO
FIRST TERM ENLISTED ATTRITION FROM THE NAVY
Daniel E. Gardner-

NAVAL POSTGRADUATE SCHOOLMonterey, California
THESISTHE RELATIONSHIP OF INITIAL ASSIGNMENTAND PERSONAL BACKGROUND VARIABLES TO
FIRST TERM ENLISTED ATTRITION FROM THE NAVY
by
Daniel E. Gardner
December 19 8
Thesis Advisor: R. S. Elster
Approved for public release; distribution unlimited
'1 Q 77(9 A

UNCLASSIFIEDSECURITY CLASSIFICATION OF THIS PAGE (Whmn Data Snlared)
REPORT DOCUMENTATION PAGE1 BtPOW numT¥r 2. GOVT ACCESSION NO.
4. TITLE (and Subllllm)
The Relationship of Initial Assignment andPersonal Background Variables to FirstTerm Enlisted Attrition from the Navy7. AUTMORfaJ
Daniel E. Gardner
t. PERFORMING ORGANIZATION NAME ANO AOORESS
Naval Postgraduate SchoolMonterey, California 93940
It. CONTROLLING OFFICE NAME ANO AOORESS
Naval Postgraduate SchoolMonterey, California 93940
READ INSTRUCTIONSBEFORE COMPLETING FORM
3. RECIPIENT'S CATALOG NUMBEI
S. TYPE OF REPORT a PERlOO COVEREDMaster's Thesis;December 19 80
• • PERFORMING ORG. REPORT NUMBER
3 CONTRACT OR GRANT NUMBER^
io. program element, project taskAREA a WORK UNIT NUMBERS'
12. REPORT DATEDecember 1980
13. NUMBER OF PAGES
9814. MONITORING AGENCY NAME * AOORESSfl/ dlllarant Irom Controlling Ollico) IS. SECURITY CLASS, (ol thlm tiport)
Unclassified
ISa. DECLASSIFICATION/ DOWNGRADINGSCHEDULE
16. DISTRIBUTION STATEMENT (ol thl* Hoport)
Approved for public release; distribution unlimited.
17. DISTRIBUTION STATEMENT (ol tho abolracl ontorod In Block 30. II dltlotanl Irom Roport)
It. SUPPLEMENTARY NOTES
IS. KEY WORDS (Continue on toworoo alda II nacoooarr and Idantlty ay alec* ntmbar)
Navy Enlisted Personnel; Navy Enlisted Attrition; Screening;Selection; Prediction; Attrition; AFQT; Regression Analysis;Enlisted Personnel; Navy A-School Personnel; Retention; MentalCategory; Traditional Attrition Variables; General DetailPersonnel (GENDET) ; Ship Unique Variables; Ship Type; Ship Class20. ABSTRACT (Conllnua on ravaroa tldo It nacaooaty md Idanlltr by block numbar)
This thesis was conducted to compare the characteristicsand attrition rates of first term enlisted personnel initiallyassigned to ships with those assigned to non-ship duty stations.Identification of traditional and non-traditional variables withemphasis on ship characteristics were evaluated as predictors offirst term attrition rates.
A cohort of non-prior service male recruits was tracked over
do ,;FORMAN 73 1473 EDITION OF I NOV ft IS OBSOLETE
S/N o 103*0 14- 6601 I
UNCLASSIFIEDSECURITY CLASSIFICATION OF THIS PAOE (Whon Data tnlorod)

UNCLASSIFIEDrv ct,Am*«c*Tio» o* Twit »»»»;*>— n—m **•*•*
(19. KEY WORDS Continued)
Ship .Engineering Plant; Ship Homeport Location; UnitIdentification Code (UIC) ; Ship Size (Personnel)
;
Ship Age (Commissioning)
(20. ABSTRACT Continued)
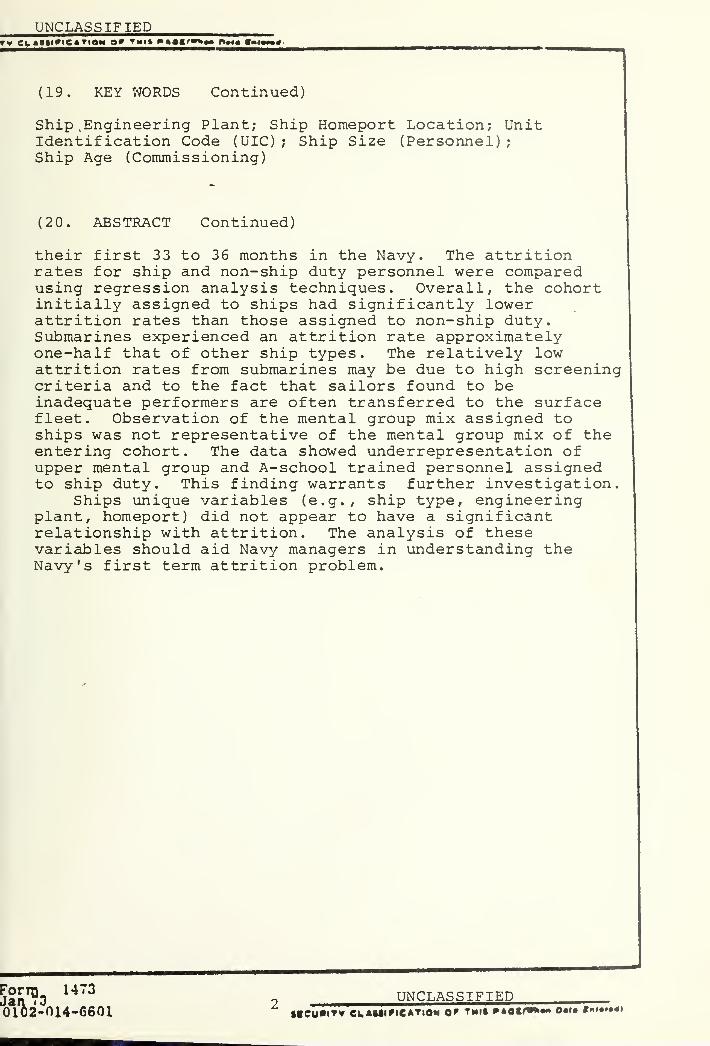
their first 33 to 36 months in the Navy. The attritionrates for ship and non-ship duty personnel were comparedusing regression analysis techniques. Overall, the cohortinitially assigned to ships had significantly lowerattrition rates than those assigned to non-ship duty.Submarines experienced an attrition rate approximatelyone-half that of other ship types. The relatively lowattrition rates from submarines may be due to high screeningcriteria and to the fact that sailors found to beinadequate performers are often transferred to the surfacefleet. Observation of the mental group mix assigned toships was not representative of the mental group mix of theentering cohort. The data showed underrepresentation ofupper mental group and A-school trained personnel assignedto ship duty. This finding warrants further investigation.
Ships unique variables (e.g., ship type, engineeringplant, homeport) did not appear to have a significantrelationship with attrition. The analysis of thesevariables should aid Navy managers in understanding theNavy's first term attrition problem.
Jan^D14
"3
2UNCLASSIFIED
0102-014-6601 sicuaivv cuamiucatio* or tM i» p **€(****

Approved for public release; distribution unlimited
The Relationship of Initial Assignmentand Personal Background Variables to
First Term Enlisted Attrition from the Navy
by
Daniel E. GardnerLieutenant Commander, United States Navy
B.S., Baldwin Wallace College, 1969
Submitted in partial fulfillment of therequirements for the degree of
MASTER OF SCIENCE IN MANAGEMENT
from the
NAVAL POSTGRADUATE SCHOOLDecember 19 8

ABSTRACT
This thesis was conducted to compare the characteristics
and attrition rates of first term enlisted personnel initially
assigned to ships with those assigned to non-ship duty sta-
tions. Identification of traditional and non- traditional
variables with emphasis on ship characteristics were evalu-
ated as predictors of first term attrition rates.
A cohort of non-prior service male recruits was tracked
over their first 33 to 36 months in the Navy. The attrition
rates for ship and non-ship duty personnel were compared using
regression analysis techniques. Overall, the cohort initially
assigned to ships had significantly lower attrition rates than
those assigned to non-ship duty. Submarines experienced an
attrition rate approximately one-half that of other ship types.
The relatively low attrition rates from submarines may be due
to high screening criteria and to the fact that sailors found
to be inadequate performers are often transferred to the sur-
face fleet. Observation of the mental group mix assigned to
ships was not representative of the mental group mix of the
entering cohort. The data showed underrepresentation of upper
mental group and A-school trained personnel assigned to ship
duty. This finding warrants further investigation.
Ships unique variables (e.g., ship type, engineering plant,
homeport) did not appear to have a significant relationship
with attrition. The analysis of these variables should aid
Navy managers in understanding the Navy's first term attrition
problem.

TABLE OF CONTENTS
INTRODUCTION 10
PROBLEM 10
BACKGROUND 1]-
PURPOSE 16
METHOD 17
SAMPLE 17
PROCEDURE 17
CONSTRAINTS
APPENDIX B: MERGED DATA FILE DESCRIPTION
21
ANALYSES 22
DATA ANALYSES 22
FINDINGS 27
COHORT DISTRIBUTION 27
COHORT ATTRITION 37
REGRESSION ANALYSES OF ATTRITION 50
CONCLUSIONS AND RECOMMENDATIONS 66
INTRODUCTION 66
COHORT DISTRIBUTION 66
COHORT ATTRITION 67
APPENDIX A: SURVIVOR TRACKING FILE (LONGITUDINALVARIABLES) 71
73
APPENDIX C: UNIT IDENTIFICATION CODE TAPEDESCRIPTION AND SHIP VARIABLE FILEDESCRIPTION (CARDS) 75
APPENDIX D: AGEYRS AND TAS VARIABLE COMPUTATION


APPENDIX E: DEFINITION OF SHIP VARIABLES 77
APPENDIX F: SHIP TYPE - CLASS NAMES 83
APPENDIX G: SHIP DISTRIBUTION BY VARIABLES 84
LIST OF REFERENCES 9 3
REFERENCE NOTES 95
INITIAL DISTRIBUTION LIST 9 6

LIST OF TABLES
1. Success Chances for Recruits Entering theNavy (Screen) 13
2. Definition of Traditional Variables 25
3. Definition of Non traditional or OrganizationalVariables 26
4. Definition of Total Cohort by TraditionalVariables
5. Representativeness of Personnel Losses DuringBoot Camp and Their Distribution by TraditionalVariables 30
6. Representativeness of Boot Camp SurvivorPersonnel Assigned to Ship Duty and TheirDistribution by Traditional Variables 31
7. Representativeness of Boot Camp SurvivorPersonnel Assigned to Non-Ship Duty andTheir Distribution by Traditional Variables
8. Distribution of the Boot Camp Survivor Cohortby Nontraditional Variables 36
9. Representativeness of Ship and Non-Ship DutyPersonnel and Their Distribution by A-SchoolAttendance 38
10. Distribution of Ship Duty Personnel by ShipUnique Variables 39
11. Attrition Rates for Non-Ship Duty Personnel *1
12. Attrition Rates for Ship Duty Personnel 43
13. Representativeness of Ship Duty Personneland Their Distribution by Ship Unique Variables 47
14. Definition of Variables Included in RegressionAnalyses Reported in Tables 15-18
15. Stepwise Regression Results for TraditionalVariables—Total Cohort
16. Stepwise Regression for Traditional VariablesPlus A-School Attendance—Total Cohort 54

17. Stepwise Regression Results for TraditionalVariables Plus A-School Attendance and Ship/Non-Ship Duty Assignment—Total Cohort 55
18. Stepwise Regression for Traditional VariablesPlus A-School Attendance and Ship/Non-Ship DutyAssignment—Boot Camp Survivor Cohort 56
19. Definition of Variables Included in RegressionResults Shown in Table 20 58
20. Stepwise Regression Results for Traditional andNon-Traditional Variables—Boot Camp SurvivorCohort 61
21. Definition of Variables Included in RegressionAnalyses for Results Shown in Table 22 63
22. Stepwise Regression Results for Ship UniqueVariables—Ship Duty Cohort 65


LIST OF FIGURES
1. Cohort Subdivisions 23
2. Attrition Over Time for Ship and Non-ShipVariables 49

INTRODUCTION
PROBLEM
One has only to pick up the daily paper, turn to the 10
O'clock News, or leaf through TIME or Newsweek to be reminded
of the Navy's military manpower problems. Recruiters have been
hard pressed to meet accession goals despite a downward trend
in manning levels (America's Volunteers, 1978). In addition
the manpower pool of recruitable personnel is projected to
decrease from 15 to 20 percent during the 1980 's. A com-
mensurate reduction in Naval strength and missions is not
anticipated. Competition for eligible military recruits will
as a result become keener (Bowler, 1977).
Reducing first term attrition of personnel once they are
recruited could provide help in solving this manpower problem.
Navy attrition rates for first-term non prior service (NPS)
male recruits increased from 30 percent in 1971 to over 4
percent in 1977 (Lau, 1979).
Considerable research has been conducted on the cause
of attrition and the development of methods to reduce it.
The bulk of this effort has been focused on traditional indi-
vidual biographic and demographic data, while excluding post
recruitment organizational factors. The issue of attrition
might best be explained by combinations of both the tradi-
tional and organizational variables.
10

BACKGROUND
Screening potential recruits for Naval service serves a
two-fold purpose. First, it ensures proper input quality,
and in the amounts specified by Congress. Secondly, screen-
ing is used to predict the chances of an individual not
attriting during a first enlistment. During the 1970' s,
several screening schemes aimed at reducing first term attri-
tion were utilized.
The Odds for Ef fectiveness-1 (OFE) tables were implemented
in 19 73 and included as predictor variables: (1) an aptitude
(the Armed Forces Qualification Test—AFQT) test score,
(2) number of years of school completed, (3) number of expul-
sions or suspensions from school, and (4) the number of arrests
(Plag & Goffman, 1966) . Navy recruiters computing an OFE-1
score for each male non prior service applicant experienced
increasing difficulty in obtaining arrest information. As
a result the Naval Personnel Research and Development Center
was requested to formulate a revised OFE table which would
not require arrest information. A revised screening table,
OFE-2, was produced and then formally implemented in October
1975. It excluded arrest data as a predictor variable (Sands,
1976) . In October 1976 a new screening table devised by
Robert F. Lockman from the Center of Naval Analysis was placed
into use. The predictor variables employed by this screening
model were the following: (1) race—majority and minority,
(2) mental group devised from AFQT score, (3) age at entry,
(4) dependents status, and (5) years of education (Lockman,
11

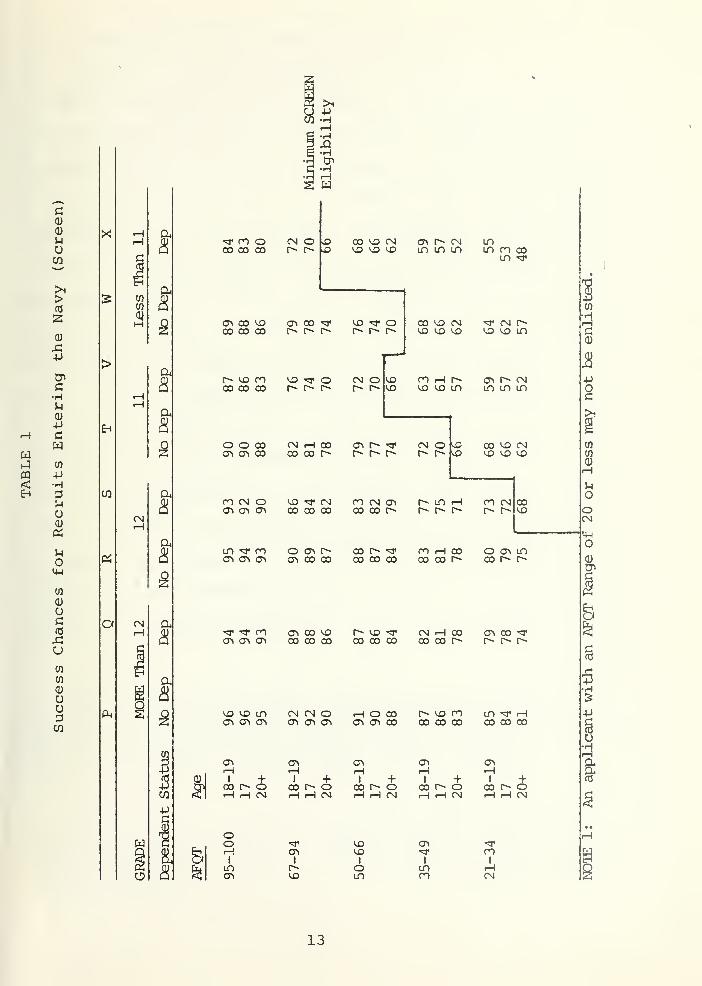
1978). The revised screening table currently used by Navy
recruiters is presented by Table 1 (Navy Recruiting Manual)
.
Recent studies have begun to investigate the contribution
of organizational variables to first term attrition. Thomason
(1979) investigated the effects of recruit training "boot"
camp and first duty station assignment as well as the tra-
ditional variables of age, education and mental group for
various Navy ratings. In an analysis of the Vol Out II pro-
gram, Smith and Kendall (1980) evaluated the effect of A-
school training and duty assignment on first term attrition
rates. The Thomason and the Smith and Kendall studies indi-
cated that post-recruitment variables demonstrated a signifi-
cant relationship with first term survival rate. Smith and
Kendall reported that a significantly lower attrition was
associated with assignment to sea versus shore duty. They
also evaluated the effect of assignment to general ship types
within the sea duty category and its resultant impact on attri-
tion rates. Research by Butcher (19 80) also noted a reduction
in first term attrition when recruits were assigned to sea
duty versus shore duty.
The Enlisted Transfer Manual (TRANSMAN) specifies the
policies and procedures utilized in assignment of enlisted
personnel in the Navy. The assignment of recruits to their
A-schools are designed to provide a minimum of 4 weeksof technical and skill training in a job specialty aimed ata specific Navy rating (Navy Recruiting Manual)
.
12

&H<H•HX!•H
H
C
MUCO
>
CD
Ptnc•HH<D4->
CW03
•H
U
OM-l
W(U
oa(0
ucn
w
ou
to
X
CO
es
a
CN
CN
CU
Q4
a
aa
a
8
a
^ noCO 00 CO
CN O 00 VD CNKD <0 ^O
CTi P- CNli in in
CT> 00 ^OCO CO CO
CO CO CO
O O COcr» cr> co
ro cn o(T> C\ G>
cti cr> cr*
CTi 00 ^r- r~- r-
10 <* or— r- r^
CN iH 00co 00 r^-
^o ^r cn00 00 CO
o o\ r^cr> co co
<0 *3> Or» r^ r-
cn o
co vo CN<D VD ^5
^ vc in
o> r* '*t-o r- r-
ro cn cnco co r»
00 r~ ^r00 00 co
CN O 'sO
r^ r- ^o
in ro coin ^
"3« cn r-vd ^o in
cn r» cnin m m
co vo CN^o ^o <o
r*» m tHr» r-» r-
ro t-\ 00co co p-
ro cnr- p-
o cn inco r- r-
CT> CT* Cn
ix> vx) inCn cn cn
CT> CO <DCO CO CO
CN CN OCTi CTN CTi
p- <o "=r
00 co CO
HOCOCXi C7\ 00
CN rH 0000 co r-
p- vo ro00 00 CO
Cn 00 *3*
p- p- p*
in >* H00 00 00
cnrH
I +00 P oHHCN
cnrH
l
00+
r» oiH CN
Cn
co p-
cr> cn
+ 1 + 1 +00 r» co p-
CN rH rH CN rH rH CN
k
oo
incn
cnI
p-U3
IOin
CXi
1mro
roI
rHCN
13

first non-training duty station may be divided into three
sections: (1) A-school graduates , (2) general detail
2(GENDET) personnel, or (3) "immediate availables". Immedi-
ate availables are comprised of A-school dropouts and per-
sonnel returning from medical treatment or confinement.
The Navy Military Personnel Command (NMPC) controls the
assignment of A-school graduates. The GENDET and "immediate
available" personnel are assigned by the Enlisted Personnel
Management Center (EPMAC) . All assignments are regulated by
the manning control authorities (MCA) which determine equita-
ble and required manning levels for all Naval commands. The
MCA's are NMPC, Commander-in-Chief Pacific Fleet and Comman-
der-in-Chief Atlantic Fleet. Among them they determine the
3quantity and quality (paygrade and NEC ) manning levels for
their commands based on the "fair share" Navy Manning Plan
(NMP) . Personnel replacement requisitions are originated by
the individual commands prioritized by the MCA guidelines, and
filled by NMPC or EPMAC detailers. Article 3.0 2 of the TRANSMAN
delineates assignment policy:
2GENDETS are recruits who attend Apprenticeship Schoolfor Seaman, Fireman, or Airman instead of A-school after com-pleting recruit training. Apprenticeship training is approxi-mately a 2 to 3 week program which prepares personnel forgeneral (unskilled or semi-skilled) fleet assignments(Guthrie, Lakota, & Matlock, 1978).
3Naval enlisted classification codes (NEC) supplement theenlisted rating structure and denote specific skill trainingwithin a rating or ratings. They are subdivided into primary(PNEC) or secondary (SNEC) for manpower management purposes(NAVPERS 18 068) .
14

In discharging the responsibilities assigned tothem by higher authority, Assignment ControlAuthorities shall adhere to the following poli-cies pertaining to the assignment of enlistedmembers and neither race, creed nor color, nationalorigin, nor sex, except where prohibited by 10U.S. Code 6015, shall be factors in the nominationand assignment of naval personnel.
Article 3.23 addresses non-prior service recruit personnel
assignments
:
Every effort will be made to assign first termpersonnel to sea duty. It is recognized that thisis not possible in all ratings/NEC's; however itis the goal for all ratings. First term personnelhaving active duty obligation of 4 years or lessand assigned to sea duty will normally remain atsea for their entire initial enlistment. In thoseratings NEC's where no valid requirement existsat sea, member will be assigned a PRD^ ashore tocoincide with EAOS . 5 in those cases where personnelmust be assigned an initial shore tour due to requi-sition requirements, an 18-24 month special shoretour will be assigned to be followed by a seaassignment, providing member has a minimum of 12month obligated service remaining.
The recruit does have the opportunity to make an input
to the system which assigns or details him to his first duty
station. GENDET personnel are allowed to request location
only. They are given a form to fill out which lists avail-
able choices and the odds of actually receiving that selec-
tion. A-school graduates and immediate availables are allowed
to request type of ship as well as location. The preferences
for all individuals are reviewed by the enlisted detailers
when filling the personnel requisitions. Individual assignments
4PRD—Prospective rotation date.
5EAOS—Expiration of active obligated service
15

are then made based on the individuals training qualifica-
tions, and the priorities and guidelines of the MCA's. The
individuals preferences are honored where feasible (TRANSMAN)
Hoehn , Wilson, and Richards (1972) described the military as
doing a fairly successful job of meeting individuals' assign-
ment preferences and as benefiting from the higher overall
satisfaction which resulted.
In a speech at the Naval Postgraduate School in November
1980, Admiral Conrad, Assistant Commander of NMPC for Distri-
bution, stated that due to reduced fleet manning the detail-
ing system currently had less flexibility to meet individual
duty preferences than it had formerly.
PURPOSE
The first objective of this thesis was to compare the
characteristics and attrition rates of those first term
personnel assigned to sea duty as sailors aboard ships or
submarines with those assigned to other duty stations. The
second objective was to evaluate traditional and non-tradi-
tional variables as predictors of first term attrition.
Personnel and organizational factors were analyzed in an
attempt to identify methods to screen first termers for
assignment to various vessels where they would have the best
chance not to attrite.
16

METHOD
SAMPLE
The cohort selected for analysis was defined by the
following parameters:
1. Non-prior service (NPS)
.
2. Male only.
3. First term enlistees.
4. Term of enlistment from 3 to 6 years.
5. Active Duty started in last quarter of fiscal year
(July, August, September).
Individuals who were sworn into the Navy but whose com-
mencement of active duty was delayed under the auspices of
the Delayed Entry Program (DEP) are classified as prior
service personnel by the Enlisted Master Record. People
participating in the DEP program are therefore not included
in the sample
.
PROCEDURE
The Enlisted Survival Tracking File (STF) produced by the
Naval Personnel Research and Development Center (NPRDC) was
utilized as the data base for the longitudinal analysis.
Development of the STF was begun by the Bureau of Naval
Personnel in 1975. In 1977 NPRDC and Pers 35-b (now NMPC-164)
Non-prior service signifies that the recruit has notserved previously in the United States military.
17

collaborated jointly to complete development of the data
base. The STF consists of two separate collections of
records. Only the first, the longitudinal STF (STF-L) was
utilized for this research effort. It consists of an 120
character field length record which represents the status
of each individual at quarterly intervals. The data utilized
in the construction of the file is derived from the end of
quarter Enlisted Master Record (EMR) file and the quarter
audittrail file; both of which are routinely prepared by
NMPC-165. The STF-L file contains records commencing with
the fourth quarter of the fiscal year 19 77 and contains a
complete longitudinal description for those personnel who
enlisted that quarter or later. For individuals enlisting
prior to that time, data are available only from that date
forward. A completely new record is generated for a person
who has a status change during any quarter on one or more of
the variables. An individual therefore might have a record
for each quarter of service. If no change occurs in a quar-
ter, the quarter count variable is incremented indicating
the number of quarters the record has remained unchanged. A
complete listing of the STF-L data elements is located in
Appendix A (Borack & Gay, 1980)
.
A ship data bank was then developed starting with a Unit
Identification Code (UIC) tape supplied by NMPC-47. The UIC
tape contains the UIC, hullnumber, name, homeport, and type
activity code (TAC) for every activity in the Navy. Punch
18

cards with the data from the tape were produced for each
ship in the fleet. Then data pertaining to the ship type,
class, subclass, size (based on personnel), age (based on
commissioning date) , engineering plant, nuclear capable
status, homeport location, and active or reserve status were
added to each ship's card.
Fourteen variables were then selected from the 48 avail-
able on the STF-L file records of each individual to form one
composite record per person. This was accomplished utilizing
a FORTRAN program which did the following:
1. If an actual onboard UIC on an individual's records
2through the third quarter of fiscal year 19 78 matched a UIC
from the ship data bank all variables except losscode and
lossdate were read from the first record the ship UIC appeared
on. A new -data element (ship (1) or non-ship (2) (see below))
was used and a data element failure (1) or success (2) was
created and coded failure if a losscode appeared. Finally a
lossgroup data element was added for loss before 1 July 19 78
(1) or later (2) .
2. If an individual's records did not contain a ship UIC
by the fourth quarter of fiscal year 19 78 all variables except
losscode and lossdate were pulled from the third quarter fiscal
year 1978 record. If that record didn't exist, the next
2The end of the third quarter of FY 78 was chosen to give
the first-termer time to complete training enroute to hisfirst duty station. A minimum of nine and maximum of twelvemonths depending on active duty start date would be available
19


preceding one was utilized. The composite record was then
annotated with the code for non-ship. Losscode and lossdate
were added if applicable from the last record. Success or
failure and lossgroup data elements were computed as before.
3. The active duty start date (ADSD) was extracted from
the first STF-L record of each individual for the composite
record.
4. The active duty start date (ADSD) and date of birth
(DOB) which were year and month—four digit variables
—
divided into two digit variables for year (ADSYR + DOBYR)
and month (ADSDMTH + DOBMTH)
.
4
The composite record for each individual was then com-
bined as applicable with the ship data file by matching UIC's.
This yielded the merged file which was utilized for all data
analysis. A description of the merged file is found in
Appendix B. A description of the UIC and ship variable files
is found in Appendix C.
The age at entry (AGEYRS) in months for each individual
from date of birth and active duty start date variable was
computed using the format presented in Appendix D. Total
3The ADSD was changed for individuals who had lost service
time for desertion on their subsequent quarterly update. Adecision to use the original ADSD was made to compute ageat entry properly.
4Date of birth and active duty start date variables were
each separated into year and month to enable computation ofage at entry (AGEYRS) and total active service (TAS) variables
20

active service (TAS) for each first termer was computed from
active duty start date and lossdate year and month variables.
Format for computation of TAS is also presented in Appendix D.
CONSTRAINTS
The major constraint was the exclusion of DEP personnel
due to their prior-service classification. Women were not
included in the cohort based on their small actual number,
and the fact that a low percentage of that total go to sea
duty aboard ships. The STF-L file had been updated through
the third quarter of FY 80 at the time of this research,
limiting the maximum total active service for an individual
to 36 months. The fact that changes could occur at any time
during a quarter, but were only recorded at the end of a
quarter, is a weakness inherent with most longitudinal data
banks and must be takne into account. The lack of timeli-
ness in data submission could also cloud the statistical
accuracy of the file as events occurring toward the end of
the quarter might not be identified until the next quarter's
update. Although the data for this particular cohort cover
a 3 month period it cannot be construed to exactly represent
the full year's input to the Navy. Significant seasonal
differences in recruit cohort characteristics have been
determined in previous research (Grismer, 1976) . The ship
variables "class" and "subclass" were not utilized as they
subdivided the data into cell sizes that were too small for
analysis. They are described in the ship variable description
21

in Table 3 and Appendix E for possible future research
effort.
ANALYSES
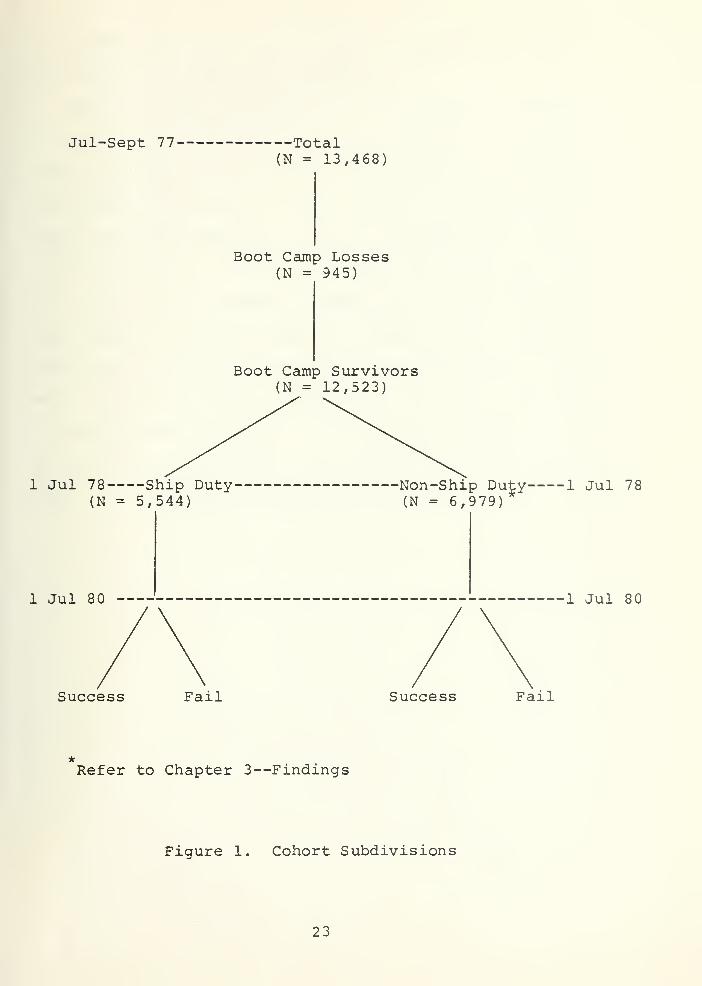
The total cohort (N = 13,468) was divided into four sub-
groups to enable different statistical comparisons. Those
individuals who attrited during their initial three months
of active duty (N = 945) were identified and labeled "Boot
Camp Losses". The remaining cohort (N = 12,523) was labeled
"Boot Camp Survivors" or BCS . The BCS group was subdivided
into those individuals who went to ships "Ship" prior to
1 July 1978 (N = 5,544) and those who went to duty stations
other than ships "Non Ship" prior to 1 July 1978 (N = 6,979).
The cohort breakdown is illustrated in Figure 1. The four
distinct groups were evaluated based on traditional variables
(e.g., race, age at entry) and non-traditional or organizational
(e.g., training, duty assignment) variables. Attrition rates
for the various groups and variables within groups were
examined. Both traditional and non-traditional variables
were used in an attempt to predict attrition in the four
largest groups.
DATA ANALYSIS
The cohort data were statistically processed using pro-
grams from the Statistical Package for the Social Sciences
—
SPSS (Nie, Hull, Jenkins, Steinrenner, & Bent, 1975). Fre-
quencies were computed fro total numbers of cohort members,
22

Jul-Sept 77- —Total(N = 13,468)
Boot Camp Losses(N = 945)
Boot Camp Survivors(N = 12,523)
1 Jul 78-
(N—Ship Duty-= 5,544)
1 Jul 80
Non-Ship Duty
—
(N = 6,979)—1 Jul 78
1 Jul 80
Success Fail Success Fail
Refer to Chapter 3—Findings
Figure 1. Cohort Subdivisions
23

the number attriting, and the number surviving for tradi-
tional and non-traditional variables.
Multiple linear regression was utilized in an attempt
to evaluate the impact of variables in predicting attrition
rates. Analysis was performed using the traditional varia-
bles proposed by Lockman (1976), Sands (1976) and others.
These variables described in Table 2 included race, AFQT,
years of education, and age at entry. A decision was made
not to use primary dependent status as a variable due to a
large number of missing cases on the STF-L file. The Non-
traditional variables of A-school status and ship type assign-
ment identified by Smith and Kendell (19 80) were also added
to the regression equation. Finally, the variables specific
to ships were entered into the regression equation. The non-
traditional variables are described in Table 3.
24

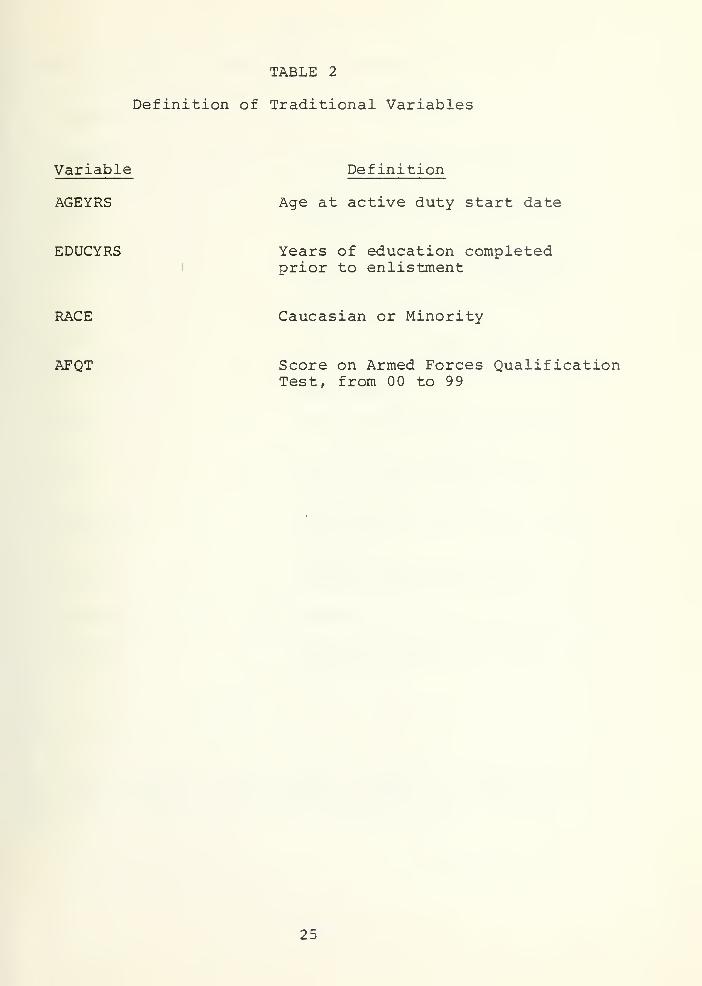
TABLE 2
Definition of Traditional Variables
Variable
AGEYRS
Definition
Age at active duty start date
EDUCYRS Years of education completedprior to enlistment
RACE Caucasian or Minority
AFQT Score on Armed Forces QualificationTest, from 00 to 9 9
25

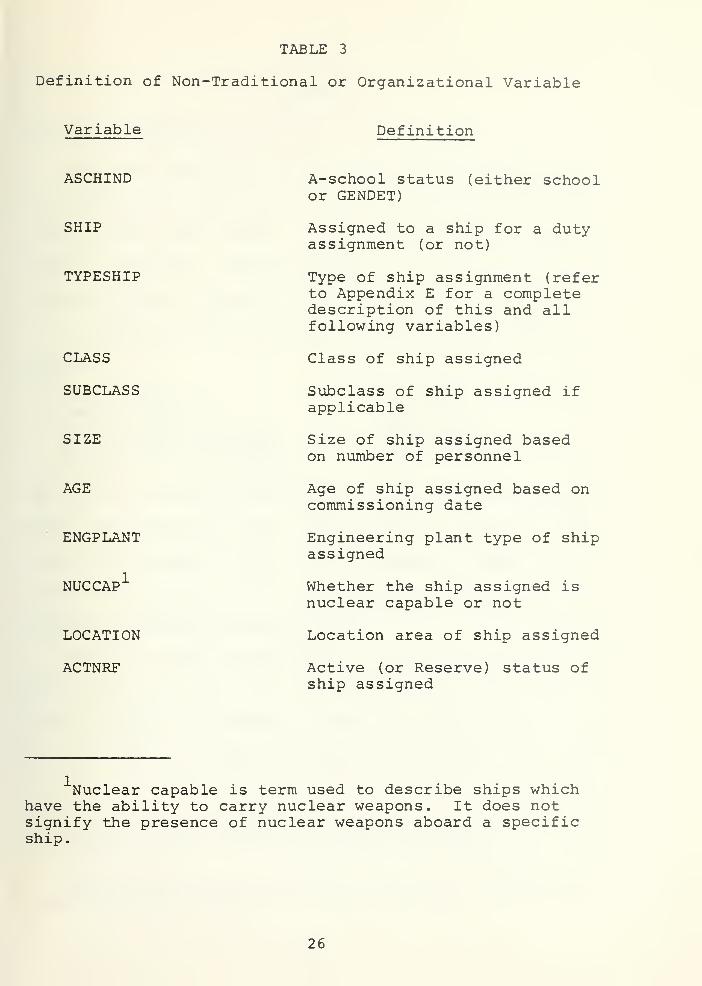
TABLE 3
Definition of Non-Traditional or Organizational Variable
Variable Definition
ASCHIND
SHIP
TYPESHIP
CLASS
SUBCLASS
SIZE
AGE
ENGPLANT
NUCCAP 1
LOCATION
ACTNRF
A-school status (either schoolor GENDET)
Assigned to a ship for a dutyassignment (or not)
Type of ship assignment (referto Appendix E for a completedescription of this and allfollowing variables)
Class of ship assigned
Subclass of ship assigned ifapplicable
Size of ship assigned basedon number of personnel
Age of ship assigned based oncommissioning date
Engineering plant type of shipassigned
Whether the ship assigned isnuclear capable or not
Location area of ship assigned
Active (or Reserve) status ofship assigned
Nuclear capable is term used to describe ships whichhave the ability to carry nuclear weapons. It does notsignify the presence of nuclear weapons aboard a specificship.
26


FINDINGS
COHORT DISTRIBUTION
The first examination of the cohort data concerned the
distributions of individuals based on the traditional varia-
bles of race, ethnic group, age at entry, mental group, and
years of education. The frequencies for these variables are
listed by cohort group in Tables 4 through 7.
Mental groups were defined in terms of AFQT scores as
follows
:
Mental Group I AFQT 9 3+Mental Group II AFQT 65-9 2
Mental Group III Upper AFQT 4 9-64Mental Group III Lower - AFQT 31-48Mental Group IV or Below AFQT 01-30
The years of education variable was split into two categories
Those individuals with less than 12 years of education com-
pleted were termed non-high school graduates (NKSG) . Those
individuals with 12 years or more education completed were
termed high school graduates (HSG)
.
The total cohort broken down by traditional variables is
shown in Table 4. At entry, 18 year olds comprised the
largest group— 39.3 percent. Mental group III (Upper) was
the most prevalent mental category of the cohort obtaining
Ethnic group, although not a traditional variable, wasincluded here due to its relationship with race.
2There were seme individuals in the cohort who had AFQT
scores lower than the mental group IV minimum.
27

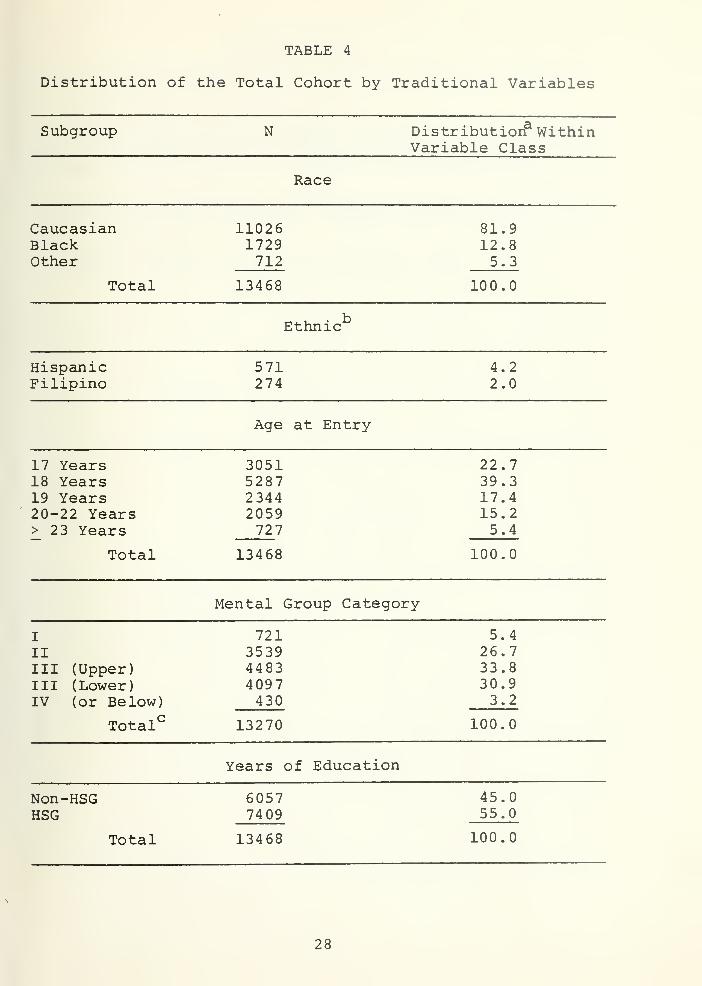
TABLE 4
Distribution of the Total Cohort by Traditional Variables
Subgroup N DisVar
tributiona Withiniable Class
Race
CaucasianBlackOther
Total
110261729712
13468
81.912.85.3
100.0
Ethnicb
HispanicFilipino
571274
4.22.0
Age at Entry
17 Years18 Years19 Years20-22 Years> 23 Years
Total
3051528723442059727
13468
22.739.317.415.25.4
100.0
Mental Group Category
I
IIIII (Upper)III (Lower)IV (or Below)
Totalc
721353944834097430
13270
5.426.733.830.93.2
100.0
Years c>f Education
Non-HSGHSG
Total
60577409
13468
45.055.0
100.0
28


TABLE 4 (CONT.)
Distribution within variable class is the percentagethat each subgroup N represents of the total for thevariable (e.g.,—Caucasian, 11,026 f 13468 = 81.9%)
Only Hispanic and Filipino ethnic groups had a signi-ficant number of individuals. Percent is of total cohort
CMental Group missing observations = 198.
29

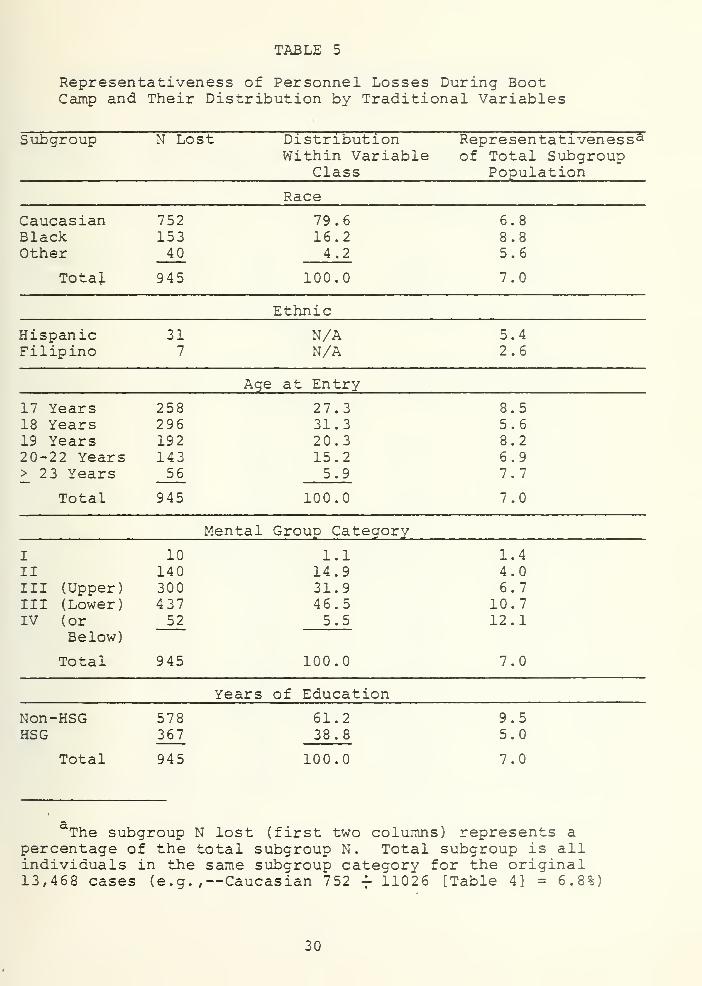
TABLE 5
Representativeness of Personnel Losses During BootCamp and Their Distribution by Traditional Variables
Subgroup N Lost DistributionWithin Variable
Class
Representativeness a
of Total SubgroupPopulation
Race
CaucasianBlackOther
Total
75215340
945
79.616.24.2
100.0
6.88.85.6
7.0
Ethnic
HispanicFilipino
317
N/AN/A
5.42.6
Age at Entry
17 Years18 Years19 Years20-22 Years> 23 Years
Total
25829619214356
945
27.331.320.315.25.9
100.0
8.55.68.26.97.7
7.0
Mental Group Category
I
IIIII (Upper)III (Lower)IV (or
Below)
Total
1014030043752
945
1.114.931.946.55.5
100.0
1.44.06.7
10.712.1
7.0
Years of Education
Non-HSGHSG
578367
61.238.8
9.55.0
Total 945 100.0 7.0
The subgroup N lost (first two columns) represents apercentage of the total subgroup N. Total subgroup is allindividuals in the same subgroup category for the original13,468 cases (e.g.,—Caucasian 752 -^ 11026 [Table 4] = 6.8%)
30

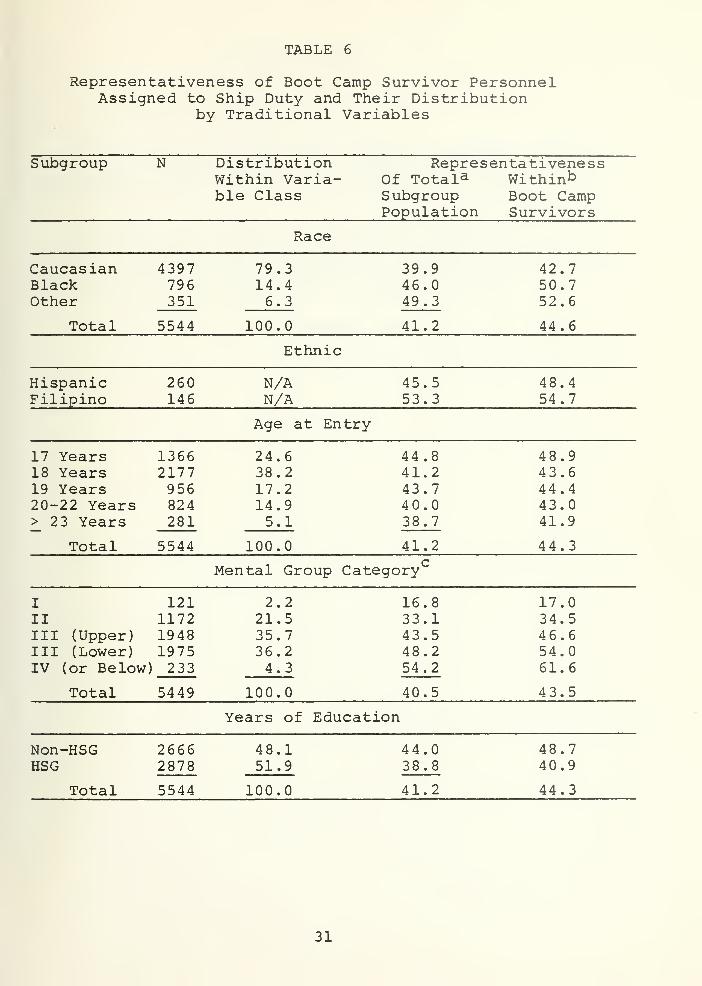
TABLE 6
Representativeness of Boot Camp Survivor PersonnelAssigned to Ship Duty and Their Distribution
by Traditional Variables
Subgroup N DistributionWithin Varia-ble Class
RepresentativenessOf Totala WithinbSubgroup Boot CampPopulation Survivors
Race
CaucasianBlackOther
4397796351
79.314.46.3
39.946.049.3
17 Years 1366 24.618 Years 2177 38.219 Years 956 17.220-22 Years 824 14.9> 23 Years 281 5.1
Total 5544 100.0 41.2
42.750.752.6
Total 5544 100.0 41.2 44.6
Ethnic
HispanicFilipino
260146
N/AN/A
45.553.3
48.454.7
Age at Entry
44.8 48.941.2 43.643.7 44.440.0 43.038.7 41.9
44.3
Mental Group Category
I 121 2.2II 1172 21.5III (Upper) 1948 35.7III (Lower) 1975 36.2IV (or Below) 233 4.3
16.8 17.033.1 34.543.5 46.648.2 54.054.2 61.6
100.0 40.5 43.5
Years of Education
Non-HSGHSG
Total
26662878
5544
48.151.9
100.0
44.038.8
41.2
48.740.9
44.3
31


TABLE 6 (CONT.)
The subgroup N (first two columns) represents a per-centage of the total subgroup N. Total subgroup is allindividuals in the same subgroup category for the original13,468 cases (e.g.,—Caucasian 4397 f 11026 (Table 4) = 39.9%
The subgroup N (first two columns) represents a per-centage of the total BCS subgroup N. BCS total subgroup isall individuals in the same subgroup category for the 12 , 523BCS cases (e.g.,—Caucasian 4397 f 10274 = 42.7%).
Mental Group missing observations = 95.
32

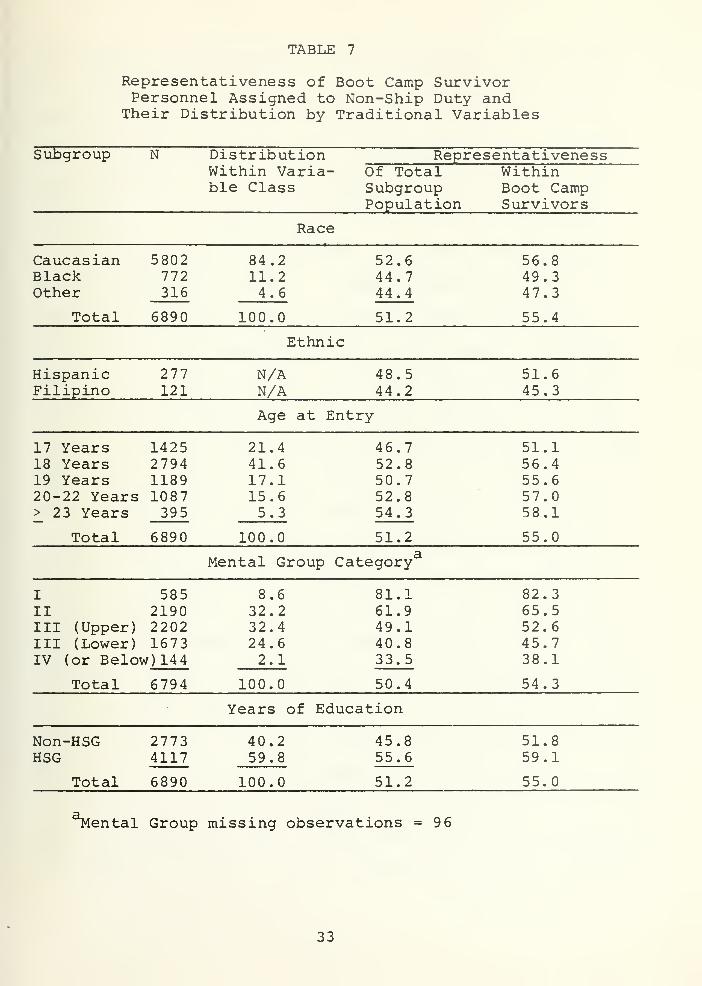
TABLE 7
Representativeness of Boot Camp SurvivorPersonnel Assigned to Non-Ship Duty and
Their Distribution by Traditional Variables
Subgroup N DistributionWithin Varia-ble Class
Of TotalSubgroupPopulation
RepresentativenessWithinBoot CampSurvivors
Race
CaucasianBlackOther
5802772316
84.211.24.6
52.644.744.4
17 Years 1425 21.418 Years 2794 41.619 Years 1189 17.120-22 Years 1087 15.6>_ 23 Years 395 5.3
Total 6890 100.0
46.752.850.752.854.3
51.2
56.849.347.3
Total 6890 100.0 51.2 55.4
Ethnic
HispanicFilipino
277121
N/A 48.5N/A 4 4.2
51.645.3
Age at Entry
51.156.455.657.058.1
55.0
Mental Group Category'
I 585II 2190III (Upper) 2202III (Lower) 1673IV (or Below) 144
Total 6794
8.632.232.424.62.1
100.0
81.161.949.140.833.5
50.4
82.365.552.645.738.1
54.3
Years of Education
Non-HSGHSG
Total
27734117
6890
40.259.8
100.0
45.855.6
51.2
51.859.1
55.0
Mental Group missing observations =96
33

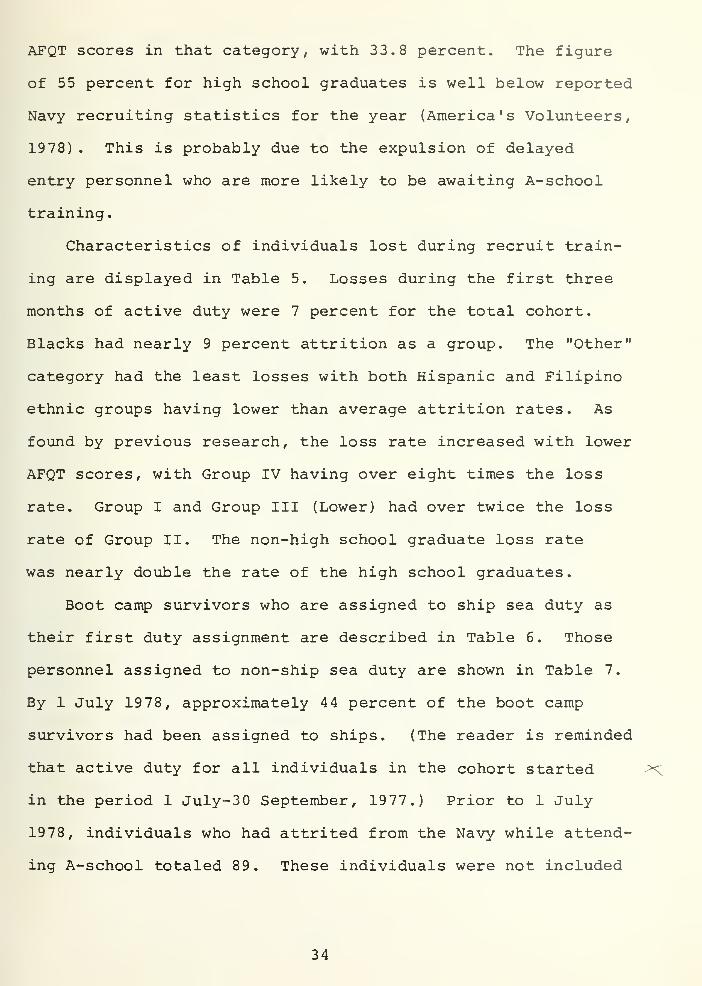
AFQT scores in that category, with 33.8 percent. The figure
of 55 percent for high school graduates is well below reported
Navy recruiting statistics for the year (America's Volunteers,
1978) . This is probably due to the expulsion of delayed
entry personnel who are more likely to be awaiting A-school
training.
Characteristics of individuals lost during recruit train-
ing are displayed in Table 5. Losses during the first three
months of active duty were 7 percent for the total cohort.
Blacks had nearly 9 percent attrition as a group. The "Other"
category had the least losses with both Hispanic and Filipino
ethnic groups having lower than average attrition rates. As
found by previous research, the loss rate increased with lower
AFQT scores, with Group IV having over eight times the loss
rate. Group I and Group III (Lower) had over twice the loss
rate of Group II. The non-high school graduate loss rate
was nearly double the rate of the high school graduates.
Boot camp survivors who are assigned to ship sea duty as
their first duty assignment are described in Table 6. Those
personnel assigned to non-ship sea duty are shown in Table 7.
By 1 July 1978, approximately 44 percent of the boot camp
survivors had been assigned to ships. (The reader is reminded
that active duty for all individuals in the cohort started >C
in the period 1 July-30 September, 1977.) Prior to 1 July
1978, individuals who had attrited from the Navy while attend-
ing A-school totaled 89. These individuals were not included
34

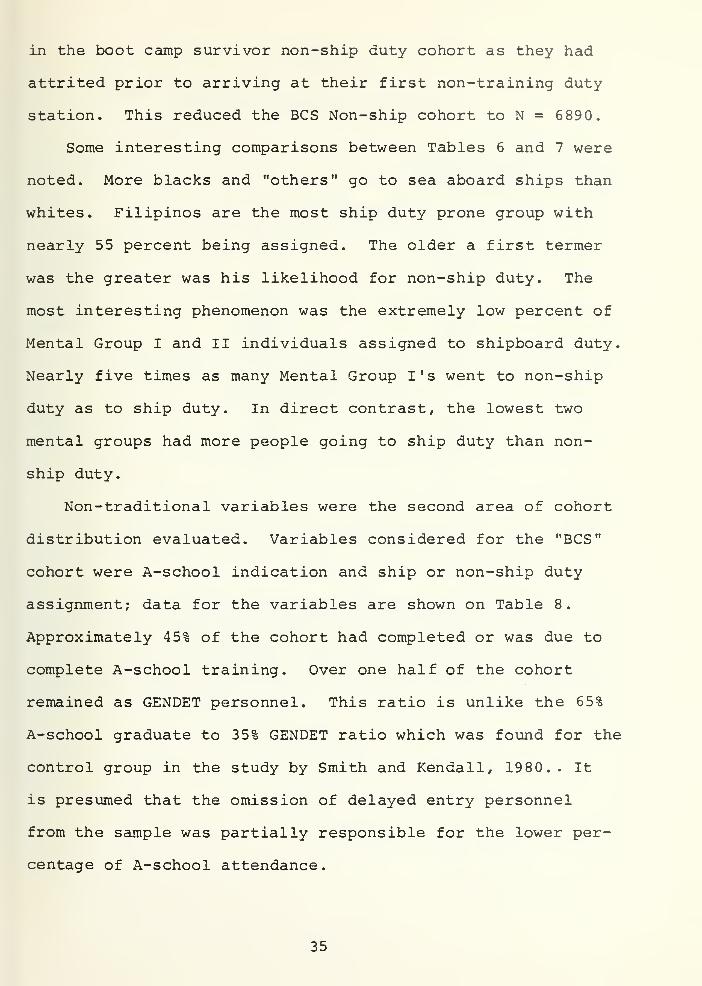
in the boot camp survivor non-ship duty cohort as they had
attrited prior to arriving at their first non-training duty
station. This reduced the BCS Non-ship cohort to N = 6 890.
Some interesting comparisons between Tables 6 and 7 were
noted. More blacks and "others" go to sea aboard ships than
whites. Filipinos are the most ship duty prone group with
nearly 55 percent being assigned. The older a first termer
was the greater was his likelihood for non-ship duty. The
most interesting phenomenon was the extremely low percent of
Mental Group I and II individuals assigned to shipboard duty.
Nearly five times as many Mental Group I's went to non-ship
duty as to ship duty. In direct contrast, the lowest two
mental groups had more people going to ship duty than non-
ship duty.
Non-traditional variables were the second area of cohort
distribution evaluated. Variables considered for the "BCS"
cohort were A-school indication and ship or non-ship duty
assignment; data for the variables are shown on Table 8.
Approximately 45% of the cohort had completed or was due to
complete A-school training. Over one half of the cohort
remained as GENDET personnel. This ratio is unlike the 65%
A-school graduate to 35% GENDET ratio which was found for the
control group in the study by Smith and Kendall, 1980.. It
is presumed that the omission of delayed entry personnel
from the sample was partially responsible for the lower per-
centage of A-school attendance.
35

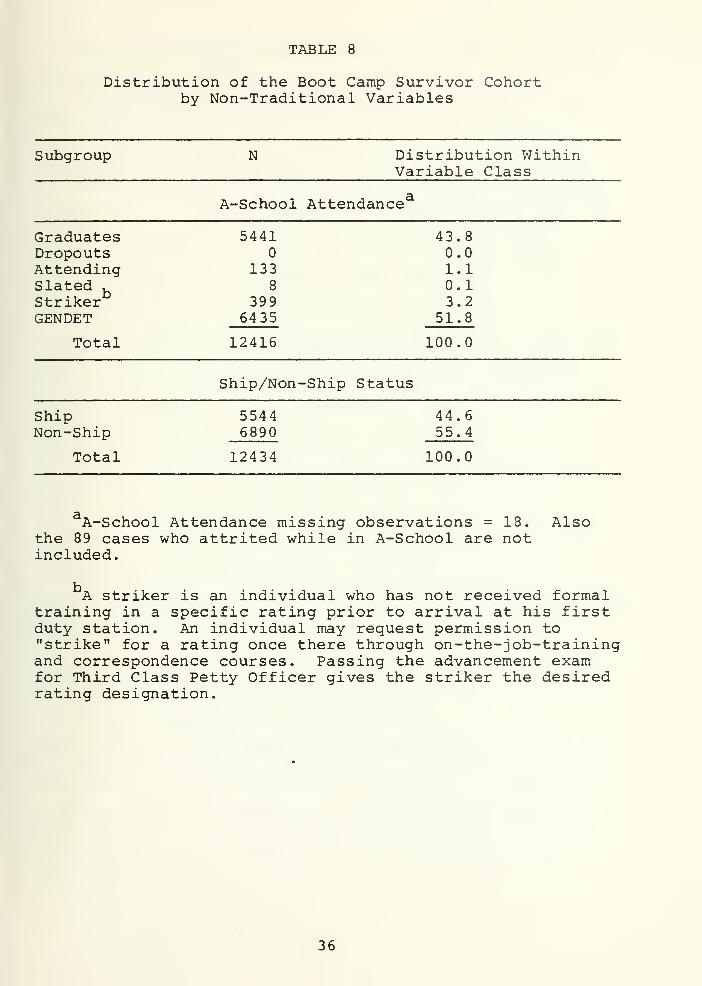
TABLE 8
Distribution of the Boot Camp Survivor Cohortby Non-Traditional Variables
Subgroup N Distribution WithinVariable Class
A-School Attendance
GraduatesDropoutsAttendingSlated .
StrikerGENDET
Total
5441
1338
3996435
12416
43.80.01.10.13.2
51.8
100.0
Ship/Non-Ship Status
ShipNon-Ship
Total
55446890
12434
44.655.4
100.0
A-School Attendance missing observations = 18.the 89 cases who attrited while in A-School are notincluded.
Also
A striker is an individual who has not received formaltraining in a specific rating prior to arrival at his firstduty station. An individual may request permission to"strike" for a rating once there through on-the-job-trainingand correspondence courses. Passing the advancement examfor Third Class Petty Officer gives the striker the desiredrating designation.
36

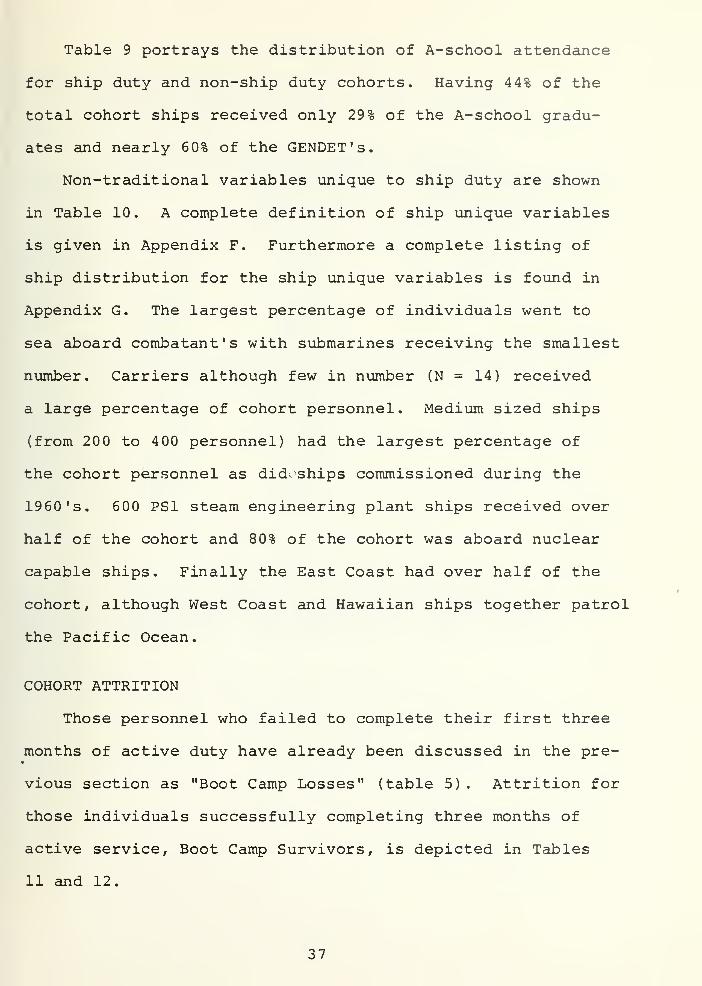
Table 9 portrays the distribution of A-school attendance
for ship duty and non-ship duty cohorts. Having 44% of the
total cohort ships received only 29% of the A-school gradu-
ates and nearly 60% of the GENDET's.
Non-traditional variables unique to ship duty are shown
in Table 10. A complete definition of ship unique variables
is given in Appendix F. Furthermore a complete listing of
ship distribution for the ship unique variables is found in
Appendix G. The largest percentage of individuals went to
sea aboard combatant's with submarines receiving the smallest
number. Carriers although few in number (N = 14) received
a large percentage of cohort personnel. Medium sized ships
(from 200 to 400 personnel) had the largest percentage of
the cohort personnel as did; 'ships commissioned during the
1960's. 600 PS1 steam engineering plant ships received over
half of the cohort and 80% of the cohort was aboard nuclear
capable ships. Finally the East Coast had over half of the
cohort, although West Coast and Hawaiian ships together patrol
the Pacific Ocean.
COHORT ATTRITION
Those personnel who failed to complete their first three
months of active duty have already been discussed in the pre-
vious section as "Boot Camp Losses" (table 5) . Attrition for
those individuals successfully completing three months of
active service, Boot Camp Survivors, is depicted in Tables
11 and 12.
37

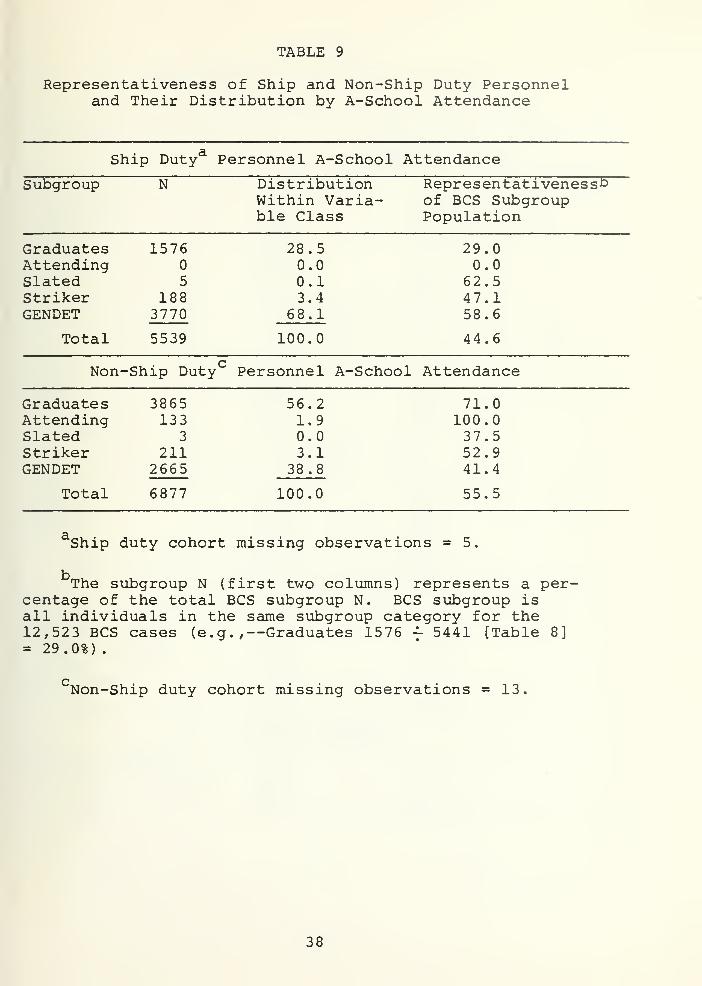
TABLE 9
Representativeness of Ship and Non-Ship Duty Personneland Their Distribution by A-School Attendance
st-lip Dutya Personnel A-School Attendance
Subgroup N DistributionWithin Varia-ble Class
Representativeness*}of BCS SubgroupPopulation
GraduatesAttendingSlatedStrikerGENDET
Total
1576
5
1883770
5539
28.50.00.13.4
68.1
100.0
29.00.0
62.547.158.6
44.6
Non-Ship DutyC Personnel A- School Attendance
GraduatesAttendingSlatedStrikerGENDET
Total
3865133
3
2112665
6877
56.21.90.03.1
38.8
100.0
71.0100.037.552.941.4
55.5
Ship duty cohort missing observations = 5.
The subgroup N (first two columns) represents a per-centage of the total BCS subgroup N. BCS subgroup isall individuals in the same subgroup category for the12,523 BCS cases (e.g.,—Graduates 1576 - 5441 [Table 8]= 29.0%)
.
Non-Ship duty cohort missing observations = 13.
38

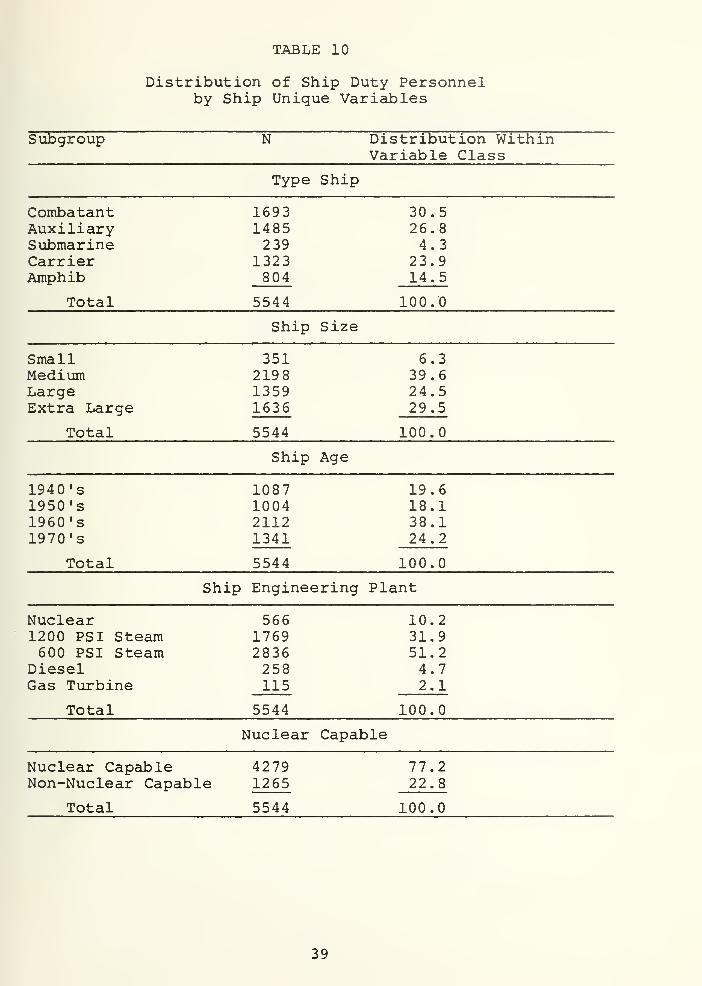
TABLE 10
Distribution of Ship Duty Personnelby Ship Unique Variables
Distribution WithinVariable Class
Subgroup N
Type Ship
CombatantAuxiliarySubmarineCarrierAmphib
Total
1693 30.51485 26.8239 4.3
1323 23.9804 14.5
5544 100.0
Ship Size
SmallMediumLargeExtra Large
Total
351 6.32198 39.61359 24.51636 29.5
5544 100.0
Ship Age
1940's1950's1960's1970's
1087 19.61004 18.12112 38.11341 24.2
Total 5544 100.0
Ship Engineering Plant
Nuclear 566 10.21200 PSI Steam 1769 31.9600 PSI Steam 2836 51.2
Diesel 258 4.7Gas Turbine 115 2.1
Total 5544 100.0
Nuclear Capable
Nuclear CapableNon-Nuclear Capable
Total
4279 77.21265 22.8
5544 100.0
39

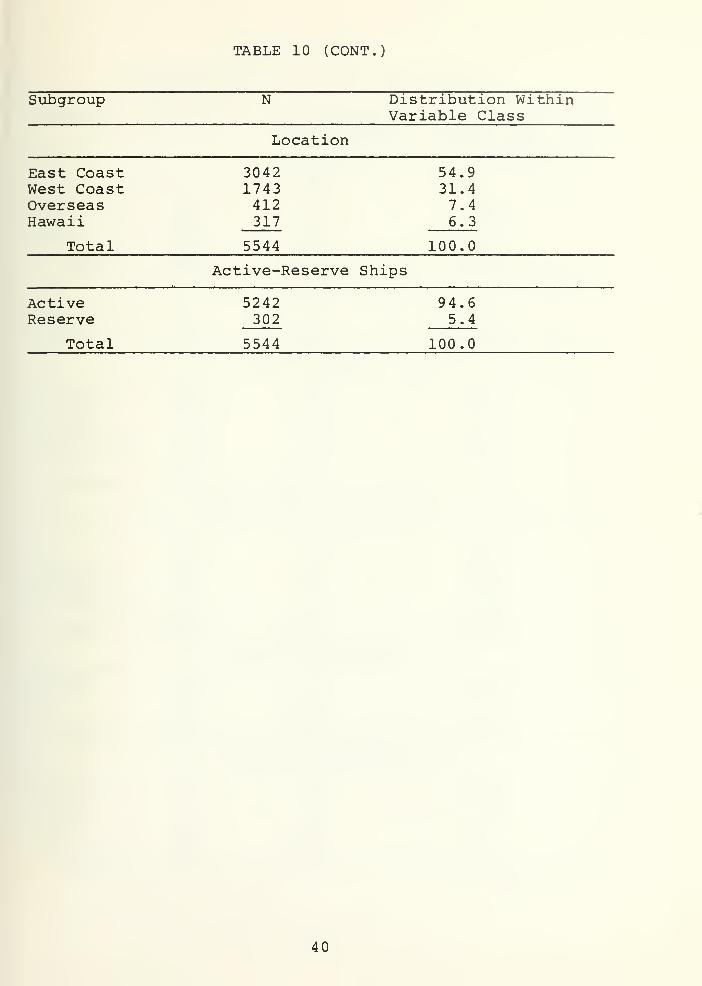
TABLE 10 (CONT.)
Subgroup N Distribution WithinVariable Class
Location
East CoastWest CoastOverseasHawaii
Total
30421743412317
5544
54.931.47.46.3
100.0
Active-Reserve Ships
ActiveReserve
Total
5242302
5544
94.65.4
100.0
40

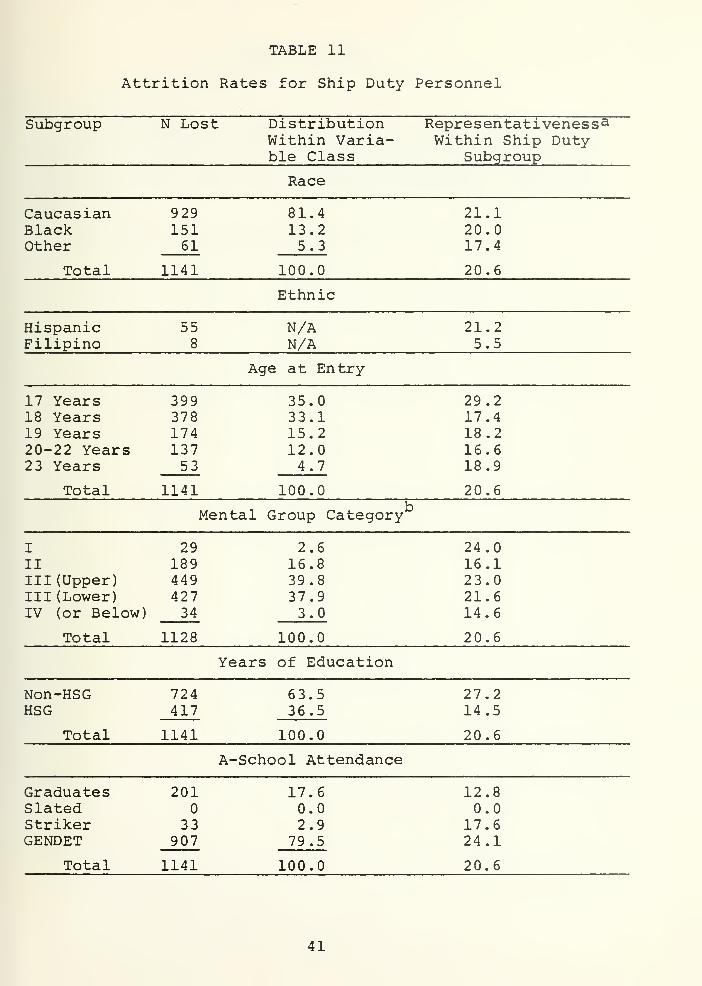
TABLE 11
Attrition Rates for Ship Duty Personnel
Subgroup N Lost DistributionWithin Varia-ble Class
Representativeness 3
Within Ship DutySubgroup
Race
Caucasian 929 81.4Black 151 13.2Other 61 5.3
17 Years 399 35.018 Years 378 33.119 Years 174 15.220-22 Years 137 12.02 3 Years 53 4.7
Total 1141 100.0
21.120.017.4
Total 1141 100.0 20.6
Ethnic
HispanicFilipino
558
N/AN/A
21.25.5
Age at En try
29.217.418.216.618.9
20.6
Mental Group Category
I 29 2.6II 189 16.8III (Upper) 449 39.8III (Lower) 427 37.9IV (or Below) 34 3.0
Graduates 201 17.6Slated 0.0Striker 33 2.9GENDET 907 79.5
24.016.123.021.614.6
Total 1128 100.0 20.6
Years of Education
Non-HSGHSG
Total
724417
1141
63.536.5
100.0
27.214.5
20.6
A-School Attendance
Total 1141 100.0
12.80.0
17.624.1
20.6
41


TABLE 11 (CONT.)
The subgroup N (first two columns) represents apercentage of the total ship duty subgroup N. Ship dutysubgroup is all individuals in the same category for the5544 ship duty cases (e. g. , --Caucasian 929—4397 [Table 6]= 21.1%)
.
i_
Mental Group missing observations = 13.
42

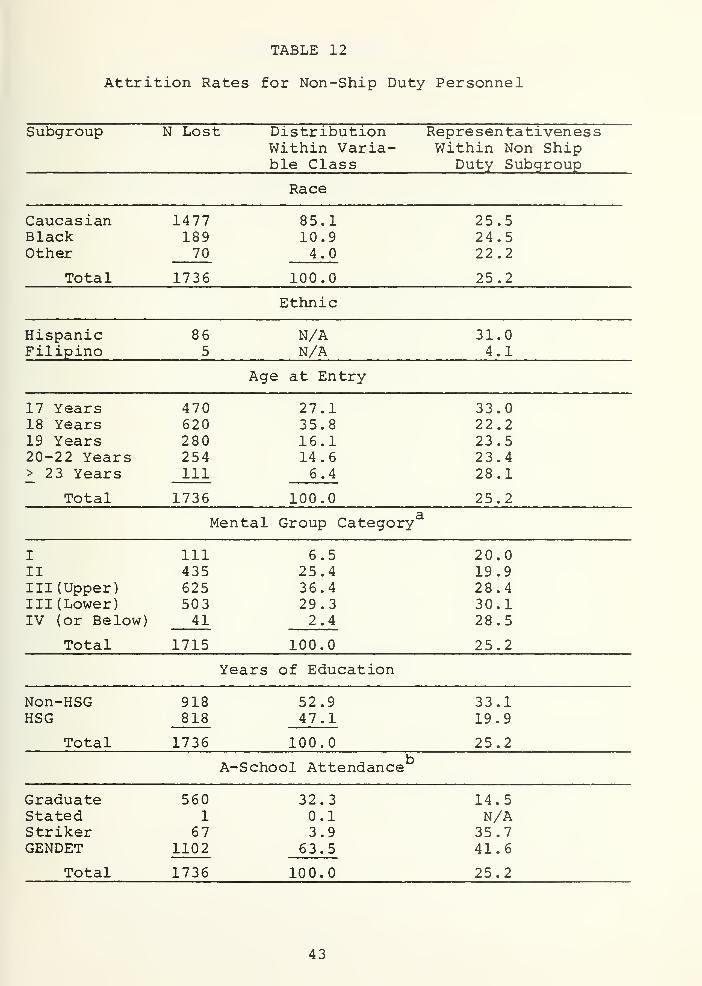
TABLE 12
Attrition Rates for Non-Ship Duty Personnel
Subgroup N Lost DistributionWithin Varia-ble Class
RepresentativenessWithin Non Ship
Duty Subgroup
Race
Caucasian 1477 85.1Black 189 10.9Other 70 4.0
17 Years 470 27.118 Years 620 35.819 Years 280 16.120-22 Years 254 14.6
2 3 Years 111 6.4
Total 1736 100.0
25.524.522.2
Total 1736 100.0 25.2
Ethnic
HispanicFilipino
865
N/AN/A
31.04.1
Age at Entry
33.022.2232328
25.2
Mental Group Category'
I 111 6.5II 435 25.4III (Upper) 625 36.4III (Lower) 503 29.3IV (or Below) 41 2.4
Graduate 560 32.3Stated 1 0.1Striker 67 3.9GENDET 1102 63.5
Total 1736 100.0
20.019.9283028
Total 1715 100.0 25.2
Years of Education
Non-HSGHSG
Total
918 52.9818 47.1
1736 100.0
33.119.9
25.2
A-School Attendance
14.5N/A35.741.6
25.2
43


TABLE 12 (CONT.)
Mental Group missing observations = 21.
Losses while attending A-School (N = 89) were removedfrom the BCS Non-Ship duty cohort.
44


Loss rates for ship duty assigned personnel are portrayed
in Table 11 for Traditional and A-School attendance varia-
bles. Blacks and Caucasians had approximately the same
attrition rate. Filipino had a loss rate which was only one
fourth as great as any other group. 17 year olds with nearly
30 percent attrition, clearly stood out from older first
termers. Mental Group Ill's and IV s had a much better suc-
cess rate than Group I's and III (Upper) 's. Non-high school
graduates had nearly twice the failure rate of high school
graduates. Finally the A-School graduate loss rate was
approximately half graduate loss rate was approximately half
that of the GENDET personnel.
Attrition rates for non-ship duty assigned individuals
are described in Table 12 by traditional and A-School attendance
variables. Hispanics had a loss rate nearly 6 points higher
than the average for the cohort/ while the Filipino loss
rate was one sixth the average. 17 year olds and persons
23 years or more old had higher attrition rates than the 18
through 22 year old group. Mental group I and II had loss
rates of 20 percent, with the other mental groups loss rates
approximately 10 percentage points higher. Non-high school
graduates once again had an attrition rate nearly double that
of the high school graduates. A-School graduates had the
lowest attrition rate of any variable subgroup while GENDET
personnel, with 41.6 percent loss rate, had the highest.
In comparing attrition rates for ship and non-ship cohorts
(Tables 11 and 12) the rates are the same or greater in all
45

cases for non-ship duty personnel variable subgroups with
one exception. Mental group I personnel had a higher attri-
tion rate aboard ships than their non-ship counterparts. The
relationships within variable groups are alike for nearly
all cases in both cohorts. Individuals 23 years old or older
had a significantly higher attrition rate than those who were
18 to 22 years old. There was little difference between the
loss rates of both groups in the ship duty cohort. Mental
group IV's did better than all other mental groups on ship
duty, whereas mental groups I and II had the best success
rates ashore. Finally, GENDET's as a group were nearly
twice as successful aboard ships as compared to non-ship
duty.
Attrition rates by ship specific variable are shown for
the ship duty cohort in Table 13. Loss rates by types of
ships are approximately the same except for submarine and
amphibious ships. The submarine loss rate is nearly half
that of the other ship types while amphibious ships had a
rate slightly higher than average. Broken down by size the
small ship subgroup had the lowest rate followed by carriers.
Ship commissioning age subgroups had similar attrition rates
with the 1950' s subgroup having a slightly higher rate.
Nuclear and Diesel categories had the best survival of the
engineering plant variables. The nuclear capable variable
subgroups were almost exactly the same. Overseas and Hawaii
homeports had one third and one half respectively the attrition
46

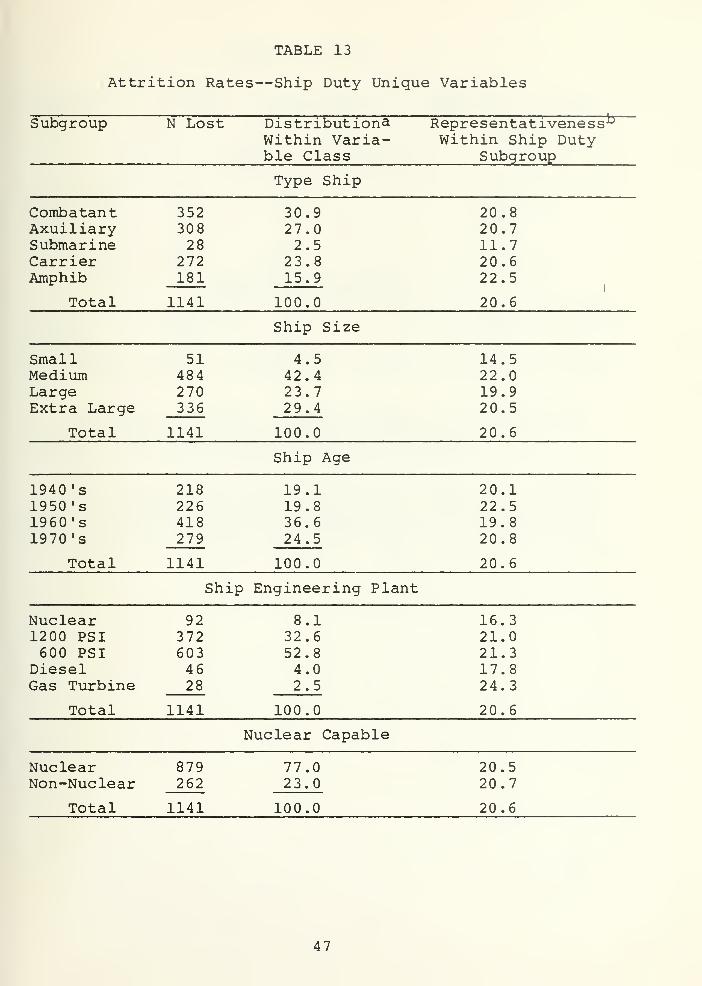
TABLE 13
Attrition Rates—Ship Duty Unique Variables
Subgroup N Lost Distribution^Within Varia-ble Class
Representativeness^Within Ship Duty
Subgroup
Type Ship
CombatantAxuiliarySubmarineCarrierAmphib
Total
35230828
272181
1141
30,.927,.02,.5
23,.815,.9
100.0
20.820.711.720.622.5
20.6
Ship Size
Small 51Medium 484Large 270Extra Large 336
Total 1141
4.542.423.729.4
100.0
14.522.019.920.5
20.6
Ship Age
1940's1950's1960's1970's
Total
218226418279
1141
19.119.836.624.5
100.0
20.122.519.820.8
20.6
Ship Engineering Plant
Nuclear 921200 PSI 372600 PSI 603
Diesel 46Gas Turbine 28
8.132.652.84.02.5
16.321.021.317.824.3
Total 1141 100.0 20.6
Nuclear Capable
NuclearNon-Nuclear
Total
879262
1141
77.023.0
100.0
20.520.7
20.6
47

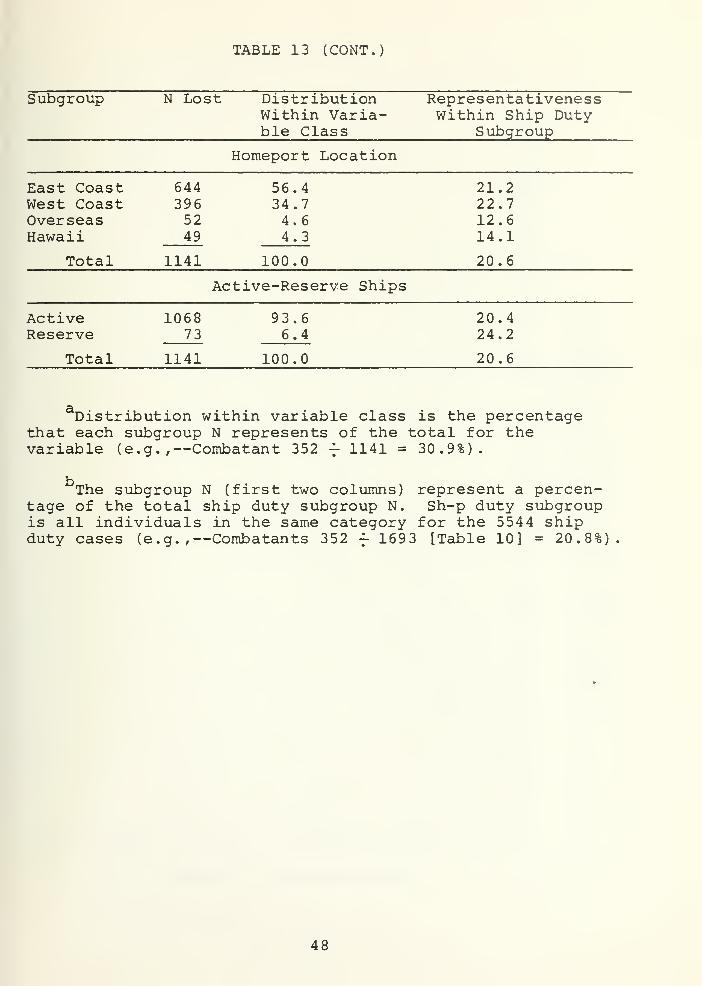
TABLE 13 (CONT.)
Subgroup N Lost Distribution RepresentativenessWithin Varia- Within Ship Dutyble Class Subgroup
Homeport Location
East Coast 644 56.4 21.2West Coast 396 34.7 22.7Overseas 52 4.6 12.6Hawaii 49 4.3 14.1
Total 1141 100.0 20.6
Active-Reserve Ships
Active 1068 93.6 20.4Reserve 73 6.4 24.2
Total 1141 100.0 20.6
Distribution within variable class is the percentagethat each subgroup N represents of the total for thevariable (e.g.,—Combatant 352 f 1141 = 30.9%).
i_
The subgroup N (first two columns) represent a percen-tage of the total ship duty subgroup N. Sh-p duty subgroupis all individuals in the same category for the 5544 shipduty cases (e.g.,—Combatants 352 ± 1693 [Table 10] = 20.8%)
48

ft.
aen o\p cfP
i & CU o\
z • H •
O "* K cri
Z CN W H
in o in
aBe^usoaaa uottcxhy aA-peiTiuno
49

rate of the east and west coast ports. Last, reserve ships
had 20 percent higher attrition than did active duty ships.
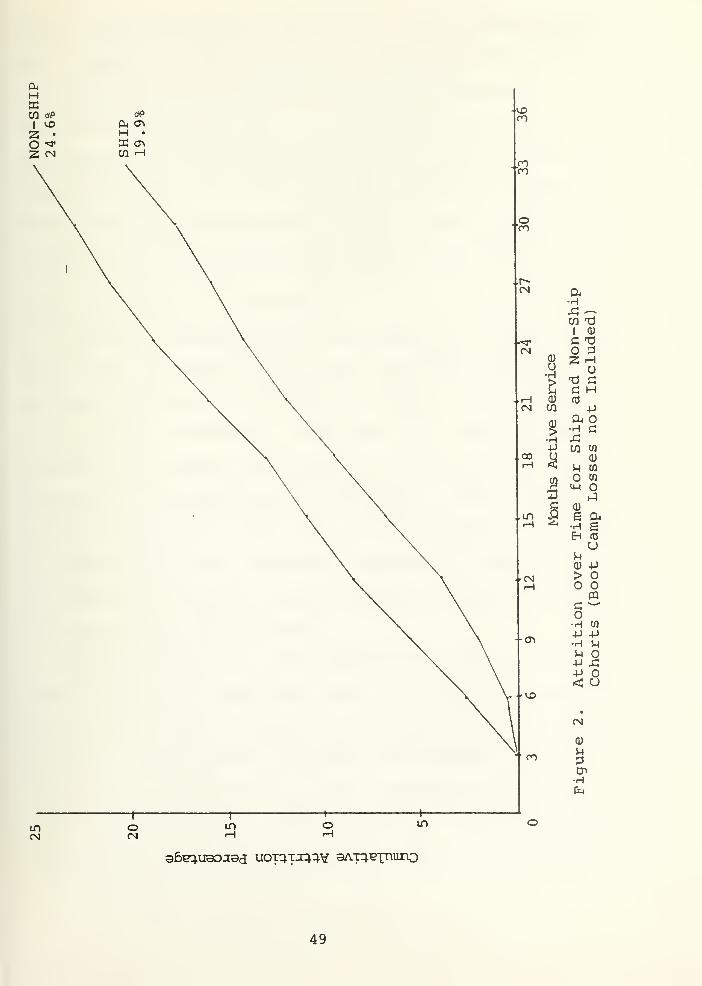
The cumulative attrition over a thirty three month
period is graphed in Figure 2 for both ship and non-ship
duty cohorts. Non-ship personnel had an attrition rate
nearly 20% higher than those personnel assigned to ships.
After the 12 month active service point there was little
difference in the attrition rate (slope of the lines)
.
REGRESSION ANALYSIS OF ATTRITION
Regression analyses were undertaken for a twofold purpose.
The initial objective was to review and verify findings by
previous researchers (Plag, Sands, Lockman) of the effect
by traditional variables on attrition. The non-traditional
variables of A-School attendance and initial duty assignment
evaluated in studies by Smith and Kendall (1980), Butcher
(1980) , and Thomason (1979) were also included in this review.
The second and primary objective involved the inclusion of
ship specific variables into the attrition regression equation
and evaluation of their impact.
Regression equations were generated for three of the
cohort groups: (1) the total cohort, (2) the boot camp sur-
vivor cohort, and (3) the ship duty cohort, Tables 15 through
20 present the regression equations and selected statistics
for traditional and non-traditional variable combinations
with the three cohorts. The definitions of the variables in-
cluded in the regression analyses for Tables 15 to 18 are
50

given in Table 14. The zero values in the table represent
the average individual to whom all others can be compared in
the regression analysis e.g., they are in the constant.
Equations were generated for two dependent variables:
(1) Success [0,1] and (2) TAS , Total Active Service, a con-
tinuous variable ranging from to 36 months.
Regression results utilizing only traditional variables
for the total cohort are presented in Table 15. All varia-
bles were found to be significant, but they only accounted
for 3.38% of the variance in cohort survival. Butcher (1980)
obtained a similar proportion of obtained variance using
traditiona attrition variables in his research. An additional
year of completed education increased survival chances by
over 7% and TAS by 1.6 months. A gain of approximately
five points on the AFQT score would be expected to yield
a 1% higher chance of survival, while being a minority in-
creased survival rate by nearly 2%. The negative coefficient
for age at entry indicates approximately a 1% decrease in
expected survival for each additional year of age. These
findings correspond with the frequency distribution analyses
results previously discussed, with the exception of age. The
fact that the mid-range age at entry (18-22 years old) sub-
groups have less attrition than both younger (17 year olds)
and older (23 or more) subgroups possibly accounts for the
negative coefficient for AGEYRS . Adding the A-School varia-
ble to the equation (Table 16) doubles the amount of variance
explained by the equations. (McNemar, 1970 states that
51

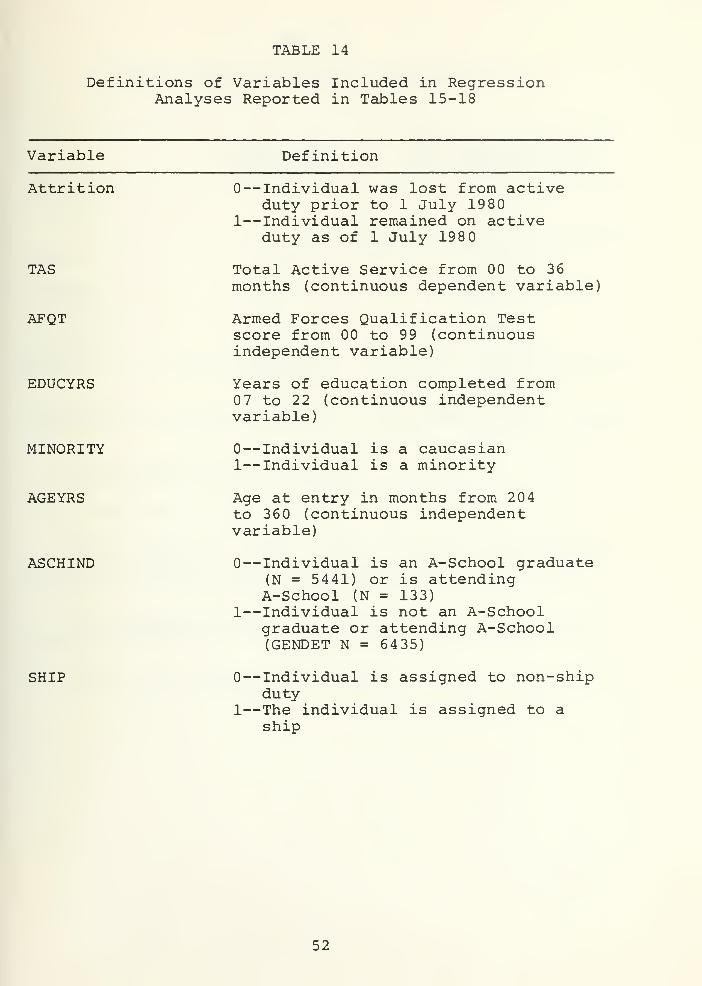
TABLE 14
Definitions of Variables Included in RegressionAnalyses Reported in Tables 15-18
Variable Definition
Attrition
TAS
AFQT
EDUCYRS
MINORITY
AGEYRS
ASCHIND
SHIP
— Individual was lost from activeduty prior to 1 July 1980
1—Individual remained on activeduty as of 1 July 198
Total Active Service from 00 to 36months (continuous dependent variable)
Armed Forces Qualification Testscore from 00 to 99 (continuousindependent variable)
Years of education completed from7 to 22 (continuous independent
variable)
—Individual is a Caucasian1— Individual is a minority
Age at entry in months from 204to 360 (continuous independentvariable)
—Individual is an A-School graduate(N = 5441) or is attendingA-School (N = 133)
1—Individual is not an A-Schoolgraduate or attending A-School(GENDET N = 6435)
—Individual is assigned to non-shipduty
1—The individual is assigned to aship
52

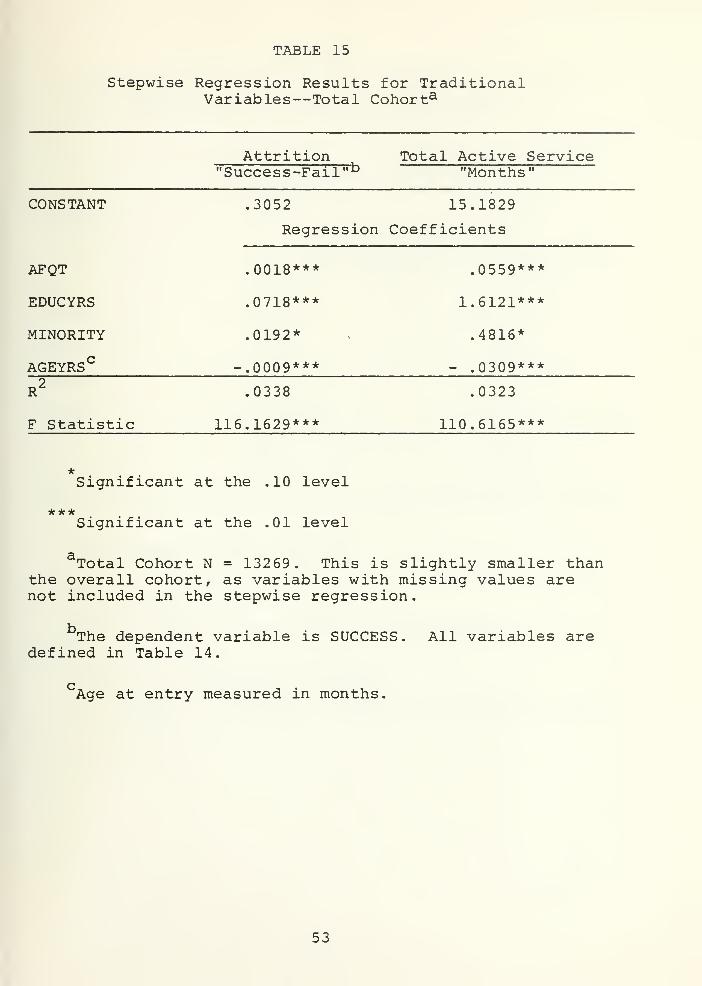
TABLE 15
Stepwise Regression Results for TraditionalVariables—Total Cohorta
Attrition Total Active Service"Success-Fail" b "Months
"
CONSTANT
AFQT
EDUCYRS
MINORITY
AGEYRS°
.3052 15.1829
Regression Coefficients
.0018***
.0718***
.0192*
-.0009***
.0559***
1.6121***
.4816*
- .0309***
F Statistic
.0338
116.1629***
.0323
110.6165***
Significant at the .10 level
***Significant at the .01 level
aTotal Cohort N = 13269. This is slightly smaller thanthe overall cohort, as variables with missing values arenot included in the stepwise regression.
The dependent variable is SUCCESS. All variables aredefined in Table 14.
'Age at entry measured in months.
53

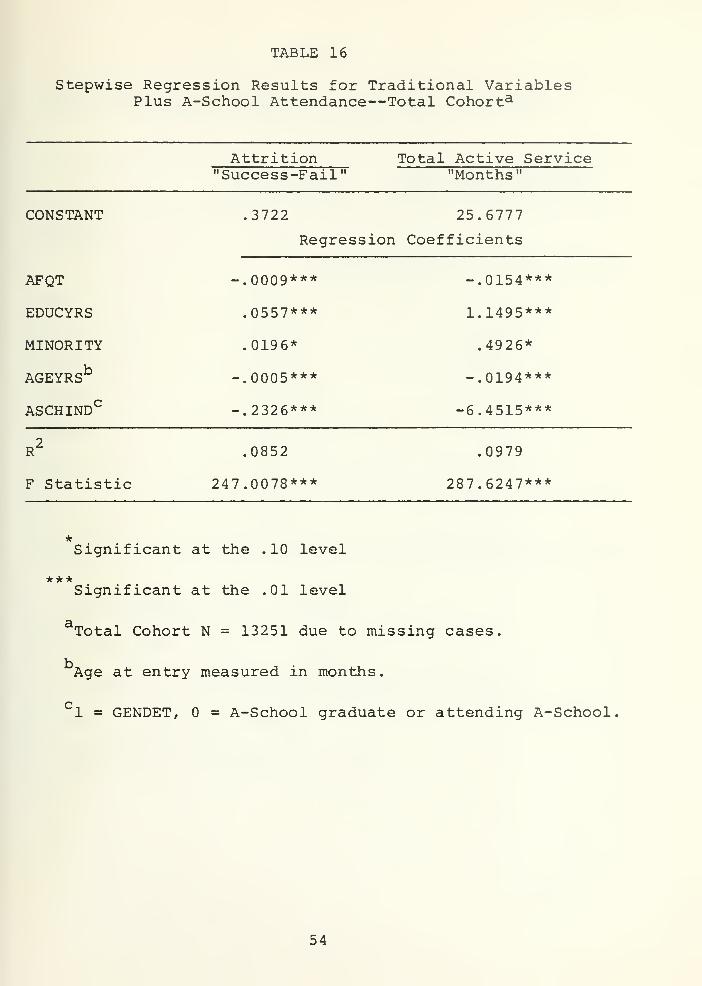
TABLE 16
Stepwise Regression Results for Traditional VariablesPlus A-School Attendance—Total Cohorta
Attrition"Success-Fail"
Total Active Service"Months"
CONSTANT
AFQT
EDUCYRS
MINORITY
AGEYRSb
ASCHINDC
3722 25.6777
Regression Coefficients
0009***
0557***
0196*
0005***
2326***
-.0154***
1.1495***
.4926*
-.0194***
-6.4515***
R
F Statistic
.0852
247.0078***
.0979
287.6247***
Significant at the .10 level
***Significant at the .01 level
Total Cohort N = 13251 due to missing cases.
Age at entry measured in months.
1 = GENDET, = A-School graduate or attending A-School
54

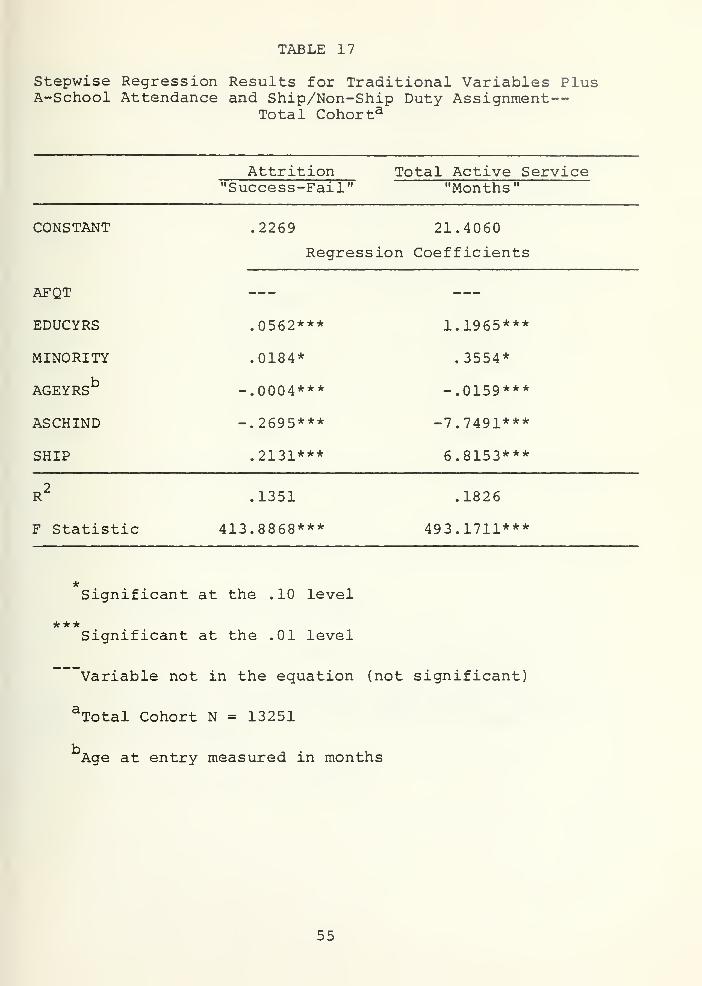
TABLE 17
Stepwise Regression Results for Traditional Variables PlusA-School Attendance and Ship/Non-Ship Duty Assignment
—
Total Conor
t
a
Attrition"Success-Fail"
Total Active Service"Months"
CONSTANT
AFQT
EDUCYRS
MINORITY
AGEYRSb
ASCHIND
SHIP
.2269 21.4060
Regression Coefficients
.0562***
.0184*
-.0004***
-.2695***
.2131***
1.1965***
.3554*
-.0159***
-7.7491***
6.8153***
R'
F Statistic
.1351
413.8868***
.1826
493.1711***
Significant at the .10 level
***Significant at the .01 level
Variable not in the equation (not significant)
Total Cohort N = 13251
Age at entry measured in months
55

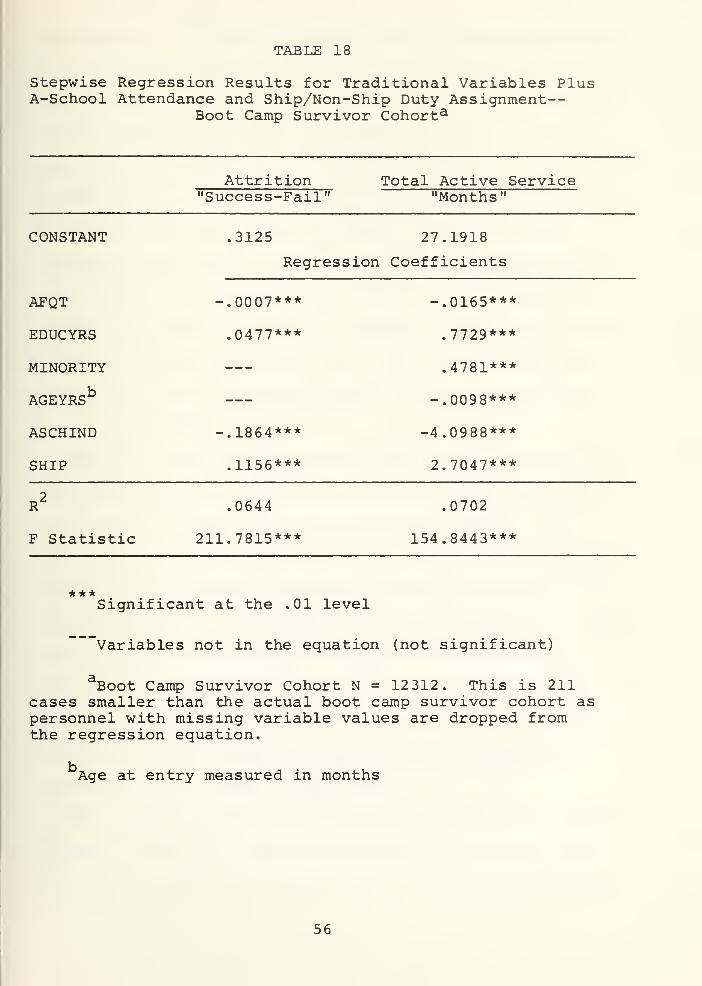
TABLE 18
Stepwise Regression Results for Traditional Variables PlusA-School Attendance and Ship/Non-Ship Duty Assignment
—
Boot Camp Survivor Cohorta
Attrition"Success-Fail"
Total Active Service"Months
"
CONSTANT
AFQT
EDUCYRS
MINORITY
AGEYRSb
ASCHIND
SHIP
3125 27.1918
Regression Coefficients
0007***
0477***
1864***
1156***
-.0165***
7729***
.4781***
-.0098***
-4.0988***
2.7047***
F Statistic
.0644
211.7815***
.0702
154.8443***
***Significant at the .01 level
Variables not in the equation (not significant)
aBoot Camp Survivor Cohort N = 12 312. This is 211cases smaller than the actual boot camp survivor cohort aspersonnel with missing variable values are dropped fromthe regression equation.
i_
Age at entry measured in months
56

2comparisons of adjusted R values from using forward stepwise
regression should be treated with caution; the reader is
urged to consider this caveat.) The fact that an individual
was not an A-School graduate decreased expected survival by
over 23%, and reduced his predicted total active service life
by nearly 6.5 months. The effect of the addition of the duty
assignment variable, ship or non-ship, to the attrition
regression equations is shown in Table 17. Assignment to a
ship increases the expected survival rate by over 21% as
compared to those not assigned to ships and adds nearly seven
months to expected active service. This corresponds with
the positive effect Smith and Kendall (1980) reported for
sea duty assignment.
When the total cohort group was modified by selecting out
boot camp losses, the attrition prediction regression equa-
tions (shown in Table 18) were drastically changed. The
2amount of variance explained (R ) was cut in half, and the
impacts of the A-School attendance and duty assignment varia-
bles were significantly reduced. This seems directly attribu-
table to the fact that the previous regression equations
(Tables 15-17) took into account boot camp attrition. The
change in the total active service equation for the ASCHIND
variable was approximately 3 months, which corresponds to
the amount of time spent in boot camp.
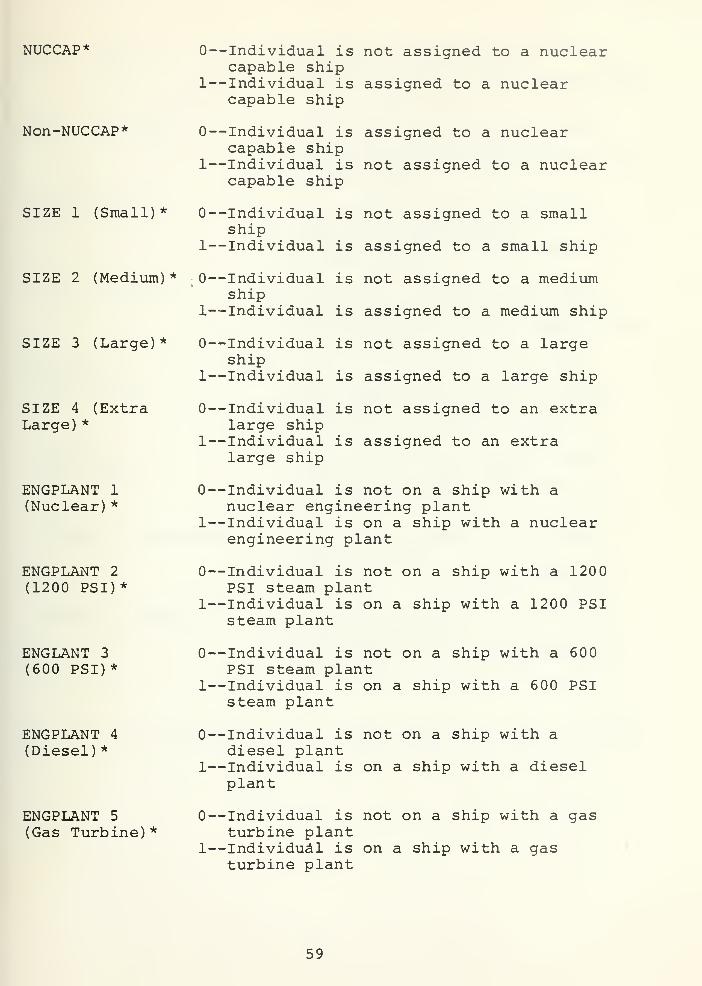
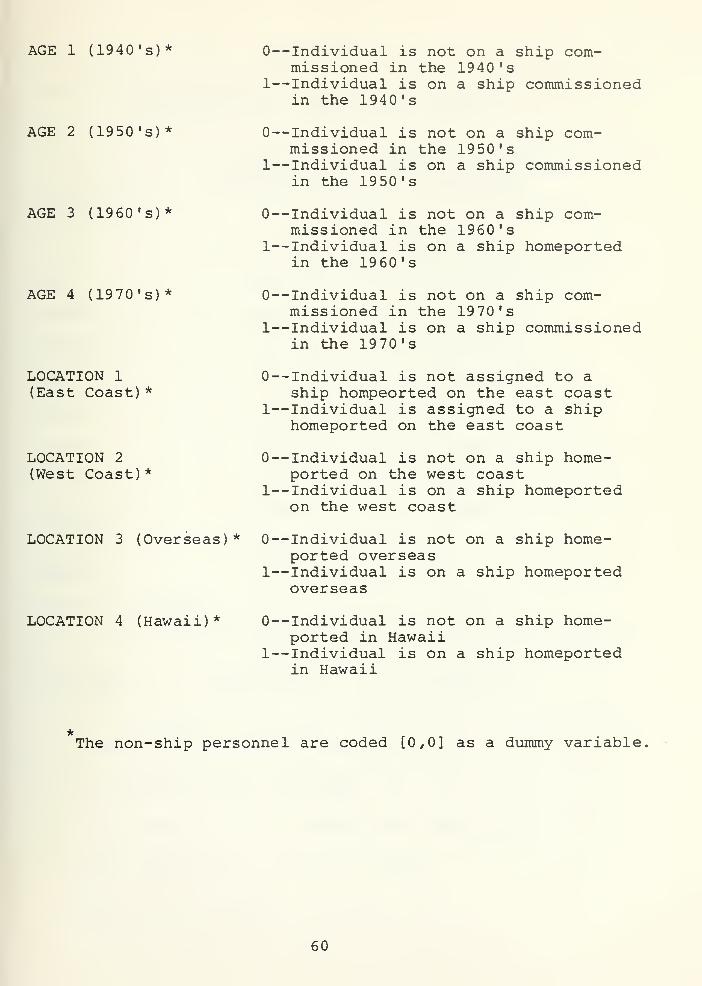
Ship unique variables were next entered into the regression
as shown in Table 20. Table 19 defines the variables used
to derive the equations for that table. The maximum increase
57

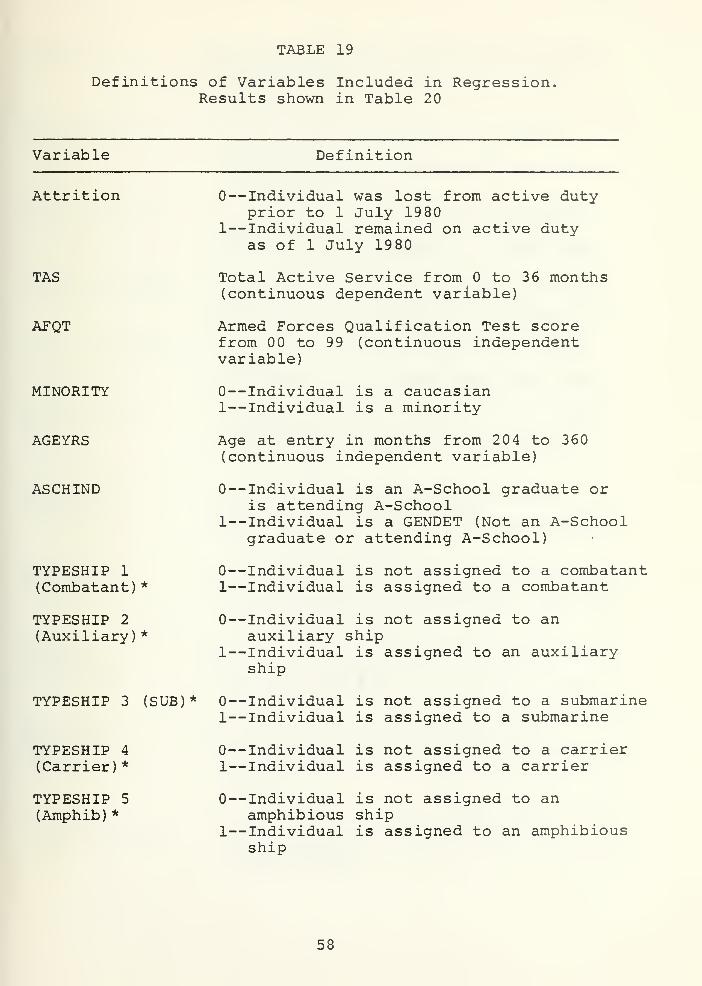
TABLE 19
Definitions of Variables Included in Regression.Results shown in Table 20
Variable Definition
Attrition
TAS
AFQT
—Individual was lost from active dutyprior to 1 July 1980
1—Individual remained on active dutyas of 1 July 1980
Total Active Service from to 36 months(continuous dependent variable)
Armed Forces Qualification Test scorefrom 00 to 99 (continuous independentvariable)
MINORITY
AGEYRS
ASCHIND
TYPESHIP 1
(Combatant)
*
TYPESHIP 2
(Auxiliary)
*
TYPESHIP 3 (SUB)*
TYPESHIP 4
(Carrier)
*
TYPESHIP 5
(Amphib)
*
—Individual is a Caucasian1— Individual is a minority
Age at entry in months from 204 to 360(continuous independent variable)
— Individual is an A-School graduate oris attending A-School
1—Individual is a GENDET (Not an A-Schoolgraduate or attending A-School)
—Individual is not assigned to a combatant1—Individual is assigned to a combatant
—Individual is not assigned to anauxiliary ship
1—Individual is assigned to an auxiliaryship
—Individual is not assigned to a submarine1—Individual is assigned to a submarine
—Individual is not assigned to a carrier1—Individual is assigned to a carrier
—Individual is not assigned to anamphibious ship
1—Individual is assigned to an amphibiousship
58

NUCCAP*
Non-NUCCAP*
ENGPLANT 1(Nuclear)
*
ENGPLANT 2
(1200 PSI)*
ENGLANT 3
(600 PSI)*
ENGPLANT 4
(Diesel)
*
SIZE 1 (Small)* 0-
1-
SIZE 2 (Medium)*j
0-
1-
SIZE 3 (Large)* 0-
1-
SIZE 4 (Extra 0-
Large)
*
1-
0-
1-
0-
1-
0-
1-
0-
1-
ENGPLANT 5 0'
(Gas Turbine)*1«
-Individual is not assigned to a nuclearcapable ship
•-Individual is assigned to a nuclearcapable ship
•-Individual is assigned to a nuclearcapable ship
•-Individual is not assigned to a nuclearcapable ship
-Individual is not assigned to a smallship
•-Individual is assigned to a small ship
•-Individual is not assigned to a mediumship
•-Individual is assigned to a medium ship
•-Individual is not assigned to a largeship
•-Individual is assigned to a large ship
•-Individual is not assigned to an extralarge ship
•-Individual is assigned to an extralarge ship
-Individual is not on a ship with anuclear engineering plant-Individual is on a ship with a nuclearengineering plant
-Individual is not on a ship with a 1200PSI steam plant-Individual is on a ship with a 1200 PSIsteam plant
-Individual is not on a ship with a 600PSI steam plant
-Individual is on a ship with a 600 PSIsteam plant
•-Individual is not on a ship with adiesel plant
—Individual is on a ship with a dieselplant
•-Individual is not on a ship with a gasturbine plant
—Individual is on a ship with a gasturbine plant
59

AGE 1 (1940's)* —Individual is not on a ship com-missioned in the 1940's
1—Individual is on a ship commissionedin the 1940's
AGE 2 (1950's)* — Individual is not on a ship com-missioned in the 1950's
1—Individual is on a ship commissionedin the 19 50's
AGE 3 (1960 »s)* —Individual is not on a ship com-missioned in the 1960 's
1—Individual is on a ship homeportedin the 19 60's
AGE 4 (1970's)* —Individual is not on a ship com-missioned in the 1970 's
1—Individual is on a ship commissionedin the 1970's
LOCATION 1
(East Coast)
*
LOCATION 2
(West Coast)
*
—Individual is not assigned to aship hompeorted on the east coast
1—Individual is assigned to a shiphomeported on the east coast
—Individual is not on a ship home-ported on the west coast
1—Individual is on a ship homeportedon the west coast
LOCATION 3 (Overseas)* —Individual is not on a ship home-ported overseas
1—Individual is on a ship homeportedoverseas
LOCATION 4 (Hawaii)* —Individual is not on a ship home-ported in Hawaii
1—Individual is on a ship homeportedin Hawaii
The non-ship personnel are coded [0,0] as a dummy variable,
60

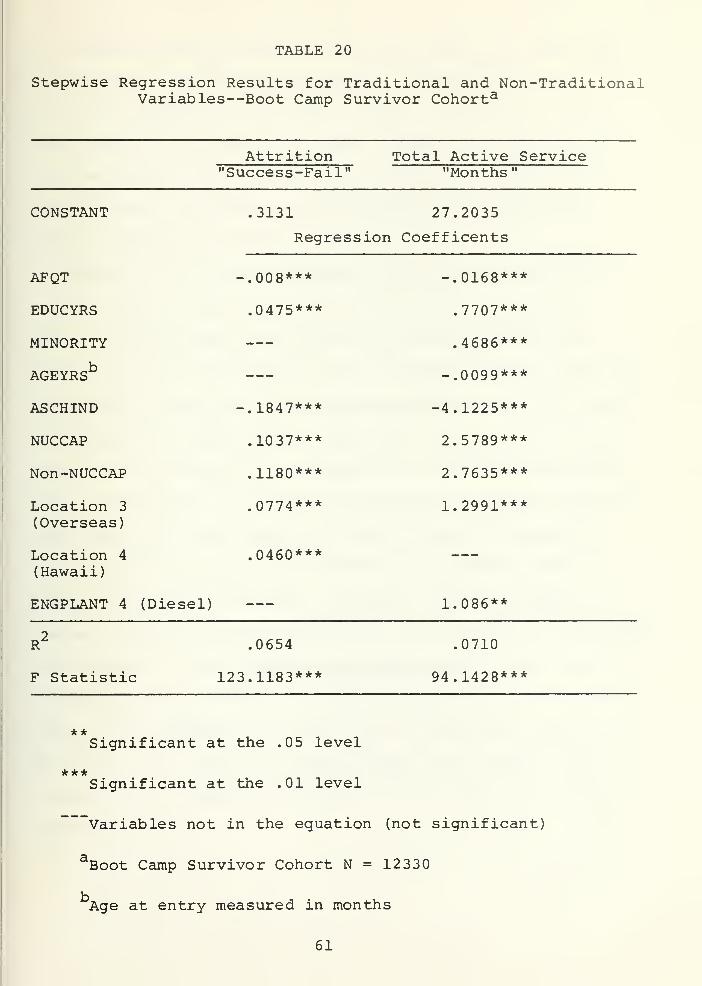
TABLE 20
Stepwise Regression Results for Traditional and Non-TraditionalVariables—Boot Camp Survivor Cohorta
Attrition"Success-Fail"
Total Active Service"Months
"
CONSTANT
AFQT
EDUCYRS
MINORITY
AGEYRSb
ASCHIND
NUCCAP
Non-NUCCAP
Location 3
(Overseas)
Location 4
(Hawaii)
ENGPLANT 4 (Diesel)
.3131 27.2035
Regression Coefficents
008***
0475***
1847***
1037***
1180***
0774***
0460***
-.0168***
.7707***
.4686***
-.0099***
-4.1225***
2.5789***
2.7635***
1.2991***
1.086**
F Statistic
.0654
123.1183***
.0710
94.1428***
**Significant at the .05 level
***Significant at the .01 level
Variables not in the equation (not significant;
Boot Camp Survivor Cohort N = 12330
Age at entry measured in months
61

in variance explained overthe BCS cohort (Table 18) was .008
for the total active service equation. The nuclear and
non-nuclear capability variables showed a significant posi-
tive effect in the equation. Both overseas and Hawaii loca-
tion assignments also had positive effects on expected sur-
vival. Diesel engineering plant entered the equation for
TAS at a significant level.
Finally, ship unique variables were evaluated as predic-
tors of attrition for the cohort of personnel assigned to
ships. The resultant attrition equations and related sta-
tistics are given in Table 22. The variables used in Table 22
are defined in Table 21. The variance explained by ship unique
variables was extremely small (.56% for survival and .78% for
total active services) . Assignment to an overseas homeported
ship, a submarine, or to ships with nuclear or diesel engineer-
ing plants, all had a positive effect on survival chances.
These results correspond with the data presented in the fre-
quency distribution analyses. Personnel who are assigned to
overseas duty are pre-screened prior to assignment in accordance
with Chapter 4 of the Enlisted Transfer Manual . This may be
responsible for the lower attrition rates experienced by that
group. It is important to note that the variables describing
ship size, age, active or reserve status, and nuclear capa-
bility were not significant enough to be entered into either
equation
.
62

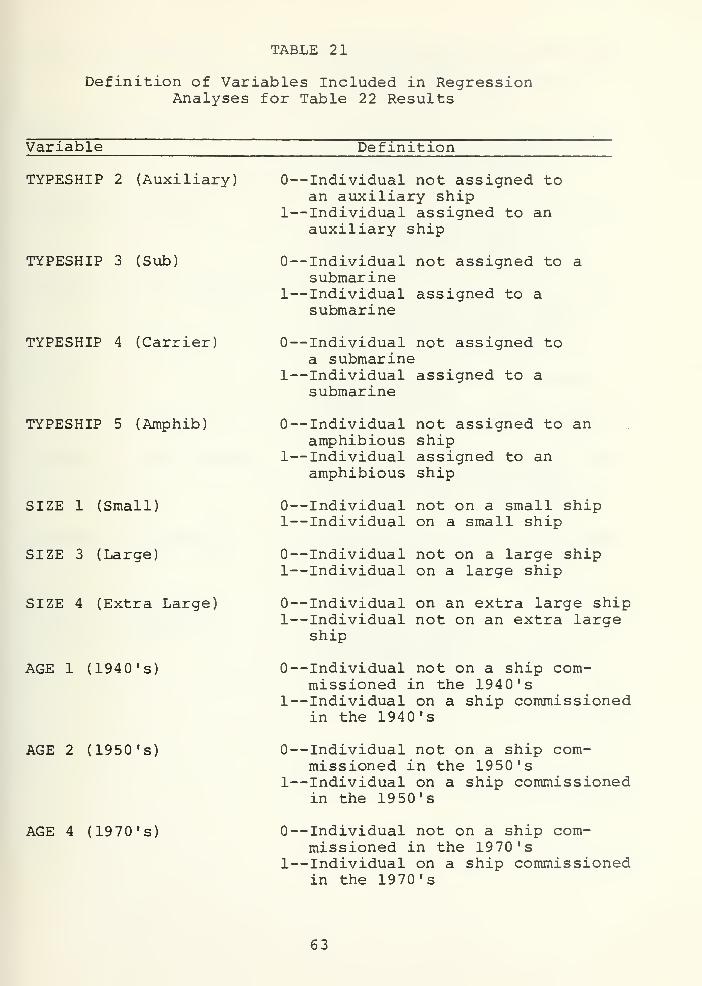
TABLE 21
Definition of Variables Included in RegressionAnalyses for Table 22 Results
Variable Definition
TYPESHIP 2 (Auxiliary)
TYPESHIP 3 (Sub)
—Individual not assigned toan auxiliary ship
1—Individual assigned to anauxiliary ship
—Individual not assigned to asubmarine
1—Individual assigned to asubmarine
TYPESHIP 4 (Carrier) —Individual not assigned toa submarine
1—Individual assigned to asubmarine
TYPESHIP 5 (Amphib)
SIZE 1 (Small)
SIZE 3 (Large)
SIZE 4 (Extra Large)
AGE 1 (1940's)
— Individual not assigned to anamphibious ship
1— Individual assigned to anamphibious ship
—Individual not on a small ship1—Individual on a small ship
—Individual not on a large ship1—Individual on a large ship
—Individual on an extra large ship1—Individual not on an extra large
ship
—Individual not on a ship com-missioned in the 194 0's
1—Individual on a ship commissionedin the 1940's
AGE 2 (1950's) — Individual not on a ship com-missioned in the 1950's
1—Individual on a ship commissionedin the 19 50's
AGE 4 (1970's) —Individual not on a ship com-missioned in the 1970 's
1—Individual on a ship commissionedin the 1970's
63


ENGPLANT 1 (Nuclear)
ENGPLANT 2 (1200 PSI)
ENGPLANT 4 (Diesel)
ENGPLANT 5 (Gas Turbine)
NUCCAP
LOCATION 2 (West Coast)
LOCATION 3 (Overseas)
LOCATION 4 (Hawaii)
—Individual not on a ship witha nuclear power plant
1—Individual on a ship with anuclear power plant
0--Individual not on a ship witha 1200 PSI steam plant
1—Individual on a ship with a1200 PSI steam plant
—Individual not on a ship witha diesel power plant
1—Individual on a ship with adiesel power plant
—Individual not on a ship witha gas turbine power plant
1—Individual on a ship with agas turbine power plant
— Individual not on a nuclearcapable ship
1—Individual on a nuclear capableship
—Individual not on a ship home-ported on the west coast
1—Individual on a ship home-ported on the west coast
— Individual not on a ship home-ported overseas
1—Individual on a ship home-ported overseas
—Individual not on a ship home-ported in Hawaii
1—Individual on a ship home-ported in Hawaii
64

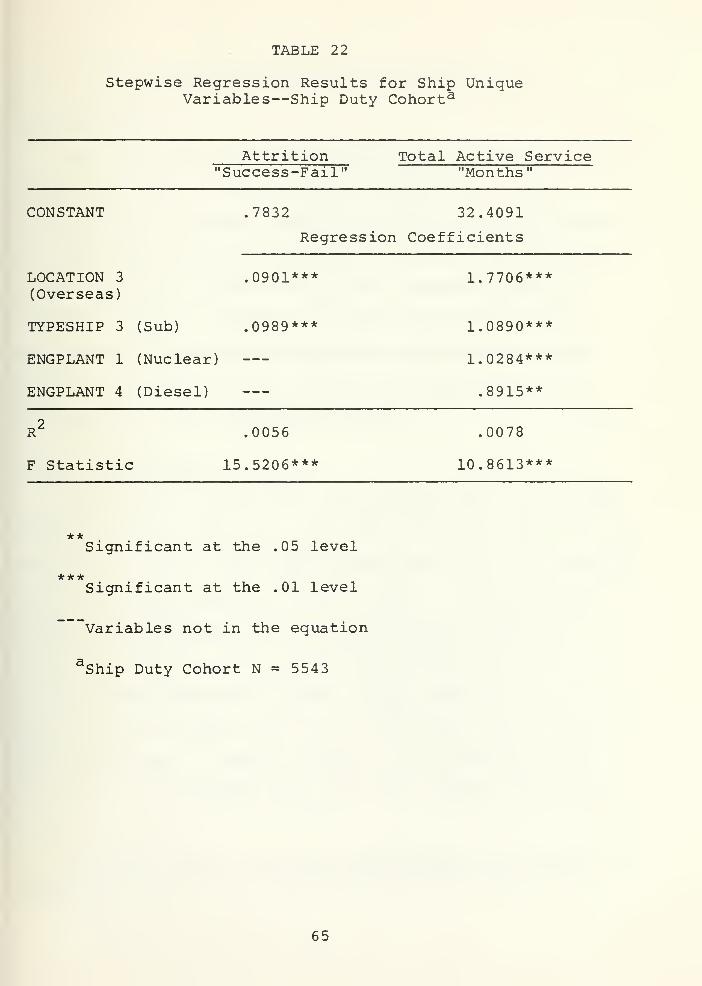
TABLE 22
Stepwise Regression Results for Ship UniqueVariables—Ship Duty Cohorta
Attrition"Success-Fail"
Total Active Service"Months"
CONSTANT
LOCATION 3
(Overseas)
TYPESHIP 3 (Sub)
ENGPLANT 1 (Nuclear)
ENGPLANT 4 (Diesel)
.7832 32.4091
Regression Coefficients
.0901***
.0989***
1.7706***
1.0890***
1.0284***
.8915**
F Statistic
.0056
15.5206***
.0078
10.8613***
**Significant at the .05 level
***Significant at the .01 level
Variables not in the equation
Ship Duty Cohort N = 5543
65

CONCLUSIONS AND RECOMMENDATIONS
INTRODUCTION.
This study had two primary objectives. The first was to
compare the characteristics and attrition rates of first
term personnel initially assigned to ships with those assigned
to other duty stations. The second objective was to evaluate
traditional (e.g., AFQT, age at entry, education) and non-
traditional (e.g., A-School training, duty assigned, home-
port variables as predictors of first term attrition, with
emphasis placed on variables which were ship unique (e.g.,
shiptype, age, size, engineering plant).
COHORT DISTRIBUTION
Overall, 4 5% of the cohort who survived their first three
months of active duty (Boot Camp Survivors—BCS) were initially
assigned to ships. The remaining personnel (55%) were assigned
to non-ship duty stations (Tables 6 and 7) . The ship duty
cohort did not include a representative mental group mix.
Only 17% of mental group I and 34.5% of mental group II
personnel were assigned to ships. Ships received 54% of the
mental group Ill-lower and 61.6% of the mental group IV-or
below personnel. Closely related to this finding was the
fact that ships received only 29% of the A-School graduates
The total cohort contained a small number of personnelwhose AFQT scores placed them below the mental group IVminimum.
66

in the cohort (Tables 8 and 9). Minorities (51% of the
minority personnel in the BCS cohort) and younger indi-
viduals—those who were 17 years old at active duty commence-
ment (48.9%) were also over represented in the ship duty
cohort. The under representation of upper mental group and
A-School trained personnel assigned to ship duty should be
thoroughly investigated to determine the causes and justi-
fications for this assignment practice.
COHORT ATTRITION
Blacks as a group had greater attrition (8.8%) than did
whites (6.8%) and others (5.6%) in the first three months
of service. Blacks had lower attrition rates than Caucasians
in both ship and non-ship duty cohorts from the fourth month
until 1 July 198 0, when tracking for this thesis was ter-
minated. The breakdown of the racial group "Other" for
Hispanic and Filipino categories yielded several noteworthy
facts. Hispanics did better than average in surviving their
first three months of service. However, Hispanics had the
highest (31%) attrition rate for the non-ship duty cohort
while the attrition rate for Hispanics assigned to the ship
duty cohort was equal to the average of the entire ship duty
cohort.
The Filipino members (N = 274, or 2% of the total cohort),
had the lowest attrition rate for any group of individuals
throughout the study. Their initial three month loss rate
was one third of the total cohort average, and their ship and
67

non-ship duty losses were one fourth and one sixth, respec-
tively, of those cohorts/ average losses. The combining
of the "Black" and "Other" racial groups into a "minority"
category is therefore likely to misrepresent the attrition
rates for the separate minority groups.
Attrition rate had an inverse relationship with mental
groupings, with the exception of the ship duty cohort. Mental
group I had the highest attrition rate (24%) and mental group
IV had the lowest (14.6%) for personnel assigned to ships.
Non-high school graduates had attrition rates twice as
great as high school graduates, repeating the results of pre-
vious researchers (Lockman, Smith and Kendall, Butcher).
The positive effect of A-School training was clearly evi-
dent for both ship and non-ship duty personnel. A-School
training increased the expected survival chances nearly 50%
for each group. GENDET attrition was nearly twice as high
for non-ship duty personnel than for their ship duty counter-
parts. This reinforces similar findings by Smith & Kendall
(1980) , and Butcher (1980)
.
Attrition broken down by ship unique variables (Table 13)_
indicated no differentiation in results for ship commissioning
age and nuclear capability. Submarines experienced an attri-
tion rate approximately one half that of other ship types.
This may be due to higher screening criteria for submarine
duty and the fact that sailors not making the grade aboard
submarines are often transferred to the surface fleet (Potter,
1980) . Smaller ships had a lower attrition rate than did
68

other ship sizes (Table 13) . Ships with diesel or nuclear
engineering plants had lower attrition rates than did steam
powered ships (Table 13) . An overseas or Hawaiian homeport
location was also conducive to survival in the Navy. Addi-
tional screening for overseas assignment is the likely cause
of the former, while sunny skies and sandy beaches, or the
difficulty in getting away, are the likely causes of the
latter. Individuals assigned to reserve ships had a slightly
higher propensity to attrite. As reserve ships do not make
the far ranging deployments the active forces ships do, first
termers expecting to see the world and experience the "Adven-
ture of the Navy" might be more inclined to terminate their
service. Overall, personnel assigned to ship duty had an
attrition rate (19.9%) which was approximately 20% less than
individuals assigned non-ship ship duty (25.6%). This finding
validates results reported by Smith and Kendall (1980)
.
Regression analyses results verified many of the intui-
tive conclusions drawn from the attrition tables. The tradi-
tional variable of years of education consistently had a posi-
tive impact on lowering attrition and increasing total active
service. AFQT and age at entry had relatively small effects
in the attrition equations. Minority status made a positive
contribution toward survival in the equations where "minority"
was included as a variable. That finding should be treated
carefully due to the divergent attrition rates (see Tables 11
and 12) experienced by various ethnic groups included within
"minority". Research keying on specific ethnic groups needs
69

to be performed to understand more fully the appropriateness
of the Navy's minority recruiting policies. The non-tradi-
tional variables of A-School attendance (or not) and initial
assignment to ship or non-ship duty clearly had a signifi-
cant impact in the regression equations presented. Every
effort should be made to send individuals to A-School train-
ing, and assignment to ships should be emphasized for first
term personnel
.
The impact of ship unique variables was given little
support by the regression analyses performed. Only five
variables (overseas and Hawaii homeport locations, submarines,
and nuclear and diesel engineering plants) out of twenty
four of the variables were significant enough to enter the
regression equations, and those variables explained very
little of the variance in the attrition rates. Logically,
there must be other variables which explain the positive
effect of ship duty on first term survival. Research to
identify those other variables seems highly warranted.
The Survival Tracking File (STF) data base has great
potential for further cohort analyses. In October of 1981, .
the first quarterly group of recruits with a complete data
history will be eligible for reenlistment . It is recommended
that the cohort be analyzed over the complete enlistment time
frame with emphasis placed on those personnel re-enlisting
and identification of variables which predict that action.
70

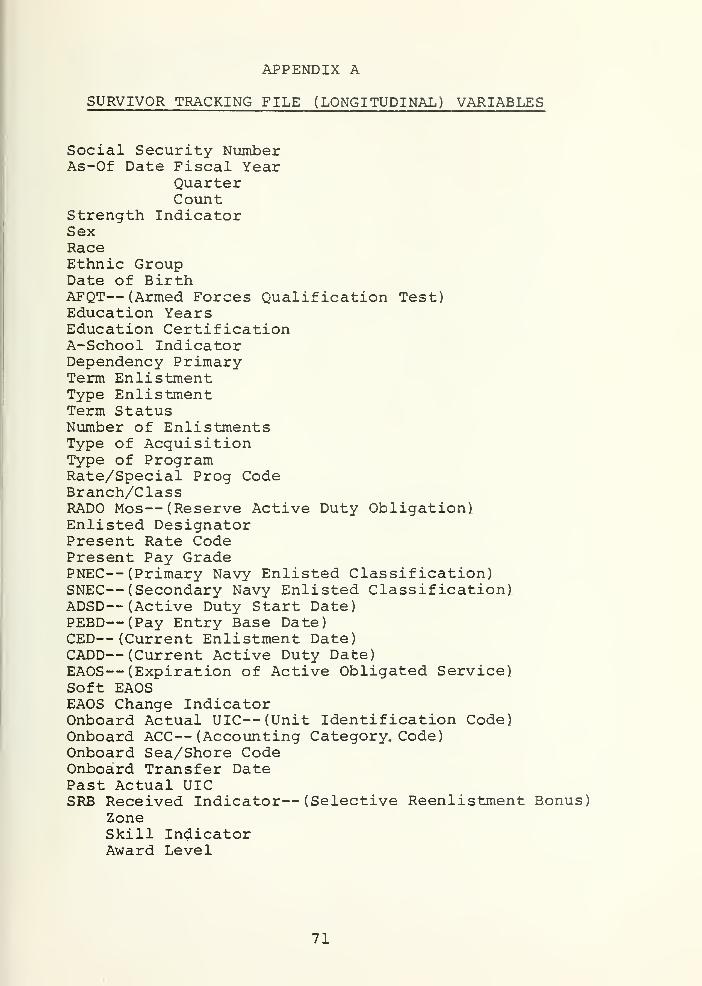
APPENDIX A
SURVIVOR TRACKING FILE (LONGITUDINAL) VARIABLES
Social Security NumberAs-Of Date Fiscal Year
QuarterCount
Strength IndicatorSexRaceEthnic GroupDate of BirthAFQT— (Armed Forces Qualification Test)Education YearsEducation CertificationA-School IndicatorDependency PrimaryTerm EnlistmentType EnlistmentTerm StatusNumber of EnlistmentsType of AcquisitionType of ProgramRate/Special Prog CodeBranch/ClassRADO Mos— (Reserve Active Duty Obligation).Enlisted DesignatorPresent Rate CodePresent Pay GradePNEC— (Primary Navy Enlisted Classification)SNEC— (Secondary Navy Enlisted Classification)ADSD— (Active Duty Start Date)PEBD— (Pay Entry Base Date)CED— (Current Enlistment Date)CADD— (Current Active Duty Date)EAOS— (Expiration of Active Obligated Service)Soft EAOSEAOS Change IndicatorOnboard Actual UIC— (Unit Identification Code)Onboard ACC— (Accounting Category. Code)Onboard Sea/Shore CodeOnboard Transfer DatePast Actual UICSRB Received Indicator— (Selective Reenlistment Bonus)
ZoneSkill IndicatorAward Level
71


RQC— (Recruit Quality Control Code)Loss Date of OccurrenceLoss Code NavyLoss Code DOD— (Department of Defense)
72

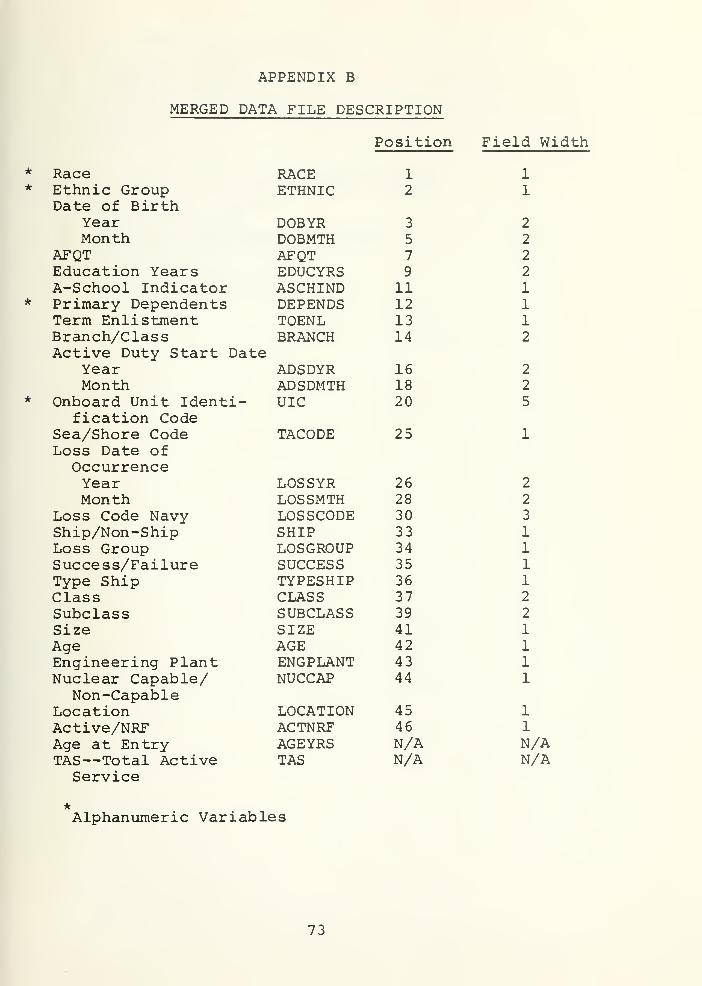
APPENDIX B
MERGED DATA FILE DESCRIPTION
RaceEthnic GroupDate of Birth
YearMonth
AFQTEducation YearsA-School IndicatorPrimary DependentsTerm EnlistmentBranch/ClassActive Duty Start Date
YearMonth
Onboard Unit Identi-fication Code
Sea/Shore CodeLoss Date ofOccurrenceYearMonth
Loss Code NavyShip/Non-ShipLoss GroupSuccess/FailureType ShipClassSubclassSizeAgeEngineering PlantNuclear Capable/
Non-CapableLocationActive/NRFAge at EntryTAS—Total Active
Service
Position
RACE 1
ETHNIC 2
DOBYR 3
DOBMTH 5
AFQT 7
EDUCYRS 9
ASCHIND 11DEPENDS 12TOENL 13BRANCH 14
ADSDYR 16ADSDMTH 18UIC 20
TACODE 25
LOSSYR 26LOSSMTH 28LOSSCODE 30SHIP 33LOSGROUP 34SUCCESS 35TYPESHIP 36CLASS 37SUBCLASS 39SIZE 41AGE 42ENGPLANT 43NUCCAP 44
LOCATION 45ACTNRF 46AGEYRS N/ATAS N/A
Field Width
1
1
2
2
2
2
1
11
2
2
2
5
2
2
3
1
1
1
1
2
2
1
1
1
1
1
1
N/AN/A
Alphanumeric Variables
73


A-School Indicator Codes (ASCHIND)
1. A-School graduates2
.
A-School dropout3. Currently in A-School4. Slated to attend A-School5. Striker6. General Detail
Sea/Shore Code or Type Activity Code (TACODE)
1. Shore duty—Conus2. Sea duty—Conus3. Arduous Shore duty = Sea Duty4. Sea duty—Overseas5
.
Neutral duty6. Shore duty overseas
74

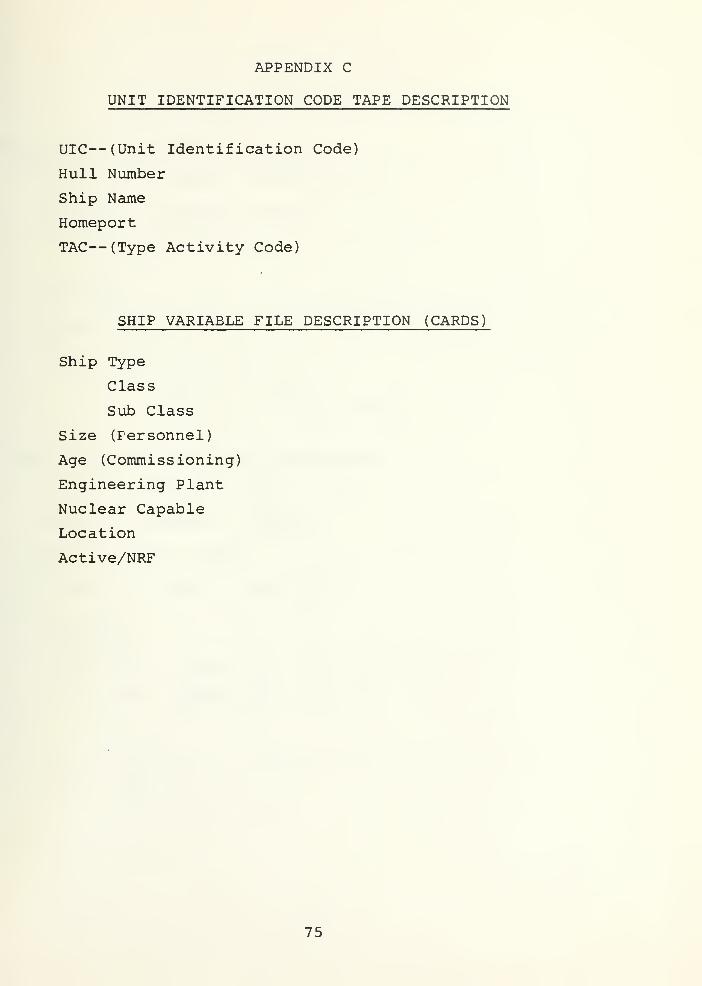
APPENDIX C
UNIT IDENTIFICATION CODE TAPE DESCRIPTION
UIC— (Unit Identification Code)
Hull Number
Ship Name
Homeport
TAC— (Type Activity Code)
SHIP VARIABLE FILE DESCRIPTION (CARDS)
Ship Type
Class
Sub Class
Size (Fersonnel)
Age (Commissioning)
Engineering Plant
Nuclear Capable
Location
Active/NRF
75

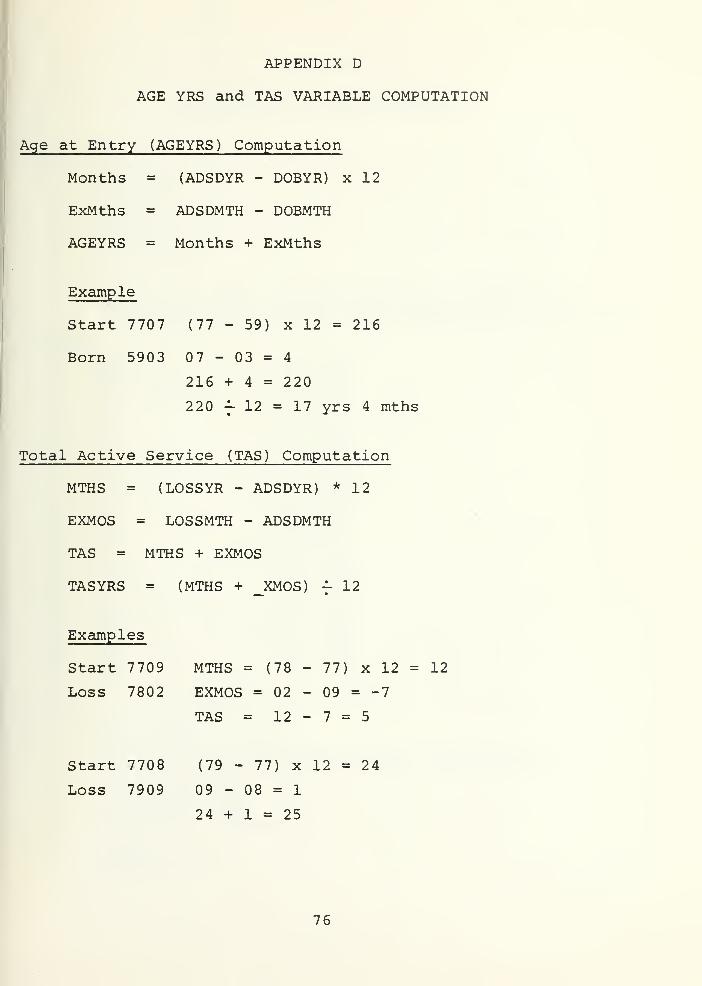
APPENDIX D
AGE YRS and TAS VARIABLE COMPUTATION
Age at Entry (AGEYRS) Computation
Months = (ADSDYR - DOBYR) x 12
ExMths = ADSDMTH - DOBMTH
AGEYRS = Months + ExMths
Example
Start 7707 (77 - 59) x 12 = 216
Born 5903 07 - 03 = 4
216 + 4 = 220
220 f 12 = 17 yrs 4 mths
Total Active Service (TAS) Computation
MTHS = (LOSSYR - ADSDYR) * 12
EXMOS = LOSSMTH - ADSDMTH
TAS = MTHS + EXMOS
TASYRS = (MTHS + _XMOS) -=- 12
Examples
Start 7709 MTHS = (78 - 77) x 12 = 12
Loss 7802 EXMOS = 02 - 09 = -7
TAS = 12 - 7 = 5
Start 7708 (79 - 77) x 12 = 24
Loss 7909 09 - 08 = 1
24 + 1 - 25
76

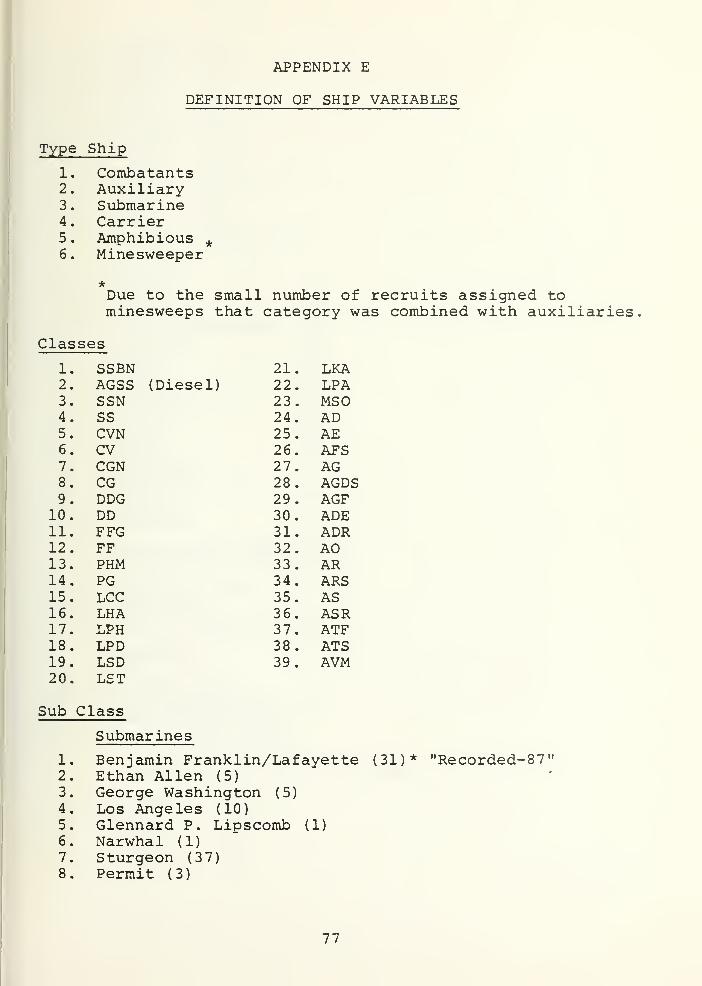
APPENDIX E
DEFINITION OF SHIP VARIABLES
Type Ship
1. Combatants2. Auxiliary3. Submarine4. Carrier5. Amphibious *6. Minesweeper
Due to the small number of recruits assigned tominesweeps that category was combined with auxiliaries
Classes
1. SSBN2. AGSS (Diesel)3. SSN4. SS5. CVN6. CV7. CGN8. CG9. DDG
10. DD11. FFG12. FF13. PHM14. PG15. LCC16. LHA17. LPH18. LPD19. LSD20. LST
Sub Class
21. LKA22. LPA23. MSO24. AD25. AE26. AFS27. AG28. AGDS29. AGF30. ADE31. ADR32. AO33. AR34. ARS35. AS36. ASR37. ATF38. ATS39. AVM
Submarines
1. Benjamin Franklin/Lafayette (31)* "Recorded-87"2. Ethan Allen (5)
3. George Washington (5)4. Los Angeles (10)5. Glennard P. Lipscomb (1)
6. Narwhal (1)7. Sturgeon (37)8. Permit (3)
77


9. Tullibee (1)
10. Skipjack (5)11. Halibut (1)
12. Triton (1)13. Skate (4)14. Seawolf (1)15. Nautilus (1)16. Barbel (3)17. Grayback (1)18. Darter (1)
19. Tang (3)20. Albacore (1)21. Dolphin (1)
Carriers
22. Nimitz (2)
23. Enterprise (1)
24. Kitty Hawk/Kennedy (4)
25. Forrestal (4)
26. Hancock (1)
27. Midway (2)
28. Virginia (3)
29. California (2)
30. Truxton (1)
31. Belknap (9)
32. Lechy (9)
33. Bainbridge (1)
34. Long Beach (1)
35. Albany (2)
36. Cleveland (1)
Guided Missile Destroyers
37. Charles F. Adams (23)38. Coontz (10)39. Forest Sherman
Destroyers
/Hull (4)
40. Spruance (14)41. Forest Sherman/Hull (14)42. Fram I-Gearing (26)43. Fram II-Carpenter (2)
Frigates/Guided Missile Frigates
44. Brooke (6)
45. Knox (46)46. Garcia (10)47. Glover (1)
48. Bronstein (2)
78


Hydrofoil
49. Pegasus (1)
Patrol Gunboat
50. Ashville (2)
Amphibious Command Ship
51. Blue Ridge (2)
Amphibious Assault Ship
52.53.
Tarawa (3)
Iwo Jima (7)
Amphibious Transport Dock Ship
54.55.
Austin (12)Raleigh (2)
Dock Landing Ship
56.57.
Anchorage (5)
Thomaston (8)
Tank Landing Ship
58. Newport (20)
Amphibious Cargo Ship
59.60.
Charleston (6)
Tulare (1)
Amphibious Transfer Ship
61. Paul Revere (2)
Ocean Minesweeper
62. Acme (2)63. Aggressive/Dash (23)
Destroyer Tender
64. Samuel Gompers (2)65. Klondike/Shenandoah (3)66. Dixie (5)
79

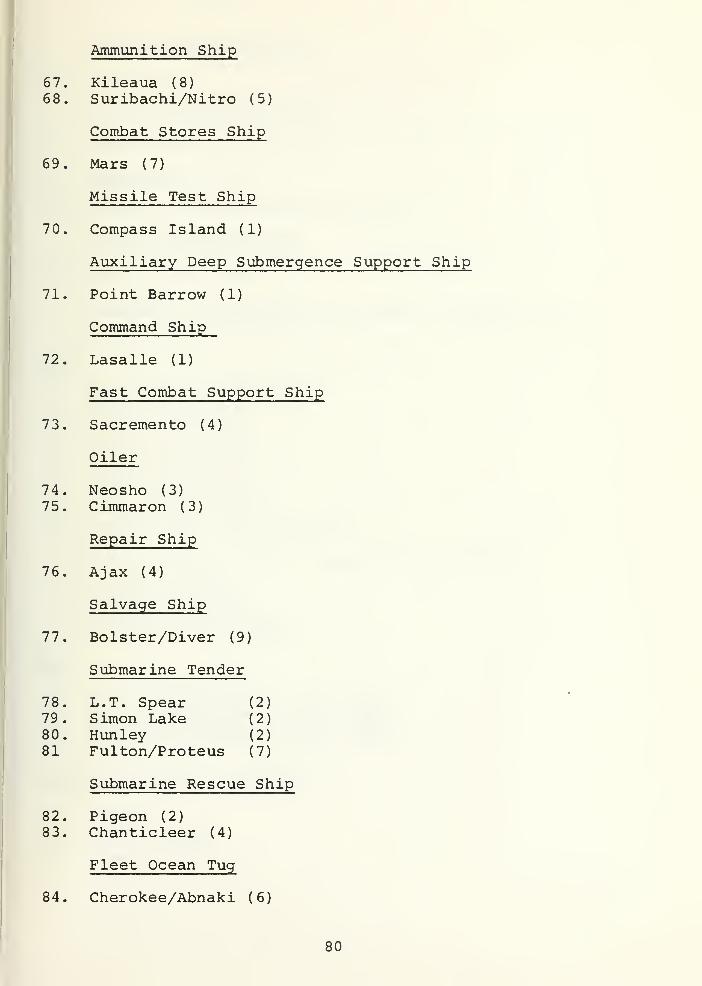
Ammunition Ship
67. Kileaua (8)
68. Suribachi/Nitro (5)
Combat Stores Ship
69. Mars (7)
Missile Test Ship
70. Compass Island (1)
Auxiliary Deep Submergence Support Ship
71. Point Barrow (1)
Command Ship
72. Lasalle (1)
Fast Combat Support Ship
73. Sacremento (4)
Oiler
74. Neosho (3)
75. Cimmaron (3)
Repair Ship
76. Ajax (4)
Salvage Ship
77. Bolster/Diver (9)
Submarine Tender
78. L.T. Spear (2)
79. Simon Lake (2)80. Hunley (2)81 Fulton/Proteus (7)
Submarine Rescue Ship
82. Pigeon (2)
83. Chanticleer (4)
Fleet Ocean Tug
84. Cherokee/Abnaki (6)
80

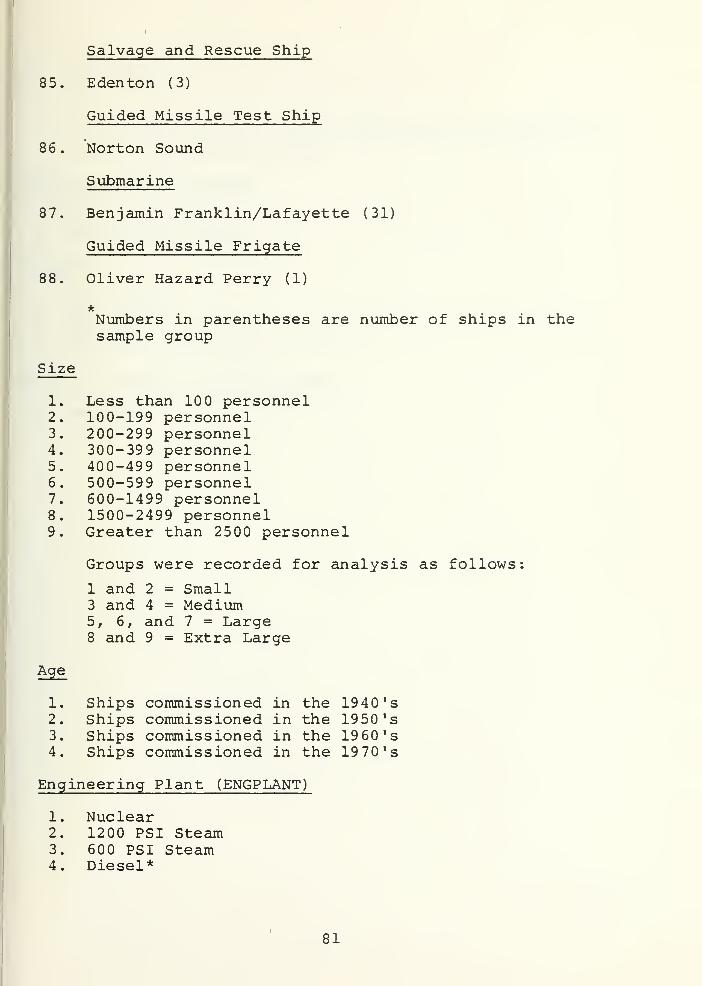
Salvage and Rescue Ship
85. Edenton (3)
Guided Missile Test Ship
86. Norton Sound
Submarine
87. Benjamin Franklin/Lafayette (31)
Guided Missile Frigate
88. Oliver Hazard Perry (1)
*Numbers in parentheses are number of ships in thesample group
Size
1. Less than 100 personnel2. 100-199 personnel3. 200-299 personnel4. 300-399 personnel5. 400-499 personnel6. 500-599 personnel7. 600-1499 personnel8. 1500-2499 personnel9. Greater than 2500 personnel
Groups were recorded for analysis as follows:
1 and 2 = Small3 and 4 = Medium5, 6, and 7 = Large8 and 9 = Extra Large
Age
1. Ships commissioned in the 1940 's
2. Ships commissioned in the 1950'
s
3. Ships commissioned in the 1960's4. Ships commissioned in the 19 70*s
Engineering Plant (ENGPLANT)
1. Nuclear2. 1200 PSI Steam3. 600 PSI Steam4. Diesel*
81


5. Diesel Electric6. Gas Turbine
*Due to the small number of recruits who were assigned inthe diesel electric category they were combined with thediesel group for analysis.
Nuclear Capable (NUCCAP)
1. Nuclear Capable2. Non-nuclear Capable
Location
1. East Coast2. West Coast3. Overseas (not including Hawaii)4. Hawaii
Active or Reserve Status (ACTNRF)
1. Reserve2. Active
82

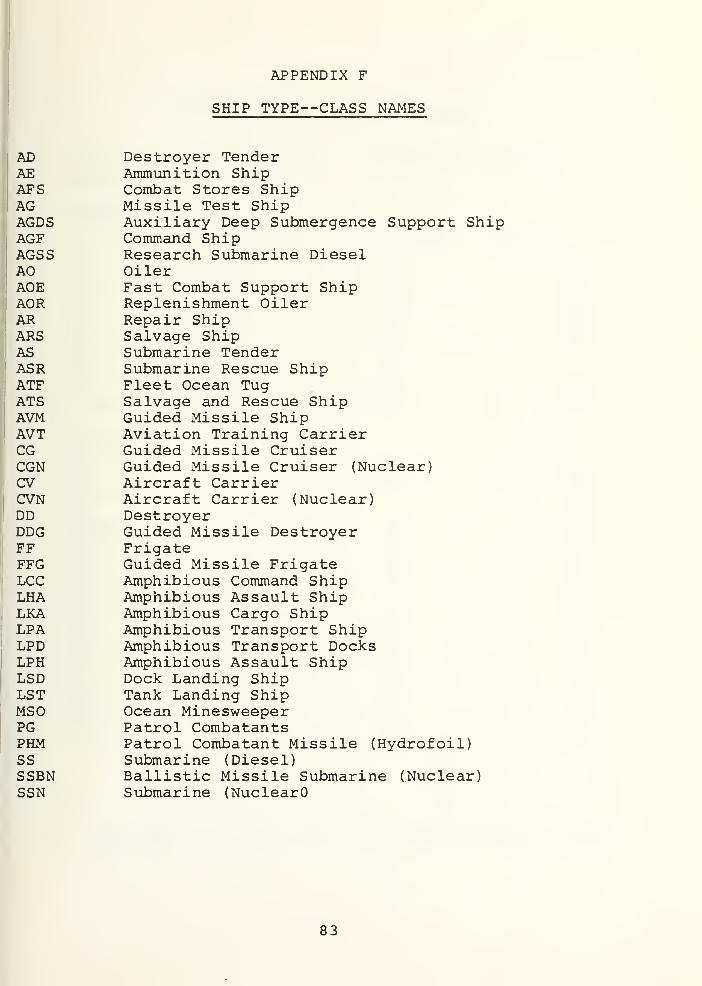
APPENDIX F
SHIP TYPE—CLASS NAMES
AD Destroyer TenderAE Ammunition ShipAFS Combat Stores ShipAG Missile Test ShipAGDS Auxiliary Deep Submergence Support ShipAGF Command ShipAGSS Research Submarine DieselAO OilerAOE Fast Combat Support ShipAOR Replenishment OilerAR Repair ShipARS Salvage ShipAS Submarine TenderASR Submarine Rescue ShipATF Fleet Ocean TugATS Salvage and Rescue ShipAVM Guided Missile ShipAVT Aviation Training CarrierCG Guided Missile CruiserCGN Guided Missile Cruiser (Nuclear)CV Aircraft CarrierCVN Aircraft Carrier (Nuclear)DD DestroyerDDG Guided Missile DestroyerFF FrigateFFG Guided Missile FrigateLCC Amphibious Command ShipLHA Amphibious Assault ShipLKA Amphibious Cargo ShipLPA Amphibious Transport ShipLPD Amphibious Transport DocksLPH Amphibious Assault ShipLSD Dock Landing ShipLST Tank Landing ShipMSO Ocean MinesweeperPG Patrol CombatantsPHM Patrol Combatant Missile (Hydrofoil)SS Submarine (Diesel)SSBN Ballistic Missile Submarine (Nuclear)SSN Submarine (NuclearO
83

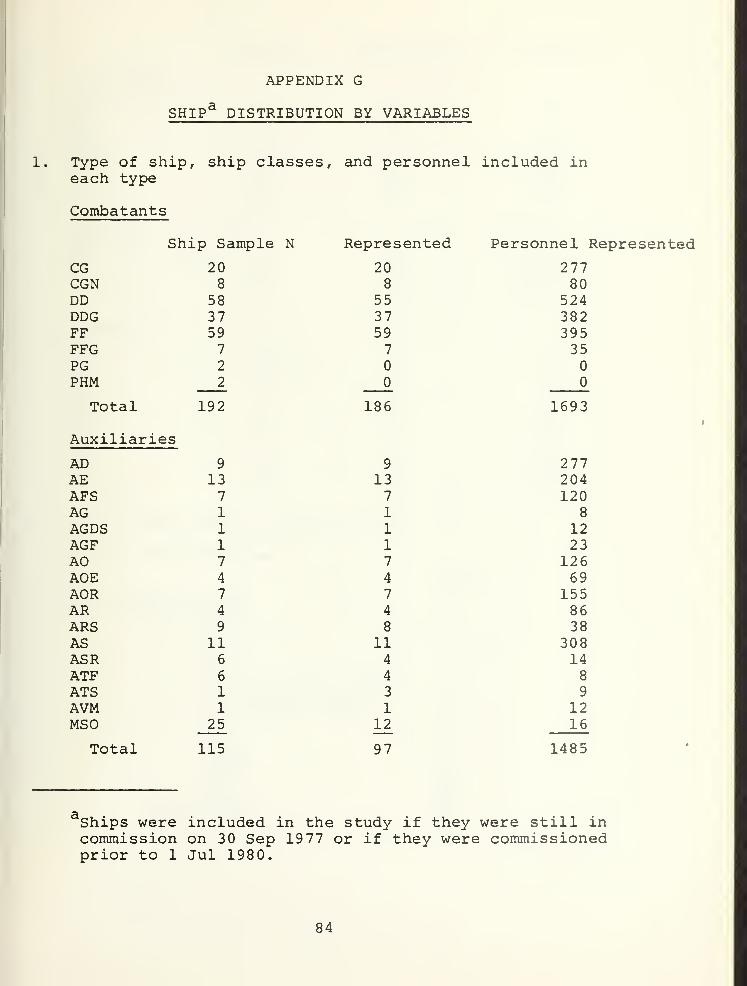
APPENDIX G
SHIPa DISTRIBUTION BY VARIABLES
1. Type of ship, ship classes, and personnel included ineach type
N
Combatants
Sh.Lp S<
CG 20CGN 8
DD 58DDG 37FF 59FFG 7
PG 2
PHM 2
Total 192
Auxiliaries
AD 9
AE 13AFS 7
AG 1
AGDS 1
AGF 1
AO 7
AOE 4
AOR 7
AR 4
ARS 9
AS 11ASR 6
ATF 6
ATS 1
AVM 1
MSO 25
presented Personnel Represented
20 2778 80
55 52437 38259 3957 35
186 1693
9 27713 2047 1201 8
1 121 237 1264 697 1554 868 38
11 3084 144 8
3 9
1 1212 _16
Total 115 97 1485
Ships were included in the study if they were still incommission on 30 Sep 1977 or if they were commissionedprior to 1 Jul 1980.
84

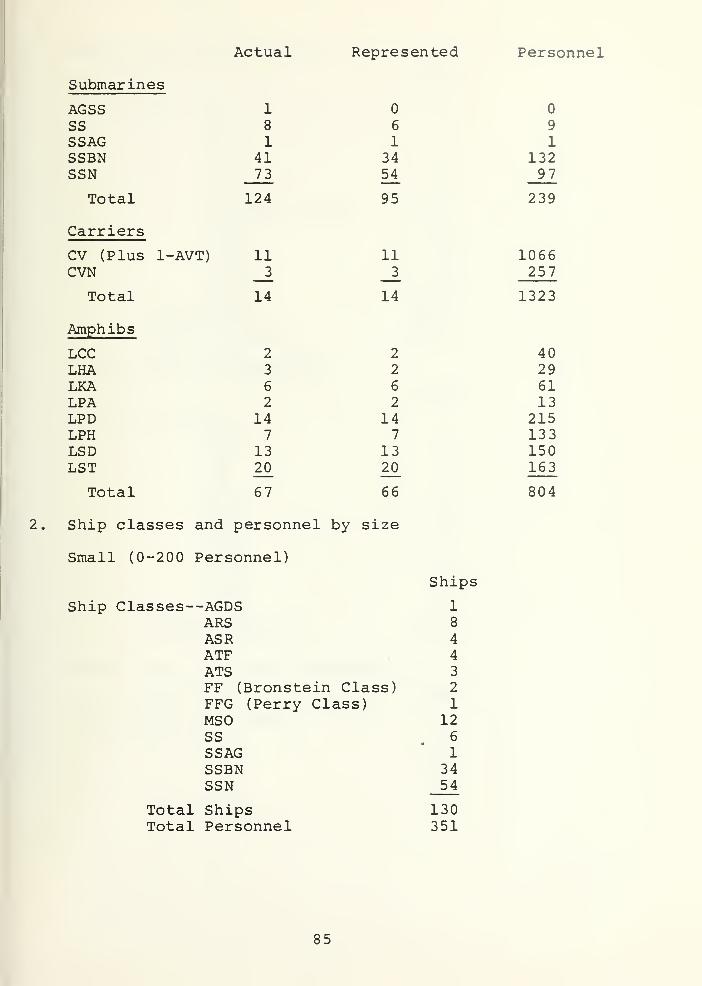
Actual Represented Personnel
Submarines
AGSS 1
SS 8
SSAG 1
SSBN 41SSN 73
Total 124
Carriers
CV (Plus 1-AVT) 11CVN _3
Total 14
Amphibs
LCC 2
LHA 3
LKA 6
LPA 2
LPD 14LPH 7
LSD 13LST 20_
Total 67
6
1
34
54_
95
11
_3_
14
2
2
6
2
147
1320
66
Ship classes and personnel by size
Small (0-200 Personnel)
Ships
Ship Classes—AGDS 1
ARS 8
ASR 4
ATF 4
ATS 3
FF (Bronstein Class) 2
FFG (Perry Class) 1
MSO 12SS 6
SSAG 1
SSBN 34SSN 54
Total Ships 130Total Personnel 351
9
1
13297
239
1066257
1323
40296113
215133150163
804
85

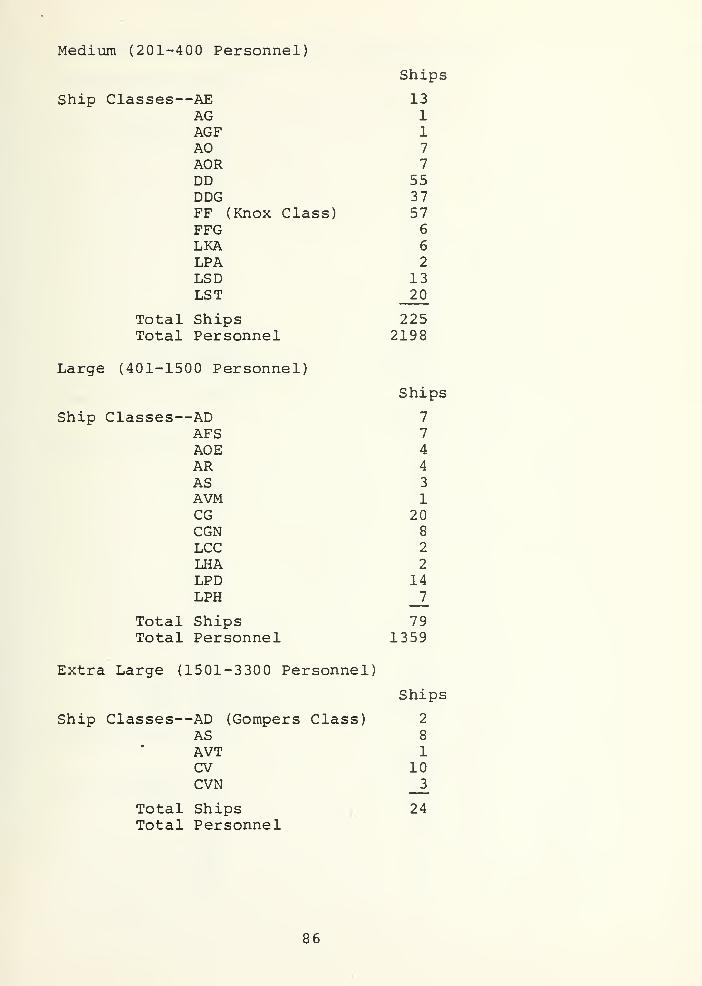
Medium (201-400 Personnel)
Large (401-1500 Personnel)
Ships
Ship Classes—AE 13AG 1
AGF 1
AO 7
AOR 7
DD 55DDG 37FF (Knox Class) 57FFG 6
LKA 6
LPA 2
LSD 13LST 20
Total Ships 225Total Personnel 2198
Ships
Ship Classes—AD 7
AFS 7
AOE 4
AR 4
AS 3
AVM 1
CG 20CGN 8
LCC 2
LHA 2
LPD 14LPH _7
Total Ships 79Total Personnel 1359
Extra Large (1501-3300 Personnel)
Ships
Ship Classes—AD (Gompers Class) 2
AS 8
AVT 1CV 10CVN 3
Total Ships 24Total Personnel
86

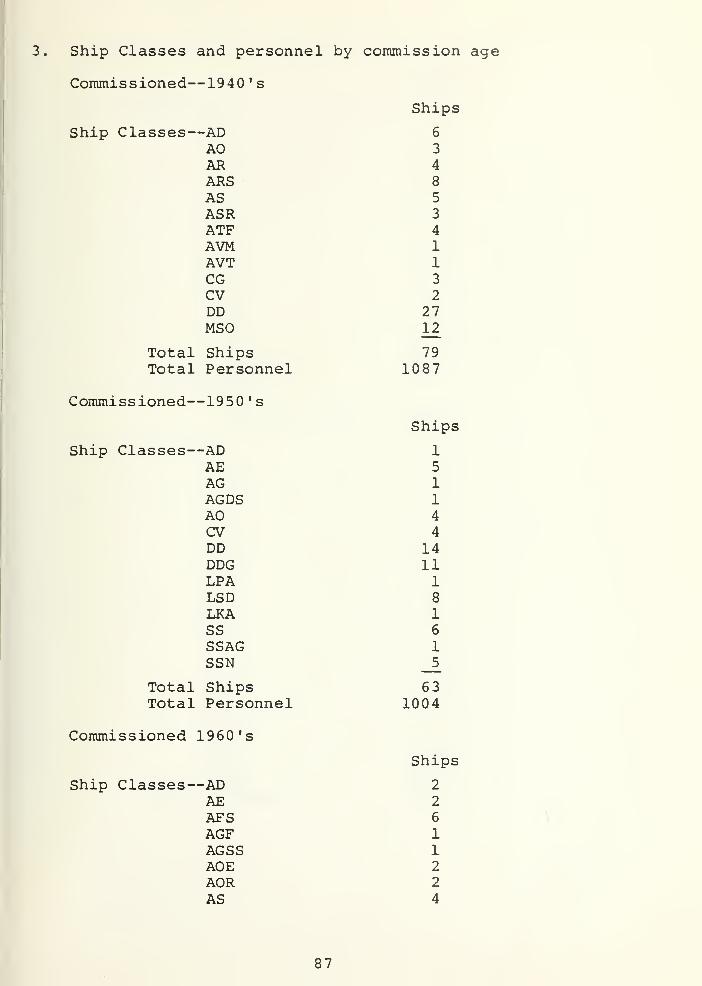
3. Ship Classes and personnel by commission age
Commissioned—1940 ' s
Ships
Ship Classes—AD 6
AO 3
AR 4
ARS 8
AS 5
ASR 3
ATF 4
AVM 1AVT 1
CG 3
CV 2
DD 27MSO 12
Total Ships 79Total Personnel 1087
Commissioned—1950 's
Ships
Ship Classes—AD 1
AE 5
AG 1AGDS 1
AO 4
CV 4
DD 14DDG 11LPA 1
LSD 8
LKA 1SS 6
SSAG 1SSN _5_
Total Ships 63Total Personnel 1004
Commissioned 1960's
Ships
Ship Classes—AD 2
AE 2
AFS 6
AGF 1AGSS 1AOE 2
AOR 2
AS 4
87

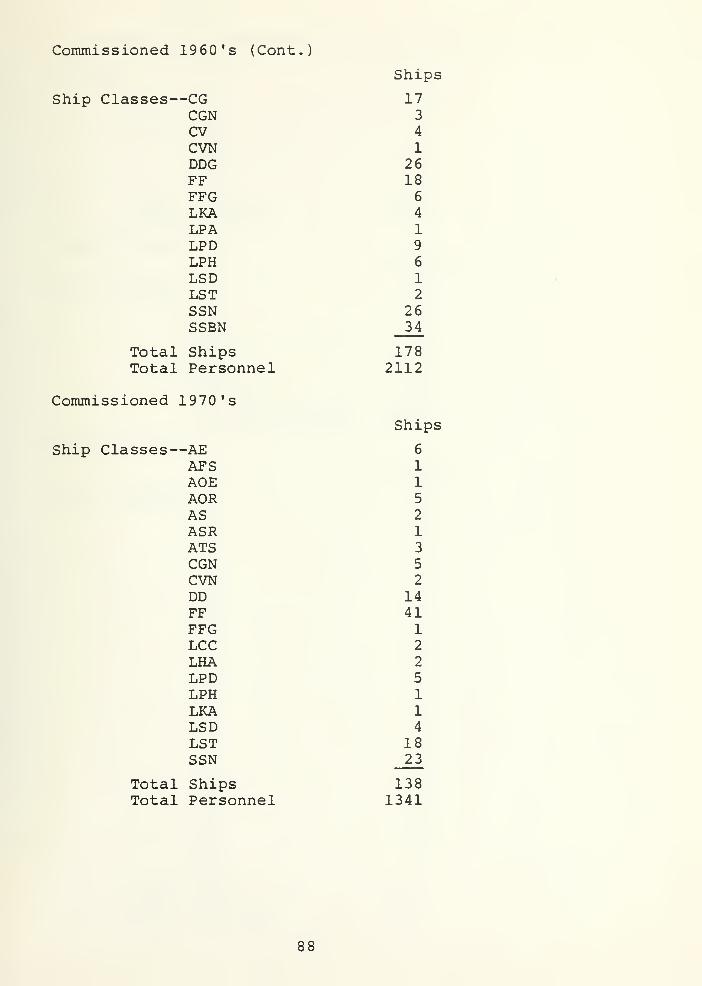
Commissioned 1960 's (Cont.)
Ships
Ship Classes—CG 17CGN 3
CV 4
CVN 1
DDG 26FF 18FFG 6
LKA 4
LPA 1
LPD 9
LPH 6
LSD 1
LST 2
SSN 26SSBN 34
Total Ships 178Total Personnel 2112
Commissioned 1970'
s
Ships
Ship Classes—AE 6
AFS 1
AOE 1
AOR 5
AS 2
ASR 1ATS 3
CGN 5
CVN 2
DD 14FF 41FFG 1
LCC 2
LHA 2
LPD 5
LPH 1
LKA 1LSD 4
LST 18SSN 23
Total Ships 138Total Personnel 1341
88

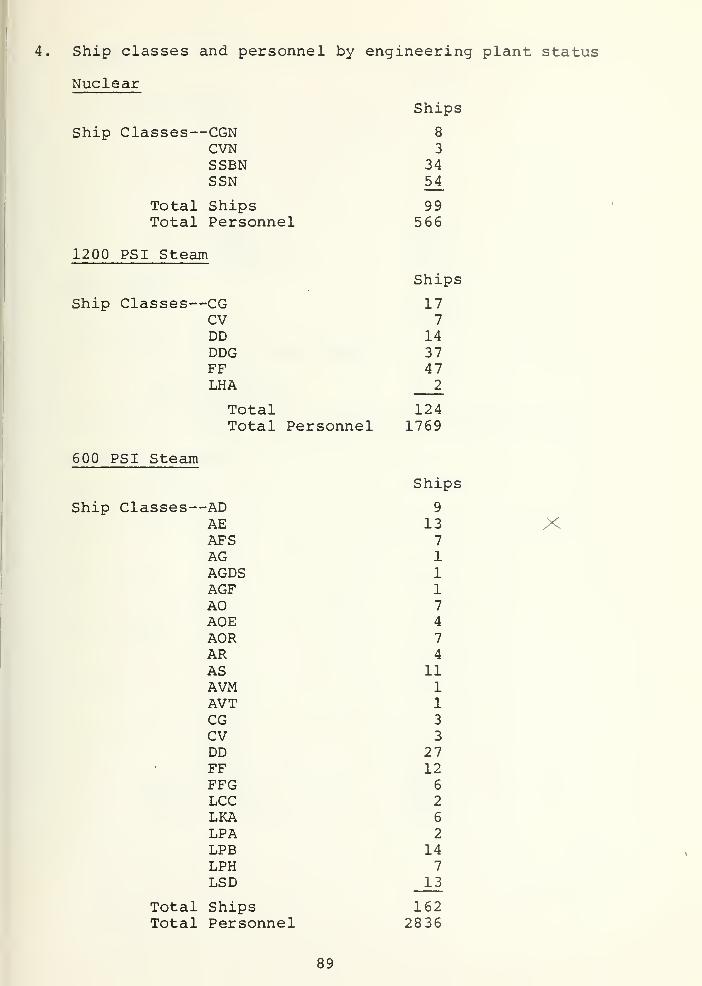
4. Ship classes and personnel by engineering plant status
Nuclear
Ships
Ship Classes—CGNCVNSSBNSSN
Total ShipsTotal Personnel
1200 PSI Steam
Ship Classes—ADAEAFSAGAGDSAGFAOAOEAORARASAVMAVTCGCVDDFFFFGLCCLKALPALPBLPHLSD
Total ShipsTotal Personnel
8
3
3454
99566
Shi
Ship Classes--CG 17CV 7
DD 14DDG 37FF 47LHA 2
Total 124Total Personnel 1769
600 PSI Steam
Ships
9
137
1
1
17
4
7
4
111
13
3
27126
2
6
2
147
13
X
1622836
89

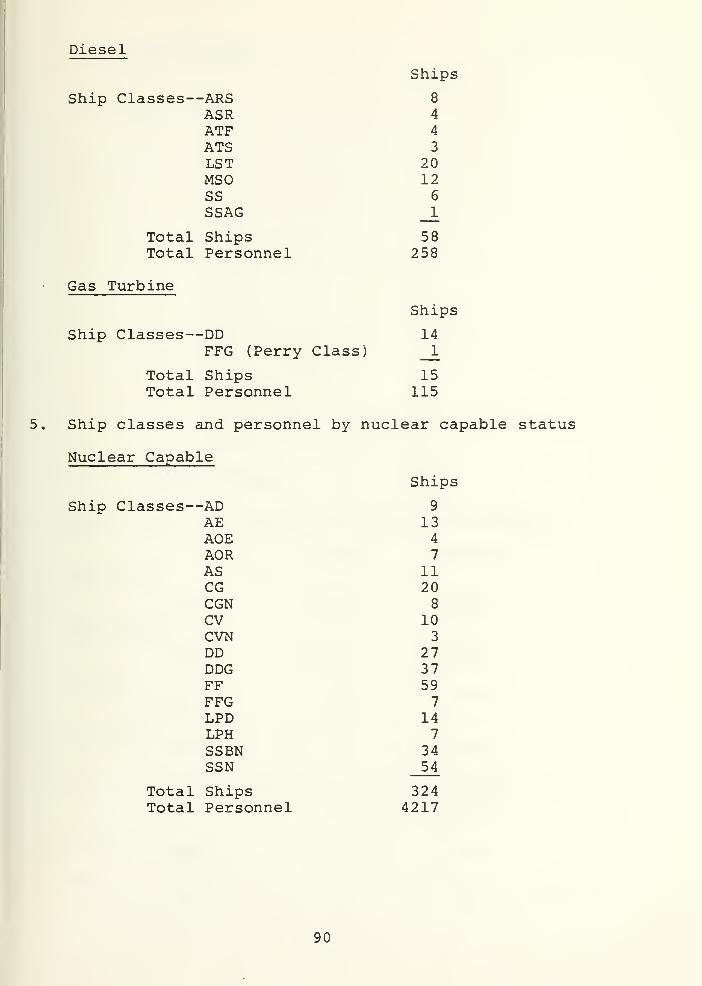
Diesel
Ships
Ship Classes—ARS 8
ASR 4
ATF 4
ATS 3
LST 20MSO 12SS 6
SSAG 1
Total Ships 58Total Personnel 258
Gas Turbine
Ships
Ship Classes—DD 14FFG (Perry Class) 1
Total Ships 15Total Personnel 115
5. Ship classes and personnel by nuclear capable status
Nuclear Capable
Ships
Ship Classes—AD 9
AE 13AOE 4
AOR 7
AS 11CG 20CGN 8
CV 10CVN 3
DD 27DDG 37FF 59FFG 7
LPD 14LPH 7
SSBN 34SSN 54
Total Ships 324Total Personnel 4217
90

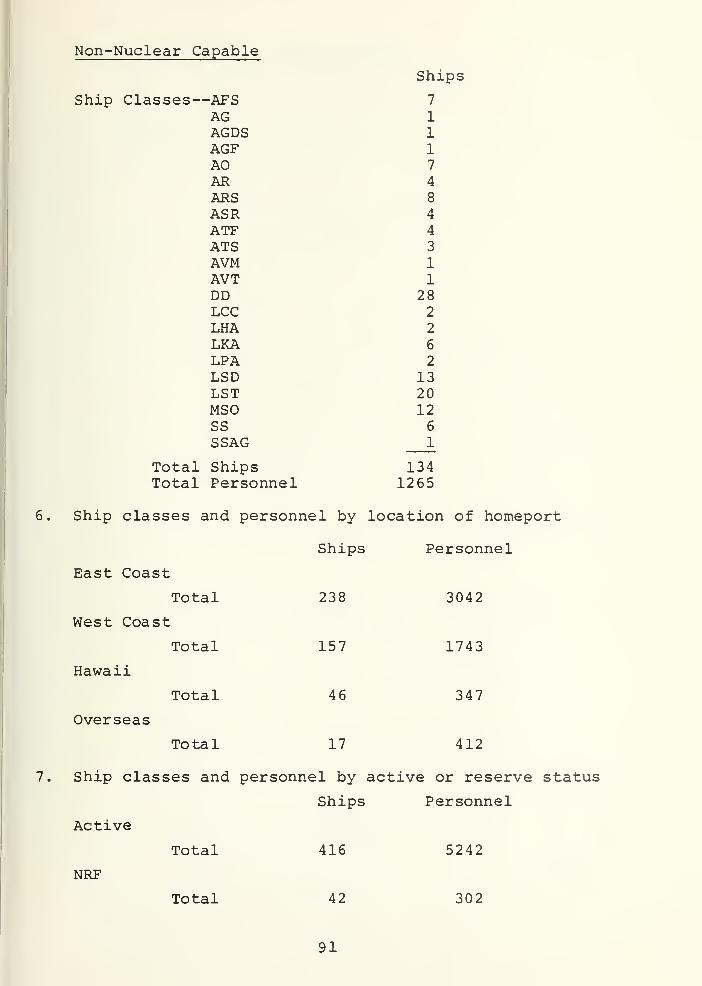
Non-Nuclear Capable
Ships
Ship Classes—AFS 7
AG 1
AGDS 1
AGF 1
AO 7
AR 4
ARS 8
ASR 4
ATF 4
ATS 3
AVM 1
AVT 1
DD 28LCC 2
LHA 2
LKA 6
LPA 2
LSD 13LST 20MSO 12SS 6
SSAG 1
Total Ships 134Total Personnel 1265
6. Ship classes and personnel by location of homeport
Ships Personnel
East Coast
Total 238 3042
West Coast
Total 157 1743
Hawaii
Total 46 347
Overseas
Total 17 412
7. Ship classes and personnel by active or reserve status
Ships Personnel
Active
Total 416 5242
NRF
Total 42 302
91


Naval Reserve Fleet (NRF) Classes
ATF mm _
_
2
DD — 27LPA — 2
LST — 2
MSO — 9
92

LIST OF REFERENCES
America's Volunteers: A Report on the All-Volunteer ArmedForces , Office of the Assistant Secretary of Defense(Manpower, Reserve Affairs, and Logistics). Washington,D.C.: December, 1978.
Borack, J.I. & K.W. Gay. The Enlisted Survival Tracking File(STF) (NPRDC TR 81-Unpublished-Report in Progress) . SanDiego, CA. : Naval Personnel Research and DevelopmentCenter.
Bowler, R.T. Where did all the young men go? U.S. NavalInstitute Proceedings . 1977, 103, 99-101.
Butcher, M.E. Attrition of PMU Personnel Compared to Attritionfrom the U.S~. Navy Male Enlisted Population (M.S . Thesis) .
Monterey, CA. : Naval Postgraduate School, September 1980.
Grissmer, D.W. "The Supply of Enlisted Volunteers in thePost-Draft Environment: An Analysis Based on MonthlyData, 1970-1975." In R.V. Cooper (Ed.), Defense ManpowerPolicy: Presentations from the 1976 RAND Conference onDefense Manpower . Santa Monica, CA. : RAND 1979.
Guthrie, R.V., Lakota, R., & M. Matlock. Voluntary ReleaseProgram: Effects of Attrition of General Detail Personnel(NPRDC Tech Rep. 78-27). San Diego, CA.: Navy PersonnelResearch and Development Center, July 19 78.
Hoehn, A.J., Wilson, T.R., & J. A. Richards. Recruits ' MilitaryPreferences and Their Accommodation by the Military Services(AFHRL-TR-72-19) . Alexandria, VA. : Air Force HumanResources Laboratory—Manpower Development Division,March 19 72.
Jane's Fighting Ships . New York: Jane's Publishing CompanyLtd., 1980.
Lau, A.W. Personnel and Organizational Determinants of EnlistedAttrition (NPRDC Tech Rep. 79-11). San Diego, CA. : NavyPersonnel Research and Development Center, March 19 79.
Lockman, R.F. "A Model for Estimating Premature Losses."In R.V. Cooper (Ed.), Defense Manpower Policy: Presenta-tions from the 1976 RAND Conference on Defense Manpower .
Santa Monica, CA. : RAND, 1979.
McNemar, Q. Psychological Statistics (4th Ed.). New York:John Wiley and Sons, 1969.
93


Navy Enlisted Manpower and Personnel Classifications andOccupation Standards . (NAVPERS, 180680) Chief of NavalPersonnel. Washington, D.C.: September 19 75.
Navy Enlisted Transfer Manual . (NAVPERS 15909C) . NavyMilitary Personnel Command. Washington, D.C.: 1979.
Navy Recruiting Manual—Enlisted . (COMNAVCRUITCOMINST1130. 8B CH-9). Navy Recruiting Command. Arlington,Va.: 21 December 1979.
Nie, N.H., Hull, C.H., Jenkins, J.G., Steinbrenner , K. &
D.H. Bent. Statistical Package for the Social Sciences(2nd Ed.). New York: McGraw-Hill, 1975.
Plag, J.A. & J.M. Goffman. A Formula for Predicting Effective -
ness in the Navy from Characteristics of High SchoolStudents . San Diego, CA. : U.S. Navy Medical Neuro-psychiatry Research Unit, Report No. 66-7, 1966.
Sands, W.A. Development of a Revised Odds for Effectiveness(OFE) Table for Screening Male Applicants for Navy Enlist-ment . (NPRDC Tn 76-5.) San Diego, CA. : Navy PersonnelResearch and Development Center, April 1976.
Smith, J.U. & W.A. Kendall. Personal, Situational, andOrganizational Determinants of Navy Enlisted Attrition(M.S. Thesis). Monterey, Ca.: Naval Postgraduate School,June 1980.
Thomason, J.S. First-Term Survival and Reenlistment Chancesfor Navy Ratings and a Strategy for Their Use . (CRC 382.)Alexandria, Va.: Center for Naval Analyses, May 19 79.
94


REFERENCE NOTES
1
.
Lockman , R . F . CNA Attrition Studies; A Briefing Pre-sented to the Policy Review Group of the AttritionReduction Program . Center for Naval Analyses memorandum78-0054. Arlington, Va.: January 1978.
2. Potter, M. , Senior Chief. Personnel Communications,Enlisted Personnel Management Center (EPMAC) , NewOrleans, La.: December 1980.
95


INITIAL DISTRIBUTION LIST
No. Copies
1. Defense Technical Information Center 2
Cameron StationAlexandria, Virginia 22314
2. Defense Logistics Studies Information 2
ExchangeU.S. Army Logistics Management CenterFort Lee, Virginia 23801
3. Library, Code 0142 2
Naval Postgraduate SchoolMonterey, California 93940
4. Department Chairman, Code 54 1Department of Administrative SciencesNaval Postgraduate SchoolMonterey, California 93940
5. Professor Richard Elster, Code 54Ea 10Department of Administrative SciencesNaval Postgraduate SchoolMonterey, California 93940
6. Professor J. K. Arima, Code 54Aa 1
Department of Administrative SciencesNaval Postgraduate SchoolMonterey, California 93940
7. Office of the Secretary of Defense 1
Deputy Assistant Secretary of MilitaryPersonnel Policy
Director Accession PolicyThe PentagonWashington, D. C. 20301
8. Office of the Secretary of Defense 1
Deputy Assistant Secretary of MilitaryPersonnel Policy
Director Enlisted Personnel ManagementThe PentagonWashington, D. C. 20301
9. Assistant Secretary of the Navy 1
Manpower, Reserve Affairs and LogisticsThe PentagonWashington, D. C. 20350
96


10. Deputy Chief of Naval Operations(Manpower, Personnel and Training)Chief of Naval Personnel, OP-01, -11, -12,
-12B, -13, -135K, -15Arlington AnnexColumbia Pike and Arlington Ridge RoadArlington, Virginia 20370
11. Robert F. LockmanDirectorManpower Studies DivisionCenter for Naval Analyses2000 N. BeauregardAlexandria, VA 22311
i
12. LCDR Elizabeth B. SuttonNavy Recruiting Command4015 Wilson BoulevardArlington, Virginia 22203
13. LCDR Enrico A. RicciDefense Manpower Data CenterSuite 200550 Camino El EsteroMonterey, California 93940
14. Office of Naval ResearchAttn: Glenn L. Bryan, ONR 45BT 1, Rm 713800 N. Quincy St.Arlington, Virginia 22217
15. Martin F. Wiskoff, Code 310Navy Personnel Research and Development
CenterSan Diego, California 92152
16. H. Wallace SinaikoSmithsonian Institution801 North Pitt StreetAlexandria, VA 22314
17. Martin BinkinThe Brookings Institution1775 Massachusetts Avenue, N.W.Washington, D. C. 20036
18. LCDR Daniel E. Gardnerc/o LCDR Richard RobbinsOP 135COffice of the Chief of Naval OperationsWashington, D. C. 20370
97


19. Jules I. Borack, Code 30 3
Naval Personnel Research andDevelopment Center
San Diego, CA 92152
98


I
Thesis 190861GI85 Gardnerc.l The relationship of
initial assignment andpersonal backgroundvariables to f i rst
term enlisted attrition
from the Navy.

thesG185
The relationship of initial assignment a
3 2768 002 01047 2
DUDLEY KNOX LIBRARY