Embed Size (px)
Citation preview

Earnings Management and Overinvestment: Accrual-Based
versus Real Activities
Daniel A. Cohen and Paul ZarowinDaniel A. Cohen and Paul Zarowin
New York UniversityNew York University
November, 2009November, 2009

2
Purpose of paper
• examine how both real and accrual-based earnings management activities affect firms’ investment activities

3
Motivation
• dearth of evidence on how EM affects firms’ real activities
• Research on the consequences of EM has concentrated largely on announcement and post event stock market returns
Motivation, continued• earnings management may affect resource allocation by
causing firms to make suboptimal investment decisions• returns studies can only determine whether securities
are mispriced, which causes redistribution (between different groups of shareholders), but cannot assess affects on real firm decisions
• Because they affect the size of the pie, and not just its distribution, real decisions are likely more costly than share price effects.
4

2 recent papers
• Kedia and Philippon, 2008
• McNichols and Stubben, 2008
• Study real effects of EM
5

Kedia and Philippon, 2008
• SEC mandated restatement sample • overinvested (excess capexp) and
over hired during the EM period• subsequently underinvested and shed
employment• Their hypothesis: manipulating firms invest
and hire excessively to pool with better performing firms, in order to avoid detection
6

McNichols and Stubben 2008• 3 groups of firms that overstated earnings • investigated by the SEC for accounting • sued by their shareholders for accounting • restated their financial statements• Overinvested (excess capexp) during the misreporting
period• underinvested during post-event period• Their hypothesis: overinvestment is caused by the
misleading signals that the misstated information sends to both internal decision makers and external suppliers of capital.
7
2 recent papers, continued
• Both studies focus exclusively on accrual-based earnings management
• Small, event-based samples
• Extreme cases of earnings management
8
9
Our contribution
1. First study to examine economic consequences of real EM
2. Large sample, not event-based, not extreme earnings management: results can be generalized to wide population of firms

Our findings
• Both real and accrual EM firms overinvest in the years up to and including the period of high EM, and then underinvest
• Indicates that EM is associated with significant real effects
• Real EM firms overinvest more than accrual EM firms
• first evidence that real EM has important economic effects
10

11
Increased interest in real EM
• Recent increased interest in EM thru real activities manipulation
• Gunny 2006
• Roychowdhury 2006
• Zang 2006

Increased interest in real EM, continued
• Graham et al. (2005): managers prefer real earnings management activities compared to accrual-based earnings management.
• Real management activities can be indistinguishable from optimal business decisions.
• More difficult to detect.
12

13
Increased interest in real EM, continued
• Cohen et al. (2008): managers have shifted away from accrual to real earnings management in the post SOX period.
• Perhaps because of the need to avoid detection following highly publicized accounting scandals.

14
Related Literature – consequences of EM
• focus on stock price effects related to EM
• EM around specific corporate events: IPOs, SEOs, management buyouts, stock repurchases, stock for stock acquisitions
• how ex-ante EM relates to observed post event abnormal stock returns
• Rangan (1998) and Teoh et al. for SEO’s
• Teoh, Wong, and Rao (1998) for IPOs

Related Literature – consequences of EM, cont’d
• short-term capital market reactions around announcements of fraudulent reporting
• Foster (1979), Dechow, Sloan, and Sweeny (1996), Beneish (1997), and Palmrose, Richardson, and Scholz (2004)
• market reaction to disclosure of manipulation is on average negative, implying that investors were surprised and interpret these as negative news
15

16
Related literature: Studies of real earnings management
• Graham et al.’s survey (2005) - managers prefer real activities manipulation, over accruals manipulation, as a way to manage earnings.
• Several features of real earnings management:– Involve current or future cash flows– Cannot be made after the end of the fiscal period– Tougher to be challenged by auditors
• Managers may favor real EM strategies– Less regulatory scrutiny– Earlier actions to safeguard against future potential
accrual shortfalls
17
Real earnings management, cont’d• Roychowdhury (2006) - firms try to avoid losses 3
ways:
• (1) boosting sales through accelerating timing and/or generating additional unsustainable sales through increased price discounts or more lenient credit terms
• (2) overproducing and allocating more overhead to inventory and less to cost of goods sold
• (3) reducing aggregate discretionary expenses (R&D + advertising+ SG&A) to improve margins.
18
Real earnings management, cont’d
• Zang (2006) - analyzes the tradeoffs between accrual manipulations and real earnings management.
• shows that real manipulation is positively correlated with the costs of accrual manipulation
• accrual and real manipulations are negatively correlated
• Conclusion: managers treat the two strategies as substitutes.

Empirical methodology – Data and Initial Sample
• COMPUSTAT from 1987 to 2006, to use SFAS No. 95 SCF to estimate accruals, (Collins and Hribar, 2002)
• all nonfinancial firms with available data necessary to calculate the discretionary accruals metrics and real EM proxies for our analysis
• ≥ 8 observations in each 2-digit SIC grouping per year
• 82,039 firm-year observations19
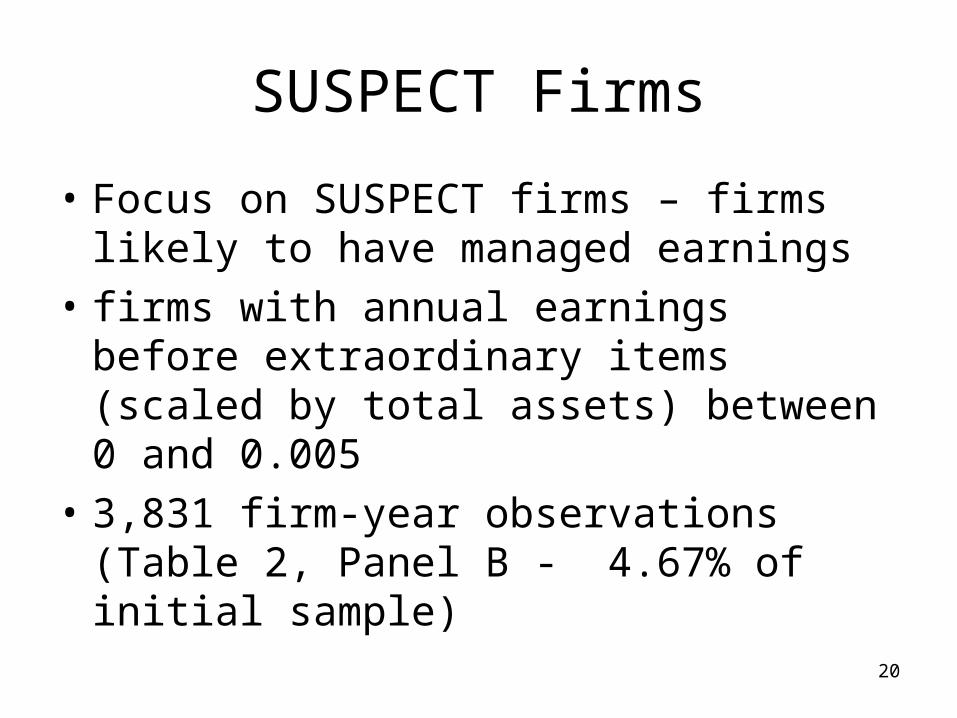
SUSPECT Firms
• Focus on SUSPECT firms – firms likely to have managed earnings
• firms with annual earnings before extraordinary items (scaled by total assets) between 0 and 0.005
• 3,831 firm-year observations (Table 2, Panel B - 4.67% of initial sample)
20
21
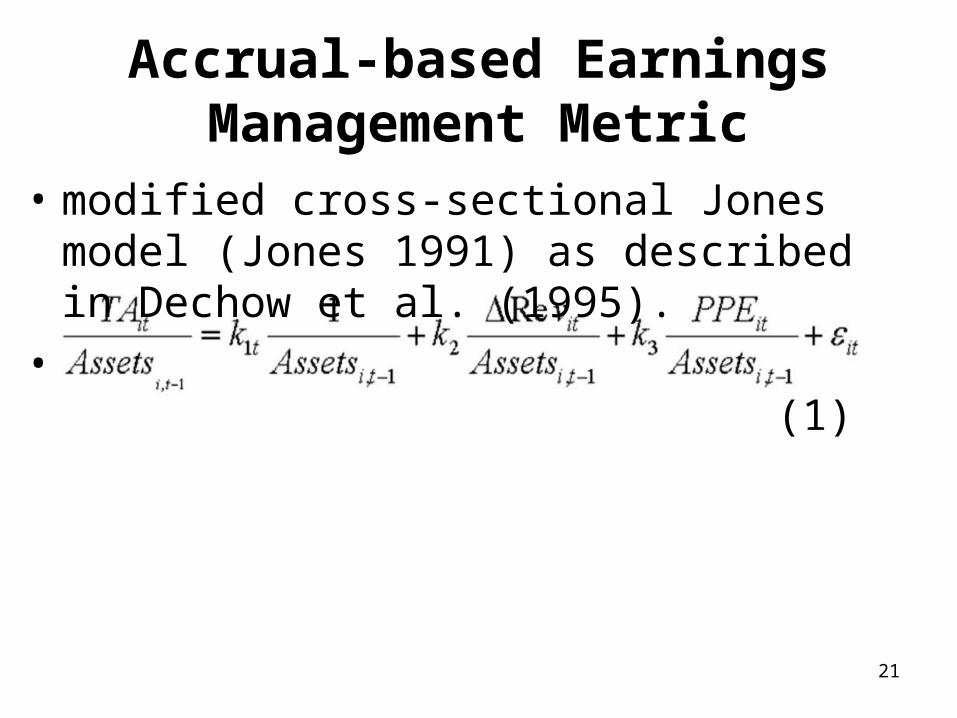
Accrual-based Earnings Management Metric
• modified cross-sectional Jones model (Jones 1991) as described in Dechow et al. (1995).
• (1)

22
Accrual model, cont’d
• where, for fiscal year t and firm i, TA represents total accruals:
• TA it = EBXI it – CFO it, • EBXI is earnings before extraordinary items and disc.
operations (annual Compustat 123) • CFO is operating cash flows (from continuing operations)
taken from the statement of cash flows (Compustat 308 – Compustat 124),
• Assetit-1 is total assets (Compustat 6), REVit is change in revenues (Compustat 12), and• PPEit is the gross value of property, plant and
equipment (Compustat 7).

23
Accrual model, cont’d
• cross-sectional model of discretionary accruals
• for each year we estimate the model for every 2-digit SIC code
• control for industry-wide changes in economic conditions that affect total accruals
• allows coefficients to vary across time

24
Accrual model, cont’d
• coefficient estimates from equation (1) are used to estimate the firm-specific normal accruals (NA it) for our sample firms:
• (2)
• discretionary accruals is the difference between total accruals and the fitted normal accruals, defined as:
• DAit = (TA it / Assetit-1) – NAit. • Accrual based earnings managers: top 10% of firm-year
DA observations each year (8,204 firm-year observations)

25
Real Earnings Management Metrics
• Based on Roychowdhury (2006), Zang (2006) and Gunny (2006)
• 3 metrics as proxies for real earnings management - abnormal levels of:
• CFO
• discretionary expenses
• production costs

26
3 real manipulation methods
• 1. Accelerate timing of sales by increased price discounts or more lenient credit terms.
• 2. Reporting of lower cost of goods sold through increased production.
• 3. Decreased discretionary expenses, such as advertising, R&D, and SG&A expenses.

27
Calculation of 3 metrics
• 1. ∆sales > 0 and ∆CFO < 0
• INCR_SALES&DECR_CFO
• 2. ∆COGS < 0 and ∆inventory > 0
• COGS_CUT&∆INV>0
• 3. 0 < EBDISXt < DISXt-1
• can show profits by cutting discretionary expenditures below last year’s amount
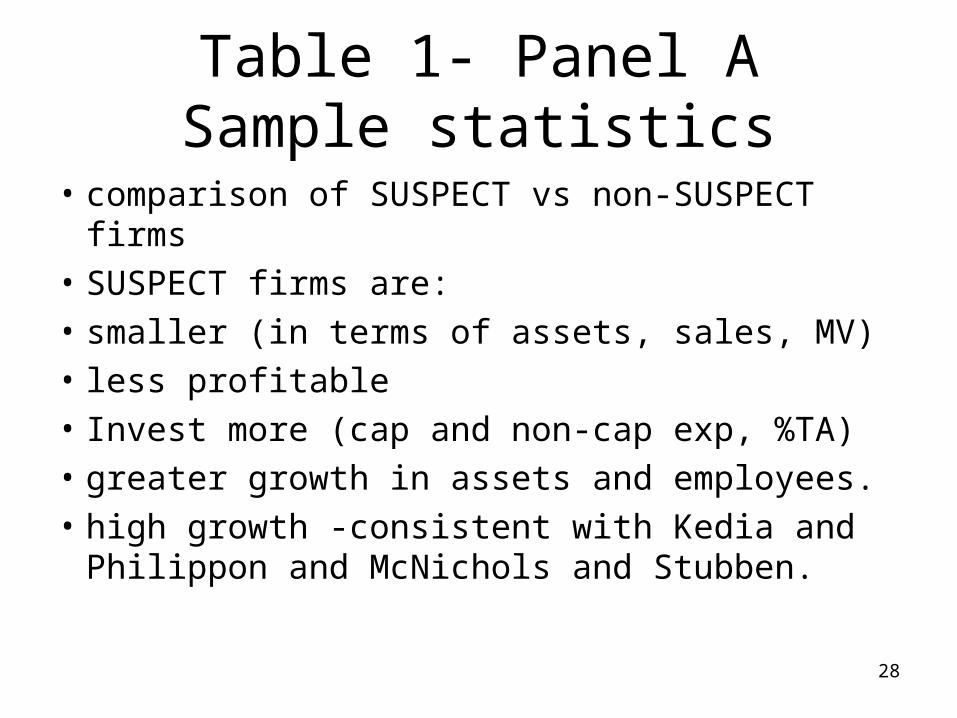
Table 1- Panel ASample statistics
• comparison of SUSPECT vs non-SUSPECT firms
• SUSPECT firms are: • smaller (in terms of assets, sales, MV) • less profitable • Invest more (cap and non-cap exp, %TA) • greater growth in assets and employees. • high growth -consistent with Kedia and
Philippon and McNichols and Stubben. 28

Table 1, Panel A: Comparison of Investment Activities and Earnings Management Strategies among
Different Group of Firms: SUSPECT vs. NON-SUSPECT Firms
29
SUSPECT FIRMS NON-SUSPECT DIFF. in
MEAN MEDIAN MEAN MEDIAN MEAN (t-stat.)
MEDIAN (z-stat.)
INVEST 0.231 0.184 0.143 0.094 0.088
(5.67)
0.090
(4.21)
CAPEX 0.364 0.248 0.284 0.173 0.080
(4.37)
0.075
(3.64)
NONCAPEX 0.081 0.076 0.046 0.018 0.035
(3.04)
0.058
(4.32)
GROW 0.089 0.064 0.064 0.053 0.025
(4.51)
0.011
(5.49)
EMPL 0.051 0.042 0.034 0.027 0.017
(2.86)
0.015
(2.15)
Total Accruals
($Million)
-91.371 -9.643 -72.39 -6.324 -18.981
(-8.37)
-3.319
(-6.81)
CFO ($Million) 85.694 7.742 152.312 13.264 -66.618
(-6.81)
-5.522
(-9.37)
Total Assets 1357.341 264.371 1423.231 176.341 -65.890
(-5.14)
88.03
(4.53)
MVE 763.491 86.374 1634.218 203.054 -870.727
(-11.37)
-116.68
(-8.17)
Sales 1432.697 267.153 1543.141 295.327 -110.444
(-7.68)
-28.174
(-4.06)
ROA 0.031 0.043 0.087 0.064 -0.056
(-3.16)
-0.021
(-4.67)

Table 1 - Panel B sample distribution
• Firms using real earnings management:
• 2,000 – 2,600 observations (2.5% - 3.2% of initial sample)
30

Focus: 4 subgroups• intersection of SUSPECT and earnings
management
• firms likely to have managed earnings
• we can identify the method of earnings management
• Thus, we can calculate the relation between the method and the extent of over- or under investment.
31

4 subgroups, cont’d
• All 4 subgroups have similar number of observations (0.8% - 1.0% of sample)
• This gives us confidence that all four subgroups have comparable degrees of earnings management
32

Panel B: Sample Distribution
33
Number of Firm-Year Observations Percentage (%)
Overall Sample 82,039 100%
SUSPECT 3,831 4.67%
INCR_SALES&DECR_CFO 2,174 2.65%
COGS_CUT&∆INV>0 2,609 3.18%
0 < EBDISXt < DISXt-1 2,043 2.49%
DA 8,204 10%
SUSPECT &
INCR_SALES&DECR_CFO
673 0.82%
SUSPECT & COGS_CUT&∆INV>0 796 0.97%
SUSPECT & 0 < EBDISXt < DISXt-1 730 0.89%
SUSPECT & DA 755 0.92%

34
Table 2 - Investment behavior of SUSPECT firms
• investment for years t-3 thru t+3
• Investment relative to control groups of firms ranked by size and industry
• Results for total investment and its components, capital expenditures, and non-capital expenditures

35
Table 2, cont’d
• column 1: total investment• SUSPECT firms with overinvest during the period of upward
management, and then subsequently underinvest• Year 0: SUSPECT firms invest 1.9% more than comparable
firms, as a % of TA• year +1: invest 2.8% less• relative investment decline of 4.7% (of TA)• Columns 2, 3, and 4 (CAPEXP, non-CAPEXP, Employment) • Consistent with Kedia and Philippon and McNichols and
Stubben

Table 2: Investments Activities partitioned by Alternative Earnings Management Strategies throughout
Time among SUSPECT Firms
36

Table 3 - Investment behavior for different EM strategies
• investment for years t-3 thru t+3
• Investment relative to control groups of firms ranked by size and industry
• Results for total investment and its components, capital expenditures, and non-capital expenditures
37
Table 3, cont’d
• All strategies: overinvestment in the period up to and including EM year; subsequent underinvestment
• Panel A – high DA firms overinvest during the period upto and including the EM year, and then subsequently underinvest
• Panels B – D: same for real EM firms
• real EM firms have even greater over- and underinvestment than high DA firms
38
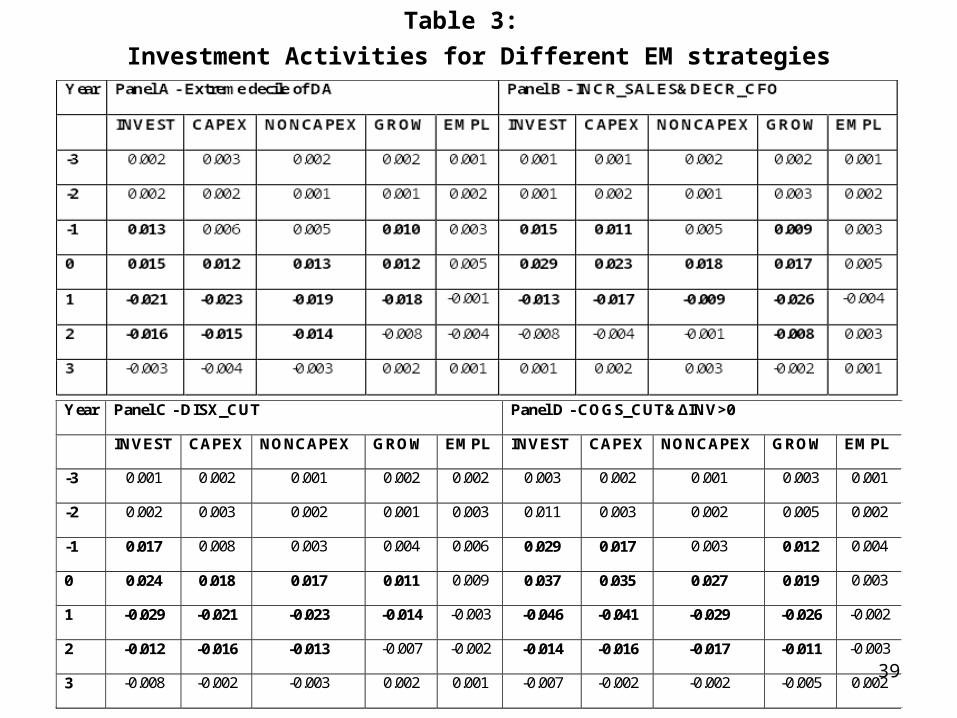
Table 3: Investment Activities for Different EM strategies
39
Year Panel C - DISX_CUT Panel D - COGS_CUT&∆INV>0
INVEST CAPEX NONCAPEX GROW EMPL INVEST CAPEX NONCAPEX GROW EMPL
-3 0.001 0.002 0.001 0.002 0.002 0.003 0.002 0.001 0.003 0.001
-2 0.002 0.003 0.002 0.001 0.003 0.011 0.003 0.002 0.005 0.002
-1 0.017 0.008 0.003 0.004 0.006 0.029 0.017 0.003 0.012 0.004
0 0.024 0.018 0.017 0.011 0.009 0.037 0.035 0.027 0.019 0.003
1 -0.029 -0.021 -0.023 -0.014 -0.003 -0.046 -0.041 -0.029 -0.026 -0.002
2 -0.012 -0.016 -0.013 -0.007 -0.002 -0.014 -0.016 -0.017 -0.011 -0.003
3 -0.008 -0.002 -0.003 0.002 0.001 -0.007 -0.002 -0.002 -0.005 0.002

Table 4 - Control for investment opportunities
• investment is a function of investment opportunities and liquidity
• Omitted factors may be correlated with measures of earnings management
• relation between investment and EM may be due to omitted factors
• i.e., excess investment might really be optimal given the firm’s opportunity set
40

Investment as a function of fundamentals and earnings
management• Insert equation (10) here
• Model based on Biddle, Hilary, and Verdi (2008)
• Augmented by SUSPECT, EM, and SUSPECT*EM
41
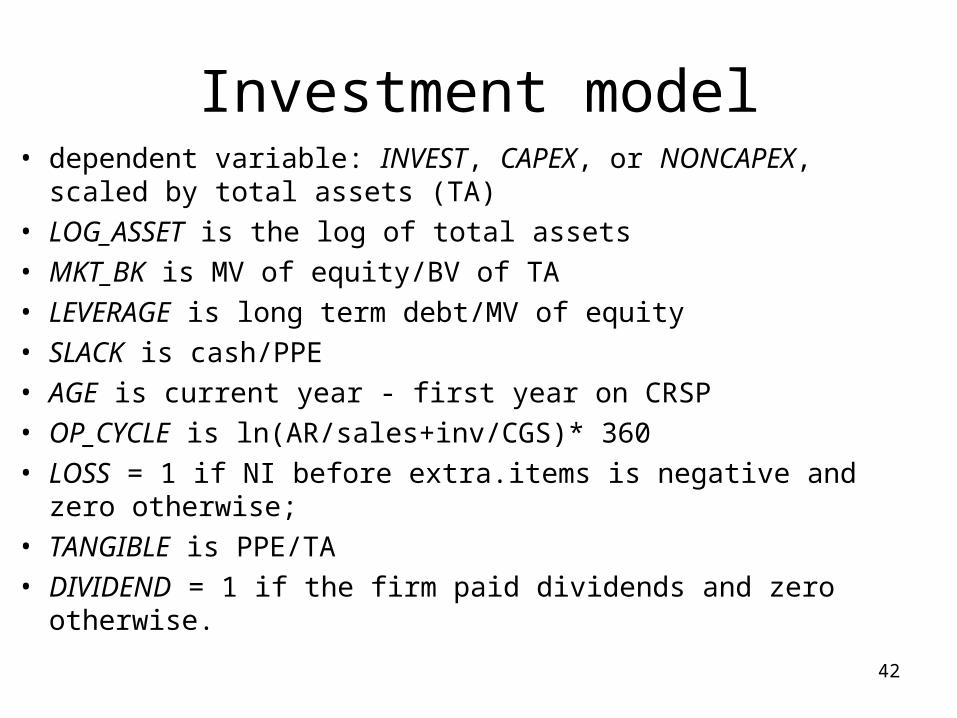
Investment model• dependent variable: INVEST, CAPEX, or NONCAPEX, scaled
by total assets (TA)
• LOG_ASSET is the log of total assets
• MKT_BK is MV of equity/BV of TA
• LEVERAGE is long term debt/MV of equity
• SLACK is cash/PPE
• AGE is current year - first year on CRSP
• OP_CYCLE is ln(AR/sales+inv/CGS)* 360
• LOSS = 1 if NI before extra.items is negative and zero otherwise;
• TANGIBLE is PPE/TA
• DIVIDEND = 1 if the firm paid dividends and zero otherwise.42
Table 4, Panel AResults of equation (10)
• Overall, the coefficients on the fundamentals are consistent with expectations, and equation (10) explains about 25% of the cross-firm variation in investment.
43

Focus on SUSPECT*EM• focus on firms most likely to have
managed earnings, but by different means
• coefficients on SUSPECT*EM capture the overinvestment for suspect firms differentiated by strategy
• enable us to compare the effects of different earnings management strategies on excess investment.
44
Results for SUSPECT*EM
• Table 4, Panel A• coefficients on all of the interaction terms
are significantly positive • shows that firms managing earnings by any
of the strategies overinvest• the coefficients on the real earnings
management interactions are two to four times as great as the coefficient on the accrual interaction
45

Table 4, Panel A, cont’d
• Firms increasing production to cut COGS have the greatest overinvestment: 14.2% of TA
• followed by firms cutting discretionary expenditures: 8.1%
• High DA firms - overinvestment of 3.1%
46

Table 4: Relation between Investments and Alternative Earnings Management Strategies
Panel A: Dependent variable is INVEST
47

Table 4, Panels B and C
• Results due mainly to CAPEXP (Panel B)
• Little variation in NONCAPEXP (Panel C)
48

Panel B: Dependent variable is CAPEX
49

Panel C: Dependent variable is NONCAPEX
50

Table 4, Panel D
• Difference between coefficients on DA vs real earnings management proxies are highly statistically significant
• Summary: firms engaging in real earnings management overinvest more than firms engaging in accrual earnings management
51
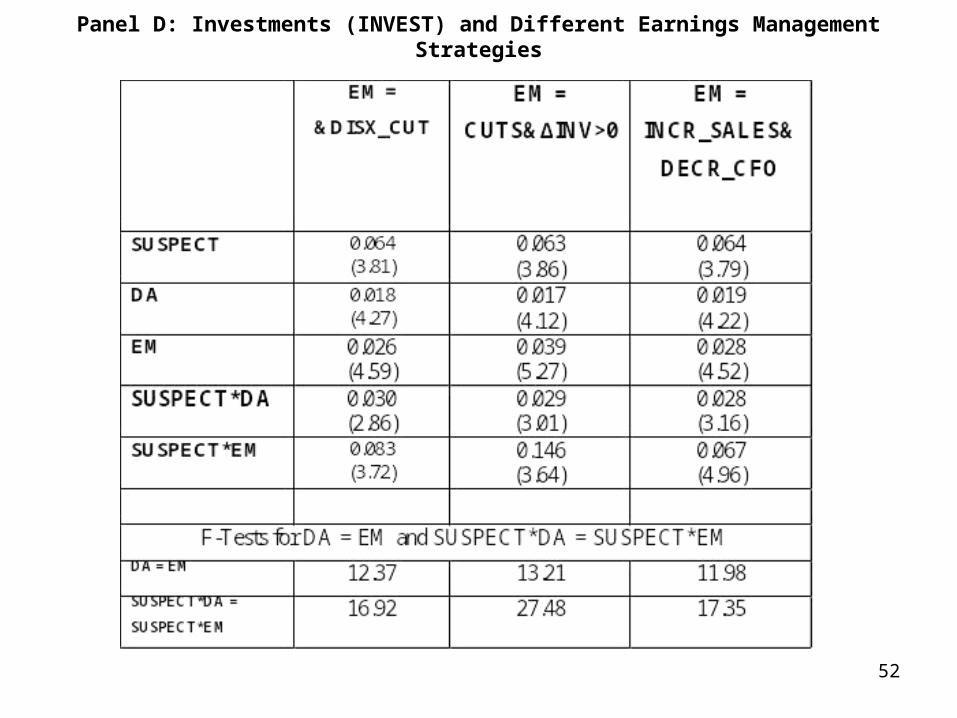
Panel D: Investments (INVEST) and Different Earnings Management Strategies
52

53
Intertemporal relation between EM and investment
• shows whether earnings management precedes the excess investment
• McNichols and Stubben: if earnings management causes overinvestment, then the overinvestment should be related to current and past earnings management
• estimate investment model (eq’n (10)), augmented with measures of firms’ earnings management from t-2 thru t+1
• do not include SUSPECT, which only pertains to year t.

Table 5
• current investments significantly related to both accrual-based and real current, past, and future earnings management
• coefficients on EMt, EMt-1, and EMt+1 > 0
• relationship between investments and earnings management activities is the strongest in the concurrent year
• To perform this analysis, we • Since we are estimating the relation between investment and
both past and future earnings management, we
54

Table 5, cont’d
• relation between investments and EM in year t+1 is consistent with some portion of earnings management to offset poor returns from over investments made in past periods.
• effects of real EM on investment are greater than the effects of accrual EM earnings management
• additional evidence that firms that engage in real EM experience greater overinvestment than firms that engage in accrual EM
55

Table 5: Investments and Earnings Management Strategies over Time
Panel A: Dependent variable is INVEST
56
EM = DA EM =
DISX_CUT
EM =
COGS_CUT
&∆INV>0
EM = INCR_SALES&DECR_CFO
LOG_ASSET 0.083 (2.45)
0.078 (1.74)
0.071 (3.29)
0.079 (3.12)
MKT-BK 2.473 (9.12)
2.541 (12.25)
2.532 (13.07)
2.487 (13.41)
LEVERAGE -5.401 (-10.24)
-5.613 (-11.69)
-5.598 (-8.39)
-5.628 (-9.17)
SLACK -0.057 (-0.83)
-0.0451 (-0.68)
-0.049 (-1.02)
-0.053 (-0.81)
AGE -0.076 (-5.29)
-0.077 (-6.08)
-0.068 (-5.41)
-0.073 (-7.38)
OP_CYCLE -0.857 (-3.41)
-0.862 (-3.43)
-0.859 (-4.84)
-0.848 (-2.83)
LOSS -3.504 (-9.79)
-3.721 (-10.38)
-3.662 (-8.73)
-3.645 (-7.86)
TANGIBLE 11.591 (11.34)
11.238 (12.34)
11.289 (9.17)
11.368 (9.46)
DIVIDEND -0.429 (-3.68)
-0.448 (-3.81)
-0.441 (-3.12)
-0.447 (-3.46)
EM t-2 0.005 (0.96)
0.004 (0.68)
0.005 (0.84)
0.003 (0.57)
EM t-1 0.009 (1.56)
0.011 (1.74)
0.019 (1.87)
0.014 (2.01)
EM t 0.018 (4.33)
0.025 (4.16)
0.038 (5.06)
0.027 (4.38)
EMt+1 0.009 (2.23)
0.013 (2.19)
0.016 (2.31)
0.014 (1.98)
Adj. R2 0.262 0.258 0.296 0.272

Table 5: Investments and Earnings Management Strategies over Time
Panel B: Dependent variable is CAPEX
57
EM = DA EM =
DISX_CUT
EM =
COGS_CUT
&∆INV>0
EM = INCR_SALES&DECR_CFO
LOG_ASSET 0.094 (2.58)
0.095 (2.37)
0.091 (2.84)
0.093 (3.01)
MKT-BK 2.772 (8.28)
2.834 (7.12)
2.858 (10.29)
2.863 (9.67)
LEVERAGE -4.541 (-8.79)
-4.583 (-10.35)
-4.561 (-8.14)
-4.486 (-8.28)
SLACK -0.037 (-0.93)
-0.034 (-0.65)
-0.032 (-0.62)
-0.034 (-0.83)
AGE -0.059 (-4.52)
-0.054 (-6.36)
-0.058 (-4.46)
-0.056 (-5.09)
OP_CYCLE -0.719 (-4.16)
-0.721 (-3.34)
-0.719 (-4.38)
-0.728 (-3.21)
LOSS -3.138 (-9.89)
-3.156 (-10.39)
-3.104 (-10.67)
-3.116 (-9.63)
TANGIBLE 10.674 (11.78)
10.786 (11.37)
10.763 (10.41)
10.656 (11.14)
DIVIDEND -0.34 (-3.12)
-0.326 (-3.42)
-0.334 (-3.76)
-0.329 (-3.37)
EM t-2 0.004 (0.68)
0.005 (0.72)
0.004 (0.42)
0.004 (0.72)
EMt-1 0.011 (2.89)
0.012 (1.86)
0.018 (1.93)
0.015 (2.24)
EM t 0.015 (4.39)
0.019 (2.98)
0.036 (4.67)
0.025 (3.81)
EM t+1 0.008 (2.79)
0.012 (2.58)
0.013 (2.26)
0.012 (1.88)
Adj. R2 0.278 0.291 0.334 0.316

Table 5: Investments and Earnings Management Strategies over Time
Panel C: Dependent variable is NONCAPEX
58
EM = DA EM =
DISX_CUT
EM =
COGS_CUT
&∆INV>0
EM = INCR_SALES&DECR_CFO
LOG_ASSET 0.026 (2.75)
0.026 (0.83)
0.022 (2.36)
0.027 (3.17)
MKT-BK 1.606 (4.81)
1.536 (3.42)
1.643 (4.15)
1.629 (3.74)
LEVERAGE -2.452 (-4.61)
-2.412 (-4.16)
-2.414 (-4.61)
-2.329 (-3.41)
SLACK -0.013 (-0.63)
-0.012 (-0.19)
-0.011 (-0.26)
-0.013 (-0.38)
AGE -0.064 (-4.38)
-0.061 (-5.25
-0.063 (-4.32)
-0.065 (-4.16)
OP_CYCLE 0.614 (3.97)
0.587 (3.42)
0.586 (4.63)
0.611 (3.47)
LOSS -2.497 (-7.56)
-2.456 (-8.61)
-2.521 (-8.14)
-2.493 (-7.54)
TANGIBLE -9.2401 (-6.42)
-9.267 (-6.63)
-9.243 (-7.11)
-9.357 (-6.43)
DIVIDEND -0.209 (-3.44)
-0.215 (-2.74)
-0.216 (-3.23)
-0.218 (-2.76)
EM t-2 0.003 (0.61)
0.004 (0.51)
0.003 (0.21)
0.002 (0.43)
EM t-1 0.007 (1.64)
0.008 (1.26)
0.011 (1.78)
0.008 (1.53)
EM t 0.009 (1.39)
0.018 (1.83)
0.024 (2.14)
0.015 (2.03)
EMt+1 0.004 (1.59)
0.008 (1.42)
0.012 (1.98)
0.008 (1.57)
Adj. R2 0.253 0.223 0.246 0.277

Intertemporal evidence-summary
• evidence implies that EM leads or occurs contemporaneously with over investments
• smaller statistical significant association between investments and EM activities in the subsequent year is consistent with some portion of earnings management to offset poor returns from over investments made in past periods.
59

summary
• first paper to examine the economic effects of real EM
• real EM firms overinvest and subsequently underinvest in the years surrounding the earnings management.
• excess investment associated with real EM is greater than excess investment associated with DA
60


![ACCOUNTING FOR INTANGIBLES: A LITERATURE … 7... · ACCOUNTING FOR INTANGIBLES: A LITERATURE REVIEW* ... companies in financial markets.1 Lev and Zarowin ... [1995], Lev and Zarowin](https://img.pdfslide.us/doc/110x75/5ac6efc17f8b9a57528e9687/accounting-for-intangibles-a-literature-7accounting-for-intangibles-a-literature.jpg)