Embed Size (px)
Citation preview
DANE COUNTY JUVENILE COURT
ANNUAL REPORT 2014
DANE COUNTY
JUVENILE COURT PROGRAM
TABLE OF CONTENTS
JUVENILE COURT PROGRAM Page 1-2
JUVENILE RECEPTION CENTER Pages 3-19
JUVENILE DETENTION CENTER Pages 20-24
JUVENILE COURT SANCTIONS Pages 25-26
JUVENILE SHELTER HOME Pages 27-31
HOME DETENTION PROGRAM Pages 32-34
DANE COUNTY CASA Page 35
JUVENILE COURT REFERRALS Pages 36
JUVENILE COURT PETITIONS Page 37
CLOSING Page 38
1
JUVENILE COURT PROGRAM
The Juvenile Court Program began under the Circuit Court in 1970.
The Program was initially funded through the Wisconsin Council of Criminal Justice grants and matching county funds. The Juvenile Reception Center, Juvenile Detention Center and Juvenile Shelter Home were placed under
the direction of the Juvenile Court Administrator in 1972. The Home Detention Program was initially funded in 1974 and the Youth Restitution Program (YRP) began in 1978 (The YRP contract was transferred to the Human
Services budget in 2008). Many changes have occurred to each program throughout the years and each has continually re-evaluated its mode of
operation in order to fit the changing needs of the community. Following is a detailed description of each program in the department.
Administration and Reception Center: The Juvenile Reception Center (JRC) is the point of referral for juveniles
alleged to have committed a crime for whom the apprehending law enforcement officer is unable to release the juvenile to a parent, guardian, or other responsible adult and/or believes the juvenile should be referred for secure
custody. JRC then conducts and intake and makes a temporary physical custody decision. JRC also provides a number of other services related to the physical custody of juveniles and coordinating information with the courts,
human services, and law enforcement. JRC is staffed with at least one Juvenile Court Counselor 24 hours a day.
Juvenile Detention Center: The Juvenile Detention Center’s mission is to provide a safe and secure
environment, physically and emotionally, for juveniles placed temporarily by the court and to provide them with the opportunity to learn new skills that will
enable them to contribute to the community when they leave. The Detention Center has a capacity of 24 juveniles and is located on the 2nd floor of the City-County Building. Juveniles are held in Detention primarily because: (1) There
is reason to believe that if released they would cause harm to other persons, (2) There is reason to believe that if released they would be unavailable for further court proceedings, and/or (3) They have been found to be in violation of a valid
court order and rules of supervision. The program operates 24 hours a day.
The Shelter Home: The Shelter Home (SH) provides non-secure (unlocked) residential
services for juveniles who need a place to stay pending further court action but
for whom placement in a secure setting (Detention) is not necessary. The Shelter Home provides for placement of a total of 16 boys and girls who are
involved in the delinquency or CHIPS systems and is located at 2402 Atwood Ave. Juveniles may stay at the Shelter Home for up to 60 days. The program operates 24 hours day.
2
Home Detention Program:
The Home Detention Program (HDP) is an alternative to detention or non-secure placement of youth. There is no time limit and the length of their
involvement will depend on the court status of the juvenile. Community Youth Workers assist the parent(s) in providing adequate supervision and monitoring of juveniles. This program:
- Reduces the need for the placement of juveniles in detention or non-secure placements pending court disposition.
- Assists both the parents and juvenile in resolving conflicts that might
otherwise lead to further problem behavior. - Provides information to the court about the ability of the juvenile and
family to maintain a safe and supervised plan that would enable the juvenile to remain at home at the time of court disposition.
- Provides a “bridge” between the court disposition and the implementation
of longer-term supervision through the Neighborhood Intervention Program (NIP) or Youth Services of Southern WI by providing supervision
to help maintain the situation at home until one of those programs can begin intensive supervision services.
This report seeks to compile information obtained from the above named
programs and other sources into a single resource. The goal is to share what is
known, statistically speaking, about those who were involved with the Juvenile Court Program last year.
The Juvenile Court Program has a proud history of providing the Dane County community with the greatest possible degree of professionalism and
confidentiality. The supervisors and staff of the programs work hard to maintain a safe environment for the youth and families they serve. The Annual Report is one of the tools that the department uses to convey information and
the partners involved with the Juvenile Court Program use to monitor their own performance and to address recurrent or newly emerging patterns and
community needs.
3
Juvenile Reception Center
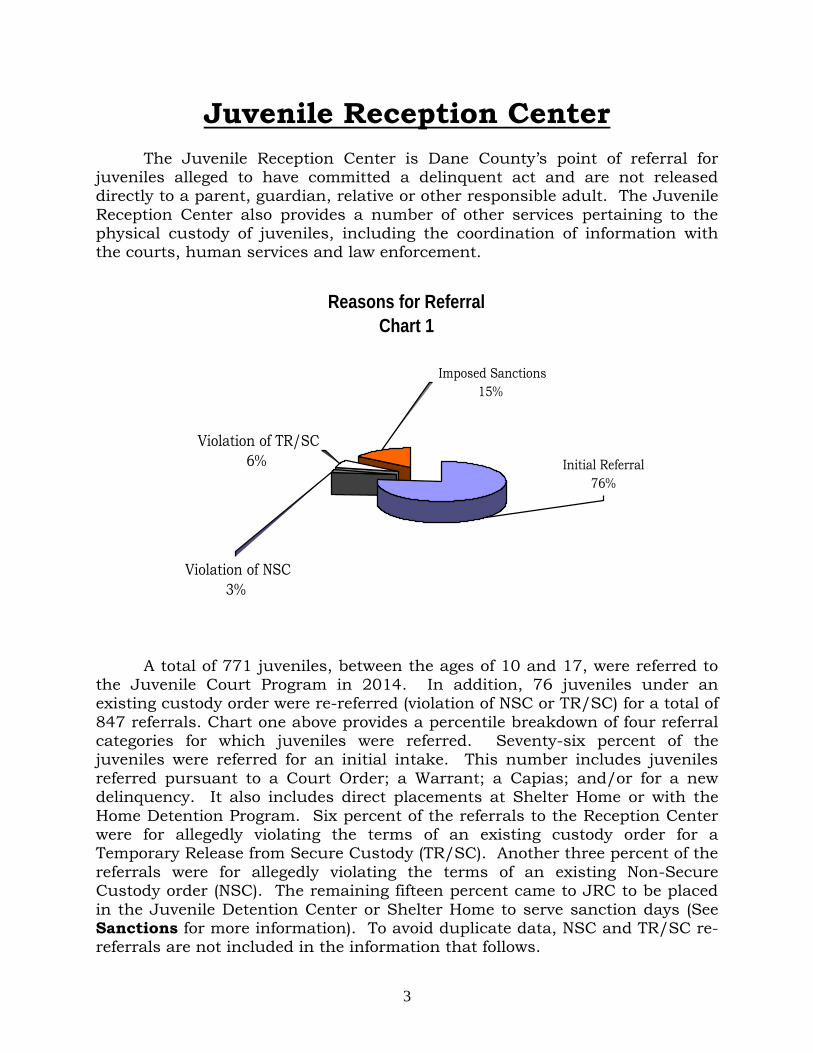
The Juvenile Reception Center is Dane County’s point of referral for juveniles alleged to have committed a delinquent act and are not released directly to a parent, guardian, relative or other responsible adult. The Juvenile
Reception Center also provides a number of other services pertaining to the physical custody of juveniles, including the coordination of information with the courts, human services and law enforcement.
A total of 771 juveniles, between the ages of 10 and 17, were referred to the Juvenile Court Program in 2014. In addition, 76 juveniles under an existing custody order were re-referred (violation of NSC or TR/SC) for a total of
847 referrals. Chart one above provides a percentile breakdown of four referral categories for which juveniles were referred. Seventy-six percent of the juveniles were referred for an initial intake. This number includes juveniles
referred pursuant to a Court Order; a Warrant; a Capias; and/or for a new delinquency. It also includes direct placements at Shelter Home or with the
Home Detention Program. Six percent of the referrals to the Reception Center were for allegedly violating the terms of an existing custody order for a Temporary Release from Secure Custody (TR/SC). Another three percent of the
referrals were for allegedly violating the terms of an existing Non-Secure Custody order (NSC). The remaining fifteen percent came to JRC to be placed
in the Juvenile Detention Center or Shelter Home to serve sanction days (See Sanctions for more information). To avoid duplicate data, NSC and TR/SC re-referrals are not included in the information that follows.
Reasons for Referral
Chart 1
Violation of NSC
3%
Violation of TR/SC
6%
Imposed Sanctions
15%
Initial Referral
76%
4
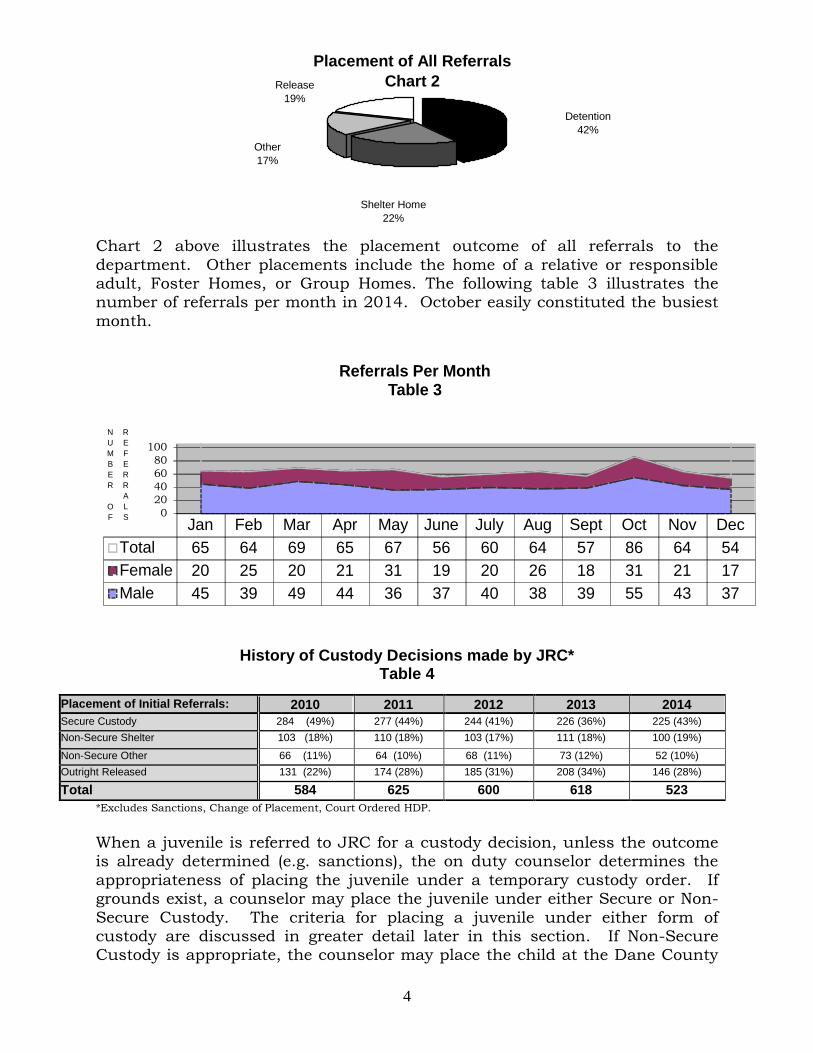
Chart 2 above illustrates the placement outcome of all referrals to the
department. Other placements include the home of a relative or responsible adult, Foster Homes, or Group Homes. The following table 3 illustrates the number of referrals per month in 2014. October easily constituted the busiest
month.
History of Custody Decisions made by JRC*
Table 4
*Excludes Sanctions, Change of Placement, Court Ordered HDP. When a juvenile is referred to JRC for a custody decision, unless the outcome is already determined (e.g. sanctions), the on duty counselor determines the
appropriateness of placing the juvenile under a temporary custody order. If grounds exist, a counselor may place the juvenile under either Secure or Non-
Secure Custody. The criteria for placing a juvenile under either form of custody are discussed in greater detail later in this section. If Non-Secure Custody is appropriate, the counselor may place the child at the Dane County
Placement of Initial Referrals: 2010 2011 2012 2013 2014
Secure Custody 284 (49%) 277 (44%) 244 (41%) 226 (36%) 225 (43%)
Non-Secure Shelter 103 (18%) 110 (18%) 103 (17%) 111 (18%) 100 (19%)
Non-Secure Other 66 (11%) 64 (10%) 68 (11%) 73 (12%) 52 (10%)
Outright Released 131 (22%) 174 (28%) 185 (31%) 208 (34%) 146 (28%)
Total 584 625 600 618 523
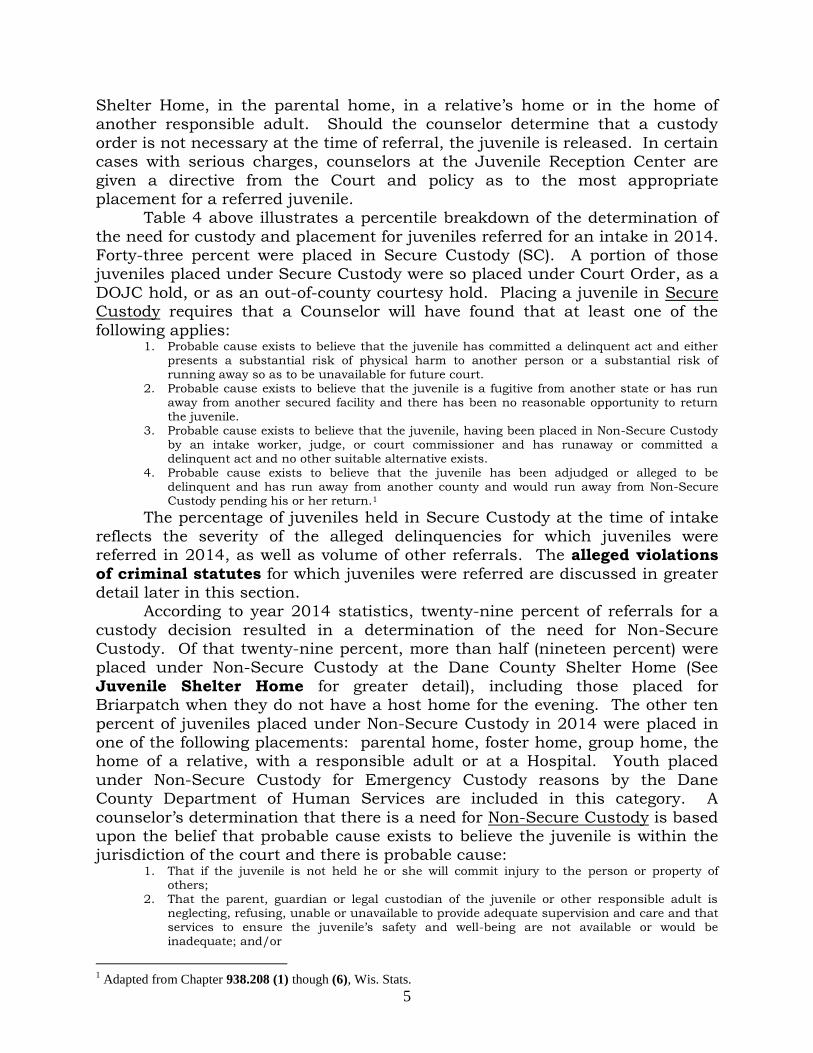
Jan Feb Mar Apr May June July Aug Sept Oct Nov Dec
Total 65 64 69 65 67 56 60 64 57 86 64 54
Female 20 25 20 21 31 19 20 26 18 31 21 17
Male 45 39 49 44 36 37 40 38 39 55 43 37
0
20
40
60
80
100
N
U
M
B
E
R
O
F
R
E
F
E
R
R
A
L
S
Referrals Per MonthTable 3
Placement of All Referrals
Chart 2
Other
17%
Detention
42%
Release
19%
Shelter Home
22%
5
Shelter Home, in the parental home, in a relative’s home or in the home of another responsible adult. Should the counselor determine that a custody
order is not necessary at the time of referral, the juvenile is released. In certain cases with serious charges, counselors at the Juvenile Reception Center are
given a directive from the Court and policy as to the most appropriate placement for a referred juvenile.
Table 4 above illustrates a percentile breakdown of the determination of
the need for custody and placement for juveniles referred for an intake in 2014. Forty-three percent were placed in Secure Custody (SC). A portion of those juveniles placed under Secure Custody were so placed under Court Order, as a
DOJC hold, or as an out-of-county courtesy hold. Placing a juvenile in Secure Custody requires that a Counselor will have found that at least one of the
following applies: 1. Probable cause exists to believe that the juvenile has committed a delinquent act and either
presents a substantial risk of physical harm to another person or a substantial risk of running away so as to be unavailable for future court.
2. Probable cause exists to believe that the juvenile is a fugitive from another state or has run away from another secured facility and there has been no reasonable opportunity to return the juvenile.
3. Probable cause exists to believe that the juvenile, having been placed in Non-Secure Custody by an intake worker, judge, or court commissioner and has runaway or committed a delinquent act and no other suitable alternative exists.
4. Probable cause exists to believe that the juvenile has been adjudged or alleged to be delinquent and has run away from another county and would run away from Non-Secure Custody pending his or her return.1
The percentage of juveniles held in Secure Custody at the time of intake
reflects the severity of the alleged delinquencies for which juveniles were referred in 2014, as well as volume of other referrals. The alleged violations
of criminal statutes for which juveniles were referred are discussed in greater detail later in this section.
According to year 2014 statistics, twenty-nine percent of referrals for a
custody decision resulted in a determination of the need for Non-Secure Custody. Of that twenty-nine percent, more than half (nineteen percent) were placed under Non-Secure Custody at the Dane County Shelter Home (See
Juvenile Shelter Home for greater detail), including those placed for Briarpatch when they do not have a host home for the evening. The other ten
percent of juveniles placed under Non-Secure Custody in 2014 were placed in one of the following placements: parental home, foster home, group home, the home of a relative, with a responsible adult or at a Hospital. Youth placed
under Non-Secure Custody for Emergency Custody reasons by the Dane County Department of Human Services are included in this category. A
counselor’s determination that there is a need for Non-Secure Custody is based upon the belief that probable cause exists to believe the juvenile is within the jurisdiction of the court and there is probable cause:
1. That if the juvenile is not held he or she will commit injury to the person or property of others;
2. That the parent, guardian or legal custodian of the juvenile or other responsible adult is neglecting, refusing, unable or unavailable to provide adequate supervision and care and that services to ensure the juvenile’s safety and well-being are not available or would be inadequate; and/or
1 Adapted from Chapter 938.208 (1) though (6), Wis. Stats.
6
3. That the juvenile will run away or be taken away so as to be unavailable for proceedings of the court or its officers.2
Juveniles placed under Non-Secure Custody for a delinquency are subject to the same custody hearing guidelines as those placed under Secure
Custody. A custody hearing must be held within 24 hours (excluding weekends and legal holidays) and the person/agency with whom the child has
been placed is expected to ensure that juvenile will be available for court. All juveniles who are referred to the Juvenile Reception Center for a
custody decision, and for whom a temporary custody status is not necessary,
are released either to their parental home or to another responsible adult as soon as possible. Twenty-eight percent of all juveniles referred for a custody
decision in 2014 were released outright. Juveniles in this category were either not found to fit the requirements for Non-Secure or Secure Custody or it was determined that adequate supervision and services were already in place for
the juvenile and his or her family.
JRC Referral Categories
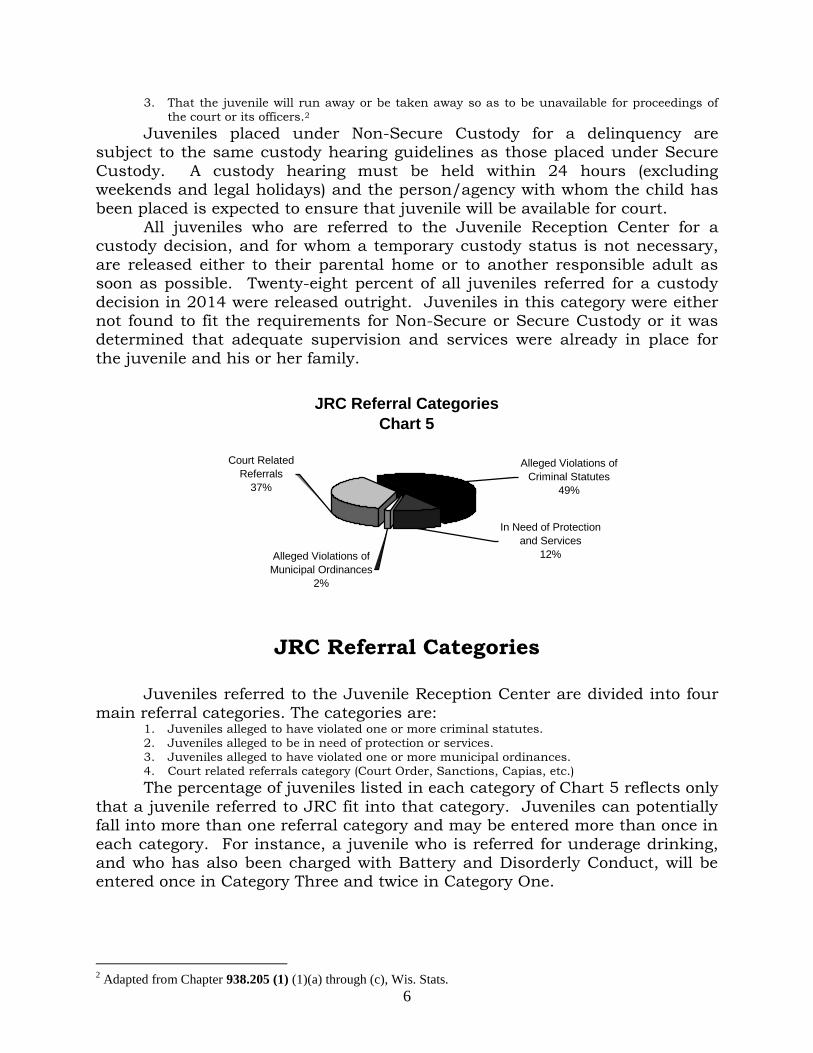
Juveniles referred to the Juvenile Reception Center are divided into four
main referral categories. The categories are: 1. Juveniles alleged to have violated one or more criminal statutes. 2. Juveniles alleged to be in need of protection or services. 3. Juveniles alleged to have violated one or more municipal ordinances. 4. Court related referrals category (Court Order, Sanctions, Capias, etc.)
The percentage of juveniles listed in each category of Chart 5 reflects only
that a juvenile referred to JRC fit into that category. Juveniles can potentially fall into more than one referral category and may be entered more than once in
each category. For instance, a juvenile who is referred for underage drinking, and who has also been charged with Battery and Disorderly Conduct, will be entered once in Category Three and twice in Category One.
2 Adapted from Chapter 938.205 (1) (1)(a) through (c), Wis. Stats.
JRC Referral Categories
Chart 5
In Need of Protection
and Services
12%Alleged Violations of
Municipal Ordinances
2%
Court Related
Referrals
37%
Alleged Violations of
Criminal Statutes
49%
7
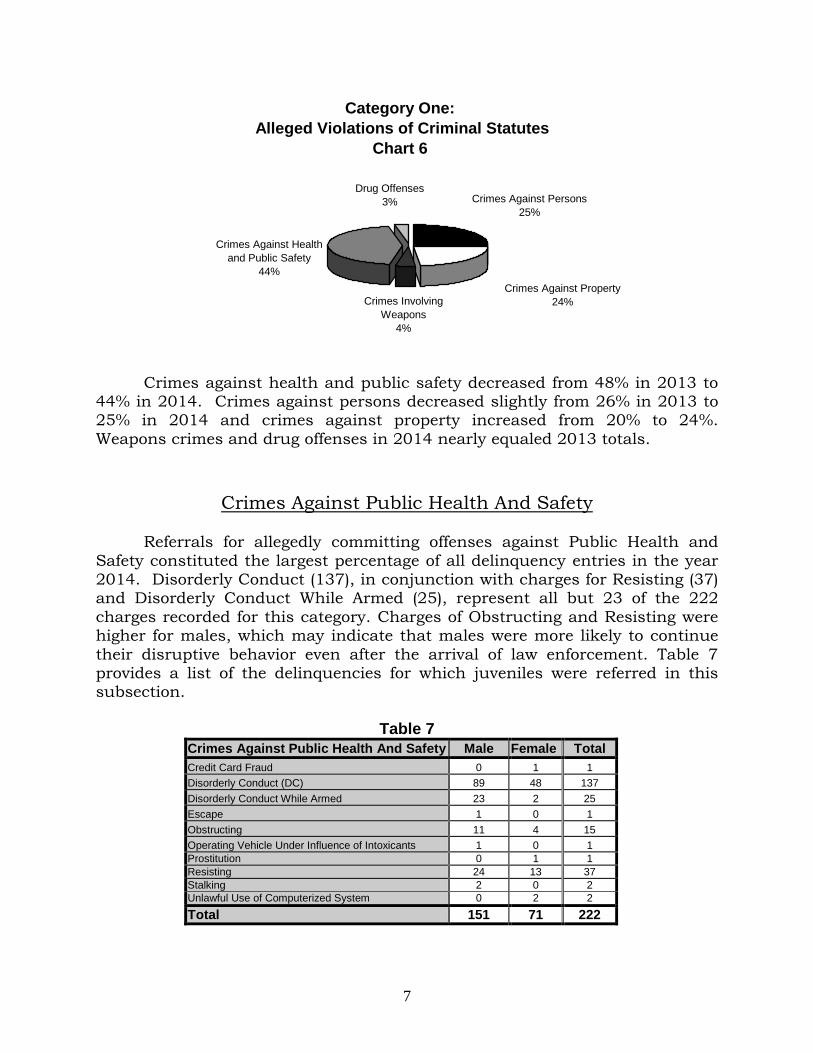
Crimes against health and public safety decreased from 48% in 2013 to 44% in 2014. Crimes against persons decreased slightly from 26% in 2013 to 25% in 2014 and crimes against property increased from 20% to 24%.
Weapons crimes and drug offenses in 2014 nearly equaled 2013 totals.
Crimes Against Public Health And Safety Referrals for allegedly committing offenses against Public Health and
Safety constituted the largest percentage of all delinquency entries in the year 2014. Disorderly Conduct (137), in conjunction with charges for Resisting (37) and Disorderly Conduct While Armed (25), represent all but 23 of the 222
charges recorded for this category. Charges of Obstructing and Resisting were higher for males, which may indicate that males were more likely to continue
their disruptive behavior even after the arrival of law enforcement. Table 7 provides a list of the delinquencies for which juveniles were referred in this subsection.
Table 7
Crimes Against Public Health And Safety Male Female Total
Credit Card Fraud 0 1 1
Disorderly Conduct (DC) 89 48 137
Disorderly Conduct While Armed 23 2 25
Escape 1 0 1
Obstructing 11 4 15
Operating Vehicle Under Influence of Intoxicants 1 0 1
Prostitution 0 1 1
Resisting 24 13 37
Stalking 2 0 2
Unlawful Use of Computerized System 0 2 2
Total 151 71 222
Category One:
Alleged Violations of Criminal Statutes
Chart 6
Crimes Against Persons
25%
Crimes Against Property
24%Crimes Involving
Weapons
4%
Crimes Against Health
and Public Safety
44%
Drug Offenses
3%
8
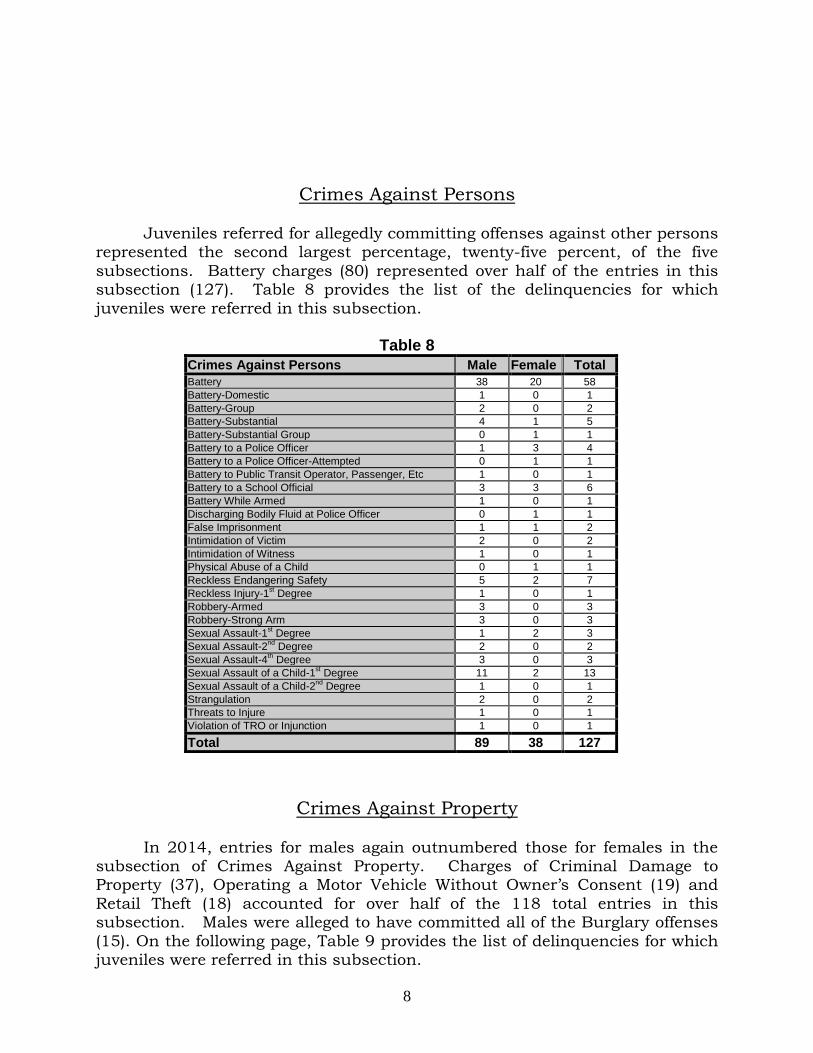
Crimes Against Persons
Juveniles referred for allegedly committing offenses against other persons
represented the second largest percentage, twenty-five percent, of the five
subsections. Battery charges (80) represented over half of the entries in this subsection (127). Table 8 provides the list of the delinquencies for which
juveniles were referred in this subsection.
Table 8
Crimes Against Persons Male Female Total
Battery 38 20 58
Battery-Domestic 1 0 1
Battery-Group 2 0 2
Battery-Substantial 4 1 5
Battery-Substantial Group 0 1 1
Battery to a Police Officer 1 3 4
Battery to a Police Officer-Attempted 0 1 1
Battery to Public Transit Operator, Passenger, Etc 1 0 1
Battery to a School Official 3 3 6
Battery While Armed 1 0 1
Discharging Bodily Fluid at Police Officer 0 1 1
False Imprisonment 1 1 2
Intimidation of Victim 2 0 2
Intimidation of Witness 1 0 1
Physical Abuse of a Child 0 1 1
Reckless Endangering Safety 5 2 7
Reckless Injury-1st Degree 1 0 1
Robbery-Armed 3 0 3
Robbery-Strong Arm 3 0 3
Sexual Assault-1st Degree 1 2 3
Sexual Assault-2nd
Degree 2 0 2
Sexual Assault-4th Degree 3 0 3
Sexual Assault of a Child-1st Degree 11 2 13
Sexual Assault of a Child-2nd
Degree 1 0 1
Strangulation 2 0 2
Threats to Injure 1 0 1
Violation of TRO or Injunction 1 0 1
Total 89 38 127
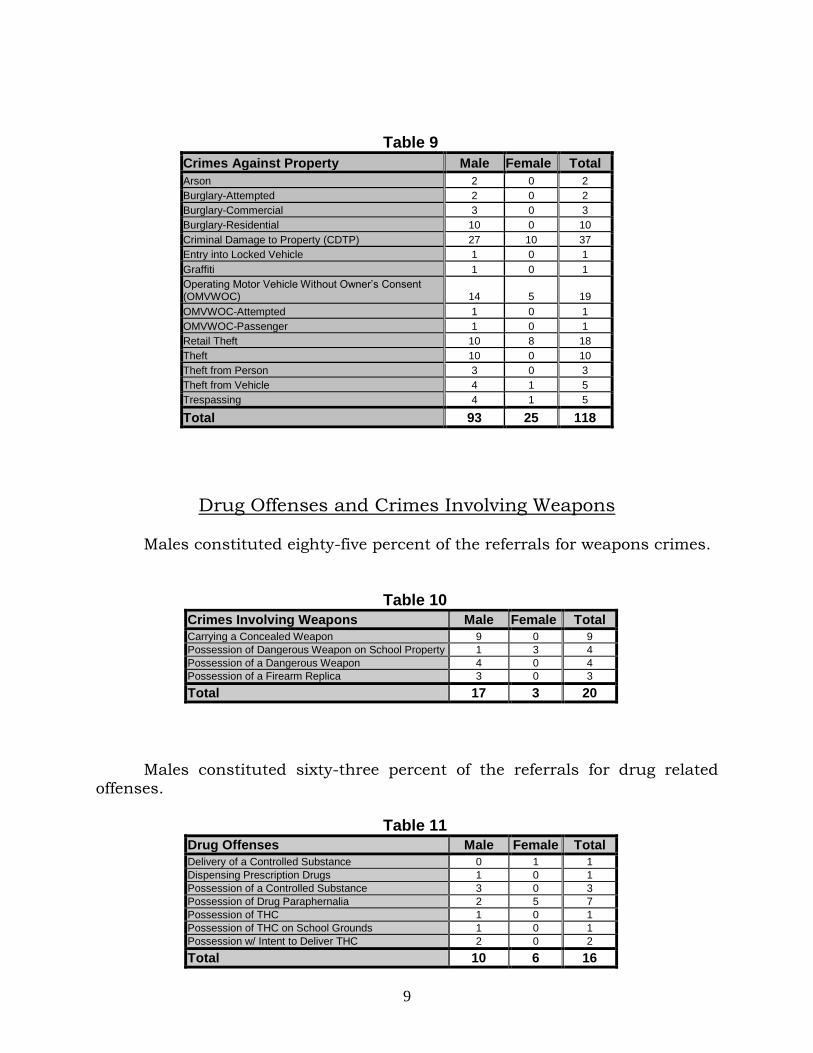
Crimes Against Property
In 2014, entries for males again outnumbered those for females in the subsection of Crimes Against Property. Charges of Criminal Damage to Property (37), Operating a Motor Vehicle Without Owner’s Consent (19) and
Retail Theft (18) accounted for over half of the 118 total entries in this subsection. Males were alleged to have committed all of the Burglary offenses
(15). On the following page, Table 9 provides the list of delinquencies for which juveniles were referred in this subsection.
9
Table 9
Crimes Against Property Male Female Total
Arson 2 0 2
Burglary-Attempted 2 0 2
Burglary-Commercial 3 0 3
Burglary-Residential 10 0 10
Criminal Damage to Property (CDTP) 27 10 37
Entry into Locked Vehicle 1 0 1
Graffiti 1 0 1
Operating Motor Vehicle Without Owner’s Consent (OMVWOC) 14 5 19
OMVWOC-Attempted 1 0 1
OMVWOC-Passenger 1 0 1
Retail Theft 10 8 18
Theft 10 0 10
Theft from Person 3 0 3
Theft from Vehicle 4 1 5
Trespassing 4 1 5
Total 93 25 118
Drug Offenses and Crimes Involving Weapons
Males constituted eighty-five percent of the referrals for weapons crimes.
Table 10
Crimes Involving Weapons Male Female Total
Carrying a Concealed Weapon 9 0 9
Possession of Dangerous Weapon on School Property 1 3 4
Possession of a Dangerous Weapon 4 0 4
Possession of a Firearm Replica 3 0 3
Total 17 3 20
Males constituted sixty-three percent of the referrals for drug related offenses.
Table 11
Drug Offenses Male Female Total
Delivery of a Controlled Substance 0 1 1
Dispensing Prescription Drugs 1 0 1
Possession of a Controlled Substance 3 0 3
Possession of Drug Paraphernalia 2 5 7
Possession of THC 1 0 1
Possession of THC on School Grounds 1 0 1
Possession w/ Intent to Deliver THC 2 0 2
Total 10 6 16
10
Category Two:
Children and Juveniles Alleged To Be in Need of Protection or Services
This referral category includes referrals to JRC for reasons not involving law violations. Juveniles alleged to be uncontrollable or habitual truants from
school are referred to as Juveniles In Need of Protection or Services (JIPS). Children suffering from illness, injury, or in immediate danger from their surroundings continue to be referred to as Children In Need of Protection or
Services (CHIPS). In 2014, 121 juveniles were referred for JIPS and CHIPS purposes.
Juveniles who were referred to JRC as a runaway were likely to have either runaway from a Dane County Group Home, Foster Home or to have run away from a placement outside of Dane County. Some of these juveniles are placed
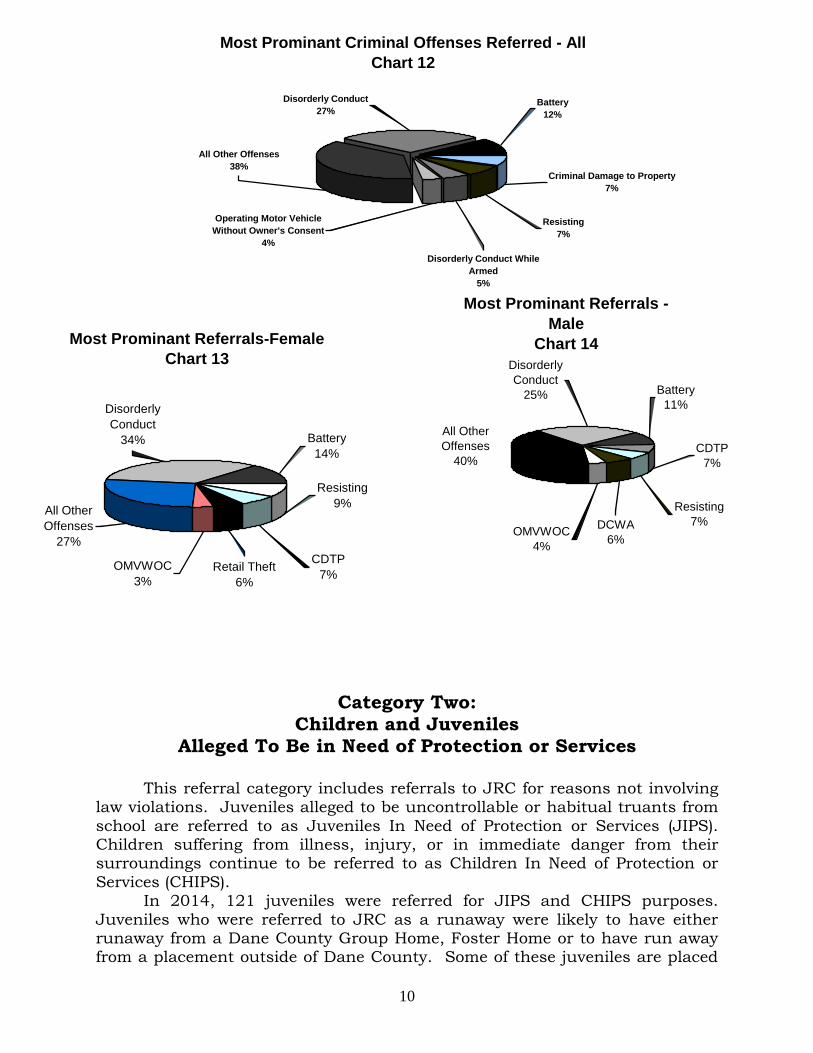
Most Prominant Referrals-Female
Chart 13
CDTP
7%
Resisting
9%
Battery
14%
Disorderly
Conduct
34%
Retail Theft
6%
OMVWOC
3%
All Other
Offenses
27%
Most Prominant Referrals -
Male
Chart 14
All Other
Offenses
40%
Disorderly
Conduct
25%
Resisting
7%
CDTP
7%
Battery
11%
OMVWOC
4%
DCWA
6%
Most Prominant Criminal Offenses Referred - All
Chart 12
Battery
12%
Disorderly Conduct
27%
All Other Offenses
38%
Operating Motor Vehicle
Without Owner's Consent
4%
Disorderly Conduct While
Armed
5%
Resisting
7%
Criminal Damage to Property
7%
11
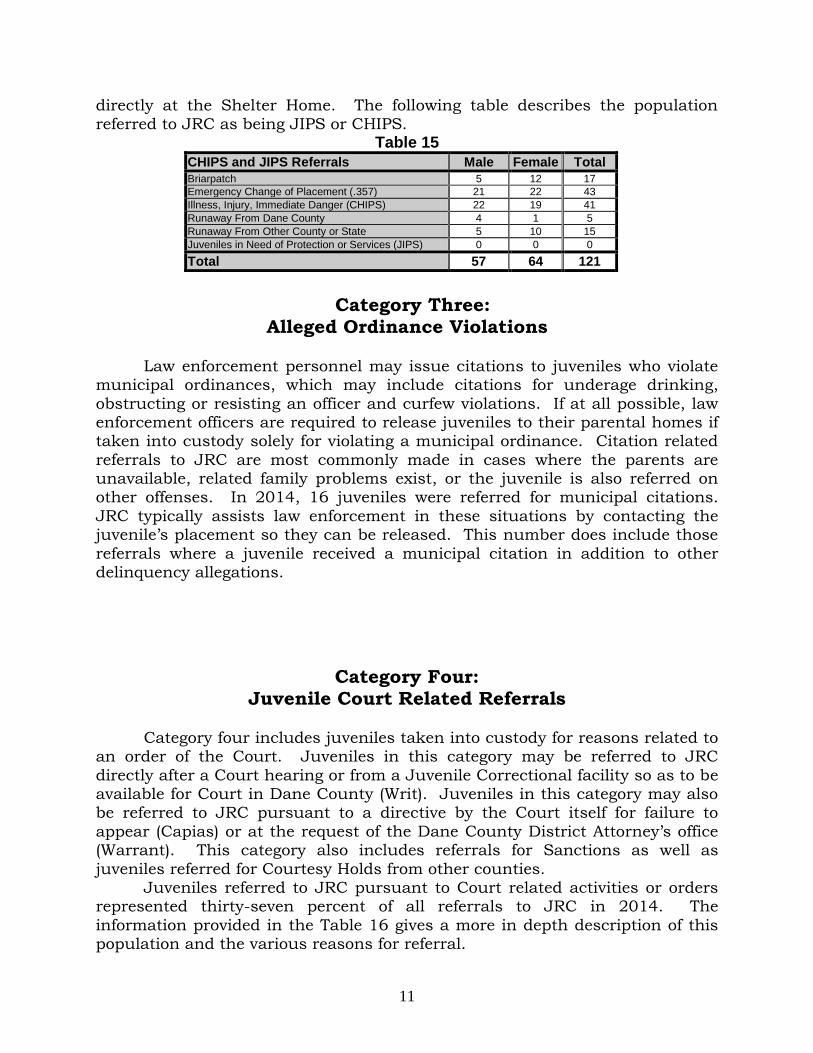
directly at the Shelter Home. The following table describes the population referred to JRC as being JIPS or CHIPS.
Table 15
CHIPS and JIPS Referrals Male Female Total
Briarpatch 5 12 17
Emergency Change of Placement (.357) 21 22 43
Illness, Injury, Immediate Danger (CHIPS) 22 19 41
Runaway From Dane County 4 1 5
Runaway From Other County or State 5 10 15
Juveniles in Need of Protection or Services (JIPS) 0 0 0
Total 57 64 121
Category Three:
Alleged Ordinance Violations
Law enforcement personnel may issue citations to juveniles who violate municipal ordinances, which may include citations for underage drinking,
obstructing or resisting an officer and curfew violations. If at all possible, law enforcement officers are required to release juveniles to their parental homes if taken into custody solely for violating a municipal ordinance. Citation related
referrals to JRC are most commonly made in cases where the parents are unavailable, related family problems exist, or the juvenile is also referred on other offenses. In 2014, 16 juveniles were referred for municipal citations.
JRC typically assists law enforcement in these situations by contacting the juvenile’s placement so they can be released. This number does include those
referrals where a juvenile received a municipal citation in addition to other delinquency allegations.
Category Four: Juvenile Court Related Referrals
Category four includes juveniles taken into custody for reasons related to an order of the Court. Juveniles in this category may be referred to JRC
directly after a Court hearing or from a Juvenile Correctional facility so as to be available for Court in Dane County (Writ). Juveniles in this category may also be referred to JRC pursuant to a directive by the Court itself for failure to
appear (Capias) or at the request of the Dane County District Attorney’s office (Warrant). This category also includes referrals for Sanctions as well as
juveniles referred for Courtesy Holds from other counties. Juveniles referred to JRC pursuant to Court related activities or orders
represented thirty-seven percent of all referrals to JRC in 2014. The
information provided in the Table 16 gives a more in depth description of this population and the various reasons for referral.
12
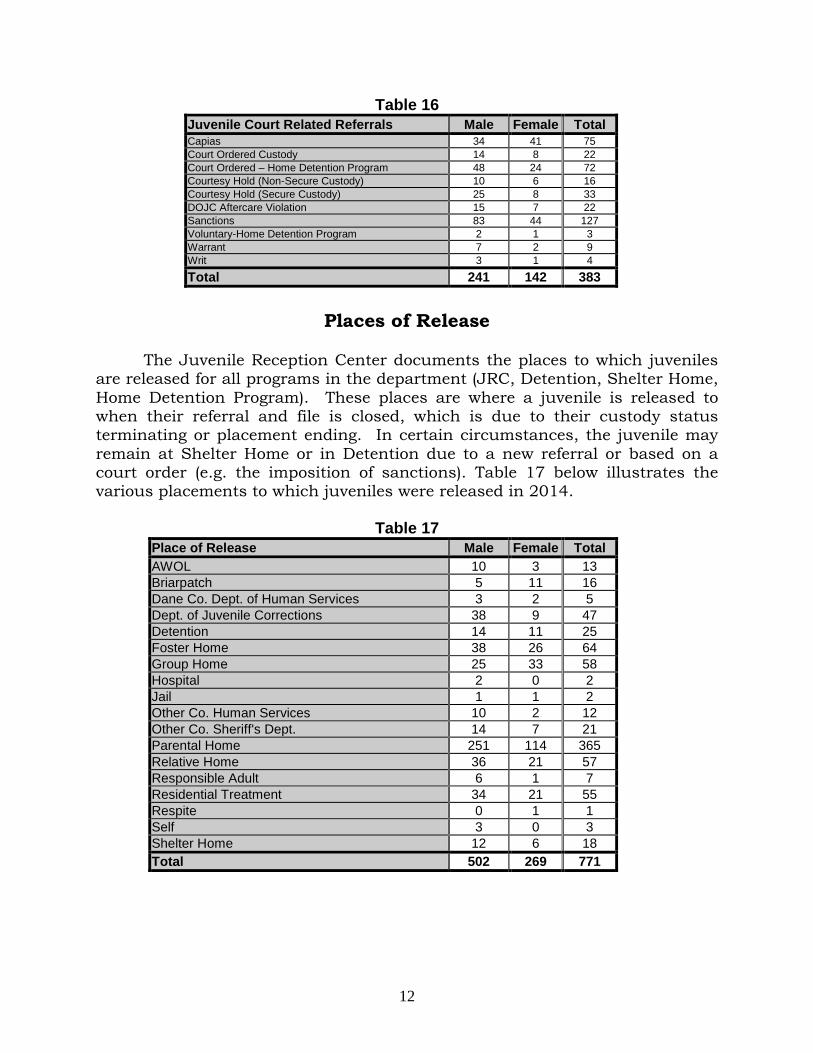
Table 16
Juvenile Court Related Referrals Male Female Total
Capias 34 41 75
Court Ordered Custody 14 8 22
Court Ordered – Home Detention Program 48 24 72
Courtesy Hold (Non-Secure Custody) 10 6 16
Courtesy Hold (Secure Custody) 25 8 33
DOJC Aftercare Violation 15 7 22
Sanctions 83 44 127
Voluntary-Home Detention Program 2 1 3
Warrant 7 2 9
Writ 3 1 4
Total 241 142 383
Places of Release
The Juvenile Reception Center documents the places to which juveniles are released for all programs in the department (JRC, Detention, Shelter Home,
Home Detention Program). These places are where a juvenile is released to when their referral and file is closed, which is due to their custody status terminating or placement ending. In certain circumstances, the juvenile may
remain at Shelter Home or in Detention due to a new referral or based on a court order (e.g. the imposition of sanctions). Table 17 below illustrates the various placements to which juveniles were released in 2014.
Table 17
Place of Release Male Female Total
AWOL 10 3 13
Briarpatch 5 11 16
Dane Co. Dept. of Human Services 3 2 5
Dept. of Juvenile Corrections 38 9 47
Detention 14 11 25
Foster Home 38 26 64
Group Home 25 33 58
Hospital 2 0 2
Jail 1 1 2
Other Co. Human Services 10 2 12
Other Co. Sheriff's Dept. 14 7 21
Parental Home 251 114 365
Relative Home 36 21 57
Responsible Adult 6 1 7
Residential Treatment 34 21 55
Respite 0 1 1
Self 3 0 3
Shelter Home 12 6 18
Total 502 269 771
13
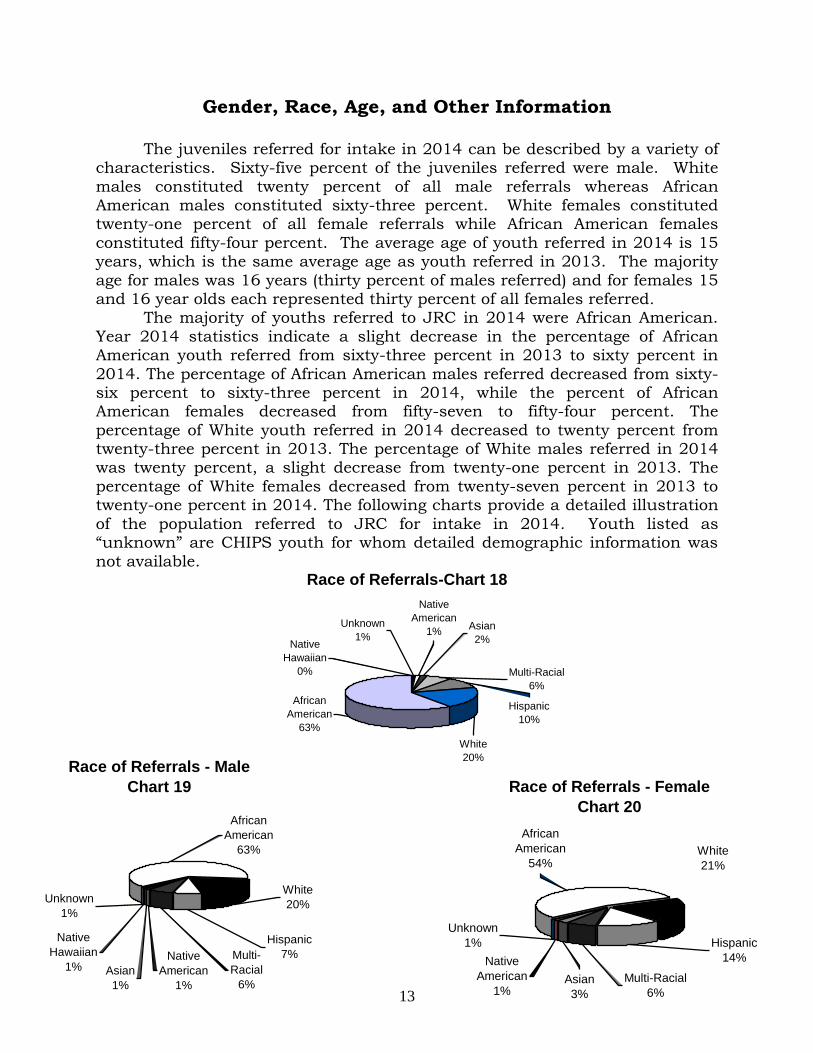
Gender, Race, Age, and Other Information
The juveniles referred for intake in 2014 can be described by a variety of characteristics. Sixty-five percent of the juveniles referred were male. White
males constituted twenty percent of all male referrals whereas African American males constituted sixty-three percent. White females constituted twenty-one percent of all female referrals while African American females
constituted fifty-four percent. The average age of youth referred in 2014 is 15 years, which is the same average age as youth referred in 2013. The majority
age for males was 16 years (thirty percent of males referred) and for females 15 and 16 year olds each represented thirty percent of all females referred.
The majority of youths referred to JRC in 2014 were African American.
Year 2014 statistics indicate a slight decrease in the percentage of African American youth referred from sixty-three percent in 2013 to sixty percent in
2014. The percentage of African American males referred decreased from sixty-six percent to sixty-three percent in 2014, while the percent of African American females decreased from fifty-seven to fifty-four percent. The
percentage of White youth referred in 2014 decreased to twenty percent from twenty-three percent in 2013. The percentage of White males referred in 2014 was twenty percent, a slight decrease from twenty-one percent in 2013. The
percentage of White females decreased from twenty-seven percent in 2013 to twenty-one percent in 2014. The following charts provide a detailed illustration
of the population referred to JRC for intake in 2014. Youth listed as “unknown” are CHIPS youth for whom detailed demographic information was
not available. Race of Referrals-Chart 18
African
American
63%
White
20%
Asian
2%
Native
American
1%
Native
Hawaiian
0% Multi-Racial
6%
Hispanic
10%
Unknown
1%
Race of Referrals - Male
Chart 19
Hispanic
7%Multi-
Racial
6%
Native
American
1%
White
20%
Asian
1%
African
American
63%
Native
Hawaiian
1%
Unknown
1%
Race of Referrals - Female
Chart 20
Multi-Racial
6%
Hispanic
14%
White
21%
African
American
54%
Asian
3%
Native
American
1%
Unknown
1%
14
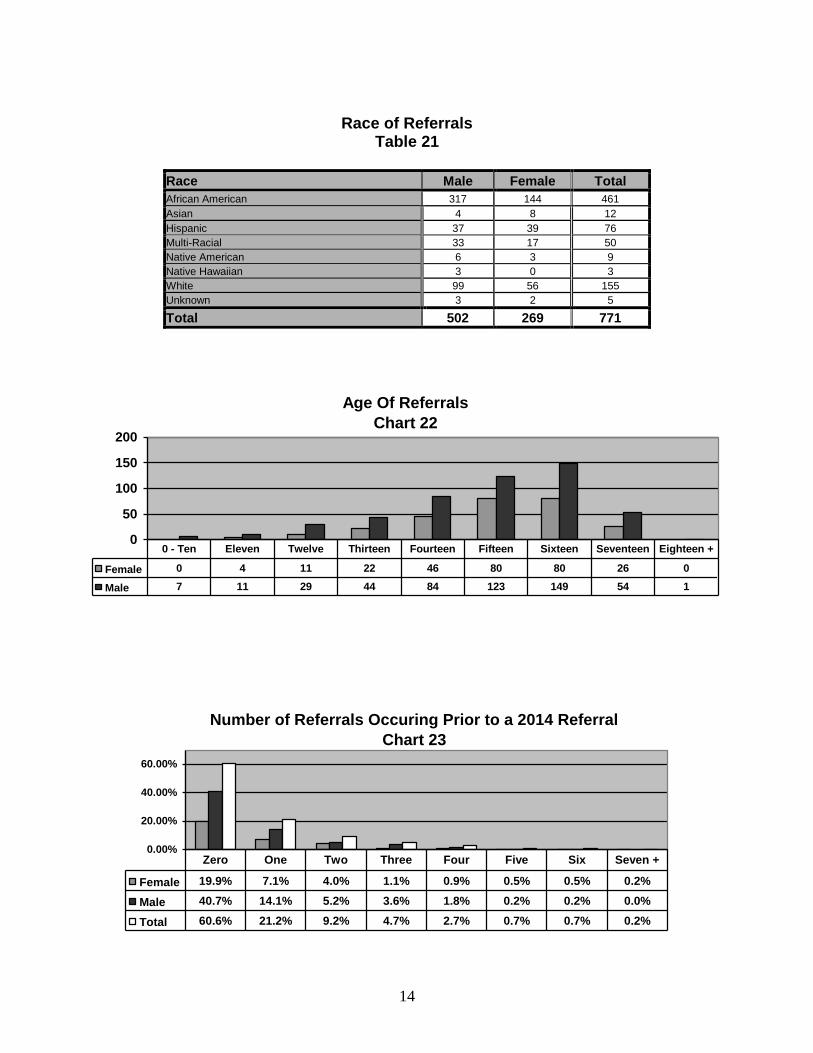
Race of Referrals
Table 21
Race Male Female Total
African American 317 144 461
Asian 4 8 12
Hispanic 37 39 76
Multi-Racial 33 17 50
Native American 6 3 9
Native Hawaiian 3 0 3
White 99 56 155
Unknown 3 2 5
Total 502 269 771
Age Of Referrals
Chart 22
0
50
100
150
200
Female 0 4 11 22 46 80 80 26 0
Male 7 11 29 44 84 123 149 54 1
0 - Ten Eleven Twelve Thirteen Fourteen Fifteen Sixteen Seventeen Eighteen +
Number of Referrals Occuring Prior to a 2014 Referral
Chart 23
0.00%
20.00%
40.00%
60.00%
Female 19.9% 7.1% 4.0% 1.1% 0.9% 0.5% 0.5% 0.2%
Male 40.7% 14.1% 5.2% 3.6% 1.8% 0.2% 0.2% 0.0%
Total 60.6% 21.2% 9.2% 4.7% 2.7% 0.7% 0.7% 0.2%
Zero One Two Three Four Five Six Seven +
15
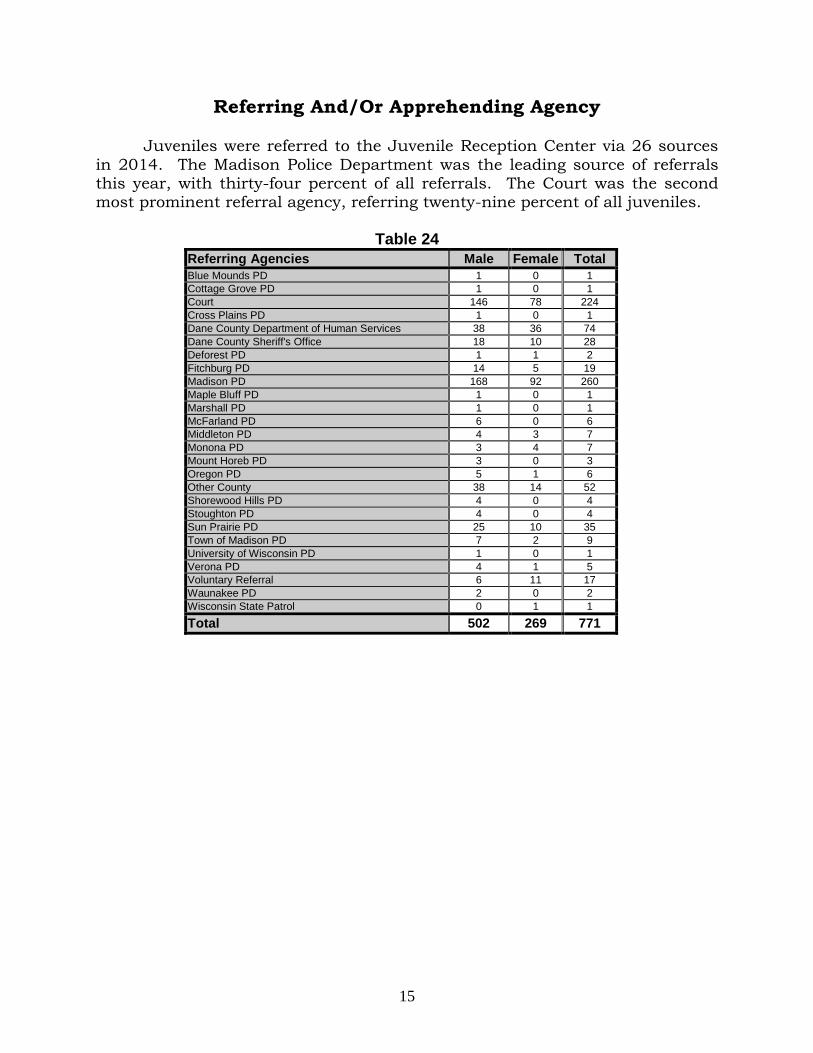
Referring And/Or Apprehending Agency Juveniles were referred to the Juvenile Reception Center via 26 sources
in 2014. The Madison Police Department was the leading source of referrals this year, with thirty-four percent of all referrals. The Court was the second most prominent referral agency, referring twenty-nine percent of all juveniles.
Table 24
Referring Agencies Male Female Total
Blue Mounds PD 1 0 1
Cottage Grove PD 1 0 1
Court 146 78 224
Cross Plains PD 1 0 1
Dane County Department of Human Services 38 36 74
Dane County Sheriff's Office 18 10 28
Deforest PD 1 1 2
Fitchburg PD 14 5 19
Madison PD 168 92 260
Maple Bluff PD 1 0 1
Marshall PD 1 0 1
McFarland PD 6 0 6
Middleton PD 4 3 7
Monona PD 3 4 7
Mount Horeb PD 3 0 3
Oregon PD 5 1 6
Other County 38 14 52
Shorewood Hills PD 4 0 4
Stoughton PD 4 0 4
Sun Prairie PD 25 10 35
Town of Madison PD 7 2 9
University of Wisconsin PD 1 0 1
Verona PD 4 1 5
Voluntary Referral 6 11 17
Waunakee PD 2 0 2
Wisconsin State Patrol 0 1 1
Total 502 269 771
16
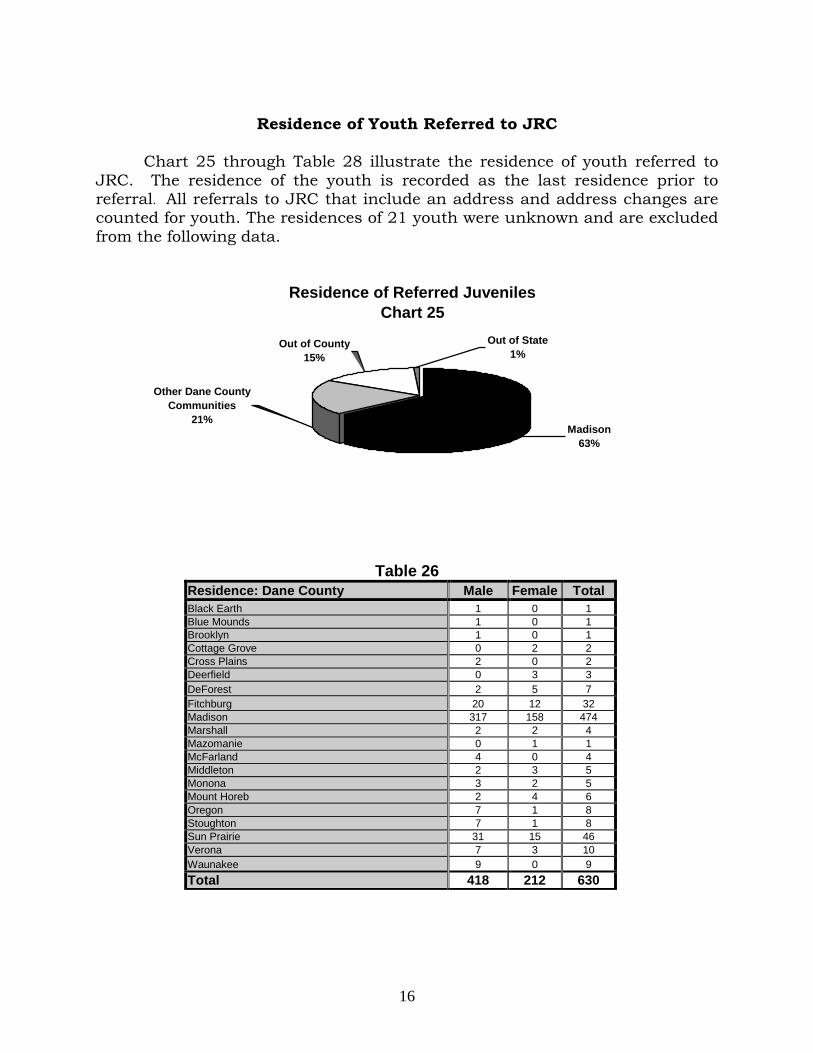
Residence of Youth Referred to JRC
Chart 25 through Table 28 illustrate the residence of youth referred to
JRC. The residence of the youth is recorded as the last residence prior to referral. All referrals to JRC that include an address and address changes are counted for youth. The residences of 21 youth were unknown and are excluded
from the following data.
Table 26
Residence: Dane County Male Female Total
Black Earth 1 0 1
Blue Mounds 1 0 1
Brooklyn 1 0 1
Cottage Grove 0 2 2
Cross Plains 2 0 2
Deerfield 0 3 3
DeForest 2 5 7
Fitchburg 20 12 32
Madison 317 158 474
Marshall 2 2 4
Mazomanie 0 1 1
McFarland 4 0 4
Middleton 2 3 5
Monona 3 2 5
Mount Horeb 2 4 6
Oregon 7 1 8
Stoughton 7 1 8
Sun Prairie 31 15 46
Verona 7 3 10
Waunakee 9 0 9
Total 418 212 630
Residence of Referred Juveniles
Chart 25
Out of County
15%
Other Dane County
Communities
21%Madison
63%
Out of State
1%
17
Table 27
Residence: Other Wisconsin Counties Male Female Total
Burnett 2 0 2
Columbia 20 1 21
Dodge 0 1 1
Eau Claire 0 2 2
Fon du Lac 1 0 1
Grant 6 0 6
Green 1 8 9
Jefferson 2 1 3
Lincoln 5 1 6
Milwaukee 3 5 8
Ozaukee 0 1 1
Portage 0 1 1
Rock 8 0 8
Sauk 16 11 27
Vernon 1 0 1
Walworth 0 12 12
Waukesha 4 1 5
Wood 0 1 1
Total 69 46 115
Table 28
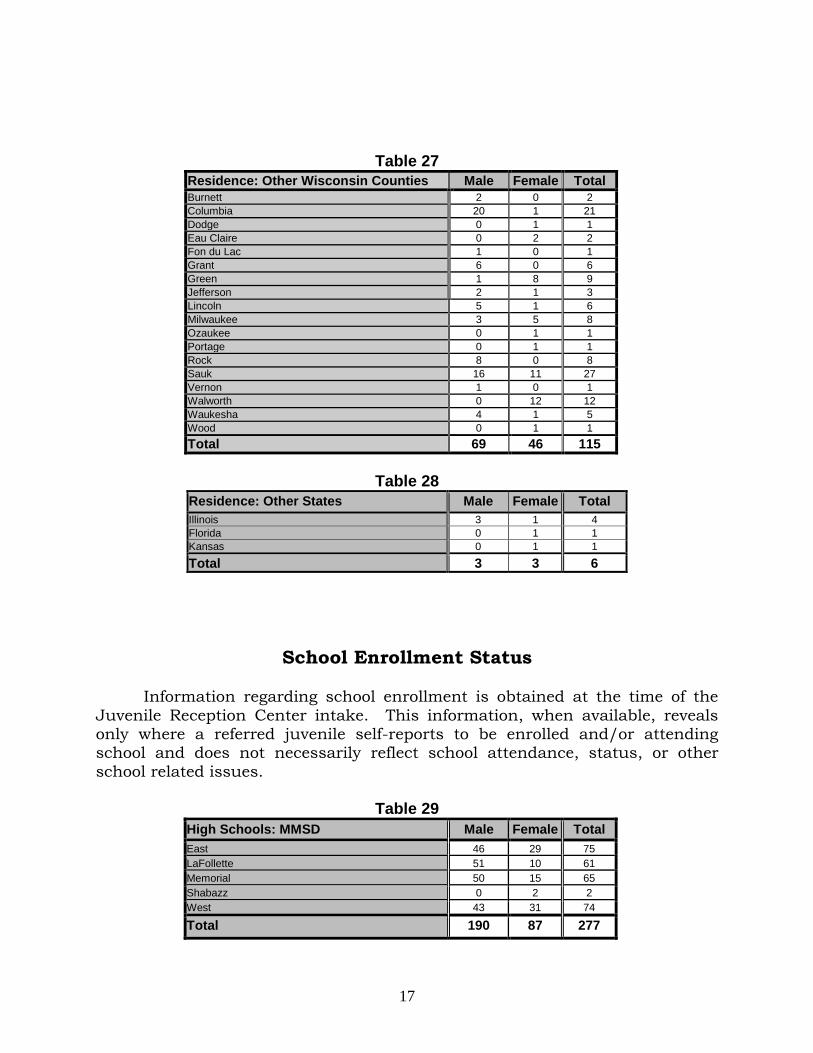
School Enrollment Status Information regarding school enrollment is obtained at the time of the
Juvenile Reception Center intake. This information, when available, reveals only where a referred juvenile self-reports to be enrolled and/or attending school and does not necessarily reflect school attendance, status, or other
school related issues.
Table 29
High Schools: MMSD Male Female Total
East 46 29 75
LaFollette 51 10 61
Memorial 50 15 65
Shabazz 0 2 2
West 43 31 74
Total 190 87 277
Residence: Other States Male Female Total
Illinois 3 1 4
Florida 0 1 1
Kansas 0 1 1
Total 3 3 6
18
Table 30
Middle and Elementary Schools: MMSD Male Female Total
Allis 0 1 1
Blackhawk 1 2 3
Cherokee 9 4 13
Hawthorne 1 0 1
Jefferson 9 0 9
Kennedy 1 0 1
Lincoln 1 0 1
O’Keeffe 1 5 6
Orchard Ridge 3 0 3
Savannah Oaks 1 0 1
Sennett 13 5 18
Sherman 2 1 3
Spring Harbor 0 2 2
Toki 2 4 6
Whitehorse 2 3 5
Wright 1 0 1
Total 47 27 74
Table 31
Table 32
Enrolled: Outside MMSD Male Female Total
Deerfield 0 2 2
DeForest 5 3 8
DOJC/LHS 5 0 5
Marshall 2 1 3
McFarland 6 0 6
Middleton 9 2 11
Monona 2 2 4
Mount Horeb 4 3 7
Oregon 10 1 11
Other 8 0 8
Out of County 69 46 115
Out of State 3 3 6
Stoughton 6 3 9
Sun Prairie 23 9 32
Verona 15 8 23
Waunakee 6 0 6
Wisconsin Heights 3 0 3
Total 176 83 259
Table 33
Male Female Total
Not Enrolled 19 18 37
Information Unavailable 28 30 58
Other Madison Area Programs: Male Female Total
Private, OFS, Home, GED, LEAP, Phoenix, Replay,
School w/in a School, etc.
Total 42 24 66
19
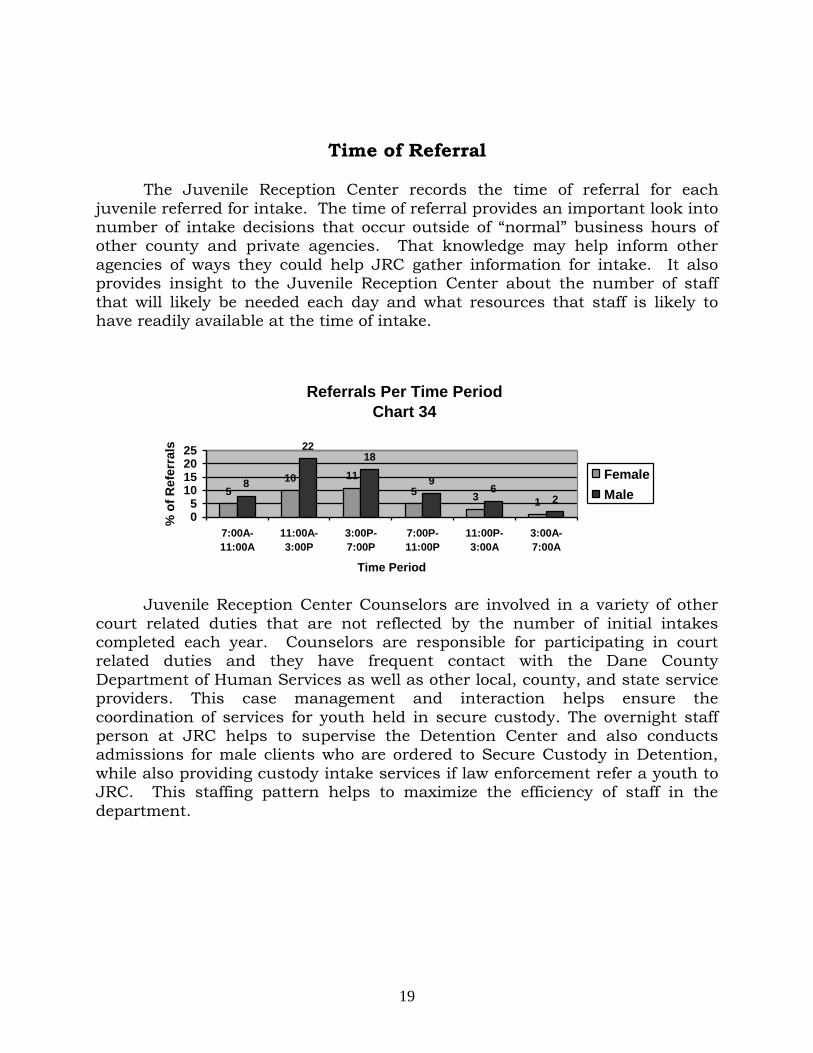
Time of Referral The Juvenile Reception Center records the time of referral for each
juvenile referred for intake. The time of referral provides an important look into number of intake decisions that occur outside of “normal” business hours of other county and private agencies. That knowledge may help inform other
agencies of ways they could help JRC gather information for intake. It also provides insight to the Juvenile Reception Center about the number of staff
that will likely be needed each day and what resources that staff is likely to have readily available at the time of intake.
Juvenile Reception Center Counselors are involved in a variety of other
court related duties that are not reflected by the number of initial intakes completed each year. Counselors are responsible for participating in court related duties and they have frequent contact with the Dane County
Department of Human Services as well as other local, county, and state service providers. This case management and interaction helps ensure the
coordination of services for youth held in secure custody. The overnight staff person at JRC helps to supervise the Detention Center and also conducts admissions for male clients who are ordered to Secure Custody in Detention,
while also providing custody intake services if law enforcement refer a youth to JRC. This staffing pattern helps to maximize the efficiency of staff in the
department.
Referrals Per Time Period
Chart 34
5
10 11
53
1
8
2218
96
2
05
10152025
7:00A-
11:00A
11:00A-
3:00P
3:00P-
7:00P
7:00P-
11:00P
11:00P-
3:00A
3:00A-
7:00A
Time Period
% o
f R
efe
rra
ls
Female
Male
20
Juvenile Detention
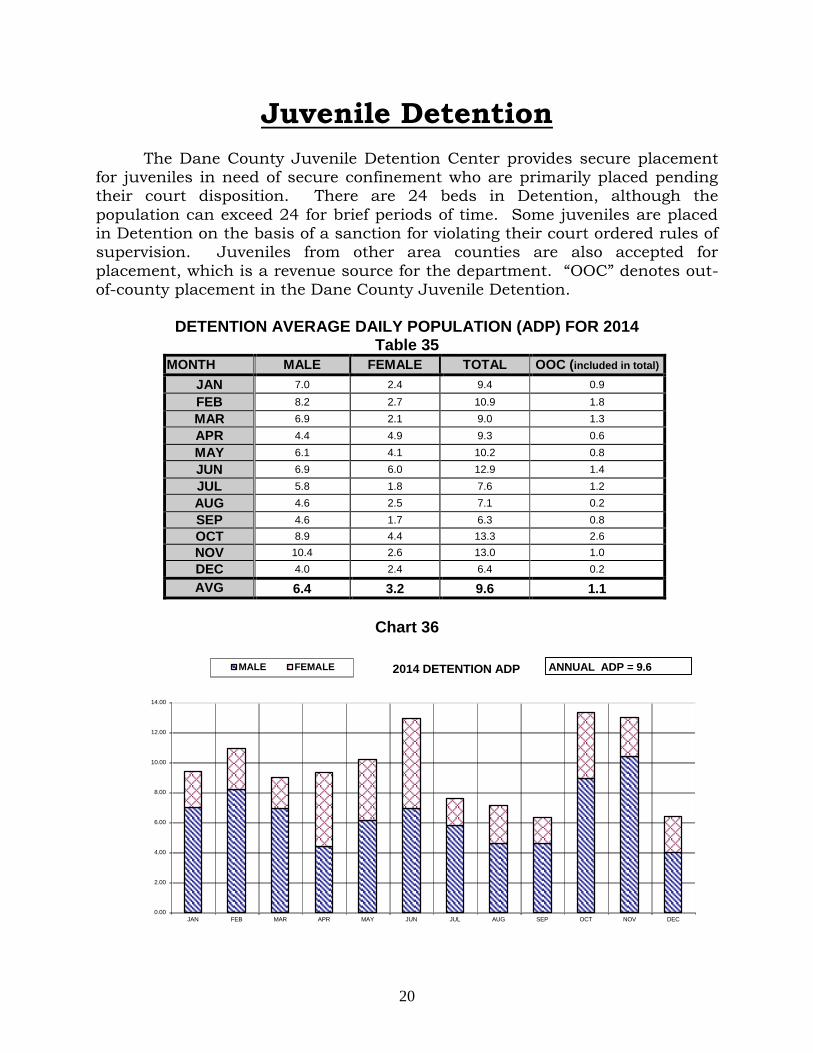
The Dane County Juvenile Detention Center provides secure placement for juveniles in need of secure confinement who are primarily placed pending their court disposition. There are 24 beds in Detention, although the
population can exceed 24 for brief periods of time. Some juveniles are placed in Detention on the basis of a sanction for violating their court ordered rules of supervision. Juveniles from other area counties are also accepted for
placement, which is a revenue source for the department. “OOC” denotes out-of-county placement in the Dane County Juvenile Detention.
DETENTION AVERAGE DAILY POPULATION (ADP) FOR 2014
Table 35
MONTH MALE FEMALE TOTAL OOC (included in total)
JAN 7.0 2.4 9.4 0.9
FEB 8.2 2.7 10.9 1.8
MAR 6.9 2.1 9.0 1.3
APR 4.4 4.9 9.3 0.6
MAY 6.1 4.1 10.2 0.8
JUN 6.9 6.0 12.9 1.4
JUL 5.8 1.8 7.6 1.2
AUG 4.6 2.5 7.1 0.2
SEP 4.6 1.7 6.3 0.8
OCT 8.9 4.4 13.3 2.6
NOV 10.4 2.6 13.0 1.0
DEC 4.0 2.4 6.4 0.2
AVG 6.4 3.2 9.6 1.1
Chart 36
0.00
2.00
4.00
6.00
8.00
10.00
12.00
14.00
JAN FEB MAR APR MAY JUN JUL AUG SEP OCT NOV DEC
2014 DETENTION ADPMALE FEMALE ANNUAL ADP = 9.6
21
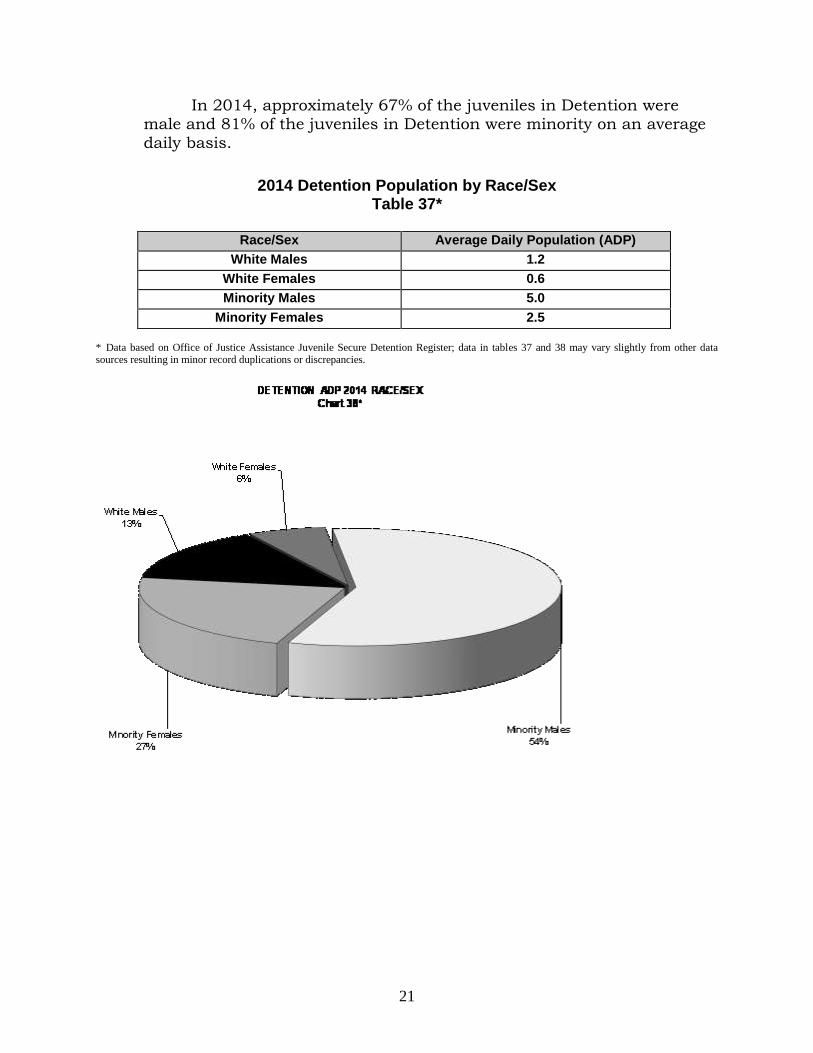
In 2014, approximately 67% of the juveniles in Detention were male and 81% of the juveniles in Detention were minority on an average
daily basis.
2014 Detention Population by Race/Sex
Table 37*
Race/Sex Average Daily Population (ADP) White Males 1.2
White Females 0.6 Minority Males 5.0
Minority Females 2.5
* Data based on Office of Justice Assistance Juvenile Secure Detention Register; data in tables 37 and 38 may vary slightly from other data sources resulting in minor record duplications or discrepancies.
22
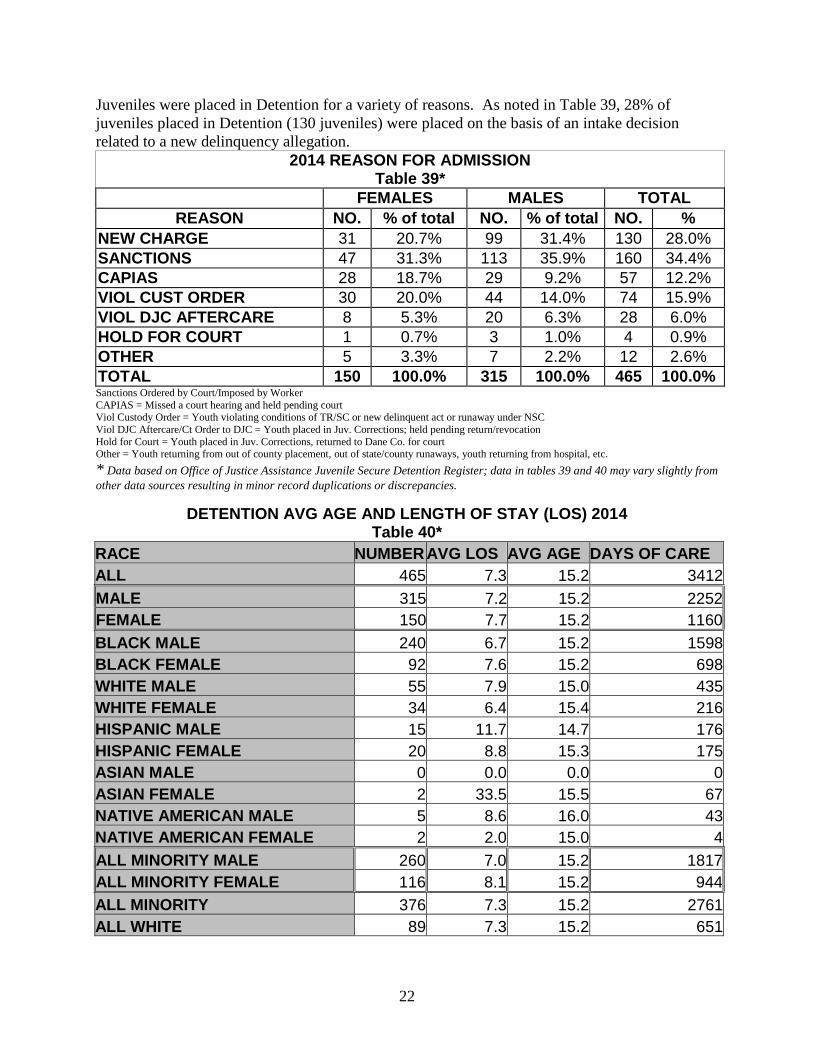
Juveniles were placed in Detention for a variety of reasons. As noted in Table 39, 28% of
juveniles placed in Detention (130 juveniles) were placed on the basis of an intake decision
related to a new delinquency allegation.
2014 REASON FOR ADMISSION Table 39*
FEMALES MALES TOTAL
REASON NO. % of total NO. % of total NO. %
NEW CHARGE 31 20.7% 99 31.4% 130 28.0%
SANCTIONS 47 31.3% 113 35.9% 160 34.4%
CAPIAS 28 18.7% 29 9.2% 57 12.2%
VIOL CUST ORDER 30 20.0% 44 14.0% 74 15.9%
VIOL DJC AFTERCARE 8 5.3% 20 6.3% 28 6.0%
HOLD FOR COURT 1 0.7% 3 1.0% 4 0.9%
OTHER 5 3.3% 7 2.2% 12 2.6%
TOTAL 150 100.0% 315 100.0% 465 100.0% Sanctions Ordered by Court/Imposed by Worker
CAPIAS = Missed a court hearing and held pending court Viol Custody Order = Youth violating conditions of TR/SC or new delinquent act or runaway under NSC
Viol DJC Aftercare/Ct Order to DJC = Youth placed in Juv. Corrections; held pending return/revocation
Hold for Court = Youth placed in Juv. Corrections, returned to Dane Co. for court Other = Youth returning from out of county placement, out of state/county runaways, youth returning from hospital, etc.
* Data based on Office of Justice Assistance Juvenile Secure Detention Register; data in tables 39 and 40 may vary slightly from
other data sources resulting in minor record duplications or discrepancies.
DETENTION AVG AGE AND LENGTH OF STAY (LOS) 2014 Table 40*
RACE NUMBER AVG LOS AVG AGE DAYS OF CARE
ALL 465 7.3 15.2 3412
MALE 315 7.2 15.2 2252
FEMALE 150 7.7 15.2 1160
BLACK MALE 240 6.7 15.2 1598
BLACK FEMALE 92 7.6 15.2 698
WHITE MALE 55 7.9 15.0 435
WHITE FEMALE 34 6.4 15.4 216
HISPANIC MALE 15 11.7 14.7 176
HISPANIC FEMALE 20 8.8 15.3 175
ASIAN MALE 0 0.0 0.0 0
ASIAN FEMALE 2 33.5 15.5 67
NATIVE AMERICAN MALE 5 8.6 16.0 43
NATIVE AMERICAN FEMALE 2 2.0 15.0 4
ALL MINORITY MALE 260 7.0 15.2 1817
ALL MINORITY FEMALE 116 8.1 15.2 944
ALL MINORITY 376 7.3 15.2 2761
ALL WHITE 89 7.3 15.2 651
23
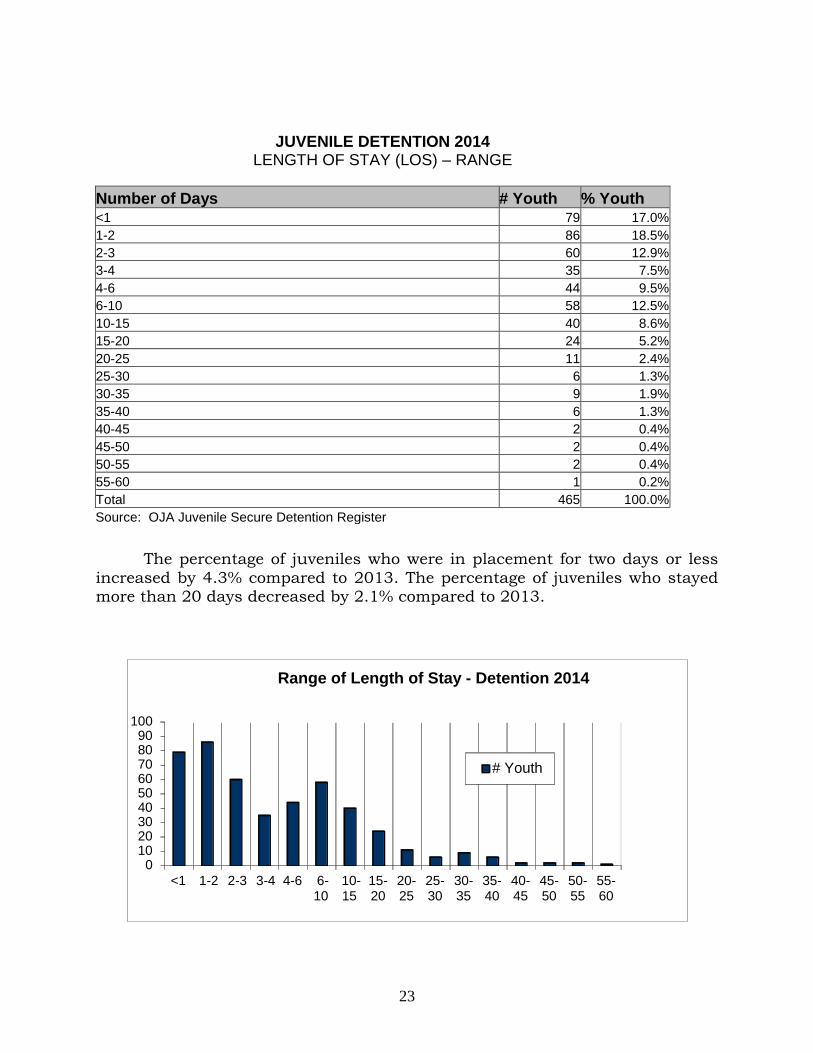
JUVENILE DETENTION 2014 LENGTH OF STAY (LOS) – RANGE
Number of Days # Youth % Youth <1 79 17.0%
1-2 86 18.5%
2-3 60 12.9%
3-4 35 7.5%
4-6 44 9.5%
6-10 58 12.5%
10-15 40 8.6%
15-20 24 5.2%
20-25 11 2.4%
25-30 6 1.3%
30-35 9 1.9%
35-40 6 1.3%
40-45 2 0.4%
45-50 2 0.4%
50-55 2 0.4%
55-60 1 0.2%
Total 465 100.0%
Source: OJA Juvenile Secure Detention Register
The percentage of juveniles who were in placement for two days or less
increased by 4.3% compared to 2013. The percentage of juveniles who stayed more than 20 days decreased by 2.1% compared to 2013.
0102030405060708090
100
<1 1-2 2-3 3-4 4-6 6-10
10-15
15-20
20-25
25-30
30-35
35-40
40-45
45-50
50-55
55-60
Range of Length of Stay - Detention 2014
# Youth
24
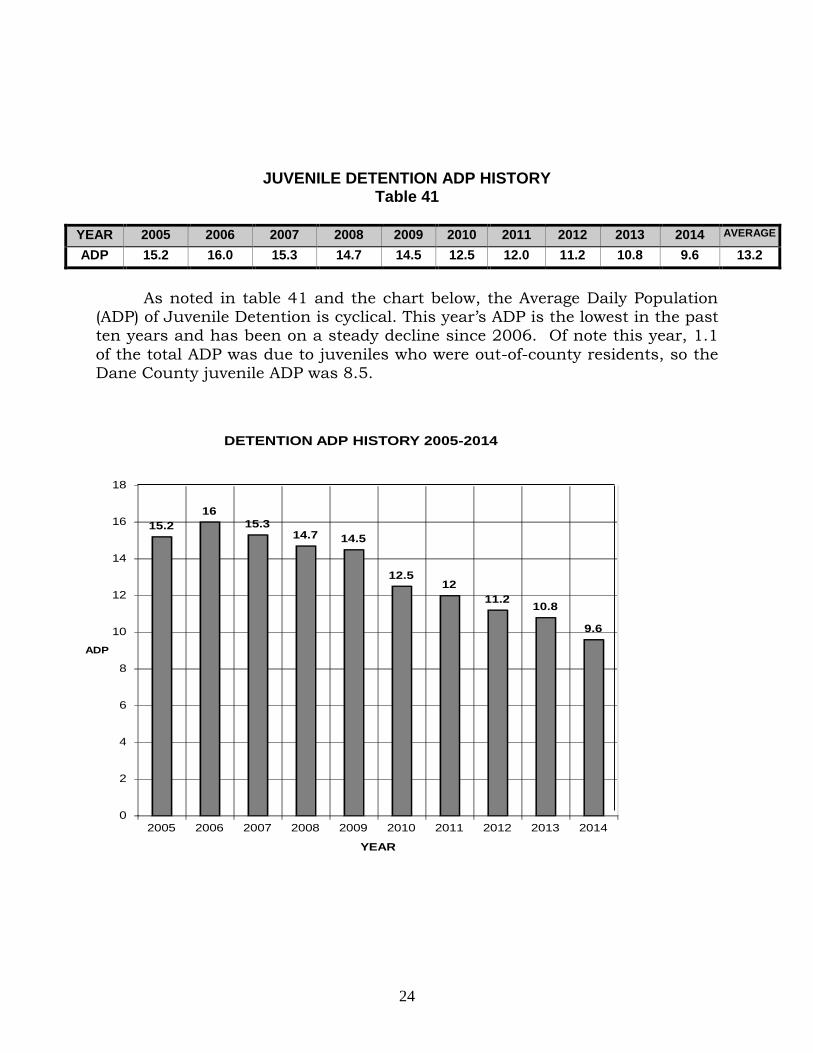
JUVENILE DETENTION ADP HISTORY
Table 41
YEAR 2005 2006 2007 2008 2009 2010 2011 2012 2013 2014 AVERAGE
ADP 15.2 16.0 15.3 14.7 14.5 12.5 12.0 11.2 10.8 9.6 13.2
As noted in table 41 and the chart below, the Average Daily Population (ADP) of Juvenile Detention is cyclical. This year’s ADP is the lowest in the past ten years and has been on a steady decline since 2006. Of note this year, 1.1
of the total ADP was due to juveniles who were out-of-county residents, so the Dane County juvenile ADP was 8.5.
15.2
16
15.314.7 14.5
12.512
11.210.8
9.6
0
2
4
6
8
10
12
14
16
18
2005 2006 2007 2008 2009 2010 2011 2012 2013 2014
ADP
YEAR
DETENTION ADP HISTORY 2005-2014
25
Juvenile Court Sanctions
One of the sanctions the Court may impose when a juvenile fails to comply with conditions of a court order is to place the juvenile in the secure detention facility or non-secure Shelter Home for a period of up to ten days per
violation. In some cases, multiple violations result in consecutive sanctions being imposed (e.g. three violations could result in a sanction of thirty days).
In 2000, the District Attorney’s Office, the Juvenile Court Program, and
other County service providers collectively united to initiate the Weekend Report Center at NIP as an alternative to Sanctions in Detention. In addition to
the creation of the Weekend Report Center, the Courts also began ordering sanctions to places other than Detention; such orders placed some juveniles at the Dane County Shelter Home. Others were placed back in their parental
home with monitoring by an Electronic Monitoring Bracelet.
0
2
4
6
8
10
12
14
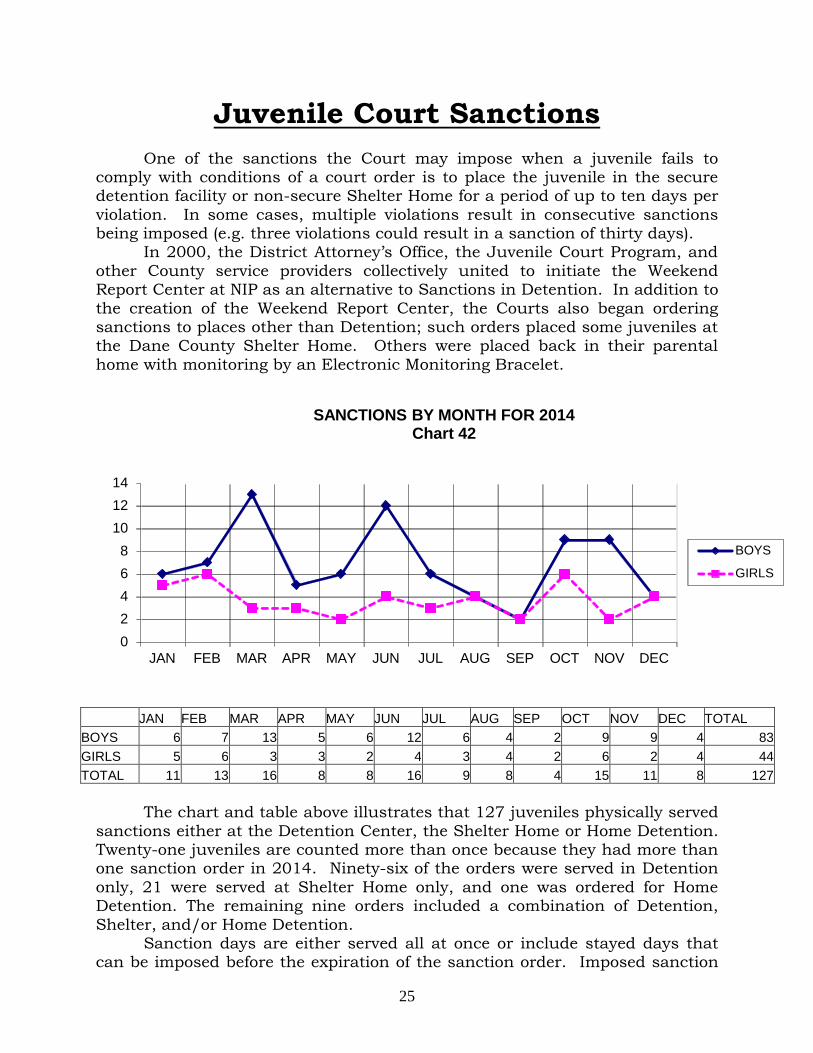
JAN FEB MAR APR MAY JUN JUL AUG SEP OCT NOV DEC
SANCTIONS BY MONTH FOR 2014Chart 42
BOYS
GIRLS
JAN FEB MAR APR MAY JUN JUL AUG SEP OCT NOV DEC TOTAL
BOYS 6 7 13 5 6 12 6 4 2 9 9 4 83
GIRLS 5 6 3 3 2 4 3 4 2 6 2 4 44
TOTAL 11 13 16 8 8 16 9 8 4 15 11 8 127
The chart and table above illustrates that 127 juveniles physically served
sanctions either at the Detention Center, the Shelter Home or Home Detention. Twenty-one juveniles are counted more than once because they had more than one sanction order in 2014. Ninety-six of the orders were served in Detention
only, 21 were served at Shelter Home only, and one was ordered for Home Detention. The remaining nine orders included a combination of Detention,
Shelter, and/or Home Detention. Sanction days are either served all at once or include stayed days that
can be imposed before the expiration of the sanction order. Imposed sanction
26
days are a part of the original sanction order, but the imposition of the days only occurs when the juvenile further violates the dispositional court order.
Sanction orders that were stayed without any days physically served are excluded from the data. The 127 sanction orders in 2014 where at least one
day was served resulted in a total of 216 sanction placements that totaled 1364 sanction days served for an average of 10.7 days served per order. Sixty-seven percent (919) of those days were served in Detention.
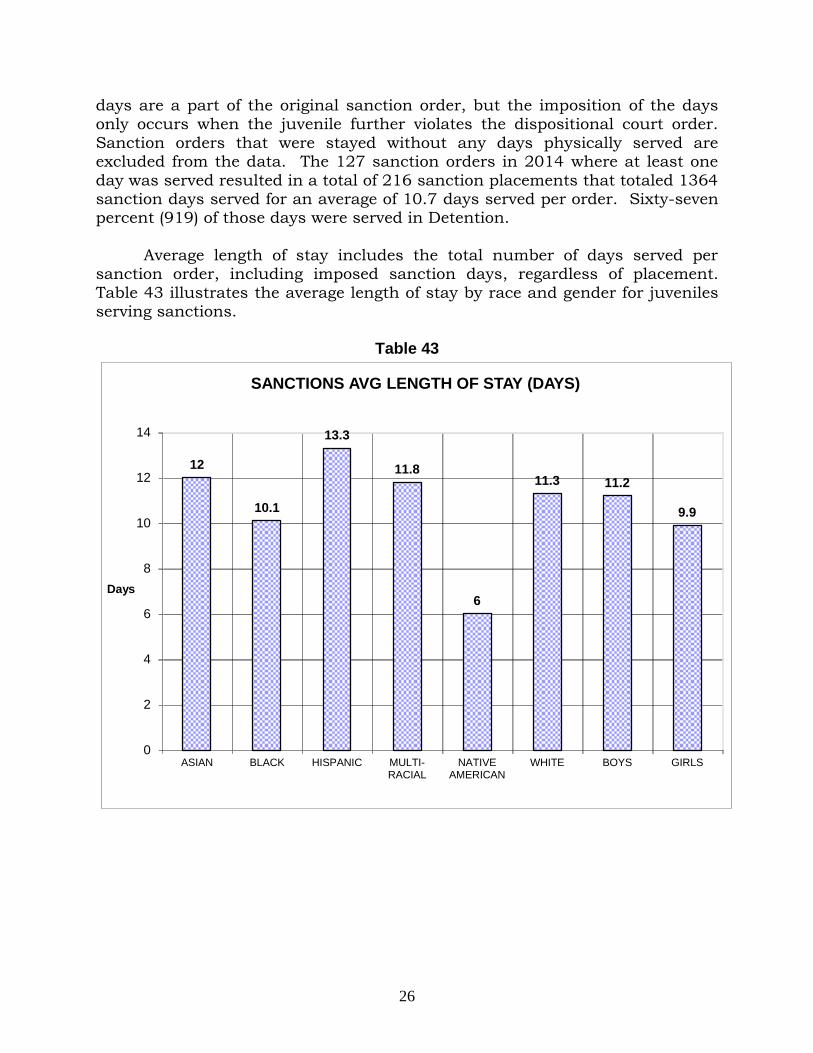
Average length of stay includes the total number of days served per
sanction order, including imposed sanction days, regardless of placement.
Table 43 illustrates the average length of stay by race and gender for juveniles serving sanctions.
Table 43
12
10.1
13.3
11.8
6
11.3 11.2
9.9
0
2
4
6
8
10
12
14
ASIAN BLACK HISPANIC MULTI-RACIAL
NATIVEAMERICAN
WHITE BOYS GIRLS
Days
SANCTIONS AVG LENGTH OF STAY (DAYS)
27
Juvenile Shelter Home
Located at 2402 Atwood Avenue, Madison, since 1975, the Shelter Home is Dane County's non-secure, short-term residential facility for juveniles who have been removed from their home or other placement and are awaiting court
action or another placement. Shelter Home serves up to a total of 16 boys and girls ranging in age from 10 through 17.
Residents are placed at Shelter Home by the Juvenile Reception Center
and/or by a court order entered by a Juvenile Court Commissioner or Dane County Juvenile Court Judge. Residents are placed for CHIPS or Delinquency
reasons and are under a temporary physical custody order. Residents may remain at Shelter Home for up to 60 days following each admission. Shelter Home can also accept residents placed on a basis of an "Emergency Change of
Placement" (Emergency-COP), pursuant to Wisconsin Statute 48.357 and 938.357. Residents placed under this status are admitted on the basis of
Shelter Home staff approval, require no physical custody order, and are limited by statute to 20 days. Residents can also be placed by Juvenile Court Judges to serve sanctions days. These placements represent days spent at Shelter
Home as a consequence for violation of a previous court order. Shelter Home can accept juveniles from other counties and also serves as an overnight resource for Briarpatch referrals.
The following tables and charts describe juveniles referred to the Shelter Home in a variety of ways. Note that admissions to Shelter Home are new
admissions that may be of the same juvenile.
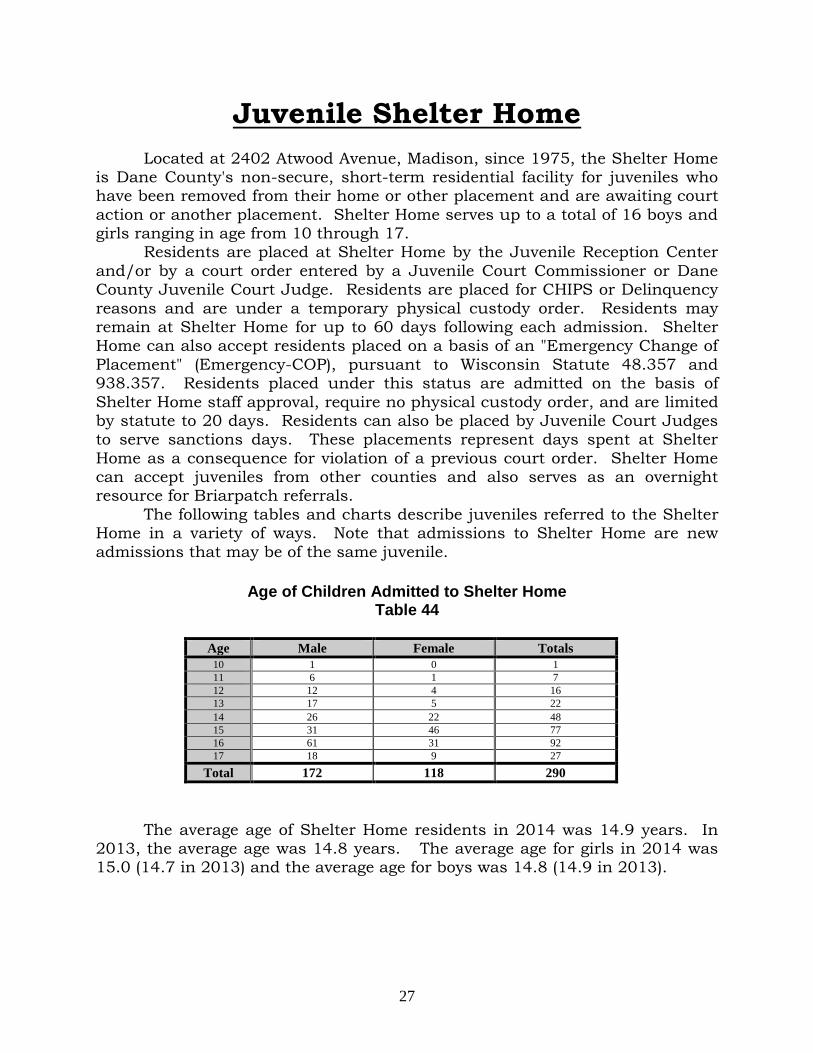
Age of Children Admitted to Shelter Home
Table 44
Age Male Female Totals
10 1 0 1
11 6 1 7
12 12 4 16
13 17 5 22
14 26 22 48
15 31 46 77
16 61 31 92
17 18 9 27
Total 172 118 290
The average age of Shelter Home residents in 2014 was 14.9 years. In 2013, the average age was 14.8 years. The average age for girls in 2014 was 15.0 (14.7 in 2013) and the average age for boys was 14.8 (14.9 in 2013).
28
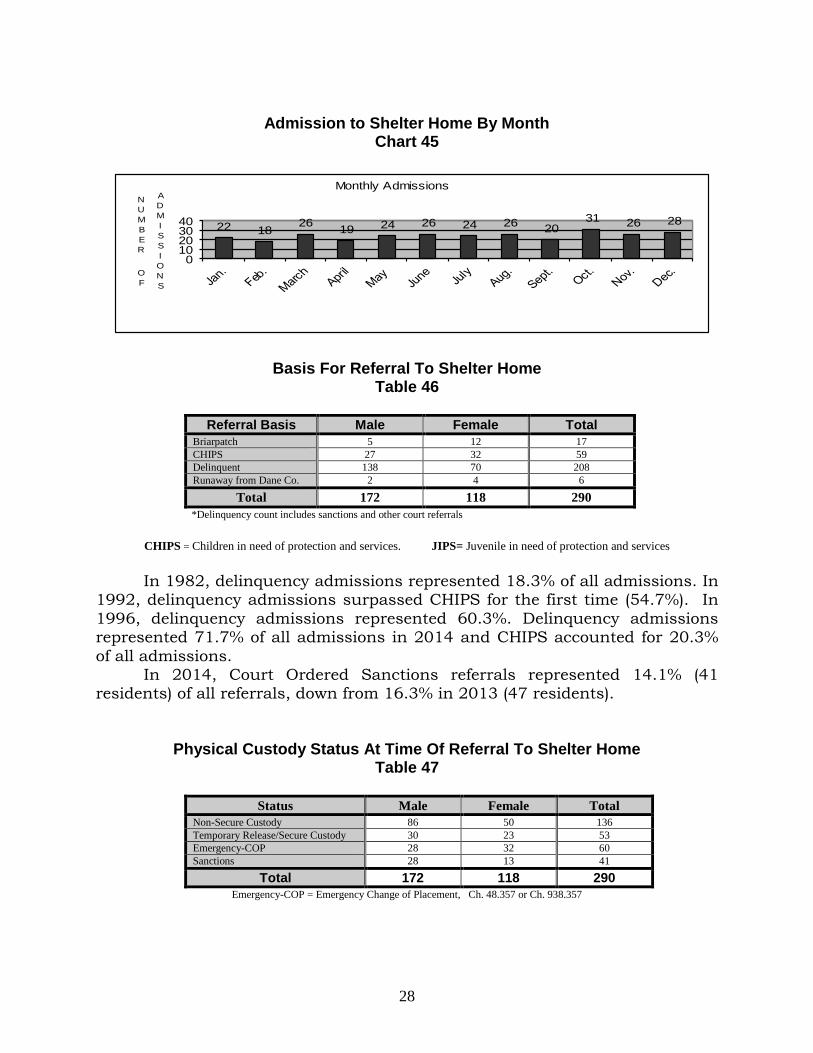
Admission to Shelter Home By Month Chart 45
Basis For Referral To Shelter Home Table 46
Referral Basis Male Female Total
Briarpatch 5 12 17
CHIPS 27 32 59
Delinquent 138 70 208
Runaway from Dane Co. 2 4 6
Total 172 118 290
*Delinquency count includes sanctions and other court referrals
CHIPS = Children in need of protection and services. JIPS= Juvenile in need of protection and services
In 1982, delinquency admissions represented 18.3% of all admissions. In 1992, delinquency admissions surpassed CHIPS for the first time (54.7%). In
1996, delinquency admissions represented 60.3%. Delinquency admissions represented 71.7% of all admissions in 2014 and CHIPS accounted for 20.3%
of all admissions. In 2014, Court Ordered Sanctions referrals represented 14.1% (41
residents) of all referrals, down from 16.3% in 2013 (47 residents).
Physical Custody Status At Time Of Referral To Shelter Home Table 47
Status Male Female Total
Non-Secure Custody 86 50 136
Temporary Release/Secure Custody 30 23 53
Emergency-COP 28 32 60
Sanctions 28 13 41
Total 172 118 290
Emergency-COP = Emergency Change of Placement, Ch. 48.357 or Ch. 938.357
22 1826
19 24 26 24 2620
31 26 28
010203040
N
U
M
B
E
R
O
F
A
D
M
I
S
S
I
O
N
S
Monthly Admissions
29
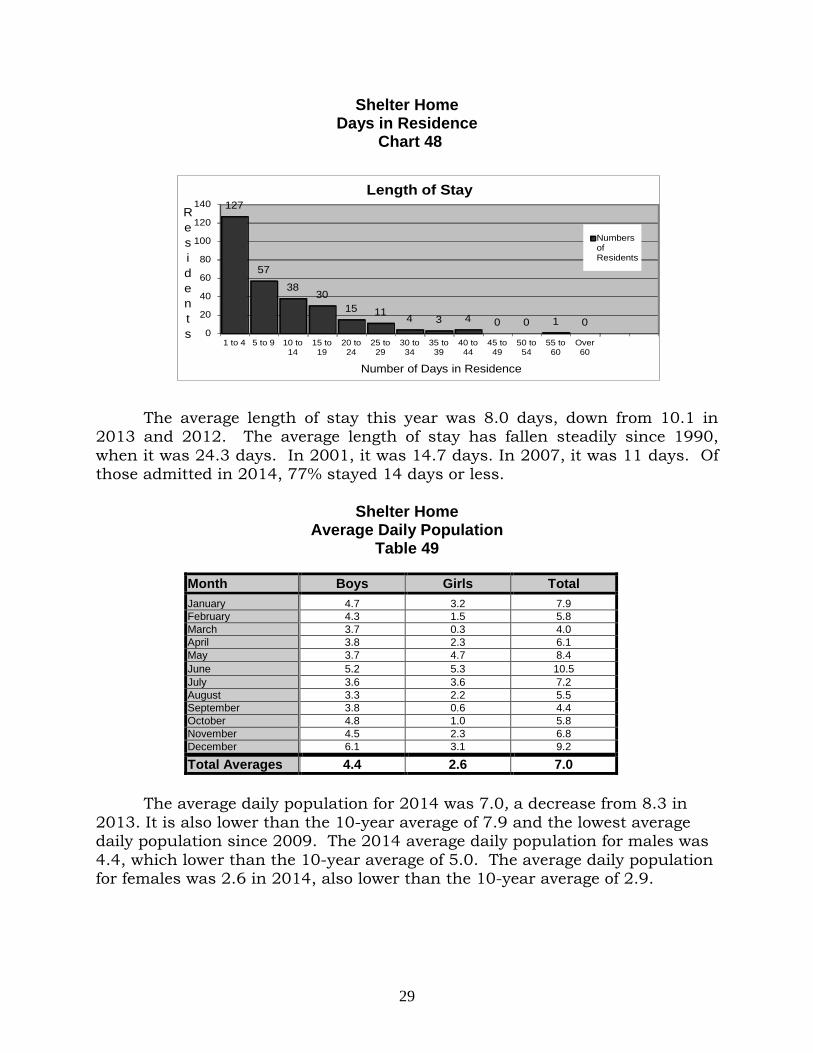
Shelter Home Days in Residence
Chart 48
The average length of stay this year was 8.0 days, down from 10.1 in 2013 and 2012. The average length of stay has fallen steadily since 1990,
when it was 24.3 days. In 2001, it was 14.7 days. In 2007, it was 11 days. Of those admitted in 2014, 77% stayed 14 days or less.
Shelter Home
Average Daily Population Table 49
Month Boys Girls Total
January 4.7 3.2 7.9
February 4.3 1.5 5.8
March 3.7 0.3 4.0
April 3.8 2.3 6.1
May 3.7 4.7 8.4
June 5.2 5.3 10.5
July 3.6 3.6 7.2
August 3.3 2.2 5.5
September 3.8 0.6 4.4
October 4.8 1.0 5.8
November 4.5 2.3 6.8
December 6.1 3.1 9.2
Total Averages 4.4 2.6 7.0
The average daily population for 2014 was 7.0, a decrease from 8.3 in
2013. It is also lower than the 10-year average of 7.9 and the lowest average daily population since 2009. The 2014 average daily population for males was
4.4, which lower than the 10-year average of 5.0. The average daily population for females was 2.6 in 2014, also lower than the 10-year average of 2.9.
127
57
3830
15 114 3 4 0 0 1 0
0
20
40
60
80
100
120
140
1 to 4 5 to 9 10 to14
15 to19
20 to24
25 to29
30 to34
35 to39
40 to44
45 to49
50 to54
55 to60
Over60
R
e
s
i
d
e
n
t
s
Number of Days in Residence
Length of Stay
NumbersofResidents
30
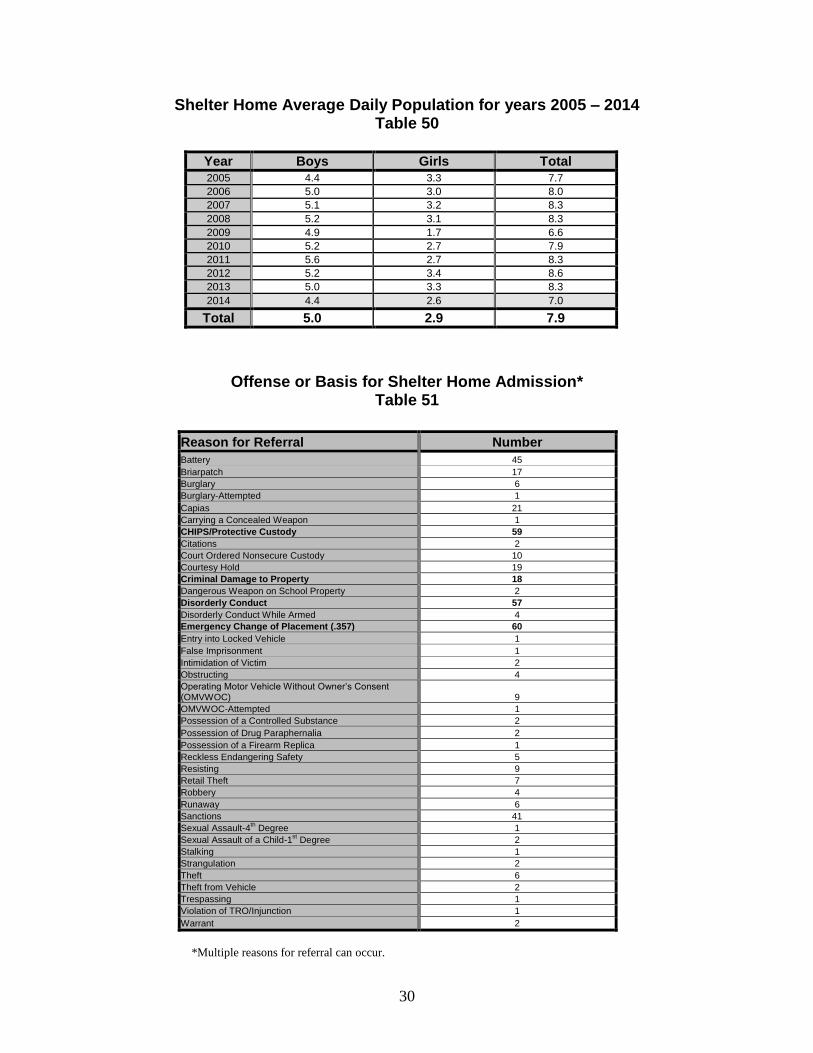
Shelter Home Average Daily Population for years 2005 – 2014 Table 50
Year Boys Girls Total
2005 4.4 3.3 7.7
2006 5.0 3.0 8.0
2007 5.1 3.2 8.3
2008 5.2 3.1 8.3
2009 4.9 1.7 6.6
2010 5.2 2.7 7.9
2011 5.6 2.7 8.3
2012 5.2 3.4 8.6
2013 5.0 3.3 8.3
2014 4.4 2.6 7.0
Total 5.0 2.9 7.9
Offense or Basis for Shelter Home Admission* Table 51
Reason for Referral Number
Battery 45
Briarpatch 17
Burglary 6
Burglary-Attempted 1
Capias 21
Carrying a Concealed Weapon 1
CHIPS/Protective Custody 59
Citations 2
Court Ordered Nonsecure Custody 10
Courtesy Hold 19
Criminal Damage to Property 18
Dangerous Weapon on School Property 2
Disorderly Conduct 57
Disorderly Conduct While Armed 4
Emergency Change of Placement (.357) 60
Entry into Locked Vehicle 1
False Imprisonment 1
Intimidation of Victim 2
Obstructing 4
Operating Motor Vehicle Without Owner’s Consent (OMVWOC) 9
OMVWOC-Attempted 1
Possession of a Controlled Substance 2
Possession of Drug Paraphernalia 2
Possession of a Firearm Replica 1
Reckless Endangering Safety 5
Resisting 9
Retail Theft 7
Robbery 4
Runaway 6
Sanctions 41
Sexual Assault-4th Degree 1
Sexual Assault of a Child-1st Degree 2
Stalking 1
Strangulation 2
Theft 6
Theft from Vehicle 2
Trespassing 1
Violation of TRO/Injunction 1
Warrant 2
*Multiple reasons for referral can occur.
31
Emergency Change of Placement was the most frequent reason for referral in 2014 at 13.8% of referrals. CHIPS was the second most frequent
reason for referral in 2014 at 13.6%.
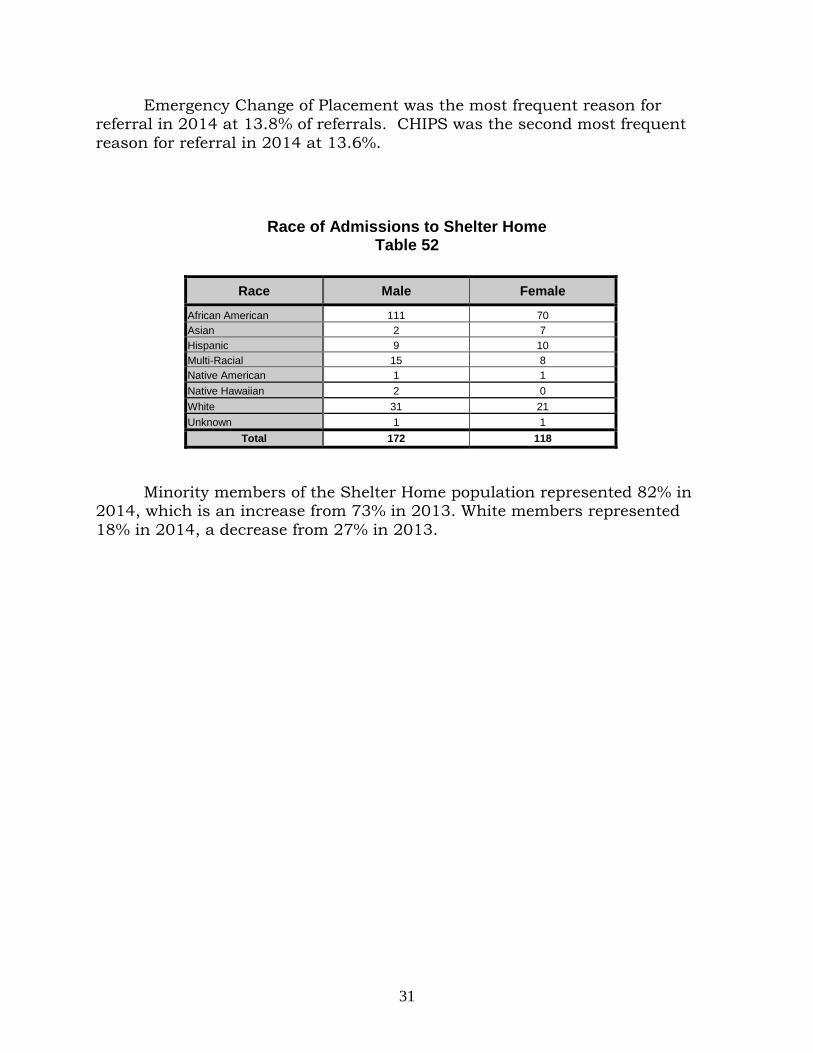
Race of Admissions to Shelter Home Table 52
Race Male Female
African American 111 70
Asian 2 7
Hispanic 9 10
Multi-Racial 15 8
Native American 1 1
Native Hawaiian 2 0
White 31 21
Unknown 1 1
Total 172 118
Minority members of the Shelter Home population represented 82% in 2014, which is an increase from 73% in 2013. White members represented
18% in 2014, a decrease from 27% in 2013.
32
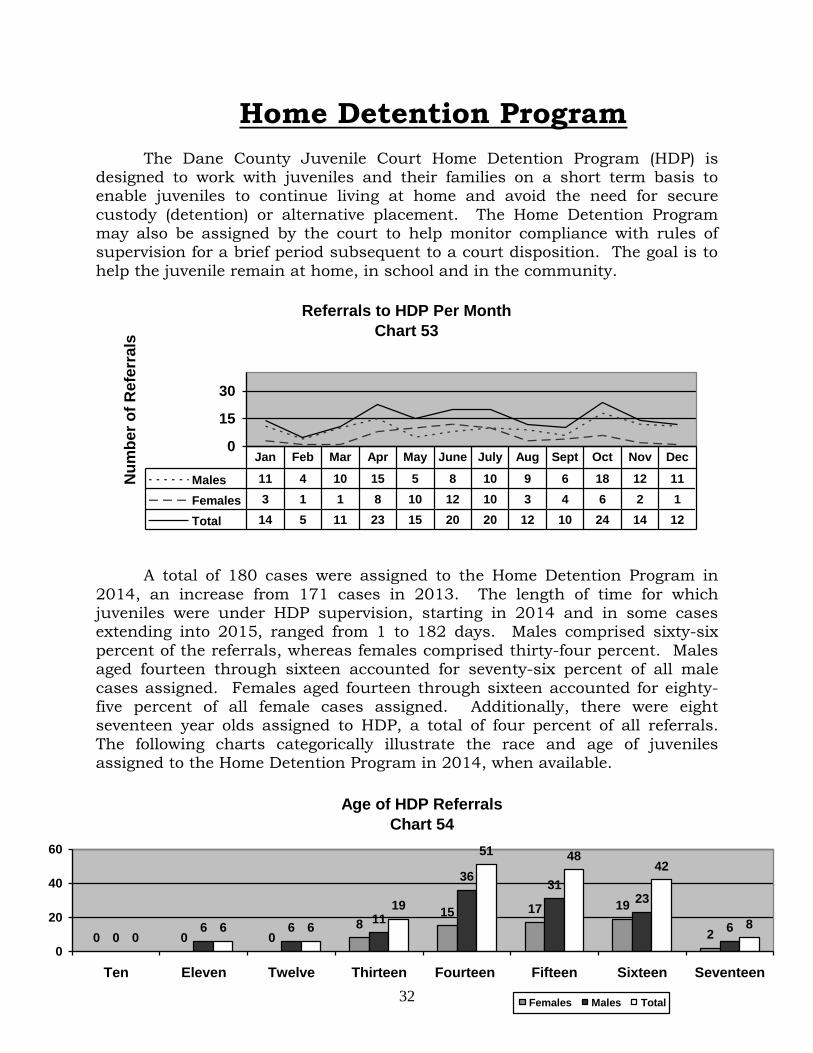
Home Detention Program
The Dane County Juvenile Court Home Detention Program (HDP) is designed to work with juveniles and their families on a short term basis to enable juveniles to continue living at home and avoid the need for secure
custody (detention) or alternative placement. The Home Detention Program may also be assigned by the court to help monitor compliance with rules of supervision for a brief period subsequent to a court disposition. The goal is to
help the juvenile remain at home, in school and in the community.
A total of 180 cases were assigned to the Home Detention Program in
2014, an increase from 171 cases in 2013. The length of time for which juveniles were under HDP supervision, starting in 2014 and in some cases extending into 2015, ranged from 1 to 182 days. Males comprised sixty-six
percent of the referrals, whereas females comprised thirty-four percent. Males aged fourteen through sixteen accounted for seventy-six percent of all male
cases assigned. Females aged fourteen through sixteen accounted for eighty-five percent of all female cases assigned. Additionally, there were eight seventeen year olds assigned to HDP, a total of four percent of all referrals.
The following charts categorically illustrate the race and age of juveniles assigned to the Home Detention Program in 2014, when available.
Referrals to HDP Per Month
Chart 53
0
15
30
Nu
mb
er
of
Refe
rrals
Males 11 4 10 15 5 8 10 9 6 18 12 11
Females 3 1 1 8 10 12 10 3 4 6 2 1
Total 14 5 11 23 15 20 20 12 10 24 14 12
Jan Feb Mar Apr May June July Aug Sept Oct Nov Dec
Age of HDP Referrals
Chart 54
0 0 08
15 17 19
206 6
11
3631
23
60
6 6
19
51 4842
8
0
20
40
60
Ten Eleven Twelve Thirteen Fourteen Fifteen Sixteen Seventeen
Females Males Total
33
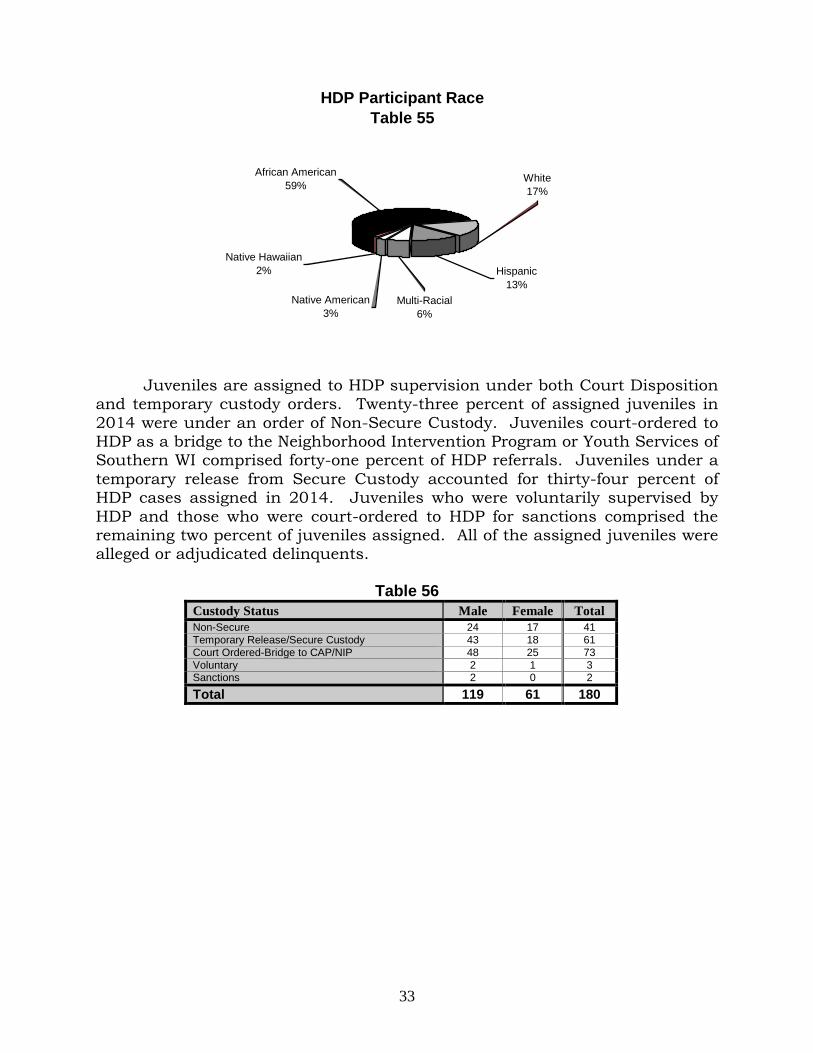
Juveniles are assigned to HDP supervision under both Court Disposition
and temporary custody orders. Twenty-three percent of assigned juveniles in
2014 were under an order of Non-Secure Custody. Juveniles court-ordered to HDP as a bridge to the Neighborhood Intervention Program or Youth Services of Southern WI comprised forty-one percent of HDP referrals. Juveniles under a
temporary release from Secure Custody accounted for thirty-four percent of HDP cases assigned in 2014. Juveniles who were voluntarily supervised by
HDP and those who were court-ordered to HDP for sanctions comprised the remaining two percent of juveniles assigned. All of the assigned juveniles were alleged or adjudicated delinquents.
Table 56
Custody Status Male Female Total
Non-Secure 24 17 41
Temporary Release/Secure Custody 43 18 61
Court Ordered-Bridge to CAP/NIP 48 25 73
Voluntary 2 1 3 Sanctions 2 0 2
Total 119 61 180
HDP Participant Race
Table 55
African American
59%
Multi-Racial
6%
Native American
3%
White
17%
Hispanic
13%
Native Hawaiian
2%
34
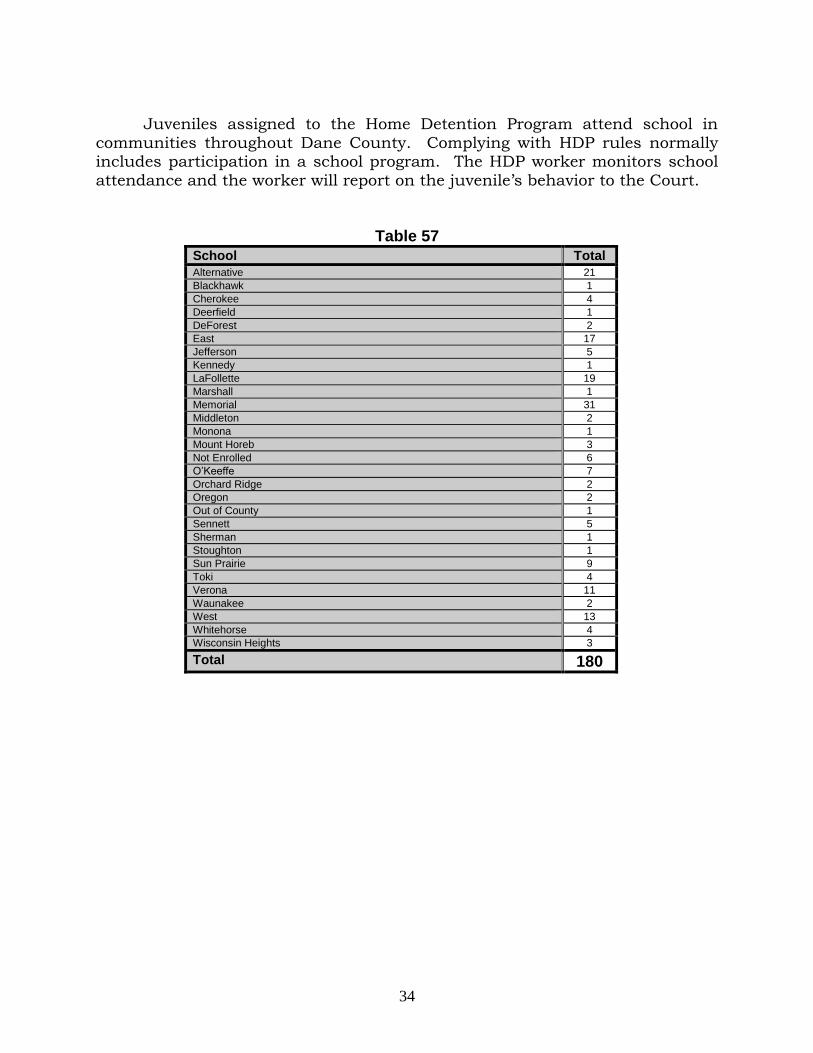
Juveniles assigned to the Home Detention Program attend school in
communities throughout Dane County. Complying with HDP rules normally includes participation in a school program. The HDP worker monitors school
attendance and the worker will report on the juvenile’s behavior to the Court.
Table 57 School Total
Alternative 21
Blackhawk 1
Cherokee 4
Deerfield 1
DeForest 2
East 17
Jefferson 5
Kennedy 1
LaFollette 19
Marshall 1
Memorial 31
Middleton 2
Monona 1
Mount Horeb 3
Not Enrolled 6
O’Keeffe 7
Orchard Ridge 2
Oregon 2
Out of County 1
Sennett 5
Sherman 1
Stoughton 1
Sun Prairie 9
Toki 4
Verona 11
Waunakee 2
West 13
Whitehorse 4
Wisconsin Heights 3
Total 180
35
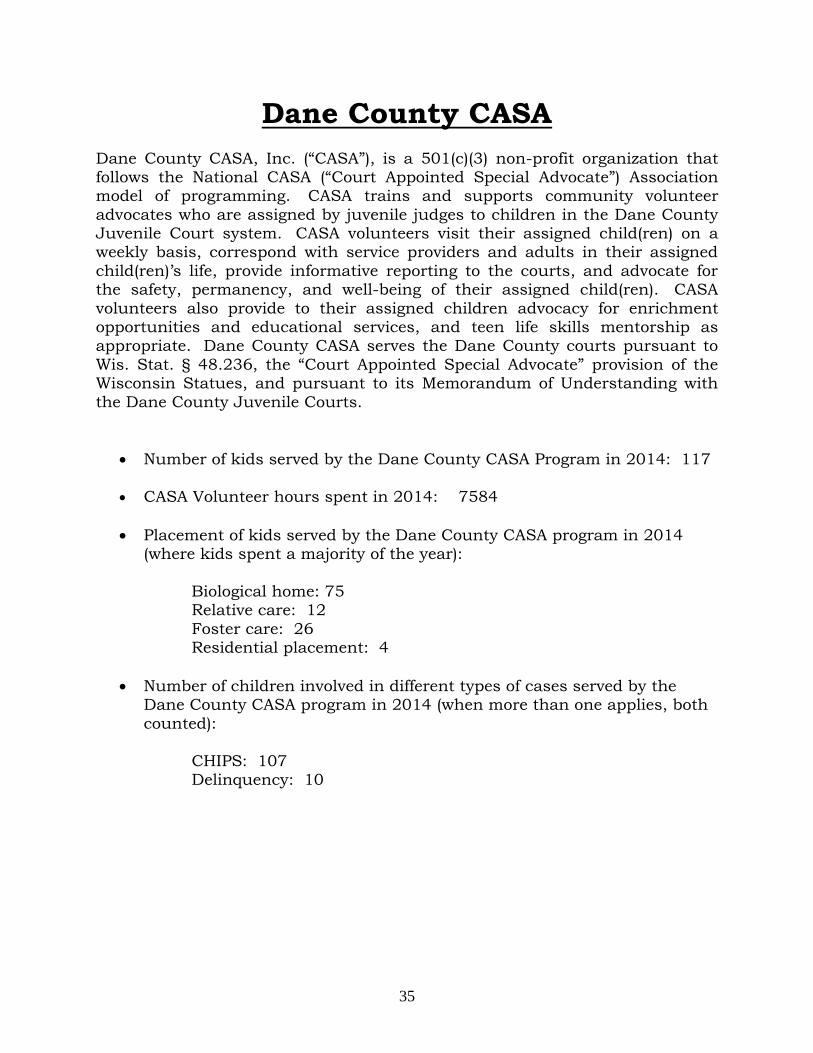
Dane County CASA
Dane County CASA, Inc. (“CASA”), is a 501(c)(3) non-profit organization that follows the National CASA (“Court Appointed Special Advocate”) Association model of programming. CASA trains and supports community volunteer
advocates who are assigned by juvenile judges to children in the Dane County Juvenile Court system. CASA volunteers visit their assigned child(ren) on a weekly basis, correspond with service providers and adults in their assigned
child(ren)’s life, provide informative reporting to the courts, and advocate for the safety, permanency, and well-being of their assigned child(ren). CASA
volunteers also provide to their assigned children advocacy for enrichment opportunities and educational services, and teen life skills mentorship as appropriate. Dane County CASA serves the Dane County courts pursuant to
Wis. Stat. § 48.236, the “Court Appointed Special Advocate” provision of the Wisconsin Statues, and pursuant to its Memorandum of Understanding with
the Dane County Juvenile Courts.
Number of kids served by the Dane County CASA Program in 2014: 117
CASA Volunteer hours spent in 2014: 7584
Placement of kids served by the Dane County CASA program in 2014 (where kids spent a majority of the year):
Biological home: 75
Relative care: 12
Foster care: 26 Residential placement: 4
Number of children involved in different types of cases served by the Dane County CASA program in 2014 (when more than one applies, both
counted):
CHIPS: 107 Delinquency: 10
36
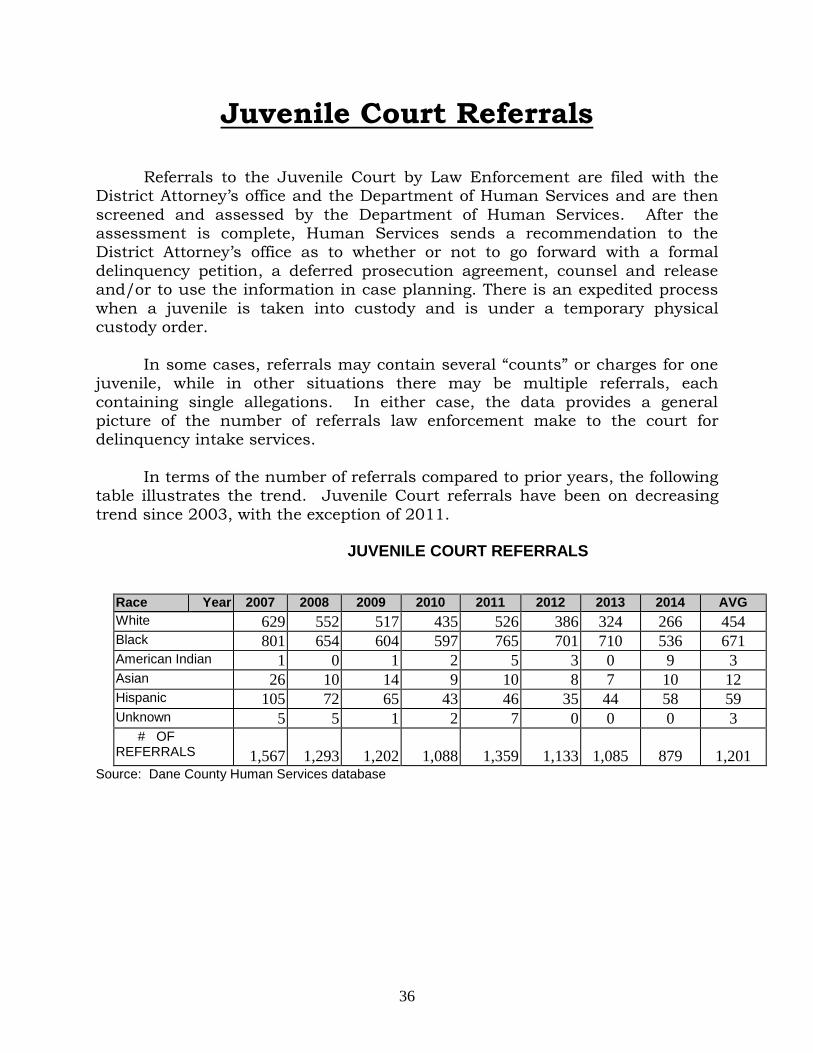
Juvenile Court Referrals
Referrals to the Juvenile Court by Law Enforcement are filed with the District Attorney’s office and the Department of Human Services and are then
screened and assessed by the Department of Human Services. After the assessment is complete, Human Services sends a recommendation to the District Attorney’s office as to whether or not to go forward with a formal
delinquency petition, a deferred prosecution agreement, counsel and release and/or to use the information in case planning. There is an expedited process
when a juvenile is taken into custody and is under a temporary physical custody order.
In some cases, referrals may contain several “counts” or charges for one juvenile, while in other situations there may be multiple referrals, each
containing single allegations. In either case, the data provides a general picture of the number of referrals law enforcement make to the court for delinquency intake services.
In terms of the number of referrals compared to prior years, the following table illustrates the trend. Juvenile Court referrals have been on decreasing
trend since 2003, with the exception of 2011.
JUVENILE COURT REFERRALS
Race Year 2007 2008 2009 2010 2011 2012 2013 2014 AVG
White 629 552 517 435 526 386 324 266 454 Black 801 654 604 597 765 701 710 536 671 American Indian 1 0 1 2 5 3 0 9 3 Asian 26 10 14 9 10 8 7 10 12 Hispanic 105 72 65 43 46 35 44 58 59 Unknown 5 5 1 2 7 0 0 0 3 # OF REFERRALS
1,567
1,293 1,202 1,088 1,359 1,133 1,085 879 1,201 Source: Dane County Human Services database
37
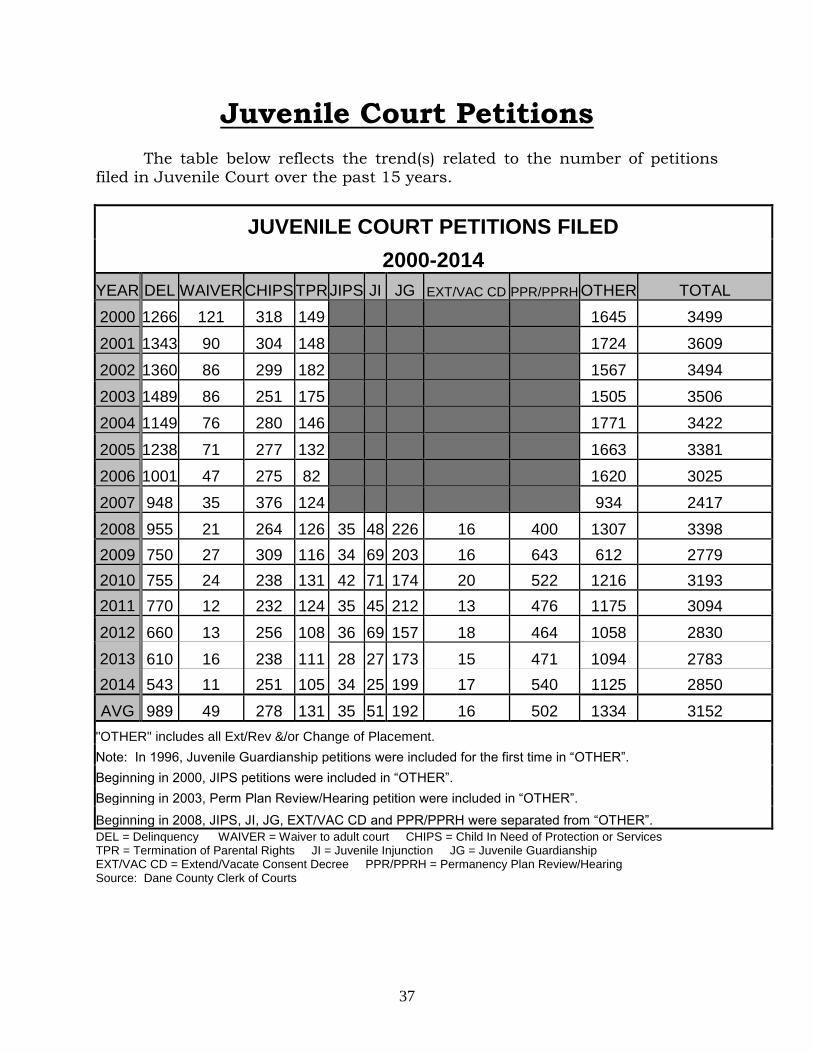
Juvenile Court Petitions
The table below reflects the trend(s) related to the number of petitions filed in Juvenile Court over the past 15 years.
JUVENILE COURT PETITIONS FILED
2000-2014
YEAR DEL WAIVER CHIPS TPR JIPS JI JG EXT/VAC CD PPR/PPRH OTHER TOTAL
2000 1266 121 318 149 1645 3499
2001 1343 90 304 148 1724 3609
2002 1360 86 299 182 1567 3494
2003 1489 86 251 175 1505 3506
2004 1149 76 280 146 1771 3422
2005 1238 71 277 132 1663 3381
2006 1001 47 275 82 1620 3025
2007 948 35 376 124 934 2417
2008 955 21 264 126 35 48 226 16 400 1307 3398
2009 750 27 309 116 34 69 203 16 643 612 2779
2010 755 24 238 131 42 71 174 20 522 1216 3193
2011 770 12 232 124 35 45 212 13 476 1175 3094
2012 660 13 256 108 36 69 157 18 464 1058 2830
2013 610 16 238 111 28 27 173 15 471 1094 2783
2014 543 11 251 105 34 25 199 17 540 1125 2850
AVG 989 49 278 131 35 51 192 16 502 1334 3152
"OTHER" includes all Ext/Rev &/or Change of Placement.
Note: In 1996, Juvenile Guardianship petitions were included for the first time in “OTHER”.
Beginning in 2000, JIPS petitions were included in “OTHER”.
Beginning in 2003, Perm Plan Review/Hearing petition were included in “OTHER”.
Beginning in 2008, JIPS, JI, JG, EXT/VAC CD and PPR/PPRH were separated from “OTHER”.
DEL = Delinquency WAIVER = Waiver to adult court CHIPS = Child In Need of Protection or Services TPR = Termination of Parental Rights JI = Juvenile Injunction JG = Juvenile Guardianship EXT/VAC CD = Extend/Vacate Consent Decree PPR/PPRH = Permanency Plan Review/Hearing Source: Dane County Clerk of Courts
38
Closing
The Juvenile Court Program looks forward to continuing to serve the people of Dane County and we are working hard to stay in tune with the changing needs of our diverse community.
Continuing in 2014, the entire Dane County Juvenile Court Program
(JRC, SH, Detention and HDP) kept a computerized database that was used to
collect and tabulate data. Data on juveniles in Detention was also collected in the State’s Juvenile Secure Detention Registry (JSDR). With this more
accurate and efficient method of dealing with statistics, the ability to deliver information about the trends and patterns affecting the youth of Dane County is greatly enhanced.
“Thank You” to all of the agencies who contributed to this report.
Questions, comments, or suggestions regarding this report, and/or the Juvenile Court Program generally, would be welcome and should be directed towards any of the persons listed below.
Bert Schaetz
Annual Report Coordinator/JRC Counselor Phone: (608) 266-4983
John Bauman
Juvenile Court Administrator
Phone: (608) 283-2925
Ed Pearson
Juvenile Detention Home Superintendent
Phone: (608) 283-2926
Suzanne Stute
Community Program Manager Phone: (608) 246-3277