Embed Size (px)
Citation preview
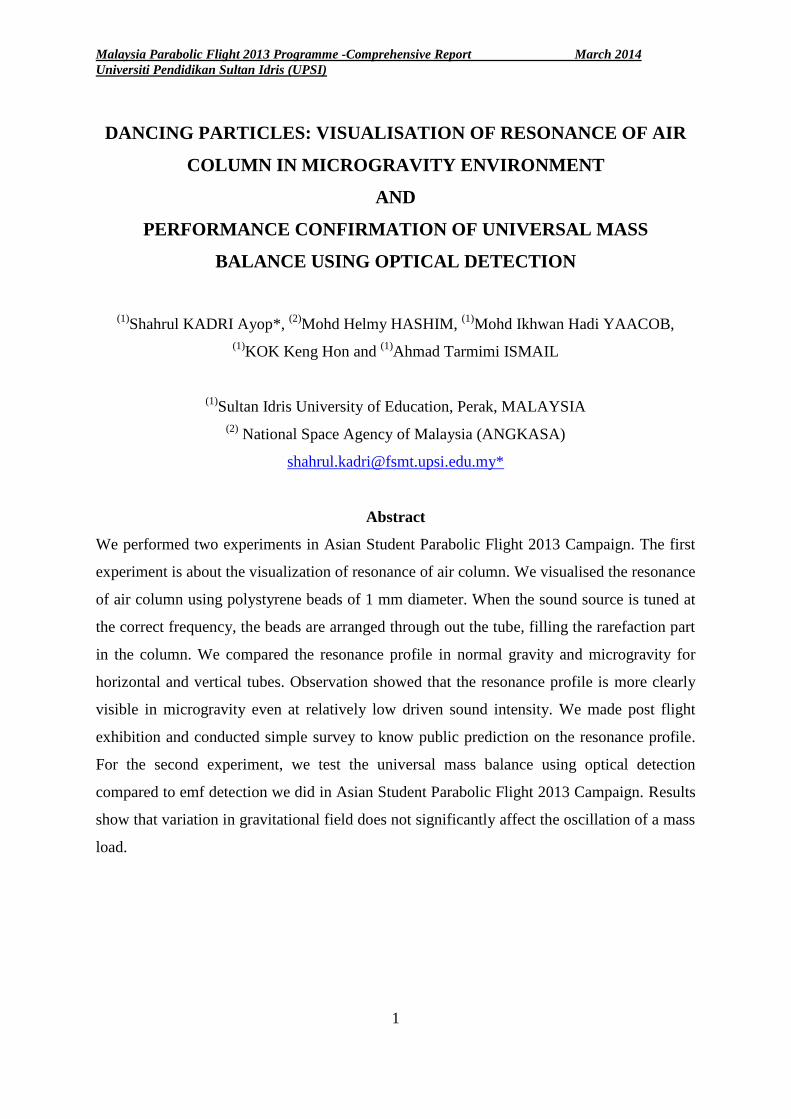
Malaysia Parabolic Flight 2013 Programme -Comprehensive Report March 2014
Universiti Pendidikan Sultan Idris (UPSI)
1
DANCING PARTICLES: VISUALISATION OF RESONANCE OF AIR
COLUMN IN MICROGRAVITY ENVIRONMENT
AND
PERFORMANCE CONFIRMATION OF UNIVERSAL MASS
BALANCE USING OPTICAL DETECTION
(1)Shahrul KADRI Ayop*,
(2)Mohd Helmy HASHIM,
(1)Mohd Ikhwan Hadi YAACOB,
(1)KOK Keng Hon and
(1)Ahmad Tarmimi ISMAIL
(1)Sultan Idris University of Education, Perak, MALAYSIA
(2) National Space Agency of Malaysia (ANGKASA)
Abstract
We performed two experiments in Asian Student Parabolic Flight 2013 Campaign. The first
experiment is about the visualization of resonance of air column. We visualised the resonance
of air column using polystyrene beads of 1 mm diameter. When the sound source is tuned at
the correct frequency, the beads are arranged through out the tube, filling the rarefaction part
in the column. We compared the resonance profile in normal gravity and microgravity for
horizontal and vertical tubes. Observation showed that the resonance profile is more clearly
visible in microgravity even at relatively low driven sound intensity. We made post flight
exhibition and conducted simple survey to know public prediction on the resonance profile.
For the second experiment, we test the universal mass balance using optical detection
compared to emf detection we did in Asian Student Parabolic Flight 2013 Campaign. Results
show that variation in gravitational field does not significantly affect the oscillation of a mass
load.
Malaysia Parabolic Flight 2013 Programme -Comprehensive Report March 2014
Universiti Pendidikan Sultan Idris (UPSI)
2
Experiment 1 : Resonance of Air Column
Objective : To investigate the profile of resonance of air column in hypergravity,
normal gravity and microgravity.
Introduction
It has been shown that sound resonance in tube can occur at right tube length and
supplied sound frequency [1]. However, detection is done using microphone connected to
spectrum analyzer. Students face hard problem to visualize such phenomena since spectrum
analyzer is weird for them even at the university level. To visualize such effect, Kundt’s tube
can be used. The tube was originally used to determine the mechanical properties of
unknown metal rod and acoustical properties of gases [2]. However, dust or visible particles,
which settle at the base of the tube due to gravity, does not assemble clear representation of
resonance profile.
Sound is a mechanical wave due to the vibration of molecules. Wind instruments such
as trumpet and flute produce sound of different tones when air molecules in the instruments
are tuned and vibrate with maximum amplitude at specific frequencies called harmonics. The
harmonics or resonant frequencies are established when standing waves of air column
matched the boundary conditions of the instrument.
In this project, we would like to observe true resonance profile of air column in tube
at which gravity effect is much reduced. In microgravity, such tube with modified geometry
has been performed in the perspective of art [3]. But to give more insight into scientific
importance of the sound propagation in microgravity, we further extend the profile formation
by controlling parameters (i) the frequency of driven sound, (ii) air column orientation and
(iii) tube types.
Methodology
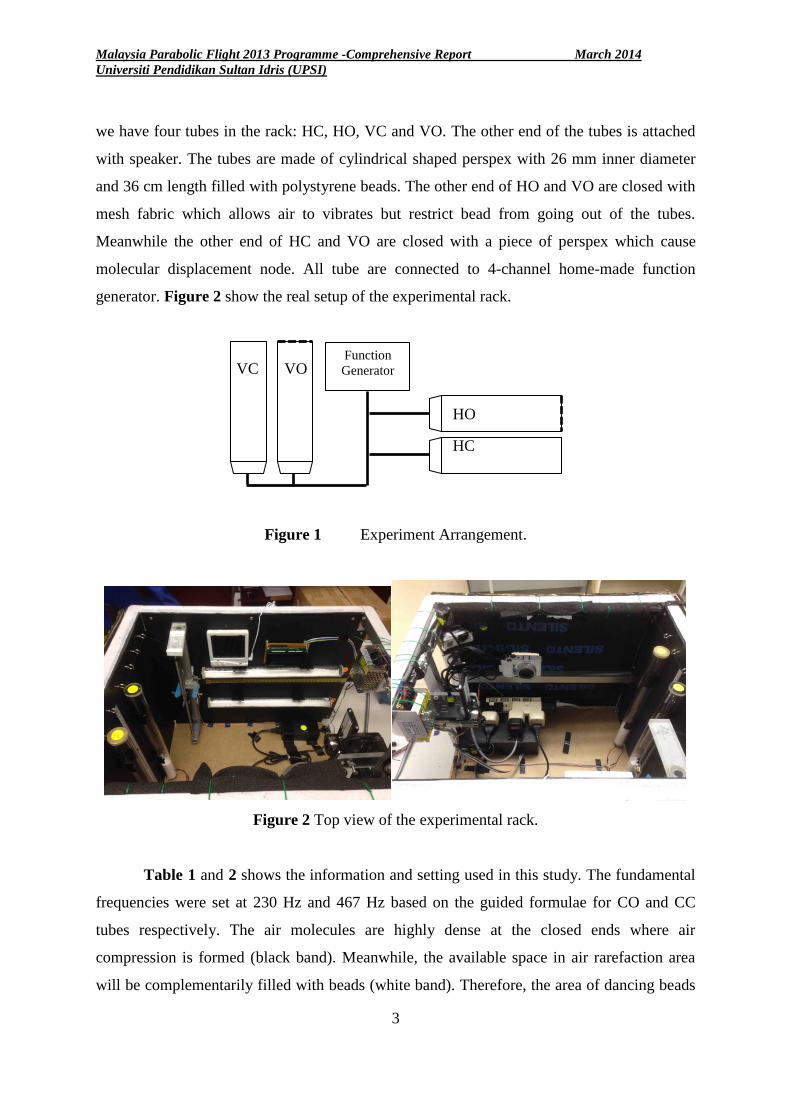
We prepared two sets of two tube types, one set for horizontal orientation denoted by
H and the other set for vertical orientation denoted by V, as shown in Figure 1. Two types of
tube are tube with closed end denoted by C and tube with open end denoted by O. Therefore,
Malaysia Parabolic Flight 2013 Programme -Comprehensive Report March 2014
Universiti Pendidikan Sultan Idris (UPSI)
3
we have four tubes in the rack: HC, HO, VC and VO. The other end of the tubes is attached
with speaker. The tubes are made of cylindrical shaped perspex with 26 mm inner diameter
and 36 cm length filled with polystyrene beads. The other end of HO and VO are closed with
mesh fabric which allows air to vibrates but restrict bead from going out of the tubes.
Meanwhile the other end of HC and VO are closed with a piece of perspex which cause
molecular displacement node. All tube are connected to 4-channel home-made function
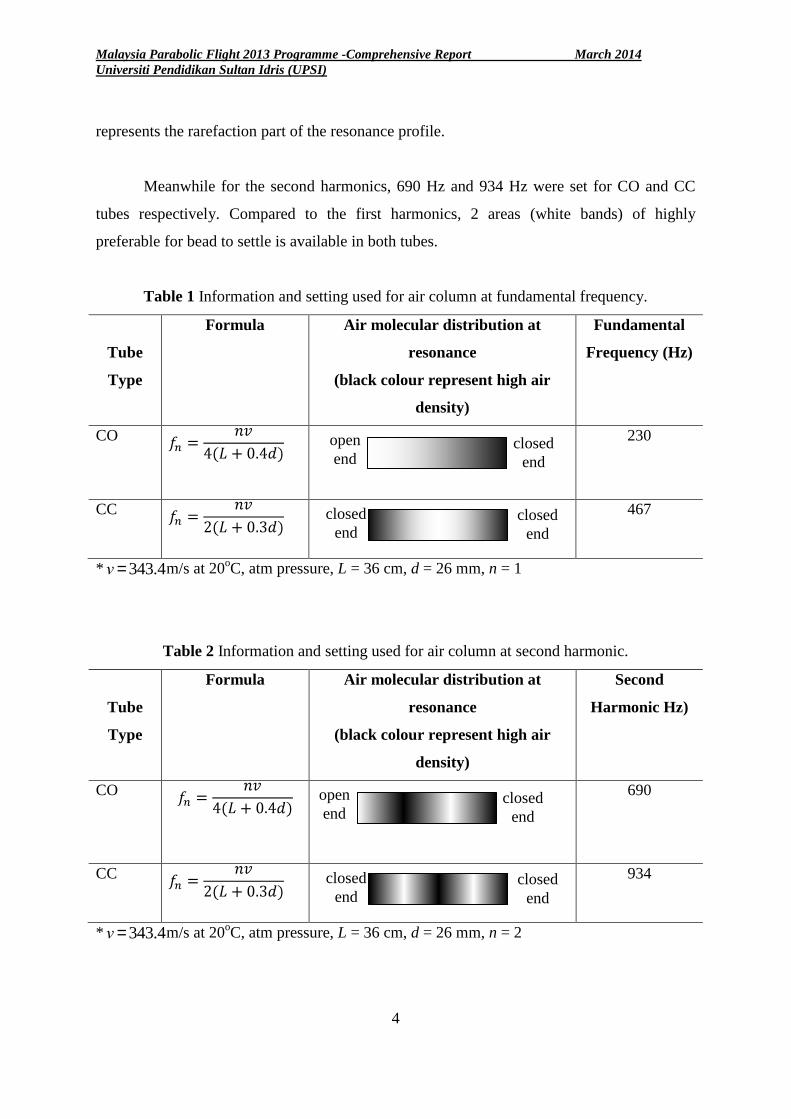
generator. Figure 2 show the real setup of the experimental rack.
Figure 1 Experiment Arrangement.
Figure 2 Top view of the experimental rack.
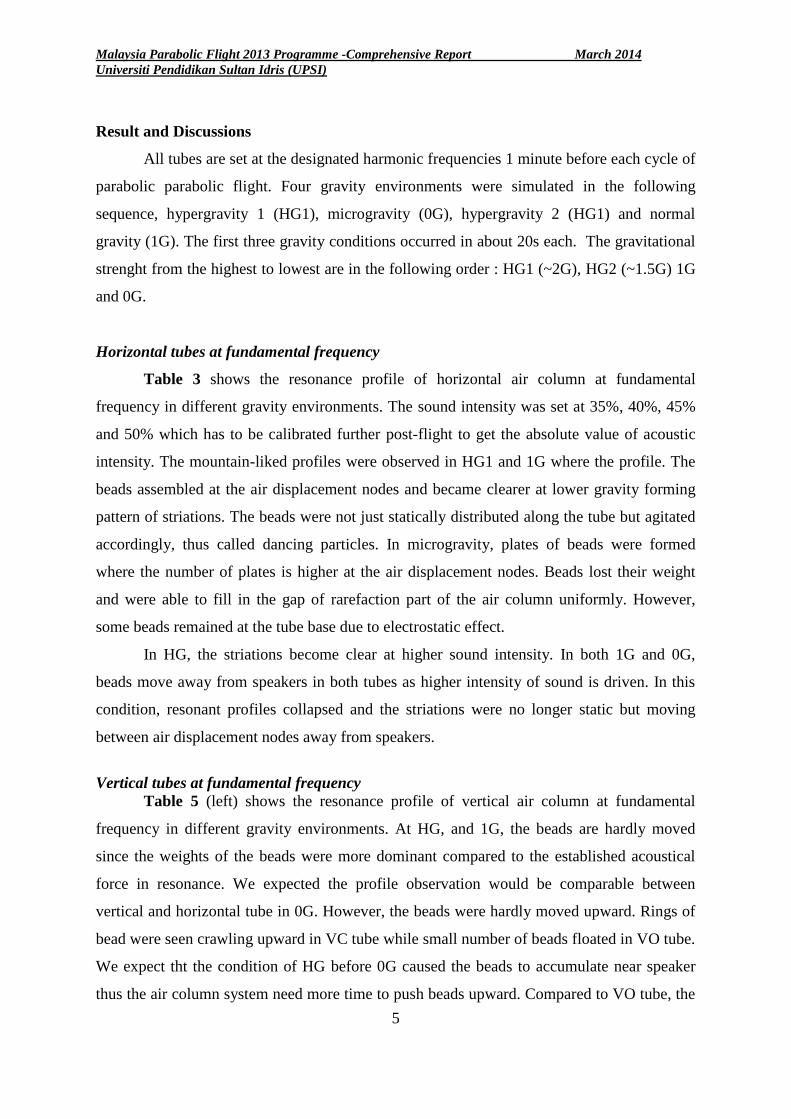
Table 1 and 2 shows the information and setting used in this study. The fundamental
frequencies were set at 230 Hz and 467 Hz based on the guided formulae for CO and CC
tubes respectively. The air molecules are highly dense at the closed ends where air
compression is formed (black band). Meanwhile, the available space in air rarefaction area
will be complementarily filled with beads (white band). Therefore, the area of dancing beads
Function
Generator VC VO
HO
HC
Malaysia Parabolic Flight 2013 Programme -Comprehensive Report March 2014
Universiti Pendidikan Sultan Idris (UPSI)
4
represents the rarefaction part of the resonance profile.
Meanwhile for the second harmonics, 690 Hz and 934 Hz were set for CO and CC
tubes respectively. Compared to the first harmonics, 2 areas (white bands) of highly
preferable for bead to settle is available in both tubes.
Table 1 Information and setting used for air column at fundamental frequency.
Tube
Type
Formula Air molecular distribution at
resonance
(black colour represent high air
density)
Fundamental
Frequency (Hz)
CO
230
CC
467
* v = 343.4m/s at 20oC, atm pressure, L = 36 cm, d = 26 mm, n = 1
Table 2 Information and setting used for air column at second harmonic.
Tube
Type
Formula Air molecular distribution at
resonance
(black colour represent high air
density)
Second
Harmonic Hz)
CO
690
CC
934
* v = 343.4m/s at 20oC, atm pressure, L = 36 cm, d = 26 mm, n = 2
open
end closed
end
closed
end closed
end
closed
end closed
end
open
end closed
end
Malaysia Parabolic Flight 2013 Programme -Comprehensive Report March 2014
Universiti Pendidikan Sultan Idris (UPSI)
5
Result and Discussions
All tubes are set at the designated harmonic frequencies 1 minute before each cycle of
parabolic parabolic flight. Four gravity environments were simulated in the following
sequence, hypergravity 1 (HG1), microgravity (0G), hypergravity 2 (HG1) and normal
gravity (1G). The first three gravity conditions occurred in about 20s each. The gravitational
strenght from the highest to lowest are in the following order : HG1 (~2G), HG2 (~1.5G) 1G
and 0G.
Horizontal tubes at fundamental frequency
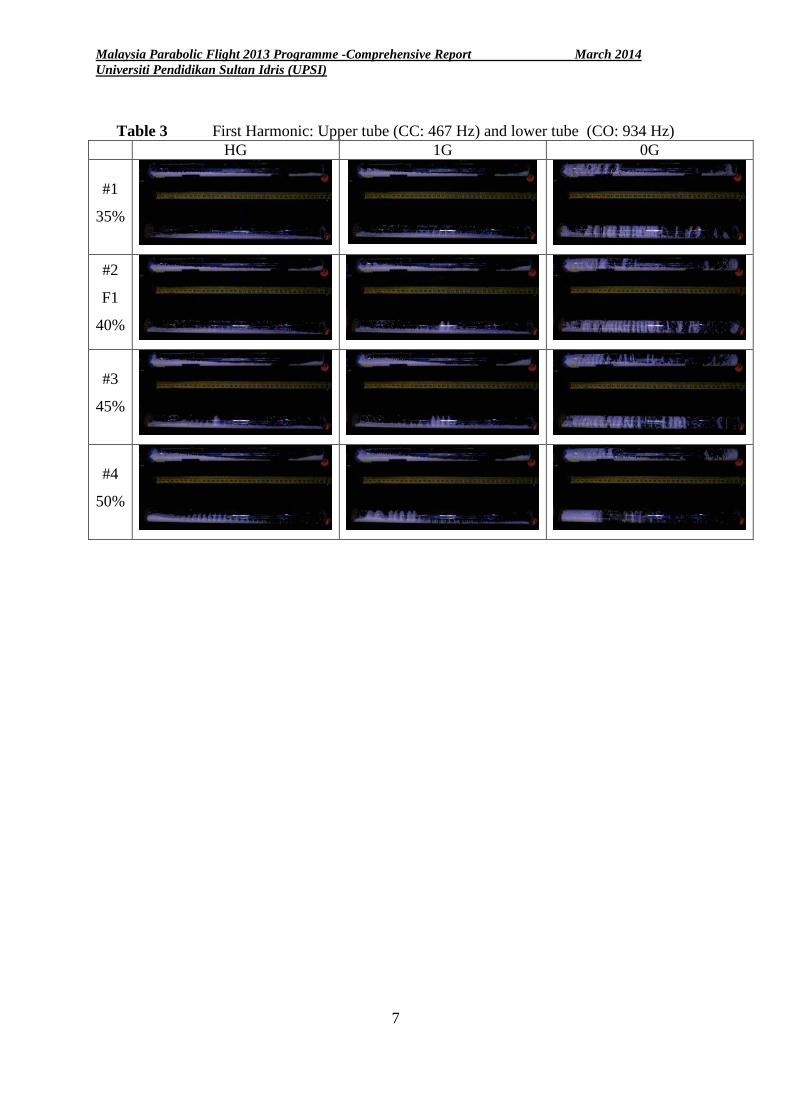
Table 3 shows the resonance profile of horizontal air column at fundamental
frequency in different gravity environments. The sound intensity was set at 35%, 40%, 45%
and 50% which has to be calibrated further post-flight to get the absolute value of acoustic
intensity. The mountain-liked profiles were observed in HG1 and 1G where the profile. The
beads assembled at the air displacement nodes and became clearer at lower gravity forming
pattern of striations. The beads were not just statically distributed along the tube but agitated
accordingly, thus called dancing particles. In microgravity, plates of beads were formed
where the number of plates is higher at the air displacement nodes. Beads lost their weight
and were able to fill in the gap of rarefaction part of the air column uniformly. However,
some beads remained at the tube base due to electrostatic effect.
In HG, the striations become clear at higher sound intensity. In both 1G and 0G,
beads move away from speakers in both tubes as higher intensity of sound is driven. In this
condition, resonant profiles collapsed and the striations were no longer static but moving
between air displacement nodes away from speakers.
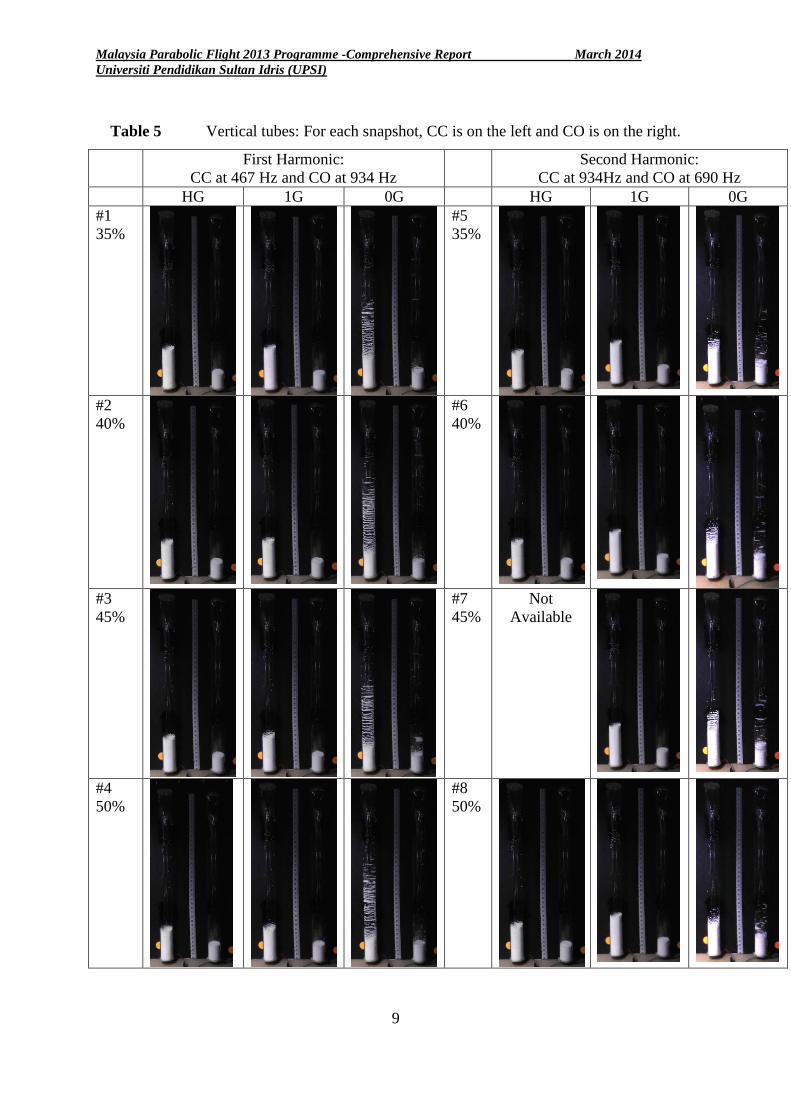
Vertical tubes at fundamental frequency
Table 5 (left) shows the resonance profile of vertical air column at fundamental
frequency in different gravity environments. At HG, and 1G, the beads are hardly moved
since the weights of the beads were more dominant compared to the established acoustical
force in resonance. We expected the profile observation would be comparable between
vertical and horizontal tube in 0G. However, the beads were hardly moved upward. Rings of
bead were seen crawling upward in VC tube while small number of beads floated in VO tube.
We expect tht the condition of HG before 0G caused the beads to accumulate near speaker
thus the air column system need more time to push beads upward. Compared to VO tube, the
Malaysia Parabolic Flight 2013 Programme -Comprehensive Report March 2014
Universiti Pendidikan Sultan Idris (UPSI)
6
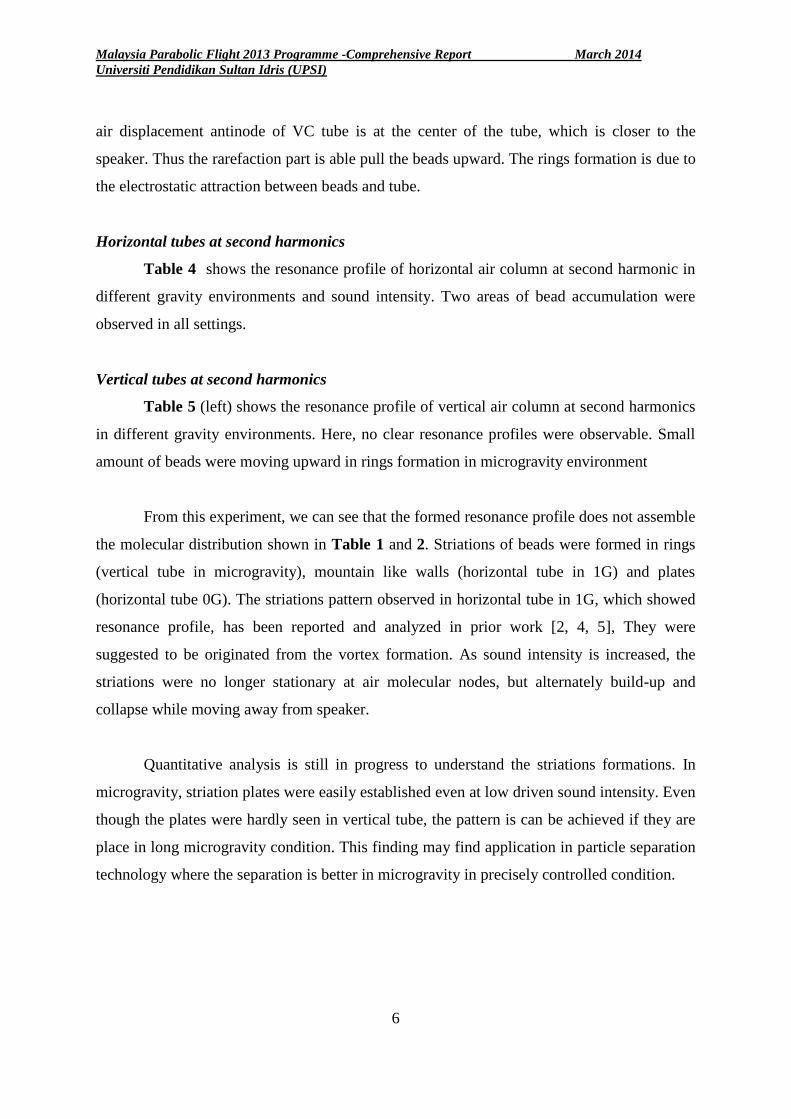
air displacement antinode of VC tube is at the center of the tube, which is closer to the
speaker. Thus the rarefaction part is able pull the beads upward. The rings formation is due to
the electrostatic attraction between beads and tube.
Horizontal tubes at second harmonics
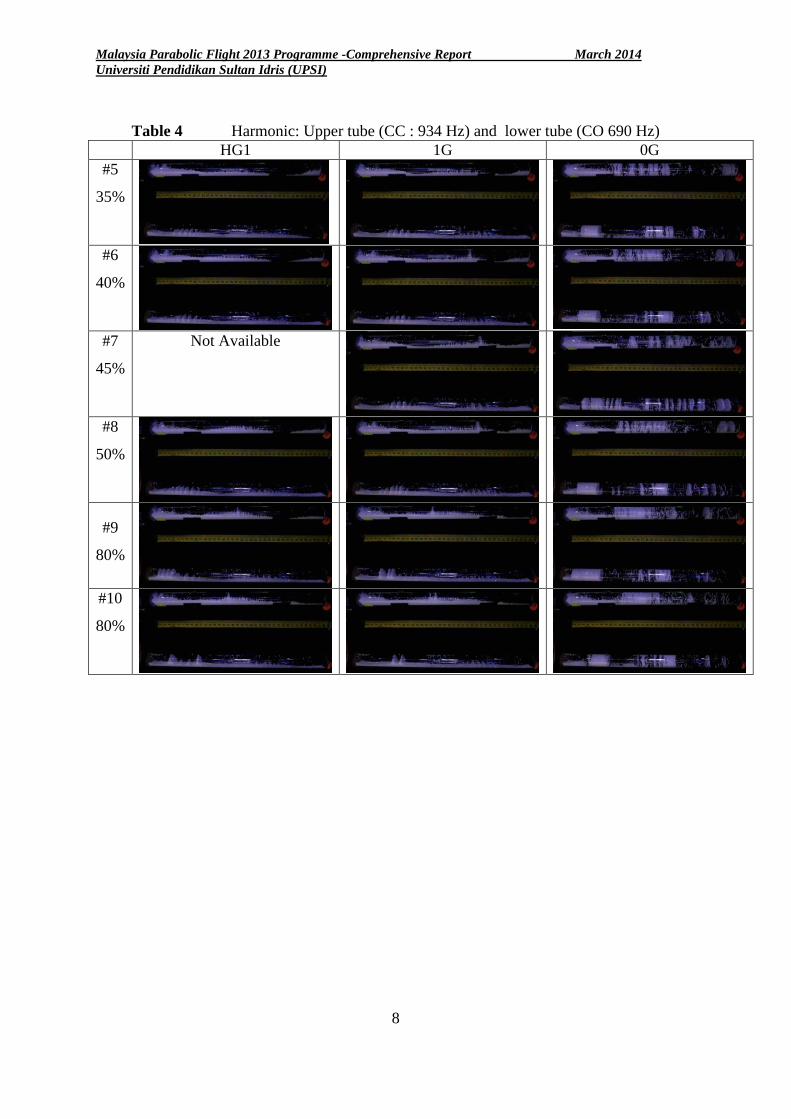
Table 4 shows the resonance profile of horizontal air column at second harmonic in
different gravity environments and sound intensity. Two areas of bead accumulation were
observed in all settings.
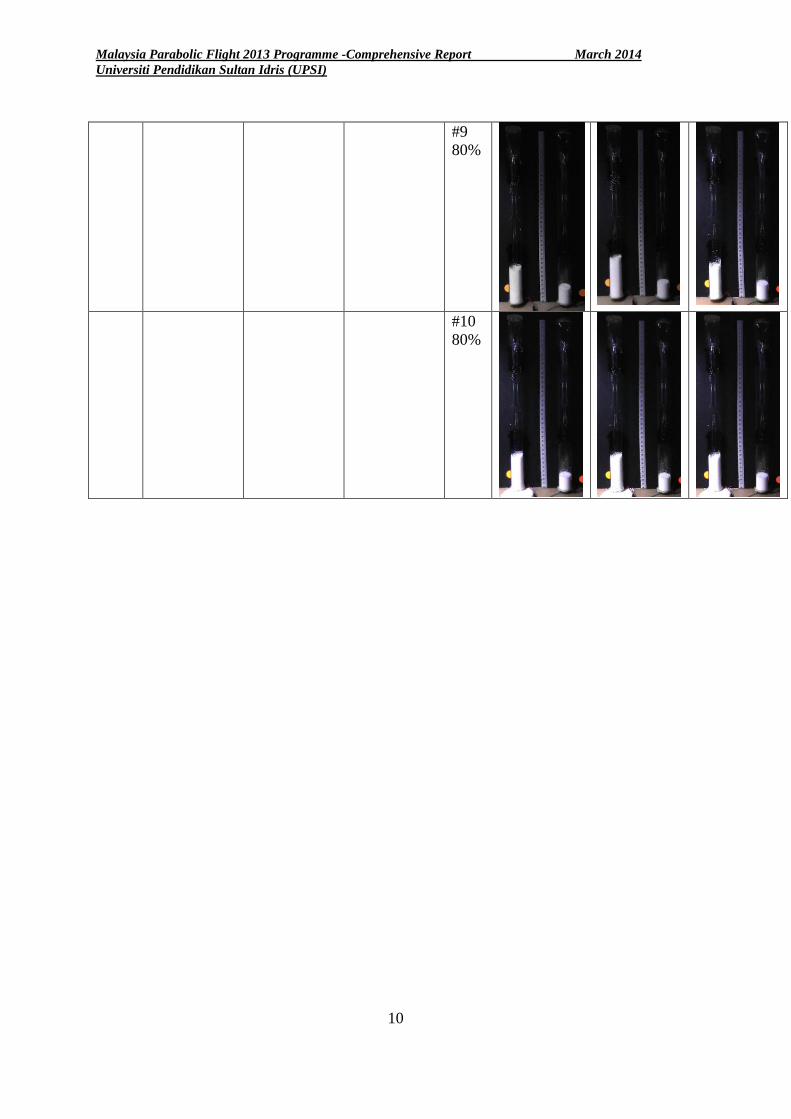
Vertical tubes at second harmonics
Table 5 (left) shows the resonance profile of vertical air column at second harmonics
in different gravity environments. Here, no clear resonance profiles were observable. Small
amount of beads were moving upward in rings formation in microgravity environment
From this experiment, we can see that the formed resonance profile does not assemble
the molecular distribution shown in Table 1 and 2. Striations of beads were formed in rings
(vertical tube in microgravity), mountain like walls (horizontal tube in 1G) and plates
(horizontal tube 0G). The striations pattern observed in horizontal tube in 1G, which showed
resonance profile, has been reported and analyzed in prior work [2, 4, 5], They were
suggested to be originated from the vortex formation. As sound intensity is increased, the
striations were no longer stationary at air molecular nodes, but alternately build-up and
collapse while moving away from speaker.
Quantitative analysis is still in progress to understand the striations formations. In
microgravity, striation plates were easily established even at low driven sound intensity. Even
though the plates were hardly seen in vertical tube, the pattern is can be achieved if they are
place in long microgravity condition. This finding may find application in particle separation
technology where the separation is better in microgravity in precisely controlled condition.
Malaysia Parabolic Flight 2013 Programme -Comprehensive Report March 2014
Universiti Pendidikan Sultan Idris (UPSI)
7
Table 3 First Harmonic: Upper tube (CC: 467 Hz) and lower tube (CO: 934 Hz)
HG 1G 0G
#1
35%
#2
F1
40%
#3
45%
#4
50%
Malaysia Parabolic Flight 2013 Programme -Comprehensive Report March 2014
Universiti Pendidikan Sultan Idris (UPSI)
8
Table 4 Harmonic: Upper tube (CC : 934 Hz) and lower tube (CO 690 Hz)
HG1 1G 0G
#5
35%
#6
40%
#7
45%
Not Available
#8
50%
#9
80%
#10
80%
Malaysia Parabolic Flight 2013 Programme -Comprehensive Report March 2014
Universiti Pendidikan Sultan Idris (UPSI)
9
Table 5 Vertical tubes: For each snapshot, CC is on the left and CO is on the right.
First Harmonic:
CC at 467 Hz and CO at 934 Hz
Second Harmonic:
CC at 934Hz and CO at 690 Hz
HG 1G 0G HG 1G 0G
#1
35%
#5
35%
#2
40%
#6
40%
#3
45%
#7
45%
Not
Available
#4
50%
#8
50%
Malaysia Parabolic Flight 2013 Programme -Comprehensive Report March 2014
Universiti Pendidikan Sultan Idris (UPSI)
10
#9
80%
#10
80%
Malaysia Parabolic Flight 2013 Programme -Comprehensive Report March 2014
Universiti Pendidikan Sultan Idris (UPSI)
11
Conclusion
Resonance profile using polystyrene in vertical tube can be clearly established at relatively
low sound intensity in microgravity. The observed bead distribution represents compression
and rarefaction part of the resonance profile of an air column. The beads agitated mostly in
the rarefaction part to fill in the gap between air. Due to slow response time, it is difficult to
achieve the resonance profile for vertical tube during short microgravity period in parabolic
flight. However, the formation of bead rings shows an interesting effect of electrostatic force
between beads and tubes.
Education Outreach
We participated several post-flight exhibition to disseminated information and experience
gain during the parabolic flight campaign. We devised a simple survey to get public
expectation about the resonance profile of an air column in microgravity. First we explained
and made demonstration of the formation of resonance profile by tuning the speaker at the
correct frequency using our experimental rack. Most of our visitors were surprised to observe
the accumulation of the beads at particular spot and beads were dancing. Then, explanation is
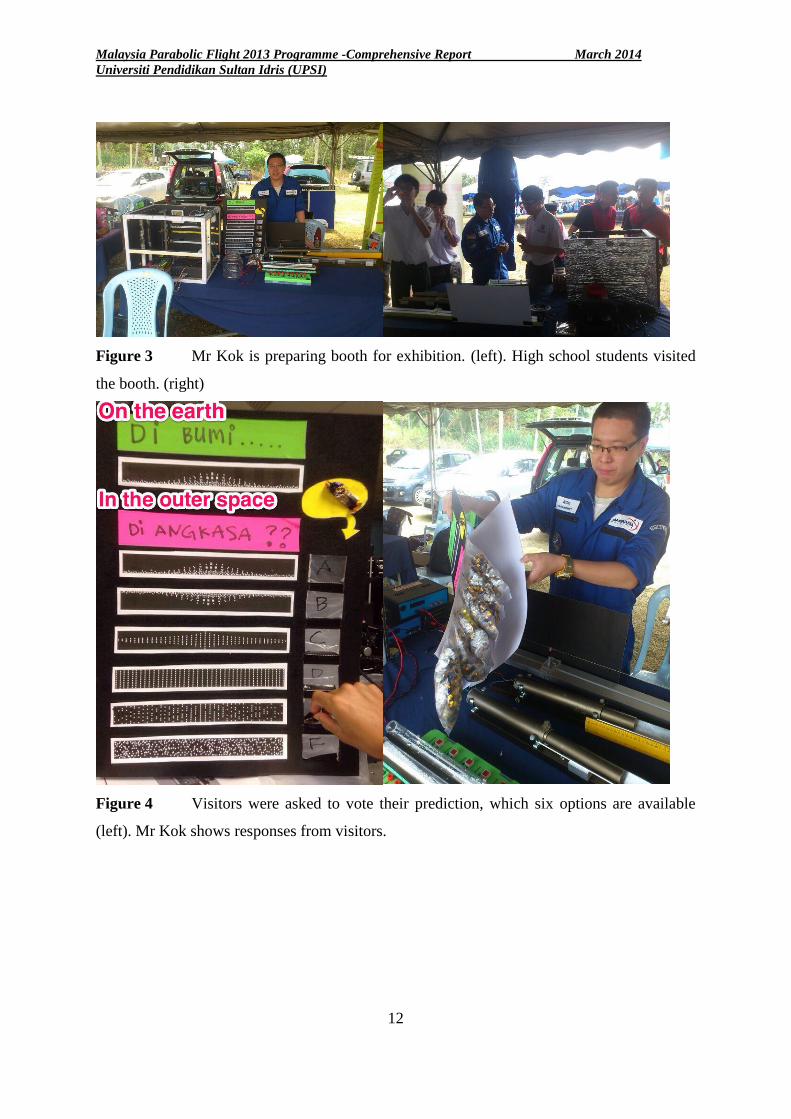
given according to question asked by visitors. Finally, they were given a sweet. They were
asked to predict the resonance profile in the outer by putting the wrap of the sweet into their
option (Figure 4).
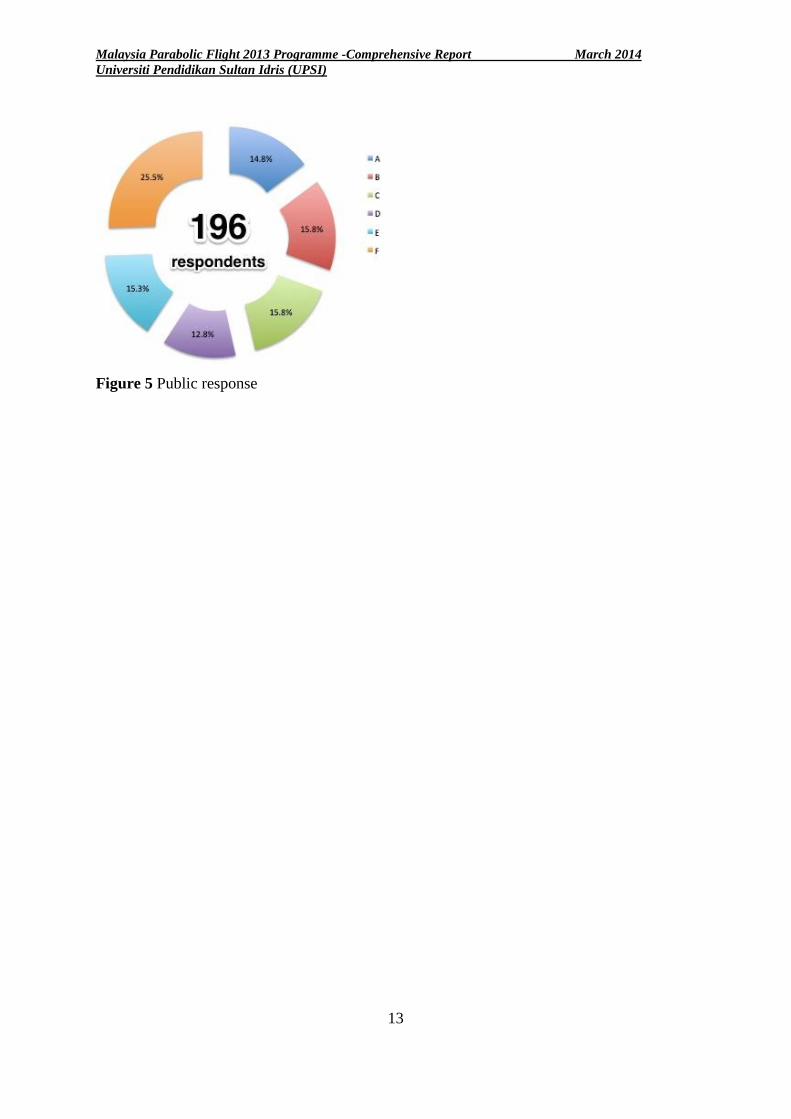
Figure 5 shows response from public collected in February 2014. The correct option
is E as selected by 15.3% of the respondents. One forth of them chose F for their prediction.
The rest were divided into 5 other options with close percentages. It is very interesting to see
majority of them chose F where beads are randomly distributed. We expected that the visitor
related no-gravity outer space to floatation of object. They did not notice the acoustical force
is still in action hold beads at particular positions. The survey, even though is very simple,
give us an insight about public understanding about gravity.
Malaysia Parabolic Flight 2013 Programme -Comprehensive Report March 2014
Universiti Pendidikan Sultan Idris (UPSI)
12
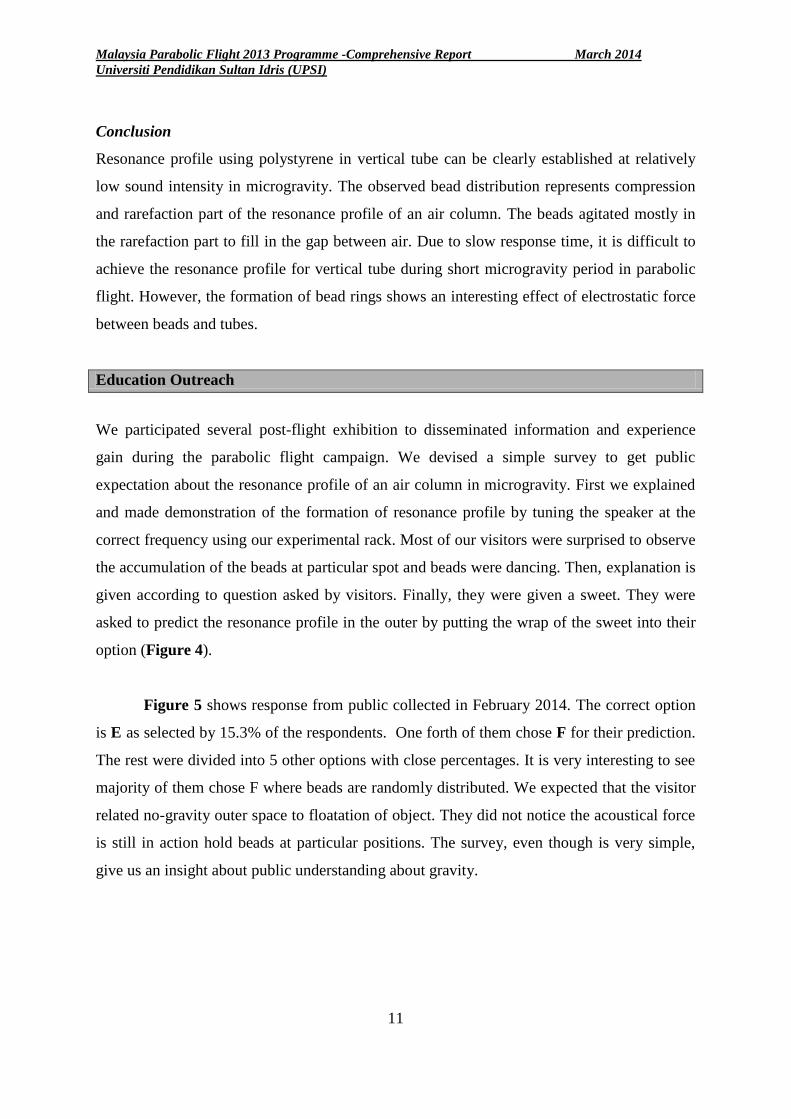
Figure 3 Mr Kok is preparing booth for exhibition. (left). High school students visited
the booth. (right)
Figure 4 Visitors were asked to vote their prediction, which six options are available
(left). Mr Kok shows responses from visitors.
Malaysia Parabolic Flight 2013 Programme -Comprehensive Report March 2014
Universiti Pendidikan Sultan Idris (UPSI)
13
Figure 5 Public response
Malaysia Parabolic Flight 2013 Programme -Comprehensive Report March 2014
Universiti Pendidikan Sultan Idris (UPSI)
14
Experiment 2 : Universal Mass Balance (UMB)
Objective : To confirm the measurement of mass using UMB with optical detection is
independent to gravitational strength.
Introduction
Mass measurement is an important procedure in scientific research as well as in daily life. On
earth, mass balances are designed based on the earth gravitational attraction on the object
being measured. These devices are useless at the location where gravitational strength is not
the same value as earth gravity. We confirmed that mass measurement using a pair of spring
is independent on gravitational field within experimental errors [6, 7] using electromotive
force (emf) detection method. This time, we use optical detection method to record the
oscillation of a mass.
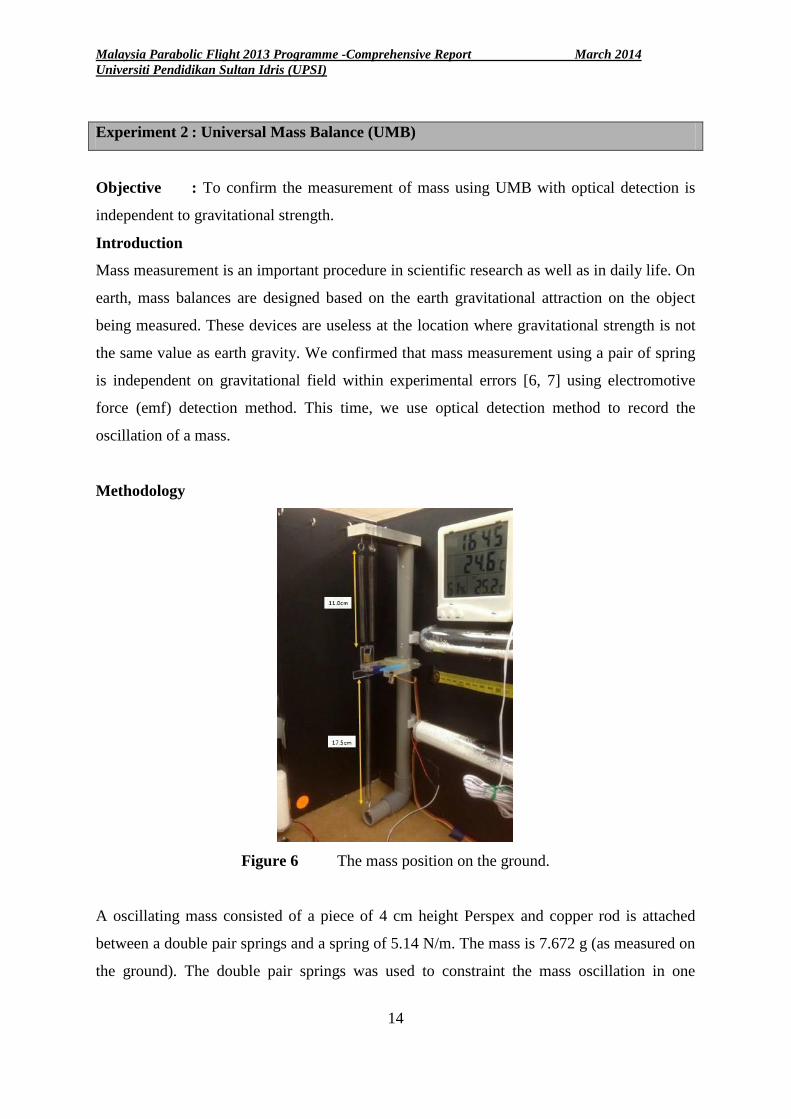
Methodology
Figure 6 The mass position on the ground.
A oscillating mass consisted of a piece of 4 cm height Perspex and copper rod is attached
between a double pair springs and a spring of 5.14 N/m. The mass is 7.672 g (as measured on
the ground). The double pair springs was used to constraint the mass oscillation in one
Malaysia Parabolic Flight 2013 Programme -Comprehensive Report March 2014
Universiti Pendidikan Sultan Idris (UPSI)
15
dimension up and down. On the ground, the upper part stretched 11.0 cm and the lower part
stretched 17. 5 cm as shown in Figure 6.
The oscillation is detected using optical detection method. A infrared light emitting
diod (LED) is aligned to infrared photodiode. One side of the Perspex is stick with an opaque
tape. Each time the mass passing trough the detector, a pulse is send to microcontroller. One
cycle of oscillation is calculated from the time taken between two pulses. The microcontroller
is set so that it calculates the average frequency of 8 complete cycles. The measurement is
performed by pulling the mass using a string to set the mass into oscillation.
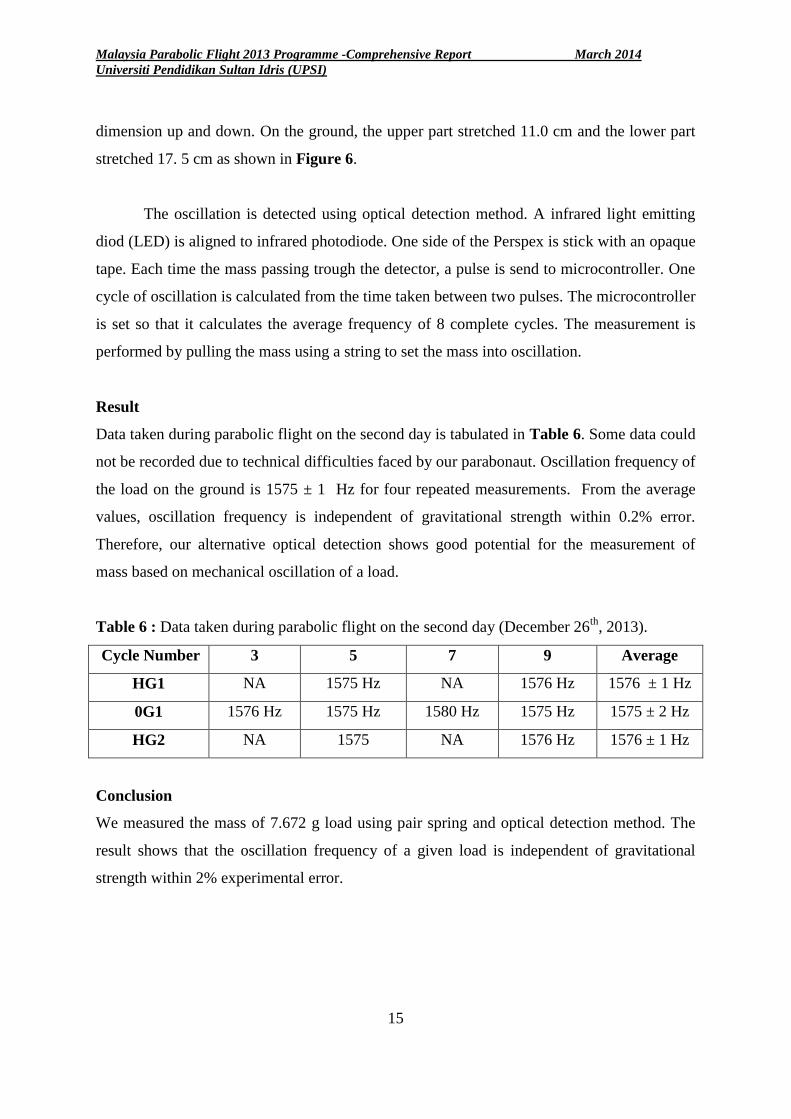
Result
Data taken during parabolic flight on the second day is tabulated in Table 6. Some data could
not be recorded due to technical difficulties faced by our parabonaut. Oscillation frequency of
the load on the ground is 1575 ± 1 Hz for four repeated measurements. From the average
values, oscillation frequency is independent of gravitational strength within 0.2% error.
Therefore, our alternative optical detection shows good potential for the measurement of
mass based on mechanical oscillation of a load.
Table 6 : Data taken during parabolic flight on the second day (December 26th
, 2013).
Cycle Number 3 5 7 9 Average
HG1 NA 1575 Hz NA 1576 Hz 1576 ± 1 Hz
0G1 1576 Hz 1575 Hz 1580 Hz 1575 Hz 1575 ± 2 Hz
HG2 NA 1575 NA 1576 Hz 1576 ± 1 Hz
Conclusion
We measured the mass of 7.672 g load using pair spring and optical detection method. The
result shows that the oscillation frequency of a given load is independent of gravitational
strength within 2% experimental error.
Malaysia Parabolic Flight 2013 Programme -Comprehensive Report March 2014
Universiti Pendidikan Sultan Idris (UPSI)
16
Acknowledgments
We would like to acknowledge the following agencies that support this project: Universiti
Pendidikan Sultan Idris (UPSI), Ministry of Science, Technology and Innovation (MOSTI),
National Space Agency of Malaysia (ANGKASA), Japan Aerospace and Exploration Agency
(JAXA) and Diamond Air Service (DAS). This project is partly supported by UPSI grant
code 2013-0172-102-03 and 2012-0108-102-03. We thank Prof. Rosly for his guidance
throughout the experiment preparation.
References
[1] Kadri, S., Jaafar, R., Adli, W. Z., & Nazihah, A. (2013). Physics demonstration of sound
waves using Visual Analyser. Latin-American Journal of Physics Education, 7(1).
[2] Kundt, A. (1866). "Ueber eine neue Art Akustischer Staubfiguren und über die
Anwendung derselben zur Bestimmung der Shallgeschwindigkeit in festen Körpern und
Gasen". Annalen der Physik (Leipzig: J. C. Poggendorff) 127 (4): p.497–523.
[3] Namba, et. al (2006). Experiment for Sculpture Formed Sound Wave. J. Jpn. Soc.
Microgravity Appl., 23(4).
[4] Hutchisson, E., & Morgan, F. B. (1931). An experimental study of Kundt's tube dust
figures. Physical Review, 37(9), 1155.
[5] Carman, R. A. (1955). Kundt Tube Dust Striations. American Journal of Physics, 23, 505.
[6] Kadri, S., Aziz, W., Suhaila, W. N., Hashim, M. H., Jaafar, R., & Yaacob, M. I. H. (2013).
Mechanical Efficiency of a Mass-Spring System in Hypergravity, Normal Gravity and
Microgravity. Applied Mechanics and Materials, 390, 261-265.
[7] Kadri, S., Daud, M., Nazihah, A., Hashim, M. H., Rosli, J., Asillam, M. F., & Nurlisman,
Z. K. D. (2013). Simple Design of a Gravity-Independent Mass Balance. Applied Mechanics
and Materials, 390, 637-640.