Embed Size (px)
Citation preview

Dan PiettSTAT 211-019
West Virginia University
Lecture 5
Test 1 Recap
Median Score – 85%
Last WeekProbability DistributionsExpected Value of a Probability Distribution
)(xpx
OverviewBinomial Distributions and Probabilities
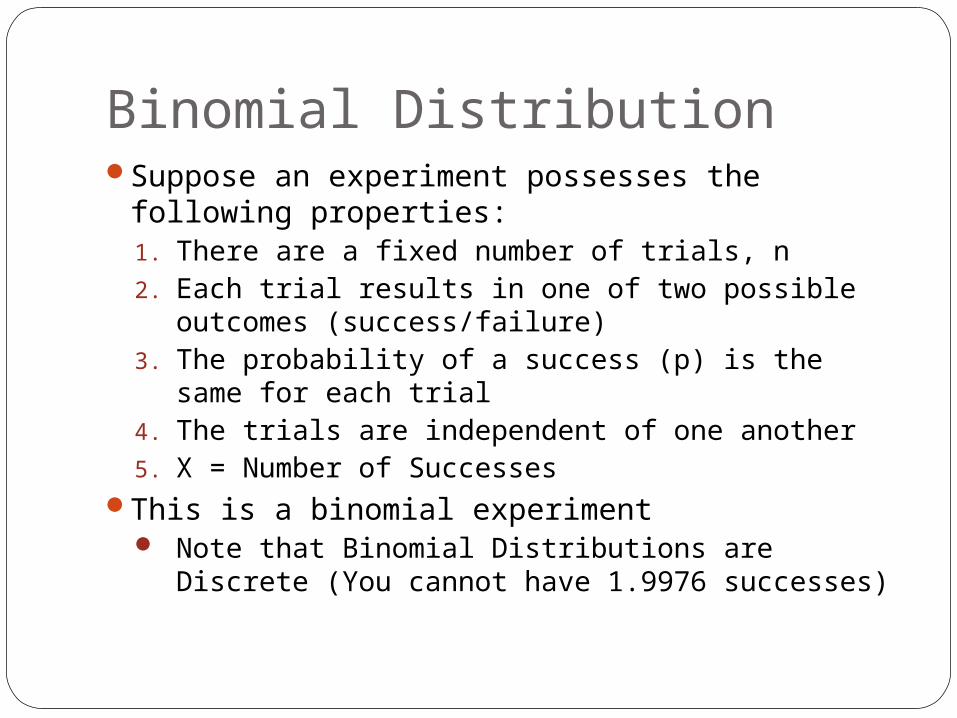
Binomial DistributionSuppose an experiment possesses the
following properties:1. There are a fixed number of trials, n2. Each trial results in one of two possible
outcomes (success/failure)3. The probability of a success (p) is the same for
each trial4. The trials are independent of one another5. X = Number of Successes
This is a binomial experiment Note that Binomial Distributions are Discrete
(You cannot have 1.9976 successes)
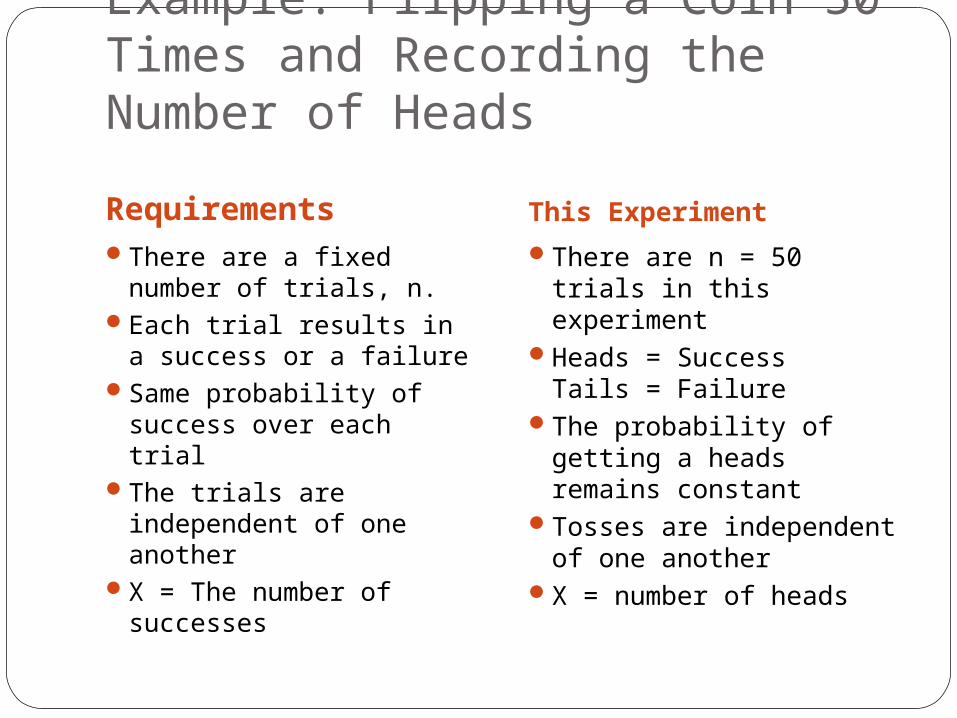
Example: Flipping a Coin 50 Times and Recording the Number of Heads
Requirements This Experiment
There are a fixed number of trials, n.
Each trial results in a success or a failure
Same probability of success over each trial
The trials are independent of one another
X = The number of successes
There are n = 50 trials in this experiment
Heads = SuccessTails = Failure
The probability of getting a heads remains constant
Tosses are independent of one another
X = number of heads
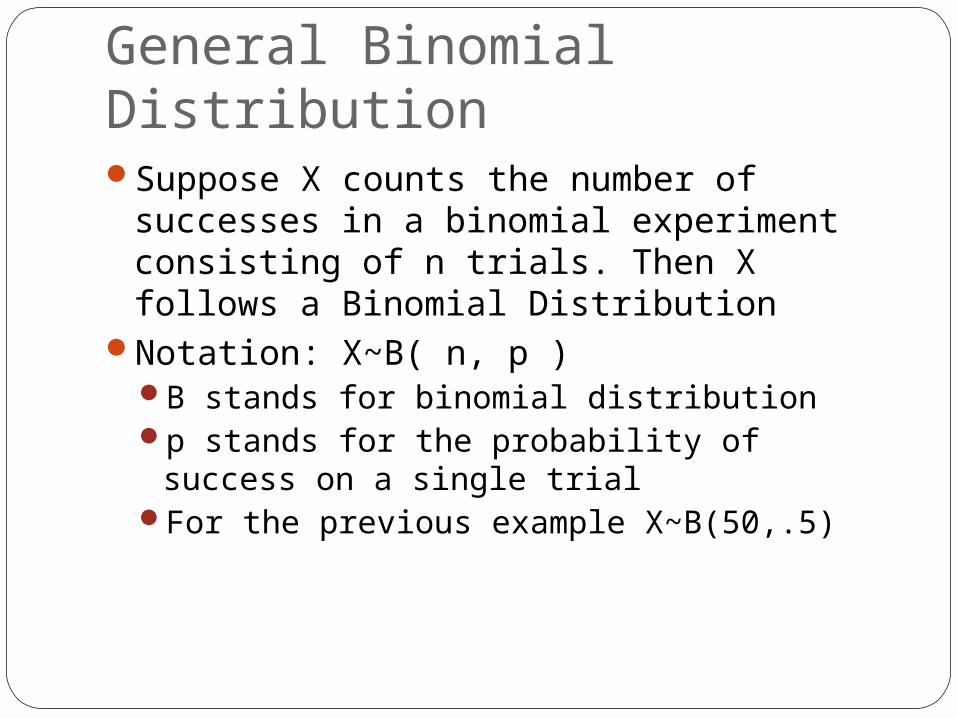
General Binomial DistributionSuppose X counts the number of successes
in a binomial experiment consisting of n trials. Then X follows a Binomial Distribution
Notation: X~B( n, p )B stands for binomial distributionp stands for the probability of success on a
single trialFor the previous example X~B(50,.5)
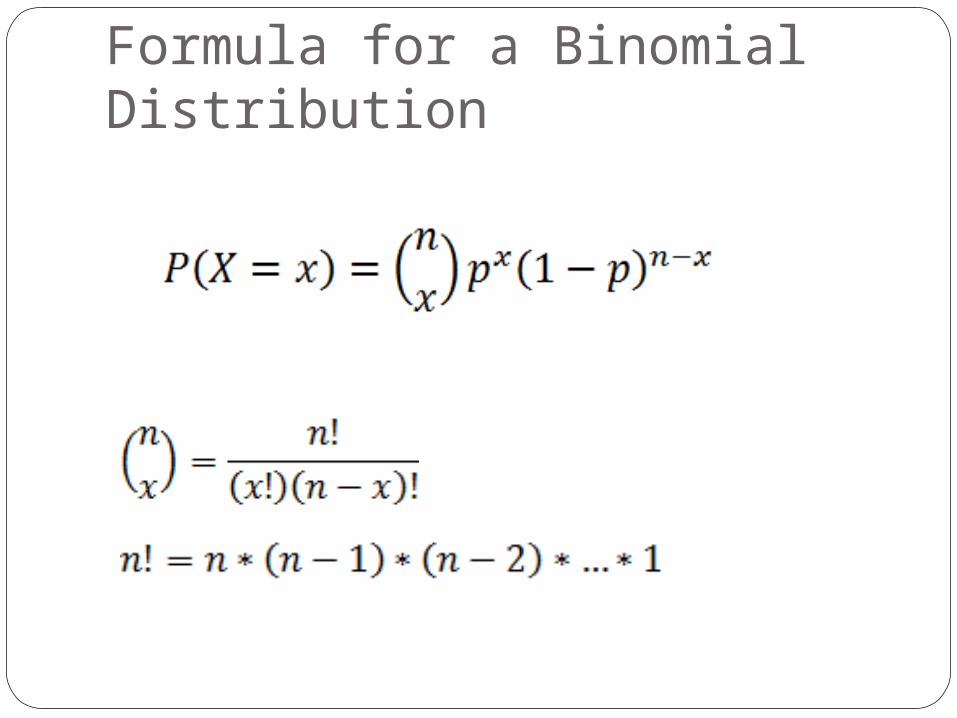
Formula for a Binomial Distribution
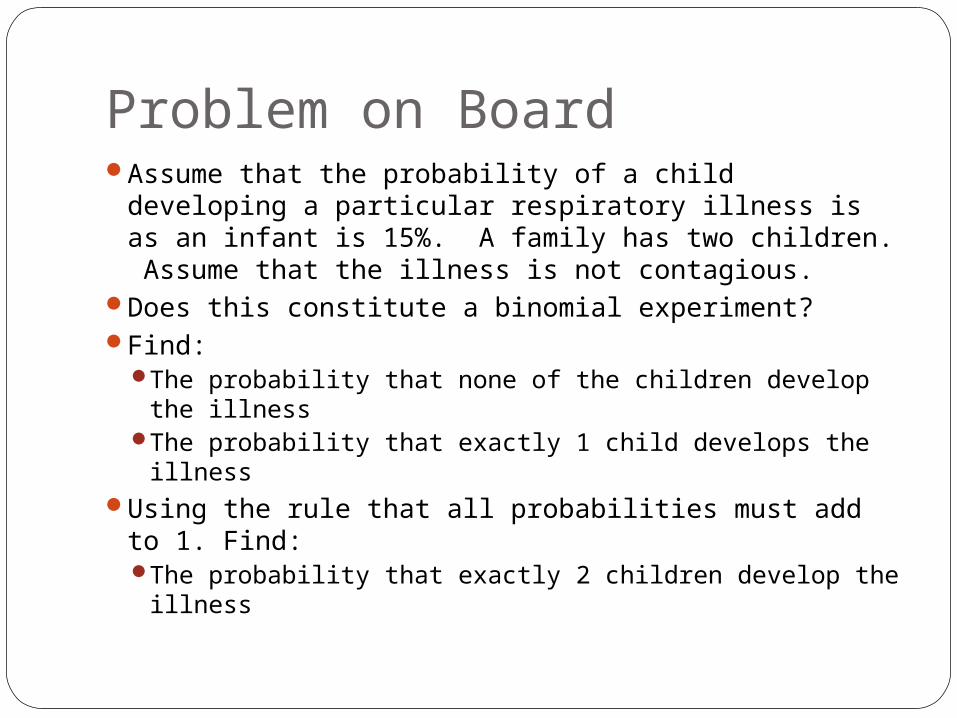
Problem on BoardAssume that the probability of a child developing a
particular respiratory illness is as an infant is 15%. A family has two children. Assume that the illness is not contagious.
Does this constitute a binomial experiment?Find:
The probability that none of the children develop the illness
The probability that exactly 1 child develops the illnessUsing the rule that all probabilities must add to 1.
Find:The probability that exactly 2 children develop the
illness
Cumulative Binomial ProbabilitiesThe previous formula can be used to find
the probability that X equal to exactly some value
What about other probabilities of interest?X equal to less than some value?X equal to more than some value?X is between two values?
How do we do this?
Back to the Previous ExampleWhat is the probability that at most 1 child
gets the illness?At most = less than or equal toAt most 1 child = {0, 1, 2}P(At most 1 child) = P(X=0)+P(X=1)
Note: The probability of this event is defined as the sums of the probabilities.Remember that this only works because
Binomial Distributions are discreteThis is great, but what if n and x are large?
Same Example, New ProblemSuppose that a small town has 20 infants.
What is the probability that 18 or less develop the respiratory disease?18 or less = {0, 1, 2, … , 17, 18, 19, 20}P(18 or less) = P(X=0) + P(X=1) +…+
P(X=18)We would need to compute 19 probabilities to
solve this.Is there a better way?Actually, there are two
Using cumulative probability tablesUsing our knowledge of Complementary Probabilities
Cumulative Probability TablesBecause of the difficulty of calculating
these probabilities (and how common the binomial distribution is). Cumulative probabilities for specific values of n and x have been tabulated.Note: These tables will be provided on
quizzes and exams.How to read the table:
Find the appropriate n and p value, look for xThis is the probability that X is less than or
equal to that value
Example: Less Than ProbabilitiesWe have our town of 20 infants. Find the
following probabilities:At most 5 develop the diseaseLess than 8 develop the diseaseAt most 2 develop the diseaseLess than 3 develop the disease
Greater than ProbabilitiesSo we now know how to calculate the
probability that X is equal to exactly some value or the probability that X is less than/less than or equal to some value.
What about the probability that X is greater than/greater than or equal to some value?Think back to complementary probabilities
Headed back to our Example, n=20What is the probability that 19 or more children
develop the disease?19 or more = {0, 1, 2, … , 18, 19, 20}P(19 or more) = P(19) + P(20)Remember back to the previous example: P(At
most 18)P(At most 18) and P(19 or more) are
complementary eventsWhat does this mean?
P(19 or more) = 1 – P(At most 18)This can be very effective for probabilities such
as:P(At least 1) = 1 – P(At most 0) = 1 – P(X=0)
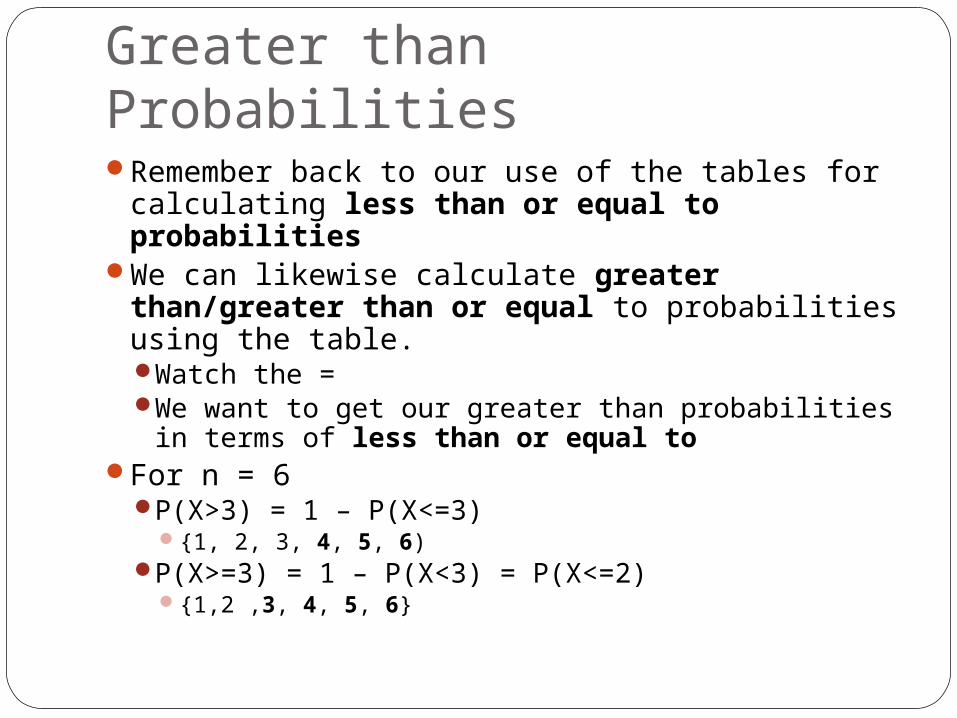
Greater than ProbabilitiesRemember back to our use of the tables for
calculating less than or equal to probabilities
We can likewise calculate greater than/greater than or equal to probabilities using the table.Watch the = We want to get our greater than probabilities in
terms of less than or equal toFor n = 6
P(X>3) = 1 – P(X<=3){1, 2, 3, 4, 5, 6)
P(X>=3) = 1 – P(X<3) = P(X<=2){1,2 ,3, 4, 5, 6}
Example: Greater Than ProbabilitiesWe have our town of 20 infants. Find the
following probabilities:6 or more develop the diseaseAt least 8 develop the disease3 or more develop the diseaseAt least 4 develop the disease
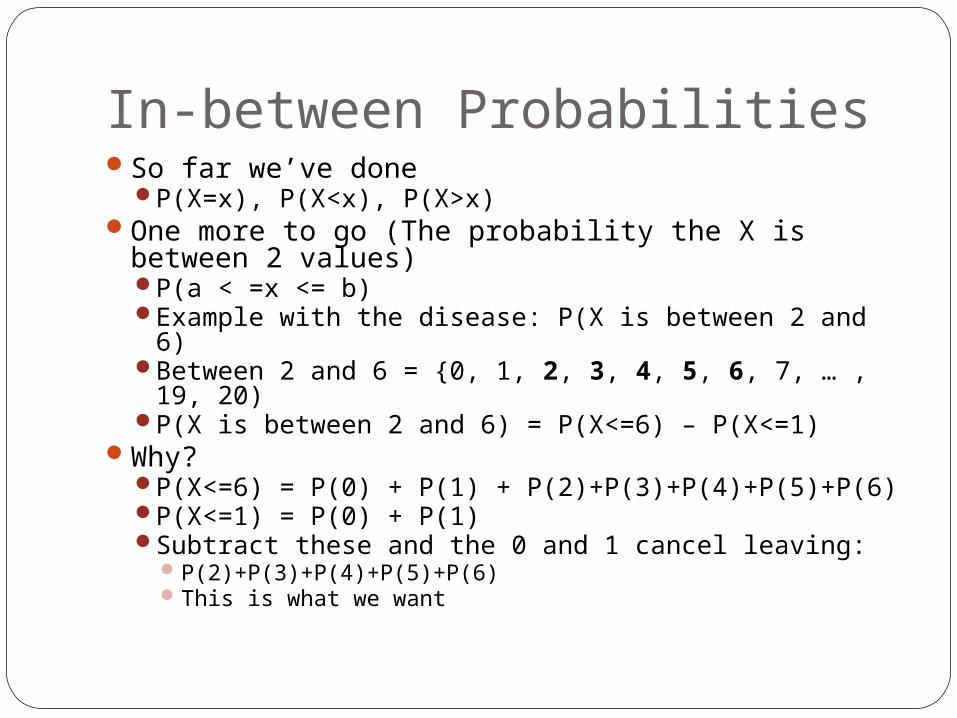
In-between ProbabilitiesSo far we’ve done
P(X=x), P(X<x), P(X>x)One more to go (The probability the X is between
2 values)P(a < =x <= b)Example with the disease: P(X is between 2 and 6)Between 2 and 6 = {0, 1, 2, 3, 4, 5, 6, 7, … , 19, 20)P(X is between 2 and 6) = P(X<=6) – P(X<=1)
Why?P(X<=6) = P(0) + P(1) + P(2)+P(3)+P(4)+P(5)+P(6)P(X<=1) = P(0) + P(1)Subtract these and the 0 and 1 cancel leaving:
P(2)+P(3)+P(4)+P(5)+P(6)This is what we want
Example: In-between ProbabilitiesWe have our town of 20 infants. Find the
following probabilities:Between 3 and 7 develop the diseaseAt least 1 develops the disease, but less
than 14
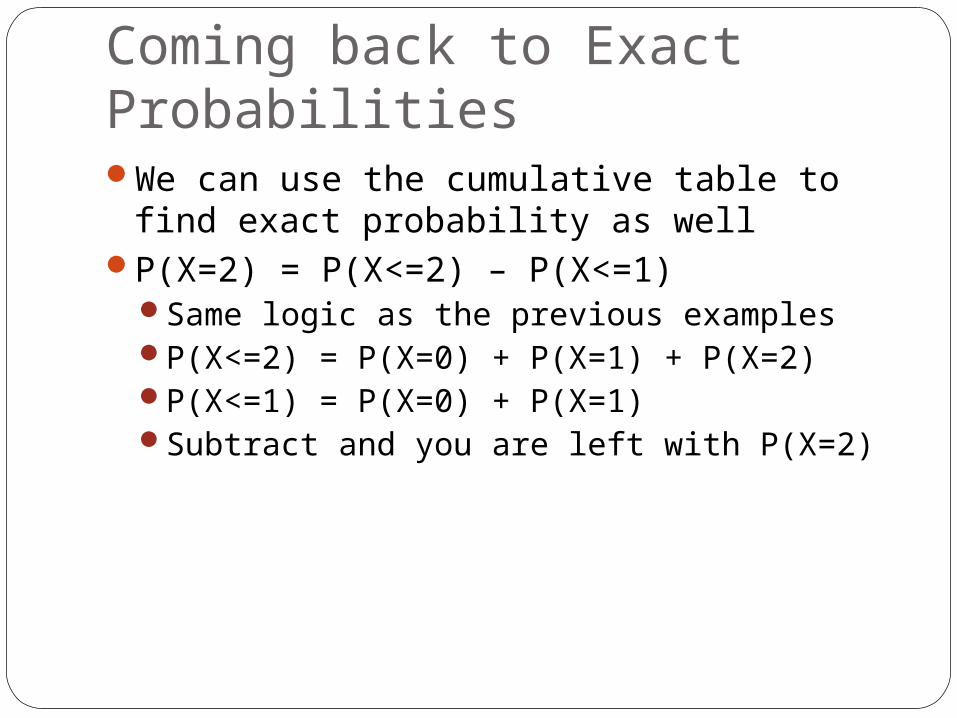
Coming back to Exact ProbabilitiesWe can use the cumulative table to find
exact probability as wellP(X=2) = P(X<=2) – P(X<=1)
Same logic as the previous examplesP(X<=2) = P(X=0) + P(X=1) + P(X=2)P(X<=1) = P(X=0) + P(X=1)Subtract and you are left with P(X=2)
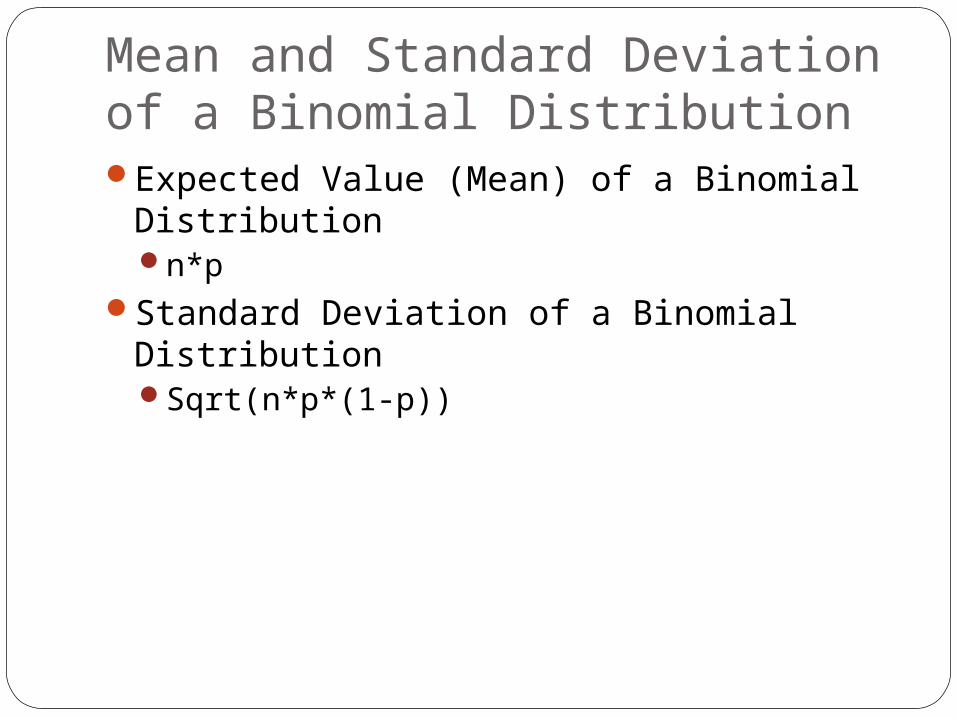
Mean and Standard Deviation of a Binomial DistributionExpected Value (Mean) of a Binomial
Distributionn*p
Standard Deviation of a Binomial DistributionSqrt(n*p*(1-p))