Embed Size (px)
Citation preview

Damming of Maine Watersheds and the Consequences for Coastal Ecosystems with a
Focus on the Anadromous River Herring (Alosa pseudoharengus and Alosa aestivalis):
A Four Century Analysis
A Thesis Presented
by
Carolyn Jean Hall
to
The Graduate School
in Partial Fulfillment of the
Requirements
for the Degree of
Master of Science
in
Marine and Atmospheric Science
Stony Brook University
December 2009

iii
Abstract of the Thesis
Damming of Maine Watersheds and the Consequences on Coastal Ecosystems with a
Focus on the Anadromous River Herring (Alosa pseudoharengus and Alosa aestivalis):
A Four Century Analysis
by
Carolyn Jean Hall
in
Marine and Atmospheric Science
Stony Brook University
2009
The anadromous river herring, collectively alewives (Alosa pseudoharengus) and
blueback herring (Alosa aestivalis), were historically abundant in most northeastern U.S.
coastal river systems and were an important resource for humans as well as fish and bird
predators. Colonial dam construction is considered the earliest principal cause of
migration pathway disruption and reduced population productivity. In order to
comprehensively examine the effect of dams on river herring spawning site access and
historical abundance in Maine watersheds, I created a timeline of dam construction from
1600 through the present.
I used published surveys, GIS layers and historical documents to create a database
of 1356 dams, which was then analyzed to determine date of construction, dam use and
resultant fragmentation of watersheds. Information regarding movement and catches of
anadromous fish were used to determine upstream limits of migration and establish total
potential spawning habitat in nine watersheds with historic river herring populations.
Subsequent loss of spawning habitat throughout 1600-1900 was then estimated. The
iv
results demonstrate impassable dam construction at head of tide on all Maine rivers by
1850 and a near total blockage of riverine and lake spawning habitat by the 1860s.
Between 1840 and 1880, alewife harvests shifted from primary rivers and
multiple watersheds along the entire Maine coast to three mid-coast secondary rivers.
From changes in available spawning area, I estimated annual alewife productivity per
watershed and for the state of Maine. I calculated a range of annual alewife productivity
using five potential production values: two based on harvest and percent escapement as
adult returns/lake area and three calculated by applying a cumulative frequency
distribution to virgin recruits as recruits/lake area. Across the nine watersheds, I found
maximum annual production losses ranging from 1 to 29 million alewives/year during
300 years, 1600 to 1900. Over the same period, I estimated a state-wide total maximum
production loss of 6.5 billion alewives. Today, annual alewife counts on three watersheds
with restoration efforts are at 2 – 6% of my maximum annual virgin production estimates.
This evaluation of historical watershed habitat access provides the first
comprehensive estimates of pre-colonial river herring populations in Maine and has
implications for our understanding of coastal rivers and the consequences of the loss of a
large and reliable forage base used by humans and other animals in both freshwater and
marine ecosystems. Also, the erection of dams eliminated much of the exchange of
organisms between freshwater and marine ecosystems long before any data is available,
thus altering habitat connectivity for diadromous species. This study begins to confront
current restoration goals including habitat restoration, baseline population targets, species
diversity and ecosystem resiliency in the face of changing environments and ecosystem-
based management of interdependent oceanic and freshwater living resources.

vi
Table of Contents
List of Figures…………………………………………………………………………...viii
List of Tables……………………………………………………………………………...x
Acknowledgements………………………………………………………………………xi
I. An introduction to the historical relationship between river herring and the
development of water power in the state of Maine……………………………………...1
Life history of river herring……………………………………………….1
Maine, anadromous fishes and industry…………………………………..2
Current stock status……………………………………………………….5
Application of historical ecology and the objective of this thesis………..5
Literature Cited…………………………………………………………………..10
II. Estimating a historic habitat baseline for diadromous species with a focus on river
herring
Introduction………………………………………………………………….…..13
Materials and Methods……………………………………………………….….17
Study area…………………………………………………………….….17
Determination of dam location and original construction……...…….….18
Determination of natural barriers to alewife upstream migration………..20
Mapping of dams and natural barriers………………...…………………21
Temporal analysis of historical spawning habitat………………………..21
Results……………………………………………………………………………23
Dam timeline……………………………………………………………..23
Spawning habitat analysis………………………………………………..24
Discussion………………………………………………………………………..27
History of anthropogenic alterations of the Maine landscape……….......27
Uncertainties in estimated historical river herring habitat……………….30
Implications for Restoration and Conclusion……………………………………32
Literature Cited………………………………………………………………......56
III. Watershed obstruction and the anadromous alewife: loss of ecological productivity in
the Gulf of Maine
Introduction………………………………………………………………………64
Materials and Methods………………………………………………….…..……68
Study area……………………………………………………….……......68
Historic and current alewife harvest sources…………………….………69
Watershed fishery productivity index……………………….…………...70
Identification of dams and natural barriers to spawning migration....…...70
Definition of historical alewife spawning habitat…………….……….....72
Quantifying habitat…………………………………...………….….…...72
Historical productivity estimates………………………………….…......73
Current production estimates……………………………………….……74
Results……………………………………………………………………….…...75

vii
Watershed contribution to harvest…………………………………….....75
Watershed fishery productivity index……………………………………76
Dams on waterways and historical alewife spawning habitat……….......77
Damariscotta River stock-recruitment data: 1949-1983…………………78
Total historical productivity potential for Maine and per watershed…….79
Comparison of virgin to present production……………….…………….81
Discussion…………………………………………………………….………….81
Watershed contribution………………………………………….….……82
Historical and current productivity………………………………..……..84
Future Directions and Conclusion…………………………………………..…...87
Literature Cited…………………………………………………………………109
IV. Summary……………………………………………………………………………115
Literature Cited………………………………………………………………………....119
Appendices………………………………………………………………………...........130
Appendix 2.1. List of sources used to date and locate mills and dams……........130
Appendix 2.2. Additional tables for analyzed watersheds with dams and percent
remaining stream and lake spawning habitat……………........................……...144
Appendix 2.3. Additional figures for analyzed watersheds with percent remaining
stream and lake spawning habitat………………………………………………148
Appendix 3.1. Additional tables for analyzed watersheds with remaining lake
habitat and five estimates of annual alewife productivity……………………...150
Appendix 3.2. Additional figures for analyzed watersheds with remaining lake
habitat and five estimates of annual alewife productivity……………………...154

viii
List of Figures
Figure 1.1. Gulf of Maine river herring commercial landings 1950 – 2005...….………..9
Figure 2.1. Dam and power house on St. George River circa early 1900s………………47
Figure 2.2. State of Maine with historical river herring watersheds assessed in this study
for temporal spawning habitat changes from 1600 – 1900………………………………48
Figure 2.3. Map of Blue Point, Maine drawn by H.G. Storer between 1830 & 1880.......49
Figure 2.4. Temporal and spatial accumulation of dams in Maine for which latitude and
longitude were determined……………………………………………………………….50
Figure 2.5. Temporal and spatial distribution of dam latitude and longitude in Maine from
1600 – 2000……………………………………………………………………………...51
Figure 2.6. Category 1 Watershed: Kennebec percent virgin habitat……………………52
Figure 2.7. Category 2 Watershed: St. George percent virgin habitat……………….…..53
Figure 2.8. Category 3 Watershed: Casco Bay percent virgin habitat……………….…..54
Figure 2.9. Casco Bay watershed with all dams constructed 1600 – 2008…………..…..55
Figure 3.1. Maine Landings compiled 1880 – 2007…………………………………......98
Figure 3.2. State of Maine with historical river herring watersheds assessed in this study
demarcated by associated documented dams along each watershed………………….....99
Figure 3.3. Detail of Maine coast with all watersheds identified that contributed to
harvests 1800-2007……………………………………………………………………..100
Figure 3.4. Watershed harvest contribution 1800 – 1900………………………………101
Figure 3.5. Damariscotta alewife fishery spawner – recruit curve……………………..102
Figure 3.6. Breakpoint analysis of observed recruits from Damariscotta River alewife
fishery data 1949 – 1983………………………………………………………………..103
Figure 3.7. Category 1 Watershed: Kennebec lake area and annual alewife
productivity……………………………………………………………………………..104
Figure 3.8. Category 2 Watershed: St. George lake area and annual alewife
productivity………………………………………………………………………..……105

ix
Figure 3.9. Category 3 Watershed: Casco Bay lake area and annual alewife
productivity……………………………………………………………………………106
Figure 3.10. State of Maine annual productivity and changes in percent annual virgin
productivity over fifty-year increments……………………………………………….107
Figure 3.11. Comparative annual alewife production in the Dennys, Androscoggin and
Kennebec watersheds………………………………………………………………….108
x
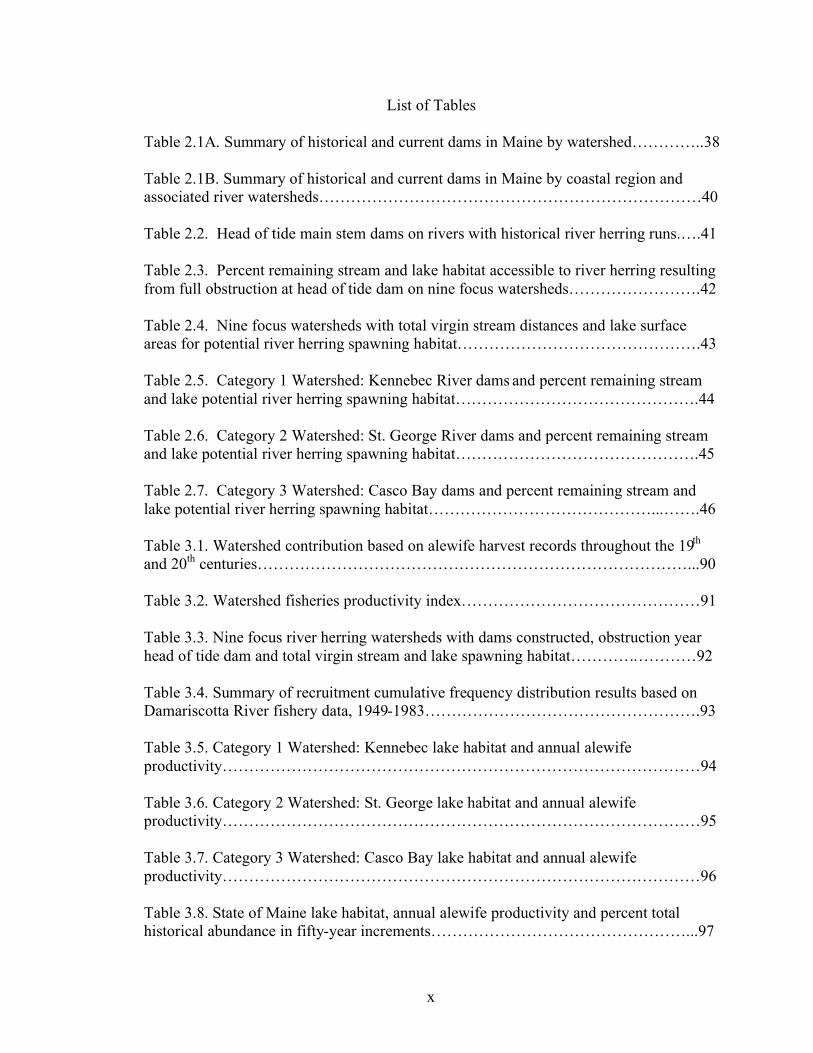
List of Tables
Table 2.1A. Summary of historical and current dams in Maine by watershed…………..38
Table 2.1B. Summary of historical and current dams in Maine by coastal region and
associated river watersheds………………………………………………………………40
Table 2.2. Head of tide main stem dams on rivers with historical river herring runs.….41
Table 2.3. Percent remaining stream and lake habitat accessible to river herring resulting
from full obstruction at head of tide dam on nine focus watersheds…………………….42
Table 2.4. Nine focus watersheds with total virgin stream distances and lake surface
areas for potential river herring spawning habitat……………………………………….43
Table 2.5. Category 1 Watershed: Kennebec River dams and percent remaining stream
and lake potential river herring spawning habitat……………………………………….44
Table 2.6. Category 2 Watershed: St. George River dams and percent remaining stream
and lake potential river herring spawning habitat……………………………………….45
Table 2.7. Category 3 Watershed: Casco Bay dams and percent remaining stream and
lake potential river herring spawning habitat……………………………………...…….46
Table 3.1. Watershed contribution based on alewife harvest records throughout the 19th
and 20th
centuries………………………………………………………………………...90
Table 3.2. Watershed fisheries productivity index………………………………………91
Table 3.3. Nine focus river herring watersheds with dams constructed, obstruction year
head of tide dam and total virgin stream and lake spawning habitat……………………92
Table 3.4. Summary of recruitment cumulative frequency distribution results based on
Damariscotta River fishery data, 1949-1983…………………………………………….93
Table 3.5. Category 1 Watershed: Kennebec lake habitat and annual alewife
productivity………………………………………………………………………………94
Table 3.6. Category 2 Watershed: St. George lake habitat and annual alewife
productivity………………………………………………………………………………95
Table 3.7. Category 3 Watershed: Casco Bay lake habitat and annual alewife
productivity………………………………………………………………………………96
Table 3.8. State of Maine lake habitat, annual alewife productivity and percent total
historical abundance in fifty-year increments…………………………………………...97

xi
Acknowledgements
Many, many people made the accomplishment of this project possible through
their generosity of time, wisdom and friendship. First, I thank my advisor Michael Frisk
and my mentor/first reader Adrian Jordaan for entrusting me with this project, for always
being open to my questions and for being available with advice all along the way. I also
thank my readers Darcy Lonsdale and Marah Hardt for their indispensable insight and
direction. I would like to acknowledge the excellent work of undergraduate researchers
Veronica Scorcia and Jaime Wright. Also, heartfelt thanks are due to my fellow SoMAS
students and outside-world friends, too many to name, who contributed moral and
practical support and escapes from academia as well as the occasional crash pad.
This work has benefited greatly through conversations with and contributions by
Gail Wippelhauser and Tom Squiers of the Maine Department of Marine Resources,
William Wise and Robert M. Cerrato of Stony Brook University, William Leavenworth
and Karen Alexander of the University of New Hampshire, Edward P. Ames of the
Penobscot East Resource Center, Theodore Willis of the University of Southern Maine,
Michele Dionne of the Wells National Estuarine Research Reserve, Bruce Connery of
Acadia National Park and Rory Saunders of NOAA
For invaluable help with my historical research I am indebted to Jeffery Brown,
Anthony Douin and Anne Small of The Maine State Archives, Jaime Rice of The Maine
Historical Society, Brenda Howiston Steeves and Richard Hollinger of The Fogler
Library Special Collections at the University of Maine Orono, William Cook of The
Bangor Public Library Local History/Special Collections and Edward (Peter) Steenstra of
the Craig Brook National Fish Hatchery.

xii
This research was funded by a 2007 Mia J. Tegner Memorial Research Grant in
Marine Historical Ecology and Environmental History (awarded to Adrian Jordaan) and
the NOAA bluefish research award NA07NMF4550320.

1
Chapter 1: An Introduction to the Historical Relationship Between River Herring and the
Development of Water Power in the State of Maine.
“We are informed that some Time since a Man living in Haverhill, being a great lover of Fish, sat
down and eat upwards of a Hundred Alewives in the space of two Hours & half.”
Boston Gazette, December 22, 1747
Much has been written on the history of the State of Maine – its abundant natural
resources, the tenacity and independence of the early settlers, the disappearance of
indigenous peoples and the long term exploitation of fish and forests through early
fishery, timber and shipbuilding industries (Carlton 1983; Whitten 1990; Duncan 1992;
O’Leary 1998; Paine 2000; Wilson 2001). By focusing on colonists’ early use of Maine
waterways, two conflicting feats of ingenuity become evident: the harnessing of water
power by mill dams and sustenance and profit from those rivers in the form of harvested
diadromous and coastal wild fish populations (Cronon 1983; Judd 1997). These early
practices began a legacy of resource depletion that has resulted in severely diminished
river herring populations and current efforts to manage and restore this species and their
coastal ecosystems (ASMFC 2009).
Life history of river herring
Diadromous fishes (anadromous and catadromous) divide their life cycles by
migrating between freshwater and ocean systems. Anadromous species mature and live as
adults at sea but return to freshwater habitat to spawn whereas catadromous species have
the reverse migration pattern (Bigelow & Schroeder 1953). The model species of this
thesis, the anadromous river herring (collectively alewife, Alosa pseudoharengus, and

2
blueback herring, Alosa aestivalis), were once found in most North American rivers
along the Atlantic coast from Newfoundland to North Carolina (MDMR et al. 1982). In
Maine, the iteroparous alewives and bluebacks spend three to five years reaching
reproductive maturity before returning to natal bays and estuaries for spawning between
late April and early July. The return is thought to be triggered by lengthening daylight
and increases in water temperature, with spawning adults preferring freshwater of 14o-
15.5o C (Baird 1874; MDMR et al. 1982; ASMFC 2009). Alewives historically migrated
over 300 km past steep waterfalls and ledges to reach spawning areas in the quiet waters
of Maine’s lakes and ponds; bluebacks prefer riverine habitat near head of tide with
moving water (Atkins & Foster 1868; MDMR et al. 1982). Both are deterred by high
velocity flows and primarily migrate in daylight navigating along the shoreline (Atkins &
Foster 1868). Post-spawning adults return to sea within days and juveniles begin their
seaward migration one to two months after hatching. These fish provide an important link
between inland and marine environments, supplying nutrients from each to the other.
They are mid-trophic level species that prey primarily on zooplankton and are foraged
upon by numerous upper-trophic level bird and fish predators including osprey (Pandion
haliaetus) and Atlantic cod (Gadus morhua) (ASFMC 2009).
Maine, anadromous fishes and industry
The historically abundant populations of anadromous species including salmon
(Salmo salar), sturgeon (Acipenser oxyrhinchus), striped bass (Morone saxatilis), shad
(Alosa sapidissima), smelt (Osmerus mordax mordax) and river herring that returned
annually to Maine’s coastal watersheds provided a reliable, sustainable food source for

3
indigent inhabitants (MDMR et al. 1982; Cronon 1983; Paine 2000). The importance of
these fishes to Maine Indians is reflected in local place names: Skowhegan: a place to
watch for fish/salmon; Madamiscomtis (Blackman Stream): plenty of alewives;
Cabbasaconteag (Cobbosseecontee Stream): where the sturgeon is found and
Madamaswok (Cold Stream in Enfield): alewife stream (Hanson 1852; Trefts 2006).
Before the arrival of European colonists, river herring, along with salmon and shad, were
a staple in the diets of indigenous peoples who caught them with dipnets, weirs and
spears as they made their way upstream to spawn (Josselyn & Lindholt 1988; Paine
2000). These fishes soon became important resources for early 17th century European
settlers in territories that would later become the New England states. European explorers
and naturalists in the 16th and 17
th centuries made numerous references to the surprisingly
large numbers of coastal and river fishes and other wildlife in their reports:
“Sturgeon, salmon, herrings, eels, smelts: all in great abundance…Besides there
are such infinite flocks of Fowle, and Multitudes of fish both in the fresh waters,
and also on the Coast, that the like hath not else where bin discovered by any
traveler.”
Morton 1637: 89, 95
Not only were alewives and bluebacks fine fishes for human consumption – easy to
preserve by smoking, pickling or salting – they were also good bait for coastal and off-
shore fishing and good fertilizer for crops (Morton 1637; Baird 1883). As a result, river
herring were valuable in their own right for local consumption and commercial harvest in
addition to being a valuable forage fish for economically important coastal game fish that
came inshore to feed on the schools returning during spring spawning (Baird 1883).
The same rivers that provided these bountiful fish were seen as a potential source
of power for mills from the fall of water over ledges and the rushing of tide into coves.

4
With colonial settlement quickly came dams and mills to grind grain, saw timber, make
gunpowder and weave cloth (Dwight 1821; Wells 1869; Moody 1933; Carlton 1983;
Whitten 1990). The abundance of tall trees for masts and shipbuilding encouraged timber
harvesting and the building of more dams to control river water levels enabling transport
of logs over ledges (Wells 1869; Moody 1933; Wilson 2001).
Construction of dams on large and small waterways through the 17th, 18
th and 19
th
centuries obstructed access for river herring, salmon and shad to upstream spawning
grounds. With decreased passage came an increasingly noticeable decline in the presence
of these valuable anadromous species. Declines in coastal marine species that fed on the
millions of spawning anadromous fishes soon followed. Notable among these predators
was the Atlantic cod that constituted the oldest, largest and most economically important
fishery in the new territories (Innis 1940). The decline of this fishery and the blow to
local economies created a strong desire to restore productive populations, including a
demand to restore cod’s anadromous forage base.
“…the reduction in the cod and other fisheries, so as to become practically a failure, is
due, to the decrease off our coast in the quantity, primarily, of alewives; and secondarily,
of shad and salmon, more than to any other cause.”
Baird 1874: xii
The implications of the loss of anadromous and coastal fishes created legal battles
between those who relied on fish harvests for their livelihood and those who relied on
mills and water power. Petitions from both sides were submitted from towns on many of
Maine’s rivers including the Mousam, Presumpscot, Penobscot, Kennebec, St. George,
and St. Croix. Coastal and inland fishermen demanded passage of anadromous fishes
over mill dams be made mandatory to maintain longstanding fisheries while mill owners
argued logging and mill industries were more economically important than local fisheries

5
and fish passages would significantly injure water power and production (Emory 1901).
The Commonwealth of Massachusetts followed by the state government of Maine began
passing laws to prohibit obstruction of upstream passage of alewives, salmon and shad in
the 18th
century but often mill owners were granted exceptions or the laws were not
enforced so blockage remained.
Current stock status
Today, reduction of access to spawning sites for anadromous species, as well as
waterway pollution and overfishing, has had serious effects on the conditions of the
stocks. In the Gulf of Maine, the National Oceanic and Atmospheric Administration
(NOAA) river herring landings show significant declines in the fishery over the last 30
years, with a collapse in the 1990s (Figure 1.1). The Atlantic States Marine Fisheries
Commission (ASMFC) reported a 93% decline in river herring commercial landings from
over 13 million pounds in 1985 to under 1 million pounds in 2007 (ASMFC 2009).
Despite policies passed to protect and restore the species including mandatory fish
passage on hydropower dams, fishery closures and improved monitoring (MDMR et al.
1982; ASMFC 2009), the severity of the stock condition led to NOAA Fisheries listing
river herring as a species of concern in 2006 (NOAA 2006).
Application of historical ecology and the objective of this thesis
"Out of monuments, names, words, proverbs, traditions, records, fragments of stone, passages of
books, and the like, we recover somewhat from the deluge of time."
Merrill 1891: frontispiece

6
The extirpation of economically important fishery stocks and the failure of
management policies based on 20th
century landings and trawl data has led to an
increased application of historical ecology research to evaluate long-term abundance,
fishing effort and population biology for species of concern. Using both quantitative and
qualitative historical data and anecdotes, the goal is to provide more accurate estimates of
former population abundance before heavy exploitation so management baselines can be
adjusted to create more realistic expectations of recovery (Pauly 1995; Jackson et al.
2001). This has been done with success in New England and elsewhere across the globe
for many ecosystems. For instance, Rosenberg et al. (2005) analyzed fishery logs of
Canada’s Scotian Shelf and other local fishery documents from the mid 19th
-century for
historical Atlantic cod stock assessment. The paper demonstrated that estimated
abundance in 1852 may have been three times greater than the highest Atlantic cod
biomass estimates of the last 30 years. In another approach, Ames (2004) used fishery
data and surveys of retired fishermen from 1920 to reconstruct and map historic
spawning grounds, migration patterns and stock movement of cod in coastal Gulf of
Maine. He used current cod egg presence to identify active spawning grounds as
compared to areas of historic or lost spawning grounds illustrating the significant decline
of inshore cod spawning populations. Ames concluded that Gulf of Maine coastal cod
spawning grounds from 50 to 70 years ago have been reduced by nearly 50 percent.
Yet another study, by Lotze and Milewski (2004), expanded the application of
historical research techniques to examine 200 years of human impacts on the components
of the food web in the Quoddy Region of the Bay of Fundy coastal ecosystem just north
of the Gulf of Maine. As with Rosenberg et al. (2005) and Ames (2004), they used

7
historical data (anecdotal reports and archeological studies) and recent catch data to
assess abundance from the mid-1800s to present. Especially relevant to this thesis is the
evaluation of diadromous fishes in the St. Croix River, particularly gaspereau (called
river herring in the U.S.). Potential historic abundance estimates were calculated based on
reduction of available habitat due to human degradation. Current abundance estimates of
gaspereau were reported to be less than one percent of the estimated abundance before
1825. They attributed this decline to long-term effects of dam construction, pollution
from mills and effluents from industrial activities and sewage (Lotze & Milewski 2004).
It has been suggested that Gulf of Maine coastal cod populations would follow
and feed on the formerly large spawning populations of river herring returning to coastal
watersheds and loss of this important forage fish contributed to the decline of inshore cod
populations (Shaw & Allen et. al. 1824; Baird 1874; Graham et al. 2002; Ames 2004). In
order to further investigate this predator-prey relationship, a historical assessment of river
herring is needed to compare to historical cod analyses. This research initiates this
investigation by examining one principal anthropogenic mechanism that contributed to
the decline of anadromous species over 400 years of development on Maine’s
watersheds: the proliferation of dam construction for water power.
This study seeks to establish a timeline of dam construction on Maine’s
waterways from 1600 to present and to explore the landscape-level effect early
obstructions had on the passage and abundance of spawning anadromous fish,
specifically river herring. In chapter two, a temporal and spatial analysis of accessible
spawning habitat was conducted to illustrate the impact of dam obstruction on river
herring as settlements and industry expanded throughout the state. In chapter three,

8
results of the spawning site analysis were used to calculate estimates of alewife
production as access to spawning habitat was reduced by waterway obstructions.
Historical estimates are compared to current records of production and catch data to
illustrate shifts in productivity baselines. Also investigated were changes in watershed
contribution to alewife harvests from 1800 to the present. Finally, the research results are
summarized and implications for Gulf of Maine ecology, conditions and management of
watershed ecosystems, including the impact on coastal cod populations, are discussed.
This research presents an approach to utilizing existing historical data and
anecdotes to analyze former species abundance that can potentially be applied to other
species and ecosystems. It also will help further understanding of the profound effect
European colonial settlement and development had on anadromous and coastal marine
fish populations in the Gulf of Maine and its river systems, and how best to tackle
restoration efforts.

9
Figure 1.1. Gulf of Maine river herring commercial landings 1950-2005 from NOAA
website: www.nefsc.noaa.gov/sos/spsyn/af/herring/

13
Chapter 2: Estimating a historic habitat baseline for diadromous species with a focus on
river herring
Introduction
Widespread losses of species, and large-scale environmental degradation over the
past 400 years have been well documented (Lotze et al. 2006; Jackson 2008). Studies
have identified estuaries, coastal seas, coral reefs, large predators, marine mammals,
valuable shellfish and diadromous species as those particularly harmed. Effective
restoration requires an understanding of the historical condition of ecosystems and the
wildlife they sustained before significant anthropogenic alteration (Jackson et al. 2001).
Unfortunately, standardized records of watershed conditions and fish harvests in the U.S.
were not kept until the 1860s when the Federal and State Fish Commissions were formed
(Atkins & Foster 1868; Judd 1997). Yet, concentrated commercial fishing, damming of
riverways, forestry and agriculture had been altering the condition of river ecosystems
since the arrival of European colonists in the 17th
century. Data evaluation from this 200-
year gap is required to avoid the “shifting baseline syndrome” or the practice of basing
management and restoration policies on recent data from heavily exploited systems
instead of data from eras of former abundance and more pristine conditions (Pauly 1995).
The fracturing of coastal watersheds by human-made obstructions has been
occurring worldwide for thousands of years (Dynesuis & Nilsson 1994; Larinier 2000).
Damming of waterways not only drastically alters the aquatic environment and
surrounding landscape through sedimentation, channelization, flooding and temperature
changes (Poff et al. 1997; Poff & Hart 2002; Walter & Merritts 2008), it also prevents the

14
passage of migratory species and exchange of nutrients between marine and inland
freshwater ecosystems (Kline et al. 1990; Bilby et al. 1996; MacAvoy et al. 2000;
Walters et al. 2009). Such anthropogenic habitat reduction and isolation leads to
population decline and extirpation of species (Pess et al. 2008; Morita et al. 2009). The
resulting impact can be alteration of food web structure and reduction of watershed
biodiversity, not only in freshwater systems, but cascading effects are felt along coastal
ocean environments (Jackson et al. 2001). For example, Atlantic cod (Gadus morhua)
fed on alewife (Alosa pseudoharengus), blueback herring (Alosa aestivalis) and shad
(Alosa sapidissima) while these forage species undertook migrations between freshwater
spawning sites and offshore overwintering grounds (Shaw & Allen et al. 1824; Baird
1872; Graham et al. 2002). The decline of coastal cod populations (and the loss of
millions of dollars and hardship for dozens of communities) forced commercial fisheries
to increase offshore effort and has been linked to the loss of the nutritious and predictable
food source the above forage species provided (Baird 1883; Ames 2004).
Diadromous species of the region – those that cross the ocean-freshwater
boundary to complete spawning – include the anadromous alewife and blueback herring
(collectively river herring), American shad, Atlantic salmon (Salmo salar), Atlantic
sturgeon (Acipenser oxyrinchus), rainbow smelt (Osmerus mordax), striped bass (Morone
saxatilis), the often-estuarine shortnose sturgeon (Acipenser brevirostrum) and the
catadromous American eel (Anguilla rostrata). These species were historically abundant
supporting commercial fisheries and serving as a staple in not only local human
consumption, but as food for other fish and birds along the Gulf of Maine’s coastal and
inland ecosystems (Atkins & Foster 1868; Baird 1872; Mullen et al. 1986). Other

15
parasitic and sympatric species were also linked through dependence on these migratory
fish. Presently, river herring and Atlantic sturgeon are listed as species of concern and
Atlantic salmon and shortnose sturgeon are endangered species (NOAA 2006;
http://www.maine.gov/IFW/wildlife/species/endangered_species/state_federal_list.htm).
Thus, efforts to provide long-term solutions through population and watershed restoration
are of immediate importance.
Historic accounts demonstrated higher abundances compared to the present-day,
but exact censuses are not available. For example, in 1674 naturalist John Josselyn noted
that over ten thousand alewives were taken by two men in two hours without a weir
(Josselyn & Lindholdt 1988). A century later, historian J.W. Hanson wrote of 1780s seine
fishing on the Kennebec watershed where “incredible numbers of shad, [river] herring,
salmon and sturgeon, were taken every spring” (Hanson 1874: 155). However, by the mid
18th
century, decline of this previously abundant resource led to laws authorizing the
“preservation of the Fish called Salmon, Shad and Alewives” (Anon. 3/26/1798; Moody
1933) and creation of fish warden positions due to concern over dams blocking upstream
migration (Wheeler & Wheeler 1878; Cushman 1882). By the late 1800s these
ecologically and economically important species were in decline in many of Maine’s
rivers and had been extirpated from some (Atkins & Foster 1868; Bigelow & Schroeder
1953). After their first comprehensive evaluation of Maine watersheds, Maine
Commissioners of Fisheries, Atkins and Foster (1868), concluded the construction of
dams was “sufficient to account for the entire extinction of the migratory fishes in all
waters above these obstructions” and 20 years later estimated that only 10% of the
original habitat remained available for spawning (Atkins 1887). Efforts to regulate

16
harvests and re-introduce populations occurred throughout the 19th and 20
th centuries
(Atkins & Stillwell 1874; Atkins 1887; Rounsefell & Stringer 1942; MBSRFH 2007), yet
despite those efforts, present populations are at historic lows with some at less than 1% of
early 19th
century estimations (Lotze & Milewski 2004; Saunders et al. 2006). Still, no
systematic comprehensive attempts have been made to assess former population sizes of
these important ecological links between freshwater and marine environments.
European colonists began damming waterways in the 17th
century primarily to
power grist and saw mills (Moody 1933; Clark 1970; Smith 2002). As settlements and
towns spread across Maine’s coast and up rivers to forested inland areas, hundreds of mill
dams (Figure 2.1) were constructed wherever natural waterfalls, ledges and topography
provided an area of impoundment and the vertical height (head pressure) required to
generate mechanical energy (Clark 1970). The earliest recorded water-powered saw mill
in Maine was built near the Maine-New Hampshire border on a tributary of the
Piscataqua/Salmon Falls River in 1634 (Pope 1965). By 1665 more than 20 saw mills had
been constructed within the Piscataqua River watershed (Clark 1970) increasing to 70 by
1706 (Paine 2000). Statewide accounts in 1829 estimated that 1,686 principal
manufacturing establishments depended upon water-power including grist, saw, cotton,
fulling and other mills (Greenleaf 1829). Only 40 years later, the number had expanded to
over 3,100 water-power privileges both impounded and unimproved (Wells 1869).
Throughout the 19th
century, larger scale logging and mill operations were being
developed with improved technology enabling dam construction to span large rivers at
the head of tide (Atkins & Stillwell 1874; Judd 1997; Wilson 2001).

17
Here I attempt to discern the loss of spawning site access from 1600-1900 due to
these obstructions. My model species is the river herring, a mid-trophic level anadromous
fish that chiefly feed on zooplankton (Bigelow & Schroeder 1953) and an important
forage fish for freshwater and ocean predators (Pardue 1983; Mullen et al. 1986; Fay
2003). River herring use both rivers (bluebacks) and lakes (alewives) for spawning and
alewives were historically known to migrate over 300 km (Atkins & Foster 1868). The
first objective is to present a spatial and temporal analysis of obstructions within Maine
from early mill dams of the 17th and 18
th centuries and logging industry dams of the early
19th
century to the introduction of hydroelectric dams in the late 19th
century. The second
objective is to quantitatively present an analysis of accessible spawning area affected by
the erection of dams over time using river herring as an example species. The final
objective is to evaluate the current status of alewife populations in light of the historical
baseline determined from objective 1 and 2 for the state of Maine, and discuss the
application of this analysis to restoration efforts in these impacted coastal watersheds.
Materials and Methods
Study area
Dams throughout Maine were documented, but analysis of river herring spawning
habitat was limited to nine watersheds referenced as having historical alewife populations
(Figure 2.2). These watersheds were placed into three categories 1) primary river
watersheds with extensive tributaries totaling a stream distance (main stem river plus
tributaries) of 1000 km or greater 2) secondary watersheds with few tributaries totaling
less than 1000 km and 3) bay-based watersheds composed of multiple small rivers and

18
coastal waterways. Category 1 watersheds are the Androscoggin, Kennebec and
Penobscot Rivers. Category 2 watersheds are the Mousam, Sheepscot, St. George, Union
and Dennys Rivers. The Casco Bay watershed with the Presumpscot River comprises
category 3. Note: the Androscoggin River was only researched for stretches lying within
the Maine state border. Also included is the Damariscotta River secondary watershed
referenced in this study.
Determination of dam location and original construction
Two comprehensive databases served as primary references to locate and identify
currently standing or recently removed dams. The Maine Geographic Information
Systems (MEGIS) Impound database completed in 2006 by the US Fish and Wildlife
Service Gulf of Maine Coastal Program (MEGIS 2006) and the Trails.com publicly
available U.S. Geological Survey (USGS) quad topographic maps of Maine (Trails.com
April 2009). The MEGIS database includes full demographics of still functional dams
including waterway, latitude and longitude, ownership, year of completion of the most
recent dam at the location (not the original configuration), structural height, and limited
information about recent breaches or removals. It was developed from data collected in
the U.S. Army Corp of Engineers (USACE) 1987 Dam Survey, Maine Department of
Environmental Protection (MEDEP), Bureau of Land & Water Quality (BL&WQ) staff
for use with BL&WQ projects. The Maine Emergency Management Agency (MEMA)
reviewed all point locations against existing orthophotography or digital raster graphic
base layers. Point locations of dams, levees, and impoundments in Maine are at 1:24000
scale. The Trails.com database is organized by county and searchable by specific features

19
including dams. It provides a corresponding map with nearest town, elevation, latitude
and longitude for each dam. Additionally, inventories of removed dams, potentially
removable dams and dams subject to regulated minimum flow releases listed by the
Maine Department of Environmental Protection (MDEP) were referenced as a third
source for current dams (MDEP 2009).
The most comprehensive historic reference for dams is The Water-power of
Maine, a hydrographic survey of Maine from the 1860s (Wells 1869). Initial results of
surveys conducted in 1867 were published in 1868 (Wells 1868) with a complete return
of surveys and water resource demographics published in 1869. Not all dams reported in
Wells’ comprehensive hydrological survey (1869) were included in this study. Omitted
dams fell into four categories: 1) not located due to an historic name or no precise
location mentioned, 2) upstream of alewife migrations, 3) on tributaries with no pond
area considered suitable for alewife spawning, or 4) one of many already surveyed dams
on a short stretch of obstructed waterway (under 3 miles).
Nineteenth and 20th
century governmental reports were also used to identify and
date dams. These included Maine Commissioner of Fisheries (COF) reports from 1868 to
1899 (Atkins & Foster 1868, 1869; Atkins & Stillwell 1874; Atkins 1887; Smith 1899)
and alewife fisheries reports and river survey and management reports through the 1980s
(Rounsefell & Stringer 1943; MDIFG 1955-1967; ASRSC 1982-1983).
Dates and locations of dams constructed before Wells’ 1867 survey were found in
numerous popular and legislative historical sources. In historical literature, mills are
documented much more consistently than the dams used to power them – it was assumed
the presence of a mill indicated the presence of a dam. Such sources included wills,

20
historical magazines and journals, town histories, 18th
and early 19th
century newspaper
articles and records of early 19th century legislative acts and petitions from the Maine
State Archives (Maine Legislative Records 1821-1830). Hand drawn maps labeled with
early settlement buildings including mills were sometimes included in popular
publications and gave clear references to location and date of existence (Figure 2.3). For
a full list of references used to date and locate mills and dams see Appendix 2.1.
Locations and latitude and longitude in decimal degrees for existing and historical
dam sites were confirmed or determined using the twenty-sixth (2003) and thirtieth
(2007) editions of the DeLorme Maine Atlas and Gazetteer™ and Google Earth 5.0
during the period of January to July 2009. Additionally, personal site visits were
conducted throughout the state of Maine in 2008 and 2009 to ground-truth over 90 dams
with GPS, photographs and conversations with current owners and local residents.
The spatial pattern in dam construction was investigated by plotting the latitude
and longitude of the dam site against the year of original construction.
Determination of natural barriers to alewife upstream migration
Natural, or non-anthropogenic, barriers to upstream passage of anadromous
species, particularly those of alewives, were determined using the Maine COF reports,
alewife fishery reports and river survey and management reports referenced in the
previous section (Atkins & Foster 1868, 1869; Atkins & Stillwell 1874; Atkins 1887;
Smith 1899; Rounsefell & Stringer 1943; MDIFG 1955-1967; ASRSC 1982-1983).
Natural barrier location and latitude and longitude in decimal degrees were determined
21
using the twenty-sixth (2003) and thirtieth (2007) editions of the DeLorme Maine Atlas
and Gazetteer™ and Google Earth 5.0 during the period of January to July 2009.
Mapping of dams and natural barriers
Obstructions were mapped using ESRI® ArcGIS™ v.9.3. Map base layers in
1:24000 scale of watersheds, counties and coastline were obtained from the MEGIS
database (MEGIS 2004). Latitude and longitude in decimal degrees were geo-referenced
using the Geographic Coordinate System North America 1983.
Temporal analysis of historical spawning habitat; stream distance and lake surface area
“No stream seems to be too small for [alewives] if its waters are derived from a pond, and
there can have been hardly an accessible pond in the whole state they did not visit.”
Atkins 1887: 687
Because of historical omnipresence of alewives in Maine ponds and lakes with
connection to the ocean (Atkins 1887; Mullen et al. 1986), all water bodies below natural
barriers within known alewife migration distances were considered potential spawning
sites. Documentation or discussion of maximum upstream alewife migration not
determined by natural barriers was found in Maine COF reports, alewife fisheries and
river survey and management reports (Atkins & Foster 1868, 1869; Atkins & Stillwell
1874; Atkins 1887; Smith 1899; Rounsefell & Stringer 1943; MDIFG 1955-1967;
ASRSC 1982-1983).
Town histories were instrumental in determining presence or absence of alewives.
For example, The History of Sanford Maine 1661-1900 (Emery 1901) discusses litigation
regarding fish passage for salmon, alewives and shad at mills within the town limits of

22
Sanford on the Mousam River. This provides evidence that alewives were able to
surmount the considerable falls downstream of Sanford. In cases such as the Mousam
River, popular literature provides the only evidence that alewives existed in this
waterway because alewives were extirpated by the time fishery reports and watershed
analyses were made (Atkins & Foster 1868, Rounsefell & Stringer 1943).
Streams categorized as perennial in the MEGIS database (MEGIS 2004) that led
to ponds within alewife migration ranges were used to calculate stream migration
distance whereas streams categorized as intermittent were not included. Reports that
bluebacks will migrate to and somewhat above head of tide to spawn in moving water
(MDMR et al. 1982) determined the inclusion of perennial streams without connection to
water bodies within the distance of head of tide.
Virgin, or unobstructed, potential spawning habitat, was estimated using river and
lake demographics from MEGIS 2004 to calculate total stream distance (km), composed
of main stem river and all accessible tributaries, and total lake surface area (km2) to
maximum upstream alewife migration imposed by natural barriers. For this study, virgin
spawning habitat was dated in year 1600, pre European colonization.
Changes in accessible stream distance and lake surface area resulting from dam
construction were calculated chronologically at the year of dam construction from 1600
through 1900. In the case of large river main stem blockage, particularly dams at head of
tide, historical reports from Atkins (1887) and other publications stated the year of full
obstruction to anadromous fishes, therefore main stem dams were not considered
obstacles until sourced dates. Inaccessible stream distance and lake area upstream of the
completed dam were subtracted initially from the virgin total and from remaining

23
distance and area totals subsequently. Percent stream distance (SD) or lake surface area
(LSA) still available was then calculated using
% remaining spawning habitat = SD or LSA available * 100
virgin SD or LSA
Percent remaining spawning habitat was calculated each year a dam was completed that
impacted accessible habitat. Dams built upstream of an already accounted for obstruction
were not included in this assessment.
Results
Dam timeline
A total of 1356 historical and current dams were documented across all
waterways in the state of Maine from the Piscataqua/Salmon Falls in the southwest to the
St. Croix River in the northeast and all inlets and islands along the coast (Table 2.1A). A
comprehensive database with the history of each dam including use, dates of construction
and reconstruction, owners, fish passage capability, hydrology, etc. can be viewed at the
Gulf of Maine Historical Ecology Research website: www.GOMHER.org. Dams were
grouped according to watershed access to coastal regions divided into western, central
and eastern (Table 2.1B). The western Maine coastal region includes, from west to east:
the Piscataqua/Salmon Falls, York, Mousam, Kennebunk, Saco, Fore, Presumpscot and
Royal Rivers (Table 2.1A). A total of 400 dams were documented in this region with the
earliest dam constructed in 1634. The central region includes, from west to east: the
Kennebec, Sheepscot, Damariscotta, Pemaquid, Medomak, St. George and Penobscot

24
Rivers. A total of 637 dams were documented in this region with the earliest dam
constructed in 1640. The eastern region includes from west to east the Union,
Narraguagus, Pleasant, Machias, East Machias, Orange, Dennys, Pennamaquan, St. Croix
and St. John Rivers. A total of 319 dams were documented in this region with the earliest
dam constructed in 1763. Of the 1356 dams documented in this study, 47% (634 dams)
were still present on the waterways as of 2006 (Table 2.1B). Not all dam locations were
identified clearly enough in the literature for exact, or estimated, latitude and longitude; a
total of 1333 dams were assigned coordinates and are presented in Figure 2.4A.
Accumulation of dams across the state on all watersheds is mapped in four time
periods: 1630 – 1750 (Figure 2.4B), 1630-1800 (Figure 2.4C), 1630-1850 (Figure 2.4D)
and 1630-1900 (Figure 2.4E). A total of 43, 164, 187 and 521 dams were completed
between 1630-1750, 1751-1800, 1801- 1850 and 1851-1900, respectively. A total of 915
dams were completed by 1900. Between 1750 and 1800, dam completion had more than
tripled and by 1900 had increased 20-fold.
Dam development remained mostly localized between 43.0o to 44.2
o latitude and
-71.0o to -69.0
o longitude until northeast expansion in the mid 1700s (Figure 2.4B, C) as
indicated by the plot of latitude and longitude against year of original construction
(Figure 2.5). The rate of expansion to the east was more rapid than to the north, or inland,
but by 1850 maximum range was reached in both directions while the density of dams
continued to increase through to the present (Figure 2.4, 2.5).
Spawning habitat analysis

25
From 1720 to 1846, dams impassable to river herring were constructed at or near
head of tide on the main stem of all Maine watersheds (Table 2.2). Head of tide dams
alone reduced accessible stream distance 42-93% and lake area 67-100% (Table 2.3).
Head of tide dams had the greatest impact on the Kennebec, Mousam and Casco Bay
watersheds with less than 1% of virgin lake surface area remaining after construction
(Table 2.3).
Substantial virgin spawning habitat for blueback herring (stream distance in km)
and alewives (lake surface area in km2) existed before dams were constructed on the nine
focus watersheds (Table 2.4). The Penobscot watershed had the most virgin habitat in
Maine with 5332 km of streams and 327.7 km2 of lake area. The Mousam watershed is
the smallest examined in this study with 183.5 km of streams and 10.7 km2 of lake area.
The Androscoggin River total virgin stream distance is less than 1000 km, the requisite
distance for a category 1 watershed, limited by natural barriers to alewife migration
within the lower Androscoggin and the borders of present day Maine (Figure 2.2).
A representative watershed for each category is used to illustrate chronological
changes in available spawning habitat. The Kennebec represents primary river
watersheds (Table 2.5, Figure 2.6). The St. George represents secondary river watersheds
(Table 2.6, Figure 2.7). Casco Bay represents bay watersheds (Table 2.7, Figure 2.8).
Only dams that changed available stream or lake habitat were included in figures. See
Appendices 2.2 and 2.3 for remaining watersheds.
On the Kennebec watershed, considerable reductions in stream and lake habitat
first occurred in 1754 with the construction of the Fort Halifax Dam. Stream habitat
declined to 65.4% and lake area to 53.6% of virgin spawning area (Table 2.5, Figure

26
2.6A, B). The Foot of Falls Dam, built in 1760, reduced lake area to 25.6% of virgin
habitat and in 1792, the Milstar Dam further reduced habitat to 14.8% of streams and
4.8% of lake area. In 1837 the Edwards Dam was built at head of tide, which reduced
stream habitat to 6.9%. The last dams to have a measurable impact on the Kennebec
watershed were completed in 1867 and left 4.9% and 0.4% of stream and lake area
available, respectively.
On the St. George watershed, the first notable reductions in available habitat
occurred in 1777 resulting in 82.7% of stream and 72.2% of lake area (Table 2.6, Figure
2.7A, B). The Warren Dam, completed in 1785, obstructed the St. George River at head
of tide and reduced habitat to 18.9% stream and 4.9% lake area. The Mill Stream Dam,
completed in 1867, was the last dam to have a measurable impact on accessible spawning
habitat leaving 13% stream and 0% lake habitat available.
Changes in available spawning habitat in Casco Bay were quite different between
streams and lakes. Stream distance decreased to 90.5% in fairly regular intervals until
1762 while lake area remained above 99% (Table 2.7, Figure 2.8A, B). Construction of
the Cumberland Mills Dam on the Presumpscot River in 1762 reduced lake habitat to 3%
and stream habitat to 57.8%. The Presumpscot River provides access to 116.4 km2
Sebago Lake, the principal lake of the Casco Bay watershed (Figure 2.9). By blocking
access to Sebago Lake, the Cumberland Mills Dam obstructed nearly 97% of the
watershed lake habitat but only about a third of the accessible stream habitat.
By 1760 dams were beginning to reduce spawning habitat in the Kennebec, St.
George and Casco Bay watersheds and by 1800 (over 60 years before the first COF

27
report) each watershed’s available lake habitat was reduced to less than 5% virgin lake
area (Tables 2.5-7, Figure 2.6-8).
Discussion
To fully understand alterations to an ecosystem, the origin and scope of all
historical anthropogenic changes need to be evaluated individually and then collectively
integrated in order to establish the most accurate baseline conditions and potential
productivity of a system (Dayton et al. 1998; Rosenberg et al. 2005). This study provides
the first comprehensive temporal and spatial analysis of dam construction as it relates to
spawning habitat availability for diadromous species. It provides estimated virgin
baseline spawning habitat before European colonization for blueback herring, measured
in stream distance, and alewives, measured in lake area. Dams constructed across Maine
beginning in 1634 increasingly diminished Maine’s river herring habitat from the earliest
colonial settlements through continued efforts to harness hydropower. The historical
impact of damming waterways is a near total loss of accessible habitat by the 1860s and
removal of trophically important diadromous species from coastal ecosystems. Future
restoration efforts for diadromous species must be guided by evaluation of current
conditions in comparison to historical habitat to have a chance of restoring genetic and
spatial resiliency to Maine’s ecosystems.
History of anthropogenic alterations of the Maine landscape
Socio-politically driven expansion of saw and grist mills and the resulting
reductions in diadromous passage occurred spatially and temporally from western to
28
eastern Maine. Expansion across coastal Gulf of Maine waters was initiated by mid 17th
century from southwest of Cape Ann where it had already impacted diadromous species
and other important fish stocks (Leavenworth 2008). By 1675, Maine had a population of
6000 people scattered from the New Hampshire border to Penobscot Bay mostly within a
few of miles of the coast (Josselyn & Lindholdt 1988; Sylvester 1909). The earliest dam
construction dates for the western and central coastal regions, 1634 and 1640,
respectively, reflect the synchronous settlement of these areas. A series of French-Indian
Wars from 1675 to 1764 slowed the pace of early settlement expansion (Moody 1933).
Homes, businesses and dams built before 1720 in coastal towns west of the Penobscot
were repeatedly destroyed in these wars causing settlement efforts to stagnate (Atkins
1887). Yet the lure of profitable fisheries and timber harvest encouraged settlers to
rebuild year after year (Moody 1933; Paine 2000).
The conclusion of the wars allowed for expansion east of the Penobscot River and
by 1763, the first dam was constructed in the eastern region (Smith 2002). The next 100
years of northeast and inland expansion was Maine’s era of a rapidly developing timber
industry and an increased rate of dam construction resulting in 394 dams completed by
1850. Between 1850 and 1900, 521 additional dams were completed reaching a total of
915 dams. During this time, the Fish Commission was created to address decreasing
numbers of riverine and marine fish species. This period also witnessed notable changes
to water-power use. The timber industry was shifting from individual or partnership
businesses to mass production associations, the pulp and paper industry was established
and hydroelectric dams were introduced late in the 19th
century (Isaacson 1970).

29
The impact of dams on spawning habitat accessibility for diadromous fish is
obvious when presented along a temporal scale. The three representative watersheds from
each category, the Kennebec, the St. George and Casco Bay, show reduction of available
spawning habitat beginning by 1760 with less than 5% lake habitat still accessible by
1800. All historical alewife rivers had full obstruction at head of tide by 1846. Over 100
years would have to pass, however, before these species received official designation of
declines under the Endangered Species Act.
Main stem or major tributary dams had the greatest impact on accessible habitat,
yet those built on smaller tributaries, especially those with access to ponds, also had a
diminishing effect. For smaller rivers and tributaries, I assumed the construction of a dam
created an obstruction for migrating alewives. Supporting this assumption are the records
of numerous petitions from towns that harvested alewives on smaller rivers in the 1700s
protesting the construction of dams and the reduction of anadromous species spawning
upstream (Shaw & Allen et al. 1824; MLR 1821-1830). A steady construction of dams
from 1663 to 1750 on the Casco Bay watershed reduced availability of stream habitat by
9.5% before dams were constructed on the main stem of the Presumpscot River. Also, on
the St. George River watershed, the Mill Stream Dam on a small tributary just below
head of tide obstructed the last 4.9% of accessible lake spawning habitat in 1867.
Because alewives are opportunistic, they potentially used any and all accessible ponds as
spawning areas. It is therefore important to not overlook smaller tributaries that could
contribute to the total productivity of a watershed.
The susceptibility of early timber and stone dams to seasonal freshets resulting
from rain or snowmelt could indicate smaller dams did not provide consistent
30
obstruction. Other factors, such as destruction of dams during wars, also could have
allowed passage. Yet, as mentioned above, dams were typically rebuilt within the year,
often within two or three months (Smith, 2002). Also, original dam constructions were
frequently updated or replaced when more stable construction or advanced technology,
such as hydroelectricity, was developed; thus, interruption of obstruction was fairly
minimal and many original obstructions became permanent elements of the landscape.
Uncertainties in estimated historical river herring habitat
An assumption that should be further examined is the historical presence of river
herring in all rivers, streams, lakes and ponds used to calculate total virgin spawning
habitat. Because documentation of natural barriers and final destinations of alewife
upstream migration is scarce and debated for several Maine watersheds, I opted for the
longest potential migration. But evidence of historical occupation of inland lakes and
ponds is still being sought. Isotopic studies of sediment in upstream lakes can be used to
assess historical transport of marine derived nutrients (Peterson & Fry 1987). Also, the
identification and analysis of fish bones and scales preserved in watershed sediments has
been used to confirm presence of anadromous fish in upstream habitat (Flagg 2007). Such
analyses are needed to confirm the extent of anadromous fish inland migration – then
more accurate virgin spawning habitat estimates can be made for each watershed.
Additionally, analyses of specific aspects of habitat suitability and water
hydrology for individual watersheds are needed that were not covered in this study. First,
tributary streams included in virgin spawning habitat were not assessed for elevation
grade or hydrological flow. Alewives resist entering streams with high flows of water

31
(Atkins & Foster 1868) and therefore each watershed needs to be assessed regarding
which potential streams have too high of a flow to allow alewife migration. Second,
depth, food availability, competitors, predators or average temperature during the April to
July spawning season and juvenile growth period (Pardue 1983) for each water body
were not considered. These factors could determine alewife spawning preference and
recruitment success and therefore require examination in future analyses. Third, distance
of a water body from the coast and the biological or reproductive cost imposed by longer
distance migrations, and the evolutionary consequences, were not considered (Kinnison
et al. 2001). No water body was excluded within known or estimated migration
boundaries, but spawning efficiency related to distance from the ocean could be an
important consideration in restoration efforts. This is especially pertinent to restoration
funding since the number of dams in need of fishways or removal, and hence the
economic cost, would presumably also increase with distance from the coast.
Also of concern, the MEGIS data used to calculate stream distance and lake
surface area consists of measurements of the current morphology of Maine’s waterways.
Yet, morphology of rivers and lakes would have changed over 400 years both naturally
and by human manipulation through deforestation and damming. Various studies have
shown that the long-term presence of dams can affect waterway hydrology, water body
dimensions, sedimentation, branching and channelization, water temperature, and
biological habitat availability (Poff et al. 1997; Poff & Hart 2002; Walter & Merritts
2008). Thorough and accurate estimations of these changes are difficult to obtain
(ASRSC, Fletcher & Meister 1982; Petts 1989; Poff et al. 1997) requiring quantitative
analyses of historic maps and sediment profiles to determine river width, depth and lake
32
surface area over time. The objective of this study was to present a broad overview and
timeline of loss of virgin spawning habitat, but such analyses would be necessary to give
precise estimates of historically available spawning habitat and species productivity as
affected by dams over time.
Finally, because of the alewife’s migratory range, river herring represent a middle
ground of spawning migration distance for diadromous species. Salmon and eels are
known to have migrated longer distances and scaled steeper waterfalls than alewives to
reach their destinations while sturgeon and striped bass were limited earlier in their
migrations by their inability to ascend as many barriers (Atkins & Foster 1868; Bigelow
& Schroeder 1953). Therefore, my migration distance assessment would be conservative
for salmon and eels and a more thorough survey of upstream and non-pond tributary
dams is recommended for salmon and eel spawning site studies to include their longer-
distance migrations and different spawning site condition requirements. However, main
stem head of tide dam construction would have been a decisive blow to all these species.
Implications for Restoration and Conclusion
My dam construction timeline and baseline habitat estimates provide quantitative
and comprehensive data that can be used to evaluate where it would be most beneficial
and cost effective to re-establish diadromous fish passage by defining the habitat range of
historic river herring populations. With further research, historic and future river herring
productivity within Maine’s watersheds and the species’ contribution to greater
ecosystem productivity can be produced. Most importantly, these methods of historical
evaluation demonstrate the dire consequences dams had on habitat availability for

33
migratory species and the consequent economic and ecological impacts of removal from
coastal watersheds.
The estimates of lost spawning habitat in this study are more severe than those
presented in the past. Atkins’ prediction of 10% remaining habitat (Atkins 1887) is an
underestimate by up to an order of magnitude compared to my alewife spawning habitat
estimates of less than one percent remaining by the late 1880s. Even the Lotze &
Milewski (2004) dire estimate of 1% habitat remaining at present fails to identify that this
baseline was probably reached over 100 years ago, before any effects of industrial
pollution and human-induced climate change. Economically, dam blockage of the two
largest watersheds in Maine, the Penobscot and Kennebec, has directly impacted
harvests. Historically, alewife migrated 193 km and 322 km inland on the Kennebec and
Penobscot, respectively, serving as food for local residents far from the ocean (Atkins &
Foster 1868). These two watersheds historically provided harvests of up to one million
alewives in the 1800s (Atkins 1887). Fisheries harvests for 2007 included 100,000 fish
from the Orland River, 30 km upstream on the Penobscot watershed, and no harvest from
the Kennebec (Gail Wippelhauser, MDMR, personal communication 2008); ten percent
of historic harvests on these two already exploited waterways. The extensive system of
dams on watersheds fractured the river ecosystems thereby decimating diadromous
species’ fisheries and presumably any coastal fisheries that depended on them.
Ecologically, we need to assess what these diadromous species historically
contributed to the overall watershed food web of the Gulf of Maine. For instance, at their
baseline abundance, what was river herring’s energetic contribution to predators? What
was the historical connectivity and exchange from watershed to watershed and freshwater

34
to coastal marine systems? Extensive research on the anadromous and semelparous
Pacific salmon species (Oncorhynchus spp.) has shown a significant ecosystem
contribution to all trophic levels through transport of marine derived nutrients to
freshwater spawning sites (Kline et al. 1990; Bilby et al. 1996). Salmon-derived nitrogen
and carbon are incorporated into freshwater biota from riparian plants to secondary
predators, are important contributors to juvenile fish growth and have been found in most
trophic levels of adjacent terrestrial food webs (Bilby et al. 1996; Schindler et al. 2003).
River herring along the Atlantic coast could be equally important but are iteroparous and
therefore differ from Pacific salmon as nutrient vectors by not providing as substantial an
influx of nutrients through mortality. By returning to the marine environment as adults
multiple times, river herring potentially provide repeated exchange of nutrients between
fresh and marine aquatic systems, and as a forage species, also the predators of each
system. Short-term research on small watersheds shows evidence of incorporation of
marine derived nutrients into freshwater ecosystems via excretion, mortality and eggs
(MacAvoy et al. 2000; Post & Walters 2009; Walters et al. 2009). As with Pacific
salmon, long-term studies of river herring reintroduction and nutrient transport need to be
conducted to understand greater ecosystem impacts (Schindler et al. 2003).
For a complete analysis of what dam obstruction did to historical nutrient and
energy exchange within coastal ecosystems we have to account for not only lost river
herring populations but those of salmon, eel, sturgeon, shad and other diadromous fish
prevented from migrating to their spawning habitat. If habitat was reduced to 10% of
baseline totals by 1850, we can assume biomass was similarly reduced and in turn
contributed to reductions of coastal game fish including cod and mackerel as has been

35
suggested for over one hundred years (Baird 1872, Ames 2004). Also to consider, river
herring potentially provide prey buffering for Atlantic salmon from fish and bird
predators (Fay 2003), thus restoration of river herring populations may assist efforts to
restore salmon. Yet, because habitat reduction and overfishing have decimated
diadromous populations for centuries, the bigger question is: has resiliency of river
herring and interdependent species been evolutionarily lost and impaired the ability of
systems to buffer against future environmental changes?
The good news is opportunistic and highly fecund (60,000 to 300,000 eggs per
female) alewives have rapidly populated reopened spawning areas in short time spans
(Atkins & Foster 1868; Bigelow & Schroeder 1953; Pardue 1983). For example, in 1800
there were no alewives present in Damariscotta Lake. In 1803, transporting of adult
spawners to the lake commenced a run that was thereafter “naturally” sustained with the
completion of a fish ladder providing passage in 1809 and by 1821 required regulation of
the highly productive fishery (Maine Legislative Records 1821; Cushman, 1882). Further
rapid repopulation has also been demonstrated in the past two decades where dams have
been removed or fish passage has been provided (Lichter et al. 2006; David Lamon,
Executive Director, Somes-Meynell Wildlife Sanctuary, personal communication 2008).
Currently, there are numerous large-scale restoration efforts underway to restore
access to diadromous fish habitat by removal, restored passage, or plans for future
removal of main stem dams. Assessing the objectives of these dam removal and passage
projects in comparison to my baseline spawning habitat estimates can help evaluate
progress towards restoring historic levels of diadromous fishes. For example, the opening
of the Brunswick Dam on the Androscoggin provided access to 53.8% of estimated

36
historic lake habitat within the watershed (Brown et al. 2007). Opening the main stem
Edwards Dam on the Kennebec watershed without unblocking the upstream main stem
Milstar (Lockwood) Dam, or dams on tributaries like the Fort Halifax Dam, allows
access to only 1% of estimated potential lake habitat (MDMR 2008; MDEP 2009). Yet,
the opening of Fort Halifax Dam at the mouth of the Sebasticook River, assuming free
passage of alewives upstream to all potential spawning area, provides access to 45% of
lake habitat (MDMR 2008). In total, the opening of these two dams provides access to
46% of the Kennebec watershed’s virgin lake habitat for alewives. Finally, opening of the
Great Works and Veazie Dams on the Penobscot River would allow access to 37% of my
estimate of the watershed’s historical lake habitat (MBSRFH 2007). Today the Orland
River is accessible to alewives, thus a total 42% of historical lake habitat would be made
available. A forty percent increase in habitat access is a considerable step towards
recovery, but species recruitment and resiliency studies need to be conducted to know
how percent available habitat translates to population recovery.
The above restoration efforts have also brought river herring and other
diadromous fish back to historical habitat primarily through stocking programs, fish
pumps and fish ladders. With such assistance, it is difficult to estimate natural population
limitation, watershed carrying capacity and energetic exchange between freshwater and
marine ecosystems. Monitoring programs at the Brunswick Dam and Fort Halifax Dam
on the Androscoggin and Kennebec watersheds are providing valuable time series
information on spawning and recruitment (Brown et al. 2007; MDMR 2008). Such data
can be used to understand the current contribution of diadromous fish to coastal
ecosystems. The next step towards effective restoration is to conduct energy exchange

37
studies on productive systems with assisted passage and stocking efforts. Similar research
can then be conducted on watersheds as dams are removed to assess energetic
contribution and carrying capacity from naturally accessible habitat systems. Finally,
with current assisted passage and natural passage contribution values, my baseline
spawning habitat estimates can be used to estimate total carrying capacity if all
watersheds were opened to natural access.
With knowledge of potential production and energetic contribution to the greater
coastal ecosystems based on this historical data, we can begin to understand the
magnitude of loss created by nearly 400 years of diadromous species habitat obstruction
in the watersheds of Maine. Then, we can more realistically address management
objectives including minimum percent accessible spawning habitat and maximum
sustainable yields to create sustainable fisheries and restore the health and diversity of the
Gulf of Maine coastal ecosystems.

38
Table 2.1A. Summary of historical and current dams in Maine by watershed.*
Watershed
Total dams
constructed
1600-present
Year of earliest
documented dam
construction
Number of dams
still on watershed
as of 2006**
Androscoggin River
(Maine only) 145 1716 79
Coastal Waterways 110 1651 45
Damariscotta River 8 1726 2
Dennys River 19 1787 8
East Machias River 12 1765 4
Fore River 6 1674 2
Kennebec River 226 1754 128
Kennebunk River 10 1749 1
Machias River 13 1763 6
Medomak River 12 1797 5
Mousam River 24 1672 12
Narraguagus River 15 1773 4
Orange River 6 1828 4
Pemaquid River 6 1640 3
Pennamaquan River 18 1823 7
Penobscot River 283 1768 116
Pleasant River 9 1765 2
Saco River 72 1648 42

39
Piscataqua/Salmon
Falls River 29 1634 12
Presumpscot River 68 1732 30
Royal River 10 1722 4
Sheepscot River 47 1664 15
St. Croix River 48 1780 20
St. George River 35 1647 18
St. John River 77 1811 48
Union River 36 1766 11
York River 12 1634 6
TOTAL 1356 634
*Includes dams that could not be assigned latitude and longitude.
** Dams still present in 2006 at completion of the MEGIS impoundment database. Includes dams
with fish passage and those more recently removed or breached.

40
Table 2.1B. Summary of historical and current dams in Maine by coastal region and
associated river watersheds.*
Coastal Region
Total dams
constructed 1600-
present
Year of earliest
documented dam
construction
Number of dams
still on watershed
as of 2006**
Western 400 1634 196
Central 637 1640 299
Eastern 319 1763 139
TOTAL 1356 634
*Includes dams that could not be assigned latitude and longitude.
** Dams still present in 2006 at completion of the MEGIS impoundment database. Includes dams
with fish passage and those more recently removed or breached.

41
Table 2.2. Head of tide main stem dams on rivers with historical river herring runs and
year of complete obstruction to upstream migration.
River Dam Town Year Source
Androscoggin Brunswick Dam Brunswick/
Topsham 1807 Brown et al. 2008
Dennys Dennysville
(Lincoln) Dam Dennysville 1846
Atkins 1887, Atkins &
Foster 1868 &1869
East Machias Bangor Hydro
Dam East Machias 1784
Atkins & Foster 1868,
Drisko 1904
Kennebec Edwards Dam Augusta 1837 Atkins 1887
Mousam Kesslen Dam Kennebunk 1720 Emery 1901,
Atkins 1887
Narraguagus Cherryfield Dam Cherryfield 1820 Porter 1885-1886 &
1890-1891, Atkins 1887
Orange Whiting Dam Whiting 1828 Atkins & Foster 1868
Orland Orland Village
Dam Orland 1836 Ames & Bray 2000
Pennamaquan Lower River Dam
(Iron Forks) Pembroke 1828
Atkins 1874,
MDIFG (Havey) 1956
Penobscot Veazie Dam Veazie 1835 Atkins 1887
Pleasant Columbia Falls
Dam Columbia 1830s Atkins 1887
Presumpscot Presumpscot Falls
- Smelt Hill Dam Portland
1739,
1802
Willis 1831, Atkins &
Foster 1868, Atkins
1887, MEGIS 2004
Sheepscot Head Tide Dam Head Tide 1762 Atkins 1874,
MEGIS 2004
St. Croix Union Mills Dam Calais 1825 Atkins 1887
St. George Upper Falls (Knox
Falls) Dam Warren 1840s
Atkins 1887,
MDIFG (Foye) 1956
Union Ellsworth Dam Ellsworth 1800 Atkins 1887,
Porter 1890-1891

42
Table 2.3. Percent remaining stream and lake habitat accessible to river herring resulting
from full obstruction at head of tide dam on nine focus watersheds.*
Category Watershed Year % Stream Distance
Remaining
% Lake Surface
Area Remaining
1 Androscoggin
(Maine only) 1807 14.9 4.4
1 Kennebec 1837 7.3 0.5
1 Penobscot 1835 18.6 8.2
2 Mousam 1720 8.1 0
2 Sheepscot 1762 58.2 32.4
2 St. George 1840s 20.5 6.8
2 Union 1800 21.5 5.2
2 Dennys 1846 31.9 1.9
3 Casco Bay 1819 20.9 0.1
*Percent calculated based on presence of head of tide dam only. Habitat loss from other dams
built on watersheds previous to above years or below head of tide not considered for this
estimate.

43
Table 2.4. Nine focus watersheds with total virgin stream distances and lake surface
areas for potential river herring spawning habitat.
Category Watershed Virgin stream
distance (km)
Virgin lake
surface area
(km2)
1 Androscoggin
(Maine only) 906.2 45.9
1 Kennebec 2392.3 197
1 Penobscot 5332 327.7
2 Mousam 183.5 10.7
2 Sheepscot 558 19.4
2 St. George 549.2 31.7
2 Union 480.9 93.2
2 Dennys 230.1 30.1
3 Casco Bay 862.1 136.1

44
Table 2.5. Category 1 Watershed: Kennebec River percent remaining stream and lake
potential river herring spawning habitat based on chronological completion of dams with
measurable impact before 1900.*
Year Dam(s) % Stream Distance
Remaining
% Lake Surface Area
Remaining
1600 None 100.0 100.0
1754 Fort Halifax Dam,
Dresden Bog Dam 65.4 53.6
1760 Foot of Falls Dam 55.1 25.6
1765 Lower Togus Pond Dam 53.2 22.4
1768 Searles Mill Dam 51.9 22.3
1780 Pittston Mill Dam 51.4 22.3
1783 Temple Stream Dam 49.5 22.1
1785 Drummore Sawmill Dam 47.0 22.1
1789 Fall Brook (Buswell’s
Mill) Dam 46.0 22.1
1792 Milstar (Lockwood)
Dam, Union Gas Dam 14.8 4.8
1795 Winnegance Causeway
Dam 14.4 4.8
1808 Rogers Neck Pond Dam 14.4 2.4
1819 Whiskeag Creek Dam 14.2 2.4
1837 Edwards Dam, Parker
Head Dam 6.9 1.4
1841 Bond Brook Dam 6.3 1.4
1867 Nequasset Lake Dam,
Vaughn Brook Dam 4.9 0.4
*Repeated values for percentages indicate no change in available area for either stream distance
or lake surface area with construction of dam.

45
Table 2.6. Category 2 Watershed: St. George River percent remaining stream and lake
potential river herring spawning habitat based on chronological completion of dams with
measurable impact before 1900.*
Year Dam(s) % Stream Distance
Remaining
% Lake Surface Area
Remaining
1600 None 100.0 100.0
1734 Tollman Dam 97.7 98.0
1777 Crawford Outlet Dam 82.7 72.2
1785 Warren (Knox Falls)
Dam 18.9 4.9
1867 Mill River Dam 13.0 0.0
*Repeated values for percentages indicate no change in available area for either stream distance
or lake surface area with construction of dam.

46
Table 2.7. Category 3 Watershed: Casco Bay percent remaining stream and lake potential
river herring spawning habitat based on chronological completion of dams with
measurable impact before 1900.*
Year Dam(s) % Stream Distance
Remaining
% Lake Surface Area
Remaining
1600 None 100.0 100.0
1663 Libby River Dam 99.7 100.0
1682 Nonesuch Mill Dam 98.2 100.0
1700 Mill Brook Dam 98.1 100.0
1733 Stroudwater Dam 91.2 100.0
1750 Capisic Pond Dam 90.5 99.9
1762 Cumberland Mills Dam 57.8 3.0
1763 Shaw Mills Dam 57.2 3.0
1766 Runaround Pond Dam 56.0 2.6
1790 Long Creek Pond Dam 54.0 2.6
1791 Mayall Mills Dam 53.4 2.6
1800 Randall Mill Privilege
Dam 53.0 2.6
1802 Smelt Hill Dam 43.7 0.6
1819 Bridge Street Dam 24.1 0.6
1890 Milliken Mill Pond Dam 23.6 0.6
*Repeated values for percentages indicate no change in available area for either stream distance
or lake surface area with construction of dam.

47
Figure 2.1. Dam and power house on St. George River circa early 1900s. From Whitten,
1990: 213. Courtesy, Edwin Boggs, Sr.

48
Figure 2.2. State of Maine with historical river herring watersheds assessed in this study
for temporal spawning habitat changes from 1600 – 1900.

49
Figure 2.3. Map of Blue Point, Maine drawn by H.G. Storer between 1830 and 1880.
Building and dam locations, owners and dates are labeled. The arrow indicates
Westbrook’s mill of 1718 with associated dam. From Southgate, 18--: frontispiece.

50
Figure 2.4. Temporal and spatial accumulation of dams in Maine for which latitude and
longitude were determined. Each dot represents a dam. Map A: comprehensive of all
dams completed through 2008. Map B: all dams constructed by 1750. Maps C – E: the
cumulative increase of completed dams in 50-year increments from 1750 to 1900.

51
Figure 2.5. Temporal and spatial distribution of dam latitude (top) and longitude (bottom)
in Maine from 1600 to 2000.

52
Figure 2.6. Category 1 Watershed: Kennebec percent virgin habitat. A) Percent stream
distance remaining and B) percent lake area remaining from 1600-1900. Vertical drop
down lines in each graph indicate year of dam construction that resulted in a measurable
loss of virgin spawning habitat.

53
Figure 2.7. Category 2 Watershed: St. George percent virgin habitat. A) Percent stream
distance remaining and B) percent lake area remaining from 1600-1900. Vertical drop
down lines in each graph indicate year of dam construction that resulted in a measurable
loss of virgin spawning habitat.

54
Figure 2.8. Category 3 Watershed: Casco Bay percent virgin habitat. A) Percent stream
distance remaining and B) percent lake area remaining from 1600-1900. Vertical drop
down lines in each graph indicate year of dam construction that resulted in a measurable
loss of virgin spawning habitat.

55
Figure 2.9. Casco Bay watershed with all dams constructed 1600 to 2008.

64
Chapter 3: Watershed obstruction and the anadromous alewife: loss of ecological
productivity in the Gulf of Maine.
Introduction
Of growing interest to the construction of natural ecosystem models and
restoration efforts is the application of historical data, both qualitative and quantitative
(Pitcher & Pauly 1998). Historical data can be used to adjust baseline estimates for
species and ecosystem productivity to pre-exploitation conditions, which for targeted fish
populations in the northeastern United States were 400 years ago. Current U.S. regional
fisheries status and stock assessments are typically based on state and federal landings
and abundance data or state fishery data from the last century (NCDENR 2000; AMSFC
2009). Without information pre-dating 1900, management is only informed by highly
impacted systems to estimate potential productivity, and recovery, of native ecosystems.
Historical ecology studies have used diaries, ships’ logs, naturalist publications,
and other records from the 19th century and earlier to compile estimates of species
abundance and ecosystem shifts across diverse fauna and ecosystems, from temperate to
tropical. Qualitative descriptions include 16th and 17
th century species diversity and
populations of whales, turtles, oysters and fishes in the Gulf of California far beyond
modern population sizes (Saenz-Arroyo et al. 2006). Quantitative historical studies have
estimated a greater than 3-fold decrease in individual Atlantic cod sizes (Jackson et al.
2001), a 99% reduction of river herring populations in the St. Croix River from the early
19th
century (Lotze & Milewski 2004) and a reduction of Scotian Shelf Atlantic cod

65
biomass from 1.26 million mt in 1852 to less than 50,000 mt in 2004 (Rosenberg et al.
2005). Although these estimates may seem extreme, such historical studies are often
conservative: for instance the cod and river herring studies ignore the first 200 years of
human impacts. In this chapter, I focus on 400 years of human impacts to Maine
watersheds in order to provide a context and establish a realistic historical baseline of
pre-impact diadromous fish populations.
Diadromous species, those that migrate between marine and freshwater
ecosystems during their life cycles, have long been important resources for coastal
communities. Both economically and ecologically valuable, decline of these populations
due to anthropogenic impacts have had myriad consequences to their native watersheds
(Baird 1883; Schindler et al. 2003; Morita et al. 2009). In the Gulf of Maine, river
herring, collectively alewife (Alosa pseudoharengus) and blueback herring (Alosa
aestivalis), has been a principal bait fish for numerous commercial fisheries including
Atlantic cod (Gadus morhua), Atlantic mackerel (Scomber scombrus), striped bass
(Morone saxatilis) and American lobster (Homerus americanus) (Baird 1872; ASMFC
2009). Settlers also valued it for consumption as a preferred food fish, locally and for
export (Atkins & Foster 1868, Baird 1874). An anadromous species, river herring spend
most of their adult lives in the ocean, returning annually to freshwater sites to spawn.
During spawning runs, especially at sites of constricted passage, river herring are easy
and predictable targets for fishermen and were historically caught by a variety of gear
including dipnets, pound nets, weirs and seines (Smith 1899).
Seventeenth century European settlers described an astonishing abundance of
alewives in most of the northeastern United States coastal waterways. In 1634 colonist

66
William Wood stated that alewives “…[came] up to the fresh Rivers to spawne, in such
multitudes as is almost incredible, pressing up such shallow waters as will scarce permit
them to swime...” (Wood 1634: 56). In an alewife account on a Kennebec River tributary
in the 1700s, historian J.W. Hanson reported “… alewives were so plenty there at the
time the country was settled, that bears, and later, swine, fed on them in the water. They
were crowded ashore by thousands.” He followed with testimony of a single woman
catching seven barrels of alewives in one day with a dipnet on the same tributary (Hanson
1852: 186). The alewife was so abundant as to be almost a nuisance. As unwanted
bycatch in fisheries for the more favorable Atlantic salmon (Salmo salar), they were “left
to decay in heaps upon [the river] banks, in mere wantonness” (Loring 1880: 23).
As settlements developed in Maine, two significant – and often conflicting –
anthropogenic pressures increased on anadromous populations: direct exploitation via
fishing and indirect effects of dam construction to spawning habitat access. Reduction of
these economically important anadromous species, as well as that of coastal fish that
relied on them for foraging, led to town petitions and state laws meant to lessen the
impact of dams on the shrinking populations as early as the late 1700s (Reed et al. 1821,
Shaw & Allen et al. 1824). Atkins (1887) reported a total of 161 legislative acts passed in
reference to anadromous fishes from 1800 to 1880. A majority of these were focused on
how to preserve the supply of fish attempting to balance demands of river fisheries and
water-power dependent industries. In 1868, the first Maine Commissioners of Fisheries
listed impassable dams as the most damaging of anthropogenic impacts on anadromous
fish, followed by overfishing and pollution (Atkins & Foster, 1868).

67
Despite long-term awareness of human impact on anadromous populations, Maine
alewife landings from 1880 to 2005 vary considerably reaching historic lows in the 1990s
(Figure 3.1). Periodic increases in landings may reflect changes in fishing effort and/or
natural variability (Chaput & Atkinson 2001), but in general, increases in alewives
correspond to and follow periods of renewed focus on fish passage installation. These
passage efforts have occurred multiple times throughout the late 19th and 20
th centuries:
in the 1870s after the Fish Commissioners were established (Atkins & Stillwell 1874); in
the 1920s to increase salmon populations (MCOIFG 1922); in the 1940s to improve
alewife fisheries (Rounsefell & Stringer 1943); during the 1960s after extensive river
reports on anadromous species (MDIFG 1955-1967); and during recent restoration efforts
in the 1980s and 1990s. But the variability also reflects failure to maintain rebounding
populations. Increased fishing pressure on improving stocks probably contributed to
failed recovery as well as poor fishway construction, monitoring and maintenance
(Decker 1967). In 1990, the Atlantic States Marine Fisheries Commission (ASMFC)
conducted a stock analysis including eleven New England river herring rivers with
restoration programs that consisted primarily of establishing dam fish passages (Crecco
& Gibson 1990). All populations were at least partially exploited with one significant
alewife river in Maine, the Damariscotta, severely overfished.
The remaining river herring populations continued to decline after the 1990 stock
analysis, with Atlantic coast commercial landings decreasing from 6.2 million kg in 1985
to less than half a million kg in 2007 (AMSFC 2009). With the populations showing little
sign of recovery, NOAA Fisheries listed river herring as a species of concern in 2006
(NOAA 2006). Yet in 1887, Charles Atkins estimated the productive capacity of all

68
rivers in Maine to have been reduced by 90% due to dam construction (Atkins 1887).
This means over one hundred years before becoming a species of concern, the 1887
alewife catch of 1.15 million kg or over 5 million fish may have been only 10% of
potential fisheries productivity.
Much time and money has been spent on multiple efforts to restore declining
populations, all without any realistic knowledge of what levels equate with “successful”
restoration. This study provides a rigorous analysis of historic and current alewife
harvests in Maine over the period of 1800 to present day in order to help provide this
much-needed estimate of pre-colonial abundance. Estimates of changes in total
productivity from 1600 to 1900, based on changes in watershed habitat (due to dam
construction) and how loss of habitat contributed to declines in alewife populations are
presented. Finally, the findings provide a more realistic baseline for evaluating
anthropogenic impact on watershed ecology, and effectively and accurately assessing the
progress of restoration attempts.
Materials and Methods
Study area
River herring harvest research was conducted on all Maine watersheds. Nine
watersheds with referenced historical river herring presence were then assessed for
changes in access to spawning habitat and estimated productivity due to dam construction
from 1600 to 1900 (Figure 3.2). These watersheds represent three categories of coastal
watersheds in Maine: 1) principal rivers with numerous tributaries, 2) secondary rivers
with few tributaries and 3) bay-system watersheds with multiple coastal waterways.

69
Watersheds are shown with associated dams documented in this study (see Results). Also
included is the Damariscotta River from which spawner-recruit data is used for analysis.
Historic and current alewife harvest sources
The earliest harvest records are Commonwealth of Massachusetts and State of
Maine Fish Inspector reports beginning in 1804 (Maine Secretary of State 1804-1893).
Reports were from fishery and shipping towns along the length of the Maine coast from
Casco Bay to Cobscook Bay (Figure 3.2) and contain barrels of pickled fish and boxes of
smoked fish according to town and species. Although inconsistent, they provide the only
regular harvest records for the early 19th
century.
Of the two river herring species, alewives were the predominant fish reported
historically and are therefore the focus of this study. To compare “barrel” and “boxed”
quantities to later harvest data units, all quantities were converted to number of fish.
Conversions were found in individual fish inspector reports (Maine Sec. of State 1804-
1893). With an average of 90.72 kg alewives per barrel, at an average weight of 0.227 kg
per alewife (Rounsefell & Stringer 1943; Bigelow & Schroeder 1953), alewives averaged
400 fish per barrel. For boxes, 220,000 smoked alewives were packed into 3200 boxes
equaling 69 fish per box. It is important to note that all of these conversions are
calculated based on 19th
and early 20th
century averages of alewife size across Maine.
Later 19th century harvest reports included the first Maine Commissioner of
Fisheries (COF) report (Atkins & Foster 1868), subsequent Maine COF reports (MCOFG
1888, 1889-1890), and special reports on river and alewife fisheries (Atkins 1887; Smith
1899). Mid-twentieth century annual harvests were found in Rounsefell & Stringer’s

70
(1943) alewife fishery report. Town harvests from 1943 to 2007 provided recent landings
per watershed and represent ninety percent of all Maine harvests (Gail Wippelhauser,
MDMR, personal communication 2008).
Harvests reported by town in Fish Inspector records were assigned watersheds
according to the nearest river or water body. Harvests designated by county (Rounsefell
& Stringer 1943) were assigned according to waterways specified in the text of the
report. Where multiple towns or tributaries within a single watershed had harvests,
proportions of harvest were estimated based on river-specific yields from other years.
Watershed fishery productivity index
Historic and current fishery reports were quantitatively evaluated for percent
contribution of individual watersheds to total alewife harvest. Spanning from 1804 to
2007, this provides snapshots representing which watersheds had the most productive
historical alewives harvests. A proportional watershed fisheries productivity index
(WFPI) is calculated as percent contribution of an individual watershed (IW) to the total
Maine harvest (TH) over a chosen time interval, t.
WFPI(t) = IW(t) * 100
TH(t)
Identification of dams and natural barriers to spawning migration
The principal database referenced for still present and recently removed dams was
the Maine Geographic Information Systems (MEGIS) Impound database completed in
2006 by the US Fish and Wildlife Service Gulf of Maine Coastal Program (MEGIS
2006). It lists over 800 dams with information on waterway, owner, latitude and

71
longitude, and year of completion. No dam completion years from this source dated
before the 1800s. Earlier dates of dam presence required historic literature surveys. The
most comprehensive historical reference was The Water-power of Maine, based on an
1867 hydrographic survey of Maine (Wells 1869).
Nineteenth and twentieth century government reports were used to identify and
date dams on river fishery watersheds and determine natural barriers to upstream passage
of alewives. COF reports from 1868 to 1899 included accounts of anadromous fish
populations and obstructions that impeded migration to spawning habitats (Atkins &
Foster 1868, 1869; Atkins & Stillwell 1874; Atkins 1887; Smith 1899). Twentieth
century sources included alewife fisheries reports, river surveys and management reports
(Rounsefell & Stringer 1943; MDIFG 1955-1967; ASRSC 1982-1983).
Dates and locations of dams constructed before Wells’ 1867 survey were found in
numerous popular and legislative historical sources including wills, historical magazines
and journals, town histories, 18th and early 19
th century newspaper articles and records of
early 19th
century legislative acts and petitions (Maine Legislative Records 1821-1830).
These sources were also instrumental in determining presence or absence of alewives in
rivers where anadromous species were already extirpated before 19th century fishery and
watershed reports. See Chapter 2, Appendix 2.1 for a comprehensive listing of sources.
Latitude and longitude in decimal degrees for dams and natural barriers were
determined using the twenty-sixth (2003) and thirtieth (2007) editions of the DeLorme
Maine Atlas and Gazetteer™ and Google Earth 5.0 during the period of January to July
2009. Obstructions were mapped using ESRI® ArcGIS™ v.9.3. Map base layers in
1:24000 scale of watersheds, counties and coastline were obtained from the MEGIS

72
database (MEGIS 2004). Latitude and longitude were geo-referenced using the
Geographic Coordinate System North America 1983.
Definition of historical alewife spawning habitat
Alewives spawn in still water so all lakes or ponds below natural barriers or
within known alewife migration distances were considered potential spawning habitat.
Documentation of maximum alewife migration not limited by natural barriers was found
in the Maine COF reports, alewife fisheries and river survey and management reports
referenced above. Streams categorized as perennial in the MEGIS database (MEGIS
2004) that led to water bodies within the estimated range of migration were used to
calculate stream migration distance whereas streams categorized as intermittent or not
connected to water bodies were not included. Perennial streams within distance of head
of tide but without connection to water bodies were included for potential blueback
spawning habitat. Inclusion is based on reports that bluebacks will migrate to and
somewhat above head of tide to spawn in flowing water (MDMR et al. 1982).
Quantifying habitat
To estimate pre-colonial (hereafter referred to as “virgin”) alewife spawning
habitat, river and lake demographics from MEGIS 2004 were used to calculate total
stream distance in kilometers (km), composed of main stem river and accessible
tributaries, and total lake surface area in squared kilometers (km2) up to natural barriers
or maximum alewife migration. Virgin spawning habitat was dated 1600, pre European
colonization. Changes in accessible stream distance and lake area resulting from dams

73
were calculated chronologically at the year of dam construction from 1600 through 1900.
Inaccessible stream distance and lake area upstream of the completed dam was subtracted
initially from the virgin total and from remaining habitat totals subsequently.
Historical productivity estimates
Two approaches were taken to find alewife productivity estimates. The first uses
Lewis Flagg’s two estimates for adult alewife returns of 29.0 x 10³ and 58.1 x 10
3 adults
per lake surface km2 based on annual harvest yields plus one day/week, or 15%,
spawning escapement (Flagg 2007). The yield values were from Damariscotta and St.
George River harvests from the recent past (post 1990) when the fisheries were at historic
lows (Figure 3.1) making even the upper estimate highly conservative. The value of 58.1
x 103 adults per km
2 is currently used as the standard production estimate for Maine
(Flagg 2007; Rory Saunders NOAA, NMFS Maine, personal communication 2009).
A second approach used a longer time series to give productivity values from a
potentially less exploited system. A spawner-recruit time series from the Damariscotta
River was used in the 1990 ASMFC river herring and shad stock assessment report to
which the authors fit a Shepherd S-R model and determined the parent-recruit
relationship to be density dependent (Crecco & Gibson 1990). I fit thirty-five years of
this data, 1949-1983, to a Beverton-Holt spawning stock-recruitment curve by
minimizing the sum of squared residuals. A Gauss-Newton non-linear analysis was
completed using SAS™ v. 9.3 to determine the Beverton-Holt model significance and
95% confidence intervals. A segmented regression with a breakpoint analysis was
performed on recruitment against time to identify significant changes in annual

74
recruitment using Bayesian Information Criterion (BIC). This analysis was performed
with the “strucchange” 145 package in R. The recruitment values were then normalized
and ordered to provide 25th, 50th and 75th percentiles within a cumulative frequency
distribution to establish a range of recruits and then divided by the surface area of
Damariscotta Lake (18.87 km2, MEGIS 2004) to give three estimated production values
in terms of first time recruits/km2. For the analysis, parents were treated as fish that
escaped harvesting and made it to spawning grounds and recruits were calculated as the
sum of first time spawning 3-6 year old fish from the entire run (Crecco & Gibson 1990).
Historical productivity per watershed over time was calculated with total
productivity of a particular watershed in year t, TPw(t), as a product of the accessible lake
habitat in year t, AHw(t), and a productivity estimate in fish per km2, P.
TPw(t) = (AHw(t)) * (P)
This calculation was done with each of the five production potential estimates described
above on all nine watersheds through changes in accessible habitat from 1600 (virgin) to
1900. Total productivity was calculated each year a dam was completed on the watershed
that had a measurable impact on accessible habitat.
A total productivity for Maine based on the nine watersheds was calculated by
summing all watershed productivity estimates at fifty-year increments from 1600 to 1900
n = 9
TPMe(t) = ! (AHw(t))i * (P)
i = 1
where TPMe(t) is the total estimated productivity for Maine in year t.
Current production estimates

75
Current estimates of river herring production on three watersheds were provided
by watershed restoration and restocking programs that conduct annual fish counts at
weirs or dams. Count and stock data was collected for the Androscoggin (Brown et al.
2008; Gail Wippelhauser, MDMR, personal communication 2009), Kennebec (MDMR &
MASC 2007; MDMR 2008) and Dennys (Gail Wippelhauser, MDMR, personal
communication 2009). These were then compared to the maximum virgin production
estimates calculated using the 75th
percentile production value to illustrate the greatest
potential loss of production.
Results
Watershed contribution to harvest
Watersheds contributing 90% or greater of state alewife harvest are presented
across twelve harvest periods from 1804 to 2007 (Table 3.1). Harvest periods were
determined based on single year comprehensive records or multi-year periods
representative of all watersheds producing during a focused time frame of consistent
harvest reporting. Four principal watersheds, the combined Androscoggin/Kennebec, the
Damariscotta, the St. George and the Penobscot, provided regular yields for 10 to 11 of
the 12 harvests. During the first period, 1804 – 1820, five watersheds spanning the coast
from Casco Bay in the west to eastern-most Cobscook Bay contributed 98% of the
harvest (Figure 3.3). The next period from 1833 to 1840 also had five main watersheds
with replacement of the St. George by the Damariscotta. The Damariscotta was a regular
contributor to Maine’s harvest from the 1830s to the present (Table 3.1). By the late
1880s, three watersheds, Damariscotta, Medomak and St. George, were the only

76
watersheds with recorded yields. All three are located in the center of the coast and are
category 2, smaller secondary river watersheds (Figure 3.3). Harvests re-expanded along
the coast in the 20th century, including Casco Bay and the Dennys River in 1896 and
1942, respectively, but became more centrally focused again by the 1950s. From the
1970s through the 2000s, 90 percent of the state’s harvest was taken consistently from the
Androscoggin/Kennebec, Sheepscot, Damariscotta, St. George, Penobscot, Union,
Narraguagus and East Machias watersheds. Town records from the 1950s through the
2000s specified harvests on primary rivers were all taken below head of tide (Table 3.1).
Watershed fishery productivity index
The watersheds from Table 3.1 are presented with percent contribution to Maine’s
alewife fishery productivity as an index across fourteen intervals with 89.6% or greater of
state harvest represented by the contributing watersheds (Table 3.2). The western-most
watershed Casco Bay contributed 23% in the earliest interval, 1804-1810, which dropped
to 3.3% in the 1840s and reached a high of 27% in 1896 before decreasing to and
remaining at zero. Cobscook Bay, the eastern-most watershed, contributed 16.2% from
1804-1810, dropped to 2.4% the next decade and reached a high for the state of 57.5% in
the 1840s (Figure 3.4) before decreasing to zero for the rest of the index. The
Androscoggin/Kennebec watershed was fairly consistent and contributed to 11 of the 14
intervals across the index ranging from a low of zero to a high of 18.4% with an average
of 7.1%. All contributions from the Androscoggin/Kennebec watershed were from habitat
below head of tide after the 1820s (Table 3.1). Starting in 1887, the St. George became a

77
consistent contributor through the 2000s ranging from 6.4% to 28.1% and an average of
18% for the 10 intervals between 1887 and 2007.
The Damariscotta and the Penobscot are the two watersheds that contributed the
most to harvests, 11 and 12 times, respectively, and had the highest values in the index,
both 86.7% occurring before 1900. An index replacement occurred around mid-century
with the Penobscot having the highest values through the 1840s supplanted by the
Damariscotta by the 1880s (Table 3.2, Figure 3.4). Also in the 1880s, the St. George
began to replace the contribution of the two bay systems, the Casco and Cobscook Bays
(Figure 3.4). The Sheepscot, Union, Narraguagus and East Machias watersheds became
regular contributors to the index from the 1970s to 2007 with the Union having the
highest average of 19.5%. The contribution of the Damariscotta and Penobscot
watersheds decreased to 7.7% and 10.7% percent, respectively, in the 2000s, with the St.
George providing 24.4% percent. Notable among the index values, the Penobscot
watershed had contributed over 86% to alewife production from 1811-1820, disappeared
completely by the 1880s, and today contributes less than 11 percent.
Dams on waterways and historical alewife spawning habitat
A total of 908 dams were documented between 1600 and 2009 on the nine
historical river herring watersheds (Figure 3.2). The Mousam, Sheepscot and Union
watersheds had main stem dams constructed by 1800 and all watersheds had main stem
obstruction at head of tide by 1846 (Table 3.3). The primary river system watersheds, the
Androscoggin, Kennebec and Penobscot, had the most dam construction with 145, 226
and 283 dams documented, respectively. The secondary river system watersheds had

78
between 19 and 47 documented dams and 93 dams were documented for Casco Bay. A
comprehensive database with the history of each dam including use, dates of construction
and reconstruction, owners, fish passage capability, hydrology, etc. can be viewed at the
Gulf of Maine Historical Ecology Research website: www.GOMHER.org.
Virgin spawning habitat in stream distance (km) and lake surface area (km2) for
the nine watersheds are listed in Table 3.3. The Penobscot River watershed has the most
virgin habitat in Maine with 5332 km stream and 327.7 km2 lake habitat. The Mousam
River watershed is the smallest examined in this study with 183.5 km stream and 10.7
km2 lake habitat. The potential habitat for the state of Maine based on virgin totals of
these nine watersheds is 11,494.3 km of streams and 891.9 km2 of lake area.
Damariscotta River Stock-Recruitment data 1949-1983
A Beverton-Holt S-R model was fit to the alewife spawner-recruit data from the
Damariscotta River fishery with the equation of R = (2354.3) S/ 85.59 + S (n = 35, F =
183.67, p < 0.0001) (Figure 3.5). A breakpoint analysis of the recruits shows three
significant regressions separated by two breakpoints at 1953 and 1967 (Figure 3.6). These
demarcate an initial period of increasing recruitment to a decline from 1953 through 1967
before a brief increase and return to a decline through 1983. Recruitment at 25th, 50
th and
75th
percentiles of the cumulative frequency distribution was estimated at 1210.2 x 103
recruits, 1418.8 x 103 recruits, and 1727.1 x 10
3 recruits, respectively. Each of these
values divided by the total surface area of Damariscotta Lake, 18.87 km2, gave annual
production potentials of 64.13 x 10³ recruits/km
2, 75.15 x 10
3 recruits/km
2 and 91.53 x
103 recruits/km
2 (Table 3.4). These estimates combined with those calculated by Flagg

79
(2007) give five values for estimated historical production ranging from 29.0 x 10³
adults/km2 to 91.53 x 10
3 recruits/km
2. My estimates of recruits/km
2 does not include all
returning adults as Flagg (2007) did for his estimates, thus my production estimates are
comparatively conservative.
Total historical productivity potential for Maine and per watershed
On the Kennebec watershed, estimated virgin annual productivity ranged from 5.7
million alewives/year to over 18 million alewives/year (Table 3.5, Figure 3.7B).
Significant reductions in available lake habitat occurred in 1754, 1760 and 1792
decreasing accessible spawning area from 197.0 km2 to 9.4 km
2 in less than 40 years
(Table 3.5, Figure 3.7A). By 1792, potential production was reduced to a range of
271,788 to 857,819 alewives/year – a loss of at least 85%. The last dams to have a
measurable impact on the Kennebec were completed in 1867 and left a total of 0.7 km2 or
0.4% virgin lake habitat – production estimates decreased to a range of 20,474 to 64,620
alewives/year. Comparing the maximum production potential estimates, the loss of
Kennebec annual alewife productivity from 1600 to 1867 would be over 17 million fish.
On the St. George watershed, annual productivity estimated in 1600 ranged from
920,170 to over 2.9 million alewives/year (Table 3.6, Figure 3.8B). Significant reductions
in available lake habitat occurred in 1777 and 1785 decreasing lake area from 31.7 km2 to
1.6 km2 (Table 3.6, Figure 3.8A) and with 5% of lake habitat available in 1785, potential
annual production ranged from 45,240 to 142,787 alewives/year. After dams obstructed
access to all lake habitat, the St. George potentially lost annual alewife productivity of
nearly 3 million alewives/year by 1867.

80
For Casco Bay, available lake spawning habitat remained near its unobstructed
total of 136.1 km2 in 1600 until the construction of the Cumberland Mills Dam in 1762
which reduced lake habitat to 4.1 km2 or 3% of the virgin watershed (Table 3.7, Figure
3.9A). This dam obstructed the Presumpscot River that provides access to 116.4 km2
Sebago Lake, the principal lake of the Casco Bay watershed (See Chapter 2, Figure 2.7).
Virgin annual productivity ranged from 3.9 million to over 12 million alewives/year
(Table 3.7, Figure 3.9B), but with the loss of Sebago Lake, potential annual production
decreased to a range of 117,943 to 372,253 alewives/year. By 1890, continued damming
reduced lake habitat to 0.8 km2 and annual productivity declined to 22,939 – 72,400
alewives/year with a maximum annual potential loss of over 12 million alewives.
By 1760, dams were having a significant impact on alewife access to lake
spawning habitat in the Kennebec, St. George and Casco Bay watersheds and by 1800
these watersheds had individually lost annual alewife productivity in the range of 2 to 17
million fish/year. See Appendices 3.1 and 3.2 for additional analyzed watersheds.
Virgin lake habitat calculated for the state of Maine from the nine watersheds was
891.9 km2 (Table 3.8) and annual productivity estimates in 1600 ranged from 25.9
million to over 81 million alewives/year (Table 3.8, Figure 3.10A). From 1600 to 1700
there was little change in accessible lake habitat, but from 1700 to 1750 the area was
reduced to 880.4 km2 and by 1800 lake area decreased to 367.2 km
2, 42% of the virgin
habitat. By 1850 17.6 km2 remained, a decrease of 98% and in 1900, lake area was
reduced to 6.5 km2 (0.7% of virgin habitat). With two percent of the total lake habitat
remaining in 1850, annual production potentials decreased to between 510,000 – two
million alewives/year. In 1900, estimated productivity was reduced to 190,000 – 700,000

81
alewives/year. Percent annual virgin production for Maine declined to less than 50% by
1800 and less than 1% by 1900 (Figure 3.10B). If all virgin lake area of the nine
watersheds had been accessible, total alewife production for 1600 through 1900 would
have equaled 24.5 billion fish. With reduced spawning site access, estimated total
productivity was 18 billion fish. This gives an estimated loss of 6.5 billion alewives from
the Maine ecosystem over 300 years – or an average loss of 21.6 million alewives/year.
Comparison of virgin to present production
Current annual river herring counts for the Androscoggin, Kennebec and Dennys
watersheds are compared to maximum annual production estimates from 1600 calculated
with the potential production value of 91.5 x 10³ recruits/km
2 (Figure 3.11). The 2008
count of river herring on the Androscoggin with 18.86 km2 lake habitat was 92,359
fish/year or 2% of the virgin annual production of 4.2 million fish/year. The 2007 count
on the Kennebec with approximately 65 km2 lake area accessible was 551,636 fish/year
or 3% of the virgin estimate of 18 million fish/year. The 2009 count on the Dennys over
24 days was 167,226 fish/year or 6% of the virgin estimate of 2.7 million fish/year.
Discussion
Since the 18th
century, concern regarding anthropogenic interruption of natural
passage to spawning sites for diadromous species has led to mostly failed attempts to
solve the conflict between development and natural ecosystems (Baird 1872; Emery
1901; Judd 1997). In the watersheds of Maine, my estimated loss of one species,
alewives, amounts to over six billion fish in 300 years. This vastly underestimates the full

82
loss caused by watershed obstruction when other diadromous species including salmon,
shad, sturgeon and eels and the predators that depended upon them for sustenance, are
considered. The shift in productivity from primary river watersheds to secondary rivers
with much less spawning habitat, as well as dependence upon human efforts to maintain
spawning populations, further indicates how dramatically the Gulf of Maine ecosystem
has been transformed from abundant bounty to a depleted ecosystem. My pre-colonial
alewife production estimates on Maine watersheds can be applied to natural ecosystem
models of productivity and nutrient exchange such as Ecopath and Ecosim (Christensen
& Walters, 2004) to better focus watershed restoration efforts.
Watershed contribution
As stated in the beginning of this study, Atkins (1887) estimated river production
capacity to be 10% of potential virgin capacity. In light of my research, he was overly
conservative. My estimated production of historically accessible alewife watersheds
dropped from two percent in 1850 to 0.7 percent in 1900, not including the Damariscotta.
During this period the Penobscot watershed was replaced by the Damariscotta. In 1887,
the Damariscotta watershed produced 73% of the state’s alewife yield. Adding the
Damariscotta’s lake surface area (18.9 km2) to the remaining surface area of the nine
analyzed watersheds in 1850 (18.6 km2), there would have been 37.5 km
2 available to
spawning alewives. The proportion of available lake spawning habitat to the total
available virgin surface area, 911.8 km2, (including Damariscotta Lake) would be 4% in
1850, making Atkins’ estimate of a 90% capacity reduction in 1887 an underestimate and
the situation even more severe. This emphasizes the significance of lost total production

83
due to the replacement of primary watershed contribution by secondary watershed
contribution, particularly the Penobscot by the Damariscotta.
The decline of the Penobscot watershed contribution to alewife harvest from over
80 percent in the 1820s to none in the 1880s coincides with the completion of the Veazie
Dam on the main stem at the head of tide in 1835. Within one decade of its construction,
the Penobscot’s productivity decreased nearly 70%. In contrast, the Damariscotta
watershed began to register as a regular contributor to alewife production after the
Penobscot habitat was diminished. Being close in proximity along the mid-coast, it is
possible the Damariscotta fishery benefited from the reduction of available lake spawning
habitat in the Penobscot as returning alewives searched for appropriate lake habitat in the
vicinity of Penobscot Bay and found the fishway-accessible Damariscotta Lake. The mid-
coast became the principal area for alewife harvest during the 1880s composed of
secondary rivers with most dipnet harvesting occurring at the head of tide dams and in
weirs downstream in the estuaries (Atkins 1887). The Medomak River became important
during this time as the larger watersheds had all been made impassable by head of tide
dams by the 1840s. It too, most likely benefited from straying alewives seeking
appropriate pond spawning habitat. How much of the Penobscot population could find
spawning refuge in smaller watersheds is questionable. Looking at total lake spawning
habitat, Damariscotta Lake, 18.9 km2, is only 5.8% of the 327.7 km
2 virgin Penobscot
habitat. The addition of the Damariscotta harvests, and those of other secondary river
watersheds, helped to keep the alewife fishery alive but considering the percent
contribution to overall state production by the Penobscot watershed alone, the

84
replacement of primary river systems by secondary river watersheds would have
accommodated only a small portion of the displaced alewife population.
Another notable trend is the loss of the western- and eastern-most watershed
contributions to alewife harvest in the mid 1800s. This could be a result of remaining
spawning alewife populations condensing into areas of accessible habitat or harvesting
efforts consequently being concentrated in the most reliable areas for efficiency and
profit. From 1800 to 1850 the available lake spawning habitat for the nine historical
alewife watersheds decreased by 349.6 km2 to a total of 17.6 km
2. By 1846 all watersheds
were obstructed at head of tide with the exception of the artificially accessible
Damariscotta Lake. This supports the concentration of production centering at
Damariscotta River and proximal mid-coast watersheds.
It is also possible that as fish ladders were introduced on formerly productive
rivers in the late 19th and early 20
th centuries, the mid-coast populations provided
spawners for reopened western and eastern areas through straying. In addition, artificial
transport of adult alewives from Damariscotta, as well as the Orland River below head of
tide on the Penobscot, was used to provide stock for nearby watersheds as late as the
1930s and 40s (Rounsefell & Stringer 1943). Hypothetically, dependence on one or two
populations with reduced habitat type to restock all watersheds could have built an
expanded population with less genetic diversity and adaptive resilience than the naturally
distributed population and could have contributed to the crash of river herring stocks in
the later 20th century.
Historical and current productivity

85
The difference between Maine’s potential annual production estimate today and
that from virgin spawning habitat based on the 75th percentile calculation from historical
data is 30 million alewives per year – such discrepancy has considerable implications for
restoration policies. These two annual production values result in a range of total
alewives potentially produced from 21.2 to 33.5 billion fish between 1600 and today – a
difference of 12 billion fish over 410 years.
In order to more effectively restore river herring populations, more data on the
current abundance of river herring from more watersheds in Maine needs to be collected.
Presently, there is no statewide estimate of river herring abundance, thus we cannot
calculate how much of the potential capacity is being used.
Current annual productivity on three watersheds with restoration efforts is 2-6 %
of my maximum virgin production estimates. If this is indicative of progress towards
restoration of river herring production in Maine, there is much work to be done not only
to benefit harvests, but also to restore historical biodiversity and productivity to coastal
ecosystems as a whole.
There are several caveats to the methods employed to determine these historical
abundances, and thus, the current percent decline. The S-R data used for my production
estimates is not ideal: it is from the 20th century, potentially includes harvesting of first
year spawners, and in addition to periods of increase, includes two periods of decline in
recruitment. The data therefore is not representative of pre-exploitation conditions and
barely predates the 1990 assessment that the Damariscotta alewife stock was overfished
(Crecco & Gibson 1990). Also, the Damariscotta alewife run was started with stocking in
1803 (Atkins 1887) and therefore is not a pre-colonial alewife watershed. But, due to the

86
long-term maintenance of the Damariscotta fishway (constructed 1809) and the lack of
dam construction upstream, the run is essentially the only Maine alewife fishery that has
had self-sustained access to a consistent spawning habitat area for 200 years. All other
historic alewife river systems were subject to increased damming during the 19th
and 20th
centuries. Therefore, the harvest records from this system provide the data most likely
limited by density dependent environmental variables such as spawning area and food
availability (Haddon 2001). Ideally, Damariscotta alewife fishery data from the mid
1800s with a well-established fish ladder and not yet heavily impacted stock would be
used to estimate productivity, but such data is not available. For the above reasons, the
maximum production potential based on the 75th
percentile gives us a highly conservative
estimate for a healthy population and is likely underestimated.
In order to refine these production values, more data to help groundtruth the
assumptions of fishery escapement estimates and distance to spawning habitat would be
helpful. Productivity based on harvest depends on percent escapement, or non-harvested
days per week, and reproductive cost of migration distance. Escapement for the potential
production value currently used in Maine is assumed to be one day or 15%. This was not
consistent over the history of the fisheries with periods of no harvest and in-season
closures varying from 4 days to none differing from watershed to watershed and
dependent on gear type (Maine Legislative Records 1821-1830; Atkins & Foster 1869;
Rounsefell & Stringer 1943). Also 15% escapement towards production is based on
coastal runs on secondary watersheds and may be less for spawners that migrate much
further distances to historical spawning habitat on primary watersheds (MDMR & MASC

87
2007). Further adjustment of production values should be done per watershed to represent
distinct conditions contributing to recruitment over time.
Finally, off-shore fisheries bycatch of alewives can potentially have a large
impact on spawning populations (Kritzer & Black 2007) and sea temperature changes
have been shown to affect alewife and other estuarine and marine species’ productivity
(Dow 1977). These were not considered in this study and would need to be factored in as
parameters for ecological modeling of abundance over time, especially considering future
plans for off-shore fishery monitoring and projections for climate change.
Future Directions and Conclusion
“Ecological changes since approximately 1900 have been described, but most likely underestimate
the full impact of river regulation due to the lack of quantitative baseline data."
Petts 1989: 12
It is impossible to know how far present day ecosystems are from historical
productivity without pre-exploitation baseline estimates. The difficulty lies in finding
historical data to calculate and estimate these baseline values. My baseline estimates for
pre-colonial alewife lake spawning habitat and potential production on obstructed
watersheds in Maine provide new values that incorporate anthropogenic alteration over
400 years. As current baseline values are replaced by estimates from historical data,
ecological modeling can more accurately predict the effect restoration and management
policies will have on ecosystems (Rosenberg et al. 2005).
As a result of the dramatic decline of river herring stocks in the late 20th
century
numerous state commercial river herring fisheries were closed, including Massachusetts,
Rhode Island, Connecticut, Virginia and North Carolina (ASMFC 2009). Maine fared

88
better keeping its fishery open with a much-reduced harvest despite the official
assessment of the Damariscotta river herring fishery as overfished. True success of
restoration efforts requires long-term monitoring and analysis of the impact of multiple
factors on river herring populations, including: distance from ocean; distance from stock
population; habitat condition; similarity of new habitat to source habitat; size of stock
population; stray rate of stock population; adjustment to new habitat; and interaction with
resident fish populations (Pess et al. 2008). In addition, management programs need to
encompass estimates of current river herring abundance and watershed capacity from
more locations so models can more accurately determine requirements of what is needed
to restore watersheds to productive and profitable levels. Such models would provide
better analysis of how resilient the population remains after four centuries of obstruction
and exploitation. We can then apply such estimates to predict future abundance and
evaluate effects on predator and prey species. This will be a necessary step for creating
fisheries policies that follow ecosystem-based management approaches.
For example, can restoration of fifty percent of historical river herring
productivity provide enough of an inshore forage base to bring back coastal Atlantic cod
spawning populations? Ames (2004) found that up to 50% of coastal cod spawning
grounds in the Gulf of Maine were lost between 1920 and the present, with many of the
spawning areas located along the Maine coast. During this time, Maine river herring were
restricted to below head of tide spawning areas and annual production was most likely
less than one percent of historical potential. Energetic studies of cod growth and
reproductive health with river herring and other diadromous forage fish as primary food
sources compared to other prey would allow us to estimate the gains or losses spawning

89
cod populations would experience with reintroduction of these migrating species. Also,
returning diadromous fish populations would restore a large component of lost nutrient
exchange between freshwater and marine ecosystems thereby affecting the entire trophic
landscape from inland ecosystems to open ocean.
For a complete picture of anthropogenic impact, estimates of truly virgin
baselines would need to be produced from not just pre-colonial data, but from evidence
of population size before the appearance of indigenous peoples. Such archaeologically
based work has been conducted successfully in several marine ecosystems based on food
refuse piles (middens) and paleontological data (Wing &Wing 2001).
However, even without more refined calculations, the estimates of historic
productivity and potential population size of alewives presented here will allow for much
more accurate and realistic evaluation of current recovery initiatives and help guide more
effective future management programs. Incorporating these historic baselines into models
that analyze the trophic cascade of nutrient exchange and interdependent species
abundance within extended terrestrial-aquatic ecosystems can not only tell us how the
ecology has been changed but in what ways can it most realistically be restored.

64
Table 3.1. Watershed contribution based on alewife harvest records throughout the 19th and 20
th centuries. Total is the number of times
each watershed contributed to harvests. Watersheds are listed as they occur along the coast from west to east.
Watershed 1804-
1820a
1833-
1840a
1867b
1887-
1890c,d
1896
e 1942
f
1950-
1955g
1960-
1966g
1970sg 1980s
g 1990s
g
2000-
2007g
Total
Casco Bay X X X 3
Androscoggin/
Kennebec X X
8 X X X
2 X
1 X
2 X
2 X
2 X
2 10
Sheepscot X X X X 4
Damariscotta X X X X X X X X X X X 11
Medomak X 1
St. George X X X X X X X X X X X 11
Penobscot X X8 X X X
3 X
3 X
3 X
3 X
3 X
3 X
3 11
Union X4 X
5 X
6 X
6 4
Narraguagus X X X 3
East Machias X X X X X 5
Dennys X X 2
Cobscook Bay X X 2
% Maine harvest
from watersheds 98 91 “mainly” 90 90
7 90 90 90 90 variable 90
a. Maine Sec. of St. Fish Inspector Reports 1804-1840 1. Nequasset Lake only, below Kennebec River head of tide
b. Atkins & Foster 1868 2. Nequasset and Winnegance Lakes only, below Kennebec River head of tide
c. Maine Comm. of Fish. & Game Report 1888 3. Orland River only, below Penobscot River head of tide
d. Maine Comm. of Fish. & Game Report 1889-1890 4. Patten Pond Stream only, below Union River head of tide
e. Smith 1899 5. Patten Pond Stream and main stem of Union River
f. Rounsefell & Stringer 1943 6. Main stem of Union River only, no harvest from Patten Pond Stream
g. Town Harvests from MDMR 2008 7. Estimated from accessible spawning area
8. Harvested below river-obstructing head of tide dam
90

64
Table 3.2. Watershed fisheries productivity index. Percent contribution of watershed to total recorded production over 14 periods of
alewife harvest records from 1800-2007. Timeline gaps indicate periods of missing or incomplete quantitative harvest records.
Watershed 1804-
1810a
1811-
1820a
1833-
1840a
1841-
1850a
1887b 1889
c 1896
d 1938
e
1950-
1959f
1960-
1969f
1970-
1979f
1980-
1989f
1990-
1999f
2000-
2007f
Casco Bay 23.0 6.3 5.4 3.3 0 0 20.7 0 0 0 0 0 0 0
Androscoggin/
Kennebec 12.6 2.3 0 18.4 0 0 8.2 2.9 3.2 7.5 8.4 15.1 8.8 11.8
Sheepscot 0 0 0 0 0 0 0 0 0 1.1 7.9 7.9 3.1 4.4
Damariscotta 0 0 0 10.0 73.8 86.7 41.0 33.5 51.4 44.5 28.1 13.8 4.3 7.7
Medomak 0 0 0 0 7.0 6.9 0 0 0 0 0 0 0 0
St. George 1.5 0 0 0 19.1 6.4 11.4 13.0 22.4 21.8 20.7 12.6 28.1 24.4
Penobscot 43.6 86.7 78.0 9.0 0 0 9.1 12.0g 13 14.1 15.9 18.5 8.7 10.7
Union 0 0 0 0 0 0 0 0 0 0 3.9 18.1 33.8 22.2
Narraguagus 0 0 0 0 0 0 0 0 0 0 2.1 2.8 1.8 6.5
East Machias 0 0 0 0 0 0 0 22.6h 0 1 3.0 1.2 1.4 2.3
Dennys 0 0 0 0 0 0 0 5.6h 0 0 0 0 0 0
Cobscook Bay 16.2 2.4 7.7 57.5 0 0 0 0 0 0 0 0 0 0
% total Maine
harvest 96.9 97.7 91.1 98.1 99.9 100 90.4 89.6 90 90 90 90 90 90
a. Maine Sec. of St. Fish Inspector Reports 1804 –1850 d. Smith 1899 g. Estimated contribution of Orland River b. Maine Comm. of Fish. & Game Report 1888 e. Rounsefell & Stringer 1943 h. Estimated based on 1942 harvest proportions
c. Maine Comm. of Fish. & Game Report 1889-1890 f. Town Harvests from MDMR 2008
91

92
Table 3.3. Nine focus river herring watersheds with total number of dams constructed
from settlement to present, the year of full obstruction by dam at head of tide and total
virgin stream and lake spawning habitat. Numbers in parentheses by watersheds indicate
categories of primary river (1), secondary river (2) or bay system (3).
Watershed
Dams
constructed
1600 –
present
Head of
tide dam:
year
Virgin stream
distance (km)
Virgin lake
surface area
(km2)
Mousam River (2) 24 1720 183.5 10.7
Casco Bay (3) 93 1802 862.1 136.1
Androscoggin
River (1)
(Maine only)
145 1807 906.2 45.9
Kennebec River (1) 226 1837 2392.3 197
Sheepscot River (2) 47 1762 558 19.4
St. George River (2) 35 1840s 549.2 31.7
Penobscot River (1) 283 1835 5332 327.8
Union River (2) 36 1800 480.9 93.2
Dennys River (2) 19 1846 230.1 30.1
TOTAL 908 11,494.3 891.9

93
Table 3.4. Summary of recruitment cumulative frequency distribution results based on
Damariscotta River fishery data, 1949-1983 (Crecco & Gibson 1990).
Percentile Estimated recruits
(N x 103)
Production potential
x103 (recruits/km
2)
25th
1210.2 64.13
50th
1418.8 75.15
75th
1727.1 91.53

94
Table 3.5. Category 1 Watershed: Kennebec watershed remaining lake habitat and five
estimates of annual alewife productivity based on chronological completion of dams with
measurable impact before 1900. Fish (adults or recruits) per km2 is abbreviated as f/km
2.
Year
Lake
surface
area
(km2)
29.0 x 10³
f/km2
58.1 x 10³
f/km2
Production
(# of fish)
at
64.1 x 10³
f/km2
75.2 x 10³
f/km2
91.5 x 10³
f/km2
1600 197.0 5,713,870 11,447,443 12,635,534 14,806,805 18,034,156
1754 105.5 3,059,462 6,129,474 6,765,632 7,928,227 9,656,296
1760 50.4 1,461,890 2,928,821 3,232,793 3,788,312 4,614,027
1765 44.1 1,278,320 2,561,048 2,826,850 3,312,612 4,034,642
1768 43.9 1,272,665 2,549,719 2,814,345 3,297,958 4,016,794
1783 43.5 1,260,688 2,525,723 2,787,859 3,266,921 3,978,992
1792 9.4 271,788 544,513 601,026 704,306 857,819
1808 9.4 271,324 543,584 600,000 703,103 856,355
1837 2.7 77,024 154,314 170,329 199,598 243,104
1867 0.7 20,474 41,019 45,276 53,056 64,620

95
Table 3.6. Category 2 Watershed: St. George watershed remaining lake habitat and five
estimates of annual alewife productivity based on chronological completion of dams with
measurable impact before 1900. Fish (adults or recruits) per km2 is abbreviated as f/km
2.
Year
Lake
surface
area
(km2)
29.0 x 10³
f/km2
58.1 x 10³
f/km2
Production
(# of fish)
at
64.1 x 10³
f/km2
75.2 x 10³
f/km2
91.5 x 10³
f/km2
1600 31.7 920,170 1,843,513 2,034,845 2,384,510 2,904,247
1734 31.1 901,813 1,806,736 1,994,251 2,336,940 2,846,308
1777 22.9 664,303 1,330,897 1,469,026 1,721,461 2,096,678
1785 1.6 45,240 90,636 100,043 117,234 142,787
1867 0 0 0 0 0 0

96
Table 3.7. Category 3 Watershed: Casco Bay watershed remaining lake habitat and five
estimates of annual alewife productivity based on chronological completion of dams with
measurable impact before 1900. Fish (adults or recruits) per km2 is abbreviated as f/km
2.
Year
Lake
surface
area
(km2)
29.0 x 10³
f/km2
58.1 x 10³
f/km2
Production
(# of fish)
at
64.1 x 10³
f/km2
75.2 x 10³
f/km2
91.5 x 10³
f/km2
1600 136.1 3,945,624 7,904,854 8,725,271 10,224,608 12,453,206
1700 136.0 3,944,290 7,902,181 8,722,321 10,221,152 12,448,995
1750 136.0 3,943,043 7,899,683 8,719,564 10,217,920 12,445,060
1762 4.1 117,943 236,293 260,817 305,635 372,253
1766 3.6 104,023 208,405 230,034 269,563 328,318
1791 3.6 103,385 207,126 228,623 267,910 326,304
1802 0.8 23,548 47,177 52,074 61,022 74,322
1890 0.8 22,939 45,957 50,727 59,444 72,400

97
Table 3.8. State of Maine remaining lake habitat, five estimates of annual alewife
productivity recorded as number of fish (N) and percent (%) of total historical abundance
in fifty-year increments. Fish (adults or recruits) per km2 is abbreviated as f/km
2.
Year
Lake
surface
area
(km2)
29.0 x 10³
f/km2
58.1 x 10³
f/km2
Production
(N x 106)
at
64.1 x 10³
f/km2
75.2 x 10³
f/km2
91.5 x 10³
f/km2
%
1600 891.8 25.87 51.82 57.20 67.03 81.64 100
1650 891.8 25.87 51.82 57.20 67.03 81.64 100
1700 890.2 25.82 51.72 57.09 66.90 81.48 99.8
1750 880.4 25.53 51.15 56.46 66.16 80.58 98.7
1800 367.2 10.65 21.33 23.55 22.60 33.61 41.2
1850 17.6 0.51 1.02 1.13 1.32 1.61 2.0
1900 6.5 0.19 0.38 0.41 0.49 0.59 0.7

98
Figure 3.1. Maine Landings compiled 1880 – 2007. Data from Smith 1899, Flagg 1979,
and MDMR website last accessed August 2009 at:
http://www.maine.gov/dmr/commercialfishing/documents/alewife.tbl.pdf
0
1
2
3
4
5
6
7
8
9
10
1880
1931
1937
1943
1949
1955
1961
1967
1973
1979
1985
1991
1997
2003
Year
Nu
mb
er o
f A
lew
ives (
x 1
06)

99
Figure 3.2. State of Maine with historical river herring watersheds assessed in this study
demarcated by associated documented dams along each watershed.

100
Figure 3.3. Detail of Maine coast with all watersheds identified that contributed to
harvests 1800-2007. Harvest ranges of 1800 to 1840 (thin dashed circle) and 1880s (thick
dashed circle) indicated.

101
Figure 3.4. Watershed harvest contribution 1800 – 1900. Changes in percent contribution
to alewife productivity per watershed reported during the 19th century. Harvest periods
chosen by watershed specific harvest data availability.

102
Figure 3.5. Damariscotta alewife fishery spawner – recruit curve. Beverton-Holt model fit
to observed data from 1949 – 1983 (n = 35, R = (2354.3) S/ 85.59 + S, F = 183.67, p <
0.0001). Asymptote at 2354 x 103 recruits, slope at origin = 24.3. Best fit bracketed by
95% confidence intervals with upper parameters of a = 2920, b = 30.85, and lower
parameters of a = 1788.6, b = 140.3.

103
Figure 3.6. Breakpoint analysis of observed recruits from Damariscotta River alewife
fishery data 1949-1983. Three significant regressions were found with breakpoints at
1953 and 1967.

104
Figure 3.7. Category 1 Watershed: Kennebec River. A) lake surface area remaining in
km2 and B) five annual productivity estimates over years 1600 – 1900 in number of
alewives. Vertical drop down lines in each graph indicate year of dam construction that
resulted in a measurable loss of virgin spawning habitat.
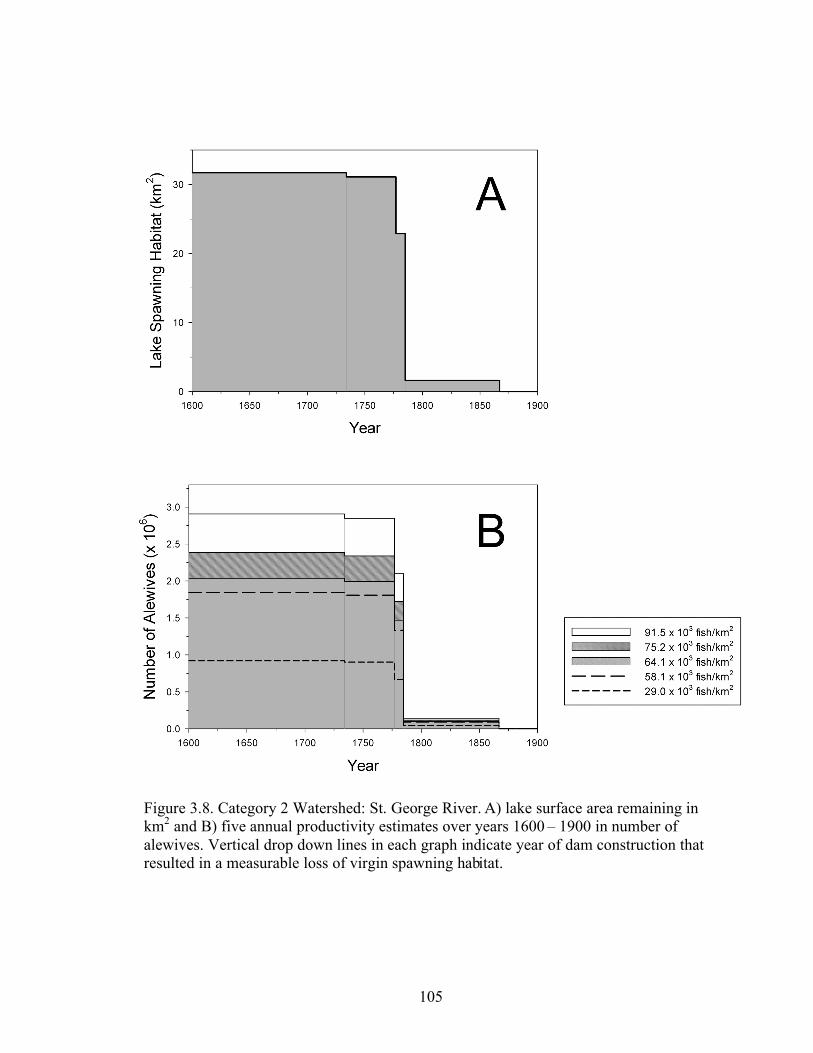
105
Figure 3.8. Category 2 Watershed: St. George River. A) lake surface area remaining in
km2 and B) five annual productivity estimates over years 1600 – 1900 in number of
alewives. Vertical drop down lines in each graph indicate year of dam construction that
resulted in a measurable loss of virgin spawning habitat.

106
Figure 3.9. Category 3 Watershed: Casco Bay. A) lake surface area remaining in km2 and
B) five annual productivity estimates over years 1600 – 1900 in number of alewives.
Vertical drop down lines in each graph indicate year of dam construction that resulted in
a measurable loss of virgin spawning habitat.

107
Figure 3.10. State of Maine A) Five annual productivity estimates from nine focus
watershed totals. Vertical drop down lines correspond to fifty-year increments. B)
Chronological presentation of changes in percent annual virgin productivity over fifty-
year increments.

108
Figure 3.11. Comparative annual alewife production in the Dennys, Androscoggin and
Kennebec watersheds. Virgin production estimates in 1600 calculated using productivity
value of 95.1 x 10³ recruits/km
2, arrow and number in top left indicate virgin production
estimate for Kennebec. Current production fish count data from Dennys in 2009 (Gail
Wippelhauser, MDMR, personal communication 2009), Androscoggin in 2008 (Brown et
al. 2008; Gail Wippelhauser, MDMR, personal communication 2009) and Kennebec in
2007 (MDMR & MASC 2007; MDMR 2008).

115
Chapter 4: Summary
Over the last four centuries, loss of diadromous fish populations due to
overfishing and other human impacts on the watersheds they inhabit has led to costly
stock and watershed restoration efforts (Jackson 2008). Despite such efforts, many of
these commercially and ecologically valuable species, and the predators that relied on
their former abundance, have been extirpated or have declined to unsustainable levels
today (Lotze et al. 2006, Saunders et al. 2006). Restoring these species and their
historical watersheds in the northeastern U.S. to pre-colonial conditions is not necessarily
desirable. However, successful recovery defined in terms of healthy ecosystem
functioning and sustainable fisheries requires an understanding of how current conditions
compare to past potentials. In other words, we have to know where the system has come
from in order to know what we can expect and manage for in the future.
Missing from current management efforts is a thorough assessment of the
individual factors leading to population decline for the complete history of anthropogenic
ecosystem alteration (Pitcher & Pauly 1998; Jackson et al. 2001). This thesis provides the
first comprehensive historical analysis of the impact of colonial industry in the form of
dam construction on watersheds and the diadromous species dependent upon them for
survival in the state of Maine. Although this study focused on river herring, the methods
and conclusions can be applied to all migration and spawning habitat requirements for
mid-trophic level diadromous species. Despite uncertainties and assumptions included in
this study, the broad trends regarding damming of Maine waterways, including loss of
river herring access to spawning habitat, shifts in watershed importance for alewife

116
fisheries, and estimates of lost alewife production, comprehensively illustrate the
enormous magnitude of harm caused by anthropogenic obstruction of fish migration.
The cumulative effect of 915 dams constructed between 1600 and 1900, and 1356
dams in total today, is state-wide obstruction of all Maine watersheds from the coast to
deep inland and the loss of over 6 billion fish in 300 years. Following the advancement of
colonial settlements, mill, logging and finally hydroelectric dam construction spread from
the southwest to the northeast resulting in damming of all river herring watersheds at
head of tide by 1846, thus restricting migration distance on most rivers to less than 32%.
Depending on watershed size, the timeline of dam construction differed in that one dam
could reduce lake habitat to 3%, as in the Casco Bay watershed, whereas three dams in 40
years reduced Kennebec lake habitat to 4.8% with both reductions occurring before 1800.
Even with these differences, the 19th
century began with lake spawning habitat less than
5% of its pre-disturbed size on most watersheds. By 1860, nearly all historically available
habitat – stream and lake – was no longer accessible.
Records of alewife harvest through the 1800s documented changes in watershed
contribution to fisheries productivity during a peak century of dam construction. The
range of watersheds used for alewife harvest in the first half of the 19th century spanned
nearly the entire coast from western Casco Bay to the eastern Canadian border. Over 80%
of the harvest came from a primary river watershed, the Penobscot, during this time. By
mid century, fishery production occurred only from spawning sites below head of tide on
all watersheds. In the 1880s, harvests were restricted to three secondary river watersheds
all situated in the center coast and the artificially stocked Damariscotta watershed
replaced the Penobscot, producing over 80% of the harvest.

117
A quantitative assessment of alewife productivity as dams obstructed waterways
was conducted using five potential annual production values based on data from the mid
20th
century through the 1990s. These values ranged from 29 x 103 adult returns per km
2
to 91.5 x 10³ recruits per km
2. As dams obstructed access to lake area, annual
productivity decreased on all watersheds with a maximum loss of 1 to 29 million
alewives per year from 1600 to 1900 (see Chapter 3, Appendix 3.1). Current annual
alewife counts on three watersheds with restoration efforts are just 2 – 6% of the virgin
annual production estimates calculated with the 75th
percentile value based on mid 20th
century data. Percent annual production for Maine, calculated by summing annual
production of all nine analyzed historic watersheds, remained near 100% or virgin annual
productivity through 1700. By 1750, productivity was beginning to decrease.
Productivity was only 50% by 1800 and less than 1% by 1900. If all virgin lake area had
been accessible from 1600 to 1900, the total production calculated using the 75th
percentile, or the maximum of my estimated range, would have been 24.5 billion
alewives. With documented obstructions, the total production equaled 18 billion giving a
total loss of 6.5 billion alewives over 300 years, or a quarter of the potential production.
The 75th
percentile value was estimated from 20th century data, and therefore
provides a conservative adjustment of production values to reflect less-altered
watersheds. Even with mid 20th century data, the results show a 30,000 alewives/km
2
difference in virgin annual potential production between the historic value and the current
Maine standard. This emphasizes the importance of determining an historic baseline
abundance based on longer term and earlier population data. Historical analysis of sea
turtle populations in the Caribbean supports the notion that short-term data series often
118
fail to detect declines in populations (McClenachan et al. 2006). Setting maximum
sustainable yields and restoration goals based on more historically realistic baselines can
help address not only the decline of one species, but also the impact that lost biomass had
on the ecosystem as a whole. Future ecosystem modeling and energy exchange studies
that incorporate historical estimates can better determine how the disappearance of over 6
billion alewives might have contributed to the loss of other important species in the Gulf
of Maine including the commercially valuable coastal Atlantic cod (Baird 1874, Ames
2004). Multi-species analyses can also help answer critical management questions such
as, what is the likelihood of Atlantic salmon reintroduction success without migrating
alewives serving as a prey buffer for juvenile salmon (Fay 2003, Saunders et al. 2006)?
A comprehensive understanding of long-term human influence on diadromous
species requires historical research incorporating pollution, overfishing and changes in
river channelization and pond formation spanning the 17th
, 18th
and 19th centuries in the
U.S. – and even further back for watersheds in countries with earlier development. Only
with all elements of anthropogenic alteration represented can we fully appreciate the
magnitude of ecosystem change European colonists set into motion in North America
four hundred years ago. Even so, the historical analysis presented here can be
immediately applied to current restoration and management initiatives, helping to
determine the most cost-effective and beneficial dam removal or fish ladder restoration
projects. These results will help determine how removal of these barriers will affect
recovery of river herring, as well as other interdependent coastal species, and move us
one step closer to a more realistic recovery of a once-bountiful ecosystem.

119
Literature Cited
Anonymous, Boston Gazette [Boston] 22 December, 1747.
Anonymous. “Legislature of Massachusetts.” The Eastern Herald & Gazette of Maine
[Portland] 26 March, 1798.
Ames, E.P. 2004. Atlantic Cod stock structure in the Gulf of Maine. Fisheries 29:10-28.
Ames, P.J. & Bray, S. (ed.). 2000. Best Remembered: Orland, Maine, 1800-2000: history
and recollected stories to celebrate our bicentennial. Town of Orland, Me. 189 pp.
ASMFC (Atlantic States Marine Fisheries Commission). 2009. Amendment 2 to the
Interstate Fishery Management Plan For Shad and River Herring. Washington, D.C.
ASRSC (Atlantic Sea-Run Salmon Commission). 1982-1983. Atlantic salmon river
management reports. State of Maine Atlantic Sea-Run Salmon Commission. Bangor, Me.
Baum, E.T. 1983. The Penobscot River.
Baum, E.T. & Beland, K.F. 1982. The Union River & Minor Coastal Drainages
East of the Penobscot River.
Baum, E.T., Jordan, R.M. & Dube, N.R. 1982. The Narraguagus & Pleasant
Rivers.
Beland, K.F., Dube, N.R., Fletcher, J.S. & Jordan, R.M. 1982. The Machias &
East Machias.
Beland, K.F., Fletcher, J.S. & Meister, A.L. 1982. The Dennys River.
Dube, N.R. 1983. The Saco River.
Fletcher, J.S. & Meister, A.L. 1982. The St. Croix River.
Meister, A.L. 1982. The Sheepscot River.
Atkins, C.G. 1887. The river fisheries of Maine. In: Goode, B.G. et al. The Fisheries and
Fishery Industries of the United States, Section V, Volume 1, 673-728.
Atkins, C.G. & Foster, N. 1868. First Report of the Commissioners of Fisheries of the
State of Maine, 1867. Owen & Nash, Augusta, Me.
Atkins, C.G. & Foster, N. 1869. Second Report of the Commissioners of Fisheries of the
State of Maine, 1868. Owen & Nash, Augusta, Me.
Atkins, C.G. & Stillwell, E.M. 1874. Obstructions to the upward movement of fishes in
streams, and the remedy. In: US Commission of Fish and Fisheries. Part II. Report of the
Commissioner for 1872 & 1873. Appendix E; Sections XXIII & XXIV. Pp. 589-621.
Government Printing Office, Washington, D.C.

120
Baird, S.T. 1872. Letter to Maine Commissioner of Fisheries on the diminution of the
supply of food-fishes. In: Atkins, C.G. 1872. Sixth Report of the Commissioners of
Fisheries of the State of Maine, 1872. Pp. 7-10. Owen & Nash, Augusta, Me.
Baird, S.T. 1874. U.S. Commission of Fish and Fisheries. Part II. Report of the
Commissioner for 1872 and 1873. Government Printing Office, Washington, D.C.
Baird, S.T. 1883. U.S. Commission of Fish and Fisheries. Report of the Commissioner
for 1883. Government Printing Office, Washington, D.C.
Bigelow, H.B. & Schroeder, W.C. 1953. Fishes of the Gulf of Maine. US Fish and
Wildlife Service Fishery. Bulletin #74, Vol. 53. US Government Printing Office,
Washington, DC. 577 pp.
Bilby, R.E., Fransen, B.R. & Bisson P.A. 1996. Incorporation of nitrogen and carbon
from spawning coho salmon into the trophic system of small streams: evidence from
stable isotopes. Canadian Journal of Fisheries and Aquatic Sciences 53: 164-173.
Brown, M.E., Maclaine, J.E. & Flagg, L. 2008. Anadromous fish restoration in the
Androscoggin River Watershed. 2007 report on the operation of the Brunswick fishway
FERC #2284. Maine Dept. of Marine Resources. P.L. 89-304. 28 pp.
Carlton, Sr., G.M. 1983. Tide Mills of Maine & Beyond. Central Maine Vocational
Technical Institute, Auburn, Maine. 30 pp.
Chaput, G. & Atkinson, G. 2001. The gaspereau fisheries (Alosa pseudoharengus and A.
aestivalis) of the Miramichi River with updates on the fishery of the Richibucto River of
Gulf New Brunswick, 1997 to 2000. Canadian Science Advisory Secretariat, Research
Document 2001/047. Department of Fisheries and Oceans. Moncton, NB.
Christensen, V. & Walters, C.J. 2004. Ecopath with Ecosim: methods, capabilities and
limitations. Ecological Modeling 172: 109-139.
Clark, C.E. 1970. The Eastern Frontier: The Settlement of Northern New England 1610
– 1713. Alfred A. Knopf, New York. 419 pp.
Crecco, V.A. and Gibson, M. 1990. Stock assessment of river herring from selected
Atlantic coast rivers. Special Report No. 19 of the Atlantic States Marine Fisheries
Commission.
Cronon, W. 1983. Changes in the Land: Indians, Colonists, and the Ecology of New
England. Hill and Wang, New York. 241 pp.
Cushman, D.Q. 1882. The history of ancient Sheepscot and Newcastle, including early
Pemaquid, Damariscotta, and other contiguous places, from the earliest discovery to the
present time. E.Upton & Son, Bath , Me. 458 pp.

121
Dayton, P.K., Tegner, M.J., Edwards, P.B. & Riser, K.L. 1998. Sliding baselines, ghosts
and reduced expectations in kelp forest communities. Ecological Applications 8(2): 309-
322.
Decker, L.F. 1967. Fishways in Maine. Published by Maine Dept. of Inland Fisheries &
Game, Augusta, Me.
Dow, R.L. 1977. Effects of climatic cycles on the relative abundance and availability of
commercial marine and estuarine species. Journal du Conseil International pour
l’Exploration de la Mer 37(3): 274-280.
Drisko, G.W. 1904. Narrative of the Town of Machias. The old and the new the early and
the late. Press of the Republican. Machias, Me. 576 pp.
Duncan, R.F. 1992. Coastal Maine: a maritime history. W.W. Norton & Co, New York.
573 pp.
Dwight, T. 1821. Travels; in New-England and New-York. In Four Volumes. Published
by author, printed by S. Converse, New Haven. 524 pp.
Dynesius, M. & Nilsson, C. 1994. Fragmentation and flow regulation of river systems in
the Northern third of the World. Science 266(5186): 753-762.
Emery, E. 1901. The History of Sanford Maine 1661-1900. Compiled, edited and
arranged by W.M. Emery. Fall River, MA. 537 pp.
Fay, C. 2003. Biological and ecological role of alewives. Maine Rivers Annual
Conference 2003. September 27-28, 2003. Indian Island, Maine.
Flagg, L.N. 2007. Historical and Current Distribution and Abundance of the Anadromous
Alewife (Alosa pseudoharengus) in the St Croix River. A Report to the State of Maine
Atlantic Salmon Commission.
Graham, J., Engle, S. and Recchia, M. 2002. Local knowledge and local stocks: An atlas
of groundfish spawning in the Bay of Fundy. The Centre for Community-based
Management, Extension Dept., St. Francis Xavier University. Antigonish, Nova Scotia,
Canada.
Greenleaf, M. 1829. A Survey of the State of Maine: In Reference to Its Geographical
Features, Statistics and Political Economy. Shirley and Hyde. 460 pp.
Haddon, M. 2001. Modelling and quantitative methods in fisheries. Chapman &
Hall/CRC. 406 pp.

122
Hanson, J.W. 1852. History of Gardiner, Pittston and West Gardiner, with a sketch of the
Kennebec Indians, & New Plymouth purchase, comprising historical matter from 1602 to
1852; with genealogical sketches of many families. William Palmer, Gardiner, Me. 343
pp.
Innis, H.A. 1940. The Cod Fisheries: The History of an International Economy. Yale
University Press, New Haven, Conn. 520 pp.
Isaacson, D.A. (ed.), Maine League of Historical Societies and Museums. 1970. Maine; a
Guide 'Down East.'. First edition published in 1937, written by the staff of the Federal
Writers' Project of the Works Progress Administration (WPA) of the State of Maine.
Courier-Gazette, Rockland, Me. 510 pp.
Jackson, J.B.C. 2008. Ecological extinction and evolution in the brave new ocean.
Proceedings of the National Academy of Sciences 105 suppl. 1: 11458–11465.
Jackson, J.B.C., Kirby, M, Berger, W., Bjorndal, K.A., Botsford, L. Bourque, B.J.,
Bradbury, R.H., Cooke, R.G., Erlandson, J., Estes, J.A., Hughes, T.P., Kidwell, S.,
Lange, C., Lenihan, H., Pandolfi, J.M., Peterson, C., Steneck, R., Tegner, M.J. & Warner,
R.R. 2001. Historical overfishing and the collapse of coastal ecosystems. Science 293:
629-638.
Jessop, B.M., Anderson, W.E. & Vromans, A.H. 1983. Life-history data on alewife and
blueback herring of the Saint John River, New Brunswick, 1981. Canadian Fisheries and
Aquatic Sciences Data Report No. 426, New Brunswick, Canada.
Josselyn, J. & Lindholdt, P.J. (ed.) 1988. John Josselyn, Colonial Traveler: a critical
edition of Two Voyages to New-England. 1672. University Press of New England,
Hanover. 221 pp.
Judd, R.W. 1997. Common Lands, Common People. Harvard University Press,
Cambridge, Ma. 335 pp.
Kinnison, M.T., Unwin, M.J., Hendry, A.P. & Quinn, T.P. 2001. Migratory costs and the
evolution of egg size and number in introduced and indigenous salmon populations.
Evolution 55:1656-1667.
Kline, T.C., Goering, J.J., Mathisen, O.A., Poe, P.H. & Parker, P.L. 1990. Recycling of
elements transported upstream by runs of Pacific salmon. I. !15
N and !13
C evidence in
Sashin Creek, southeastern Alaska. Canadian Journal of Fisheries and Aquatic Sciences
47: 136-144.
Kritzer, J. & Black, P. 2007. Oceanic distribution and bycatch of river herring. An
analysis of federal fishery-independent and fishery-dependent data. Progress report.
October 2007. Environmental Defense.

123
Larinier, M. 2000. Dams and fish migration. Contributing paper, prepared for Thematic
Review II.1: Dams, ecosystem functions and environmental restoration. The World
Commission on Dams.
Leavenworth, W.B. 2008. The changing landscape of maritime resources in seventeenth-
century New England. International Journal of Maritime History XX(1): 33-62.
Lichter, J., Caron, H., Pasakarnis, T.S., Ridgers, S.L., Squiers, Jr., T.S. & Todd, C.S.
2006. The ecological collapse and partial recovery of a freshwater tidal ecosystem.
Northeastern Naturalist 13(2): 153-178.
Loring, A. 1880. History of Piscataquis County, Maine. From its earliest settlement to
1880. Hoyt, Fogg & Donham, Portland, Me. 304 pp.
Lotze, H.K., Lenihan, H.S., Bourque, B.J., Bradbury, R.H., Cooke, R.G., Kay, M.C.,
Kidwell, S.M., Kirby, M.X., Peterson, C.H. & Jackson J.B.C. 2006. Depletion,
Degradation, and Recovery Potential of Estuaries and Coastal Seas. Science 312(5781):
1806 – 1809.
Lotze, H.K. & Milewski, I. 2004. Two centuries of multiple human impacts and
successive changes in a North Atlantic food web. Ecological Applications 14(5): 1428-
1447.
MacAvoy, S.E., Macko, S.A., McIninch, S.P. & Garman, G.C. 2000. Marine nutrient
contributions to freshwater apex predators. Oecologia 122: 568-573.
Maine Legislative Records (MLR). Graveyard. Box 8. 1821. Maine State Archives.
Augusta, Me.
MLR. Graveyard. Boxes 16 & 17. 1823. Maine State Archives. Augusta, Me.
MLR. Graveyard. Boxes 24 & 25. 1824. Maine State Archives. Augusta, Me.
MLR. Graveyard. Boxes 31 & 34. 1825. Maine State Archives. Augusta, Me.
MLR. Graveyard. Boxes 38 & 41. 1826. Maine State Archives. Augusta, Me.
MLR. Graveyard. Box 46. 1827. Maine State Archives. Augusta, Me.
MLR. Graveyard. Box 62. 1830. Maine State Archives. Augusta, Me.
MLR. Laws. Boxes 8 &13. 1821. Maine State Archives. Augusta, Me.
MLR. Public Logs. Box 26. 1823. Maine State Archives. Augusta, Me.
MLR. Public Special Logs. Box 26. 1823. Maine State Archives. Augusta, Me.

124
MLR. Public Special Logs. Boxes 27 & 30. 1824. Maine State Archives. Augusta, Me.
MLR. Public Special Logs. Boxes 40, 42 & 43. 1826. Maine State Archives. Augusta,
Me.
MLR. Public Special Logs. Boxes 45 & 47. 1827. Maine State Archives. Augusta, Me.
MBSRFH (Maine Bureau of Sea-Run Fisheries and Habitat). 2007. Draft strategic plan
for the restoration of diadromous and resident fishes to the Penobscot River. Department
of Marine Resources, Augusta, Me.
Maine Secretary of State. Fish Inspector Records. 1804-1893. Boxes 1-9. Maine State
Archives. Augusta, Me.
McClenachan, L., Jackson, J.B.C. & Newman, M.J.H. 2006. Conservation implications
of historic sea turtle nesting beach loss. Frontiers of Ecology and the Environment 4(6):
290-296.
MCOFG (Maine Commissioner of Fisheries and Game). 1888. Report of the
Commissioner of Fisheries and Game of the State of Maine for the year 1888. Burleigh &
Flint, Printers to the State, Augusta, Me.
MCOFG (Maine Commissioner of Fisheries and Game). 1890. Report of the
Commissioner of Fisheries and Game of the State of Maine for the years 1889-1890.
Burleigh & Flint, Printers to the State, Augusta, Me.
MCOIFG (Maine Commissioner of Inland Fisheries and Game). 1922. Report of the
Commissioner of Inland Fisheries and Game for the State of Maine for the year ending
June 30, 1922. Augusta, Me.
MDEP (Maine Department of Environmental Protection). January 1, 2009 status reports:
Hydropower projects in Maine, DEPLW0363-H2009, and Dam Removals in Maine and
Dams Subject to Regulated Minimum Flow Releases. Last accessed March 2009 at
http://www.maine.gov/dep/blwq/docstand/dams/non_hydro/index.htm
MDIFG (Maine Department of Inland Fisheries and Game). 1955-1967. Maine river
surveys conducted under Commissioner Roland H. Cobb in cooperation with the Maine
Atlantic Salmon Commission. Augusta, Me.
Cutting, R.E. 1959. Penobscot River: Salmon restoration.
DeRoche, S.E. 1955. Kennebunk River: fish restoration.
DeRoche, S.E. 1955. Mousam River: fish restoration.
DeRoche, S.E. 1956. Saco River: fishery management.
DeRoche, S.E. 1958. Royal River Drainage: fisheries management.
DeRoche, S.E. 1967. The Presumpscot River: a biological survey report.

125
Fenderson, C.N. & AuClair, R.P. 1956. Piscataquis River: fishery management
and restoration.
Fletcher, J.S. 1955. Machias River: salmon restoration.
Fletcher, J.S. 1960. Dennys River Drainage: fishery management and restoration.
Foye, R.E. 1955. Pemaquid River: fish restoration.
Foye, R.E. 1956. Medomak River Drainage: fish management.
Foye, R.E. 1956. St. George River Drainage: fish management survey.
Foye, R.E. 1957. Passagassawaukeag River Drainage: fish management.
Havey, K.A. 1956. Tunk River Drainage: fish management and restoration.
Havey, K.A. 1956. Orland River Drainage: Fish Management and Restoration.
Havey, K.A. 1956. Pennamaquan River Drainage: fish management and
restoration.
Havey, K.A. 1961. Union River: fish management and restoration.
Havey, K.A. 1963. St. Croix River: fish management and restoration.
Havey, K.A. & Fletcher, J.S. 1956. The Pleasant River: fish management and
restoration.
Warner, K. 1956. Aroostook River: salmon restoration and fish management.
Warner, K. 1956. Prestile Stream: fish management.
Warner, K. 1957 and 1963. Meduxnekeag River: fishery management and
progress report.
MDMR (Maine Department of Marine Resources) Bureau of Sea-Run Fisheries and
Habitat. 2008. Kennebec River anadromous fish restoration. Annual progress report –
2007. 131 pp.
MDMR (Maine Department of Marine Resources), & MASC (Maine Atlantic Salmon
Commission). 2007. Kennebec River anadromous fish restoration. Annual progress report
– 2006. 124 pp.
MDMR (Maine Department of Marine Resources), MDIFW (Maine Department of
Inland Fisheries and Wildlife), & ASRSC (Atlantic Sea Run Salmon Commission). 1982.
State of Maine statewide river fisheries management plan.
MEGIS (Maine Geographic Information Systems) (comp., ed.), U.S. Geological Survey
(USGS). 2004. Watershed, county line and coast base layers. Last accessed April 2009 at
http://megis.maine.gov/catalog/
MEGIS (Maine Geographic Information Systems) (comp., ed.), Army Corp of Engineers
(USACE), Maine Emergency Management Agency (MEMA), Maine Department of
Environmental Protection (MEDEP)(comp., ed.). 2006. Impound database. Last accessed
August 2008 at http://megis.maine.gov/catalog/catalog.asp?state=2&extent=cover
Merrill, G.D., ed. 1891. History of Androscoggin County, Maine. W.A. Ferguson & Co.,
Boston, MA. 959 pp.
Moody, R.E. 1933. The Maine Frontier. 1607-1763. Yale University. 462 pp.

126
Morita, K., Morita, S.H. & Yamamoto, S. 2009. Effects of habitat fragmentation by
damming on salmonid fishes: lessons from white-spotted charr in Japan. Ecological
Research 24(4): 711-722.
Morton, T. 1637. New English Canaan. Printed by Jacob Frederick Stam., Amsterdam.
188 pp.
Mullen, D.M., Fay, C.W. & Moring, J.R. 1986. Species profiles: life
histories and environmental requirements of coastal fishes and invertebrates
(North Atlantic)--alewife/blueback herring. U. S. Fish Wildl. Serv. Biol. Rep.
82(11.56). U. S. Army Corps of Engineers, TR EL-82-4. 21 pp.
NCDENR (North Carolina Department of Environment and Natural Resources). 2000.
North Carolina fishery management plan: Albemarle Sound area river herring. North
Carolina Division of Marine Fisheries, Morehead City, NC.
NOAA (National Oceanic and Atmospheric Administration). 2006. Endangered and
threatened species: revision of species of concern list, candidate species definition, and
candidate species list (ID. 101106D). Federal Register 71 (200): 61022-61025. Tuesday,
October 17, 2006. Available at http://www.nmfs.noaa.gov/pr/pdfs/fr/fr71-61022.pdf
O’Leary, W.M. 1996. Maine Sea Fisheries: The Rise and Fall of a Native Industry, 1830
– 1890. Northeastern University Press, Boston. 391 pp.
Paine, L.P. 2000. Down East: a maritime history of Maine. Tilbury House, Gardiner, ME.
Maritime Maine. 180 pp.
Pauly, D. 1995. Anecdotes and the shifting baseline syndrome of fisheries. Trends in
Ecology and Evolution 10: 430.
Pess, G.R., McHenry, M.L., Beechie, T.J. & Davies, J. 2008. Biological Impacts of the
Elwha River dams and potential salmonid responses to dam removal. Northwest Science
82(Sp. Iss. SI): 72-90.
Peterson, B.J & Fry, B. 1987. Stable isotopes in ecosystem studies. Annual Review of
Ecology and Systematics 18: 293-320.
Petts, G.E. 1989. Perspectives for ecological management of regulated rivers. Chapter 1
in Alternatives in regulated river management by J.A. Gore & G.E. Petts. Pp. 3-24. CRC
Press.
Pitcher, T.J. & Pauly, D. 1998. Rebuilding ecosystems, not sustainability, as the proper
goal of fishery management. Pages 311-325 (Chapter 24) in Reinventing Fisheries
Management, eds. T. Pitcher, D. Pauly & P. Hart, (1998) Chapman & Hall Fish and
Fisheries Series. 435 pp.

127
Poff, N.L., Allan, J.D., Bain, M.B., Karr, J.R. Prestegaard, K.L., Richter, B.D., Sparks,
R.E. & Stromberg, J.C. 1997. The natural flow regime. A paradigm for river conservation
and restoration. Bioscience 47 (11): 769-784.
Poff, N.L. & Hart, D.D. 2002. How dams vary and why it matters for the emerging
science of dam removal. Bioscience 52 (8): 659-668.
Pope, C.H. 1965. The Pioneers of Maine and New Hampshire 1623 to 1660. Originally
published Boston, 1908. Geneological Pub. Co., Baltimore, Md. 252 pp.
Porter, J.W. (ed. and pub.). 1885-1895. The Maine [Bangor] Historical Magazine, Vol. I:
July 1885 – June 1886, IV: July 1888 – June 1889, VI: July 1890 – June 1891, VII: July
1891 – June 1892, VIII: January 1893 – December 1893, and IX: January 1894-January
1895. Benjamin A. Burr and Chas. H. Glass & Co, printers, Bangor, Me.
Post, D.M. & Waters, A.W. 2009. Nutrient excretion rates of anadromous alewives
during their spawning migration. Transactions of the American Fisheries Society 138:
264-268.
Reed, A. et al. 24 January 1821. Petition of Andrew Reed and others respecting fisheries
in the Kennebec River. Maine Legislative Records. 1825 Env. 15 Box 8 GY. Maine State
Archives. Augusta, Me.
Rosenberg, A.A., Bolster, W.J., Alexander, K.E., Leavenworth, W.B., Cooper, A.B. and
M.G. McKenzie. 2005. The history of ocean resources: modeling cod biomass using
historical records. Frontiers in Ecology and the Environment 3(2): 84-90.
Rounsefell, G.A & Stringer, L.D. 1945. Restoration and management of the New
England alewife fisheries with special reference to Maine. U.S. Department of the
Interior, Fish and Wildlife Service. American Fisheries Society Transactions, 73: 394-
424.
Sáenz-Arroyo, A., Roberts, C., Torre, J., Cariño-Olvera, M. and Hawkins, J. 2006. The
value of evidence about past abundance: marine fauna and the Gulf of California through
the eyes of 16th to 19
th century travelers. Fish and Fisheries 7: 128-146.
Saunders, R., Hachey, M.A. & Fay, C.W. 2006. Maine’s diadromous fish community:
past, present, and implications for Atlantic salmon recovery. Fisheries 31(11): 537-547.
Schindler, D.E., Scheuerell, M.D., Moore, J.W., Gende, S.M., Francis, T.B. & Palen,
W.J. 2003. Pacific salmon and the ecology of coastal ecosystems. Frontiers in Ecology
and the Environment 1(1):31-37.
128
Shaw, R.G. & Allen, N. et al. 20 December 1824. Petition by inhabitants of
Gouldsborough for law to prevent obstruction of fish passing Prospect Stream. Maine
Legislative Records. 1825 Box 34 GY. Maine State Archives. Augusta, Me.
Smith, D.C. 2002. Studies in the Land; the Northeast Corner. Routledge, New York, NY.
235 pp.
Smith, H.M. 1899. Notes on the extent and condition of the alewife fisheries of the
United States in 1896. In: U.S. Commissioner of Fish and Fisheries Report part XXIV for
the year ending June 30, 1898. Pp. 31-43. Government Printing Office, Washington, D.C.
Southgate, W.S. 18--. The history of Scarborough from 1633-1783. 237 pp.
Sylvester, H.M. 1909. Maine Pioneer Settlements in Five Volumes: I. Olde Cascoe, II.
Old York, III. Sokoki Trail, IV. Pemaquid, V. Land of St. Castin. W.B. Clarke Co,
Boston.
Trails.com. United States Geographical Survey quad topographic maps of Maine dams by
county. Last accessed April 2009 at www.topozone.com/states/Maine.asp?county
Trefts, D.C. 2006. Dams, Overfishing and Environmental Crises: the Historic Link
Between New England’s Declining Anadromous and Groundfish Fisheries, 1600~1900.
Paper for Penobscot River Restoration Trust. Augusta, Maine.
Walter, R.C. & Merritts, D.J. 2008. Natural Streams and the Legacy of Water-Powered
Mills. Science 319: 299-304.
Walters, A.W., Barnes, R.T. & Post, D.M. 2009. Anadromous alewives (Alosa
pseudoharengus) contribute marine-derived nutrients to coastal stream food webs.
Canadian Journal of Fisheries and Aquatic Sciences 66: 439-448.
Walton, C.J. 1987. Parent-progeny relationship for an established population of
anadromous alewives in a Maine lake. American Fisheries Society Symposium 1: 451-
454.
Wells, W. 1868. The Waterpower of Maine. Reports of the Commissioner and Secretary
of the Hydrographic Survey of 1867. Owen & Nash, Printers to the State, Augusta, Me.
327 pp.
Wells, W. 1869. The Waterpower of Maine. Hydrographic Survey of Maine. Sprague,
Owen & Nash, Printers to the State, Augusta, Me. 526 pp.
Wheeler, G.A. & Wheeler, H.W. 1878. History of Brunswick, Topsham and Harpswell,
Maine, including the ancient territory known as Pejepscot. Alfred Mudge & Son, Boston,
Ma. 959 pp.

129
Whitten, M.M. 1990. The Gunpowder Mills of Maine. Self published, Gorham, ME. 324
pp.
Willis, W. 1831. The History of Portland. Part I. In Collections of the Maine Historical
Society. Vol. I. Pp. 1. Day, Fraser & Co., Portland, Me.
Wilson, D.A. 2001. Logging and Lumbering in Maine. Arcadia Publishing, Charleston
SC, Chicago, Il., Portsmouth, NH, San Francisco, Ca. 128 pp.
Wing, SR & Wing, E. 2001. Prehistorical fisheries in the Caribbean. Coral reefs. 20:1-8.
Wood, W. & Vaughan, A.T., ed. 1977. New England’s Prospect. 1634. University of
Massachusetts Press, Amherst. 132 pp.