Embed Size (px)
Citation preview

1
Increasing Climate Variability and
Livestock Production:The Perfect Storm?
John Gay, DVM PhD DACVPMAssociate Professor of Epidemiology
AAHP Field Disease Investigation UnitWashington State University
ANIM_SCI 280 Animal Science and Society
Current Topics
DamIfINo(but most likely so!)
2
Do humans contribute to global warming?
http://www.pbs.org/wgbh/nova/earth/earth-from-space.html
Do Livestock contribute to global warming?
http://m.beefmagazine.com/cow-calf/15-best-winter-ranch-photos
3
Are you out of your mind?
Two good textbooks covering the science
4
J Houghton V Smil
http://www.vaclavsmil.com/
Two quicker reads covering the science
5
Mark Maslin Vaclav Smil
Energies: An Illustrated Guide to the Biosphere and Civilization
http://www.vaclavsmil.com/
Atmospheric components block wave radiation
6 http://en.wikipedia.org/wiki/Greenhouse_gas
Sunlight In
Infrared Out
The Window
The “Shades”

2
Global Radiation Budget (watts / m2)
7 http://www.ipcc.ch/report/ar5/wg1/ Climate Change 2013: The Physical Science Basis
This radiation physics known for 150 years
The Discovery of Global Warming• Regularly updated on-line
hypertext
• Google ‘Spencer Weart’
8https://www.aip.org/history/climate/index.htm
Major Factors Impacting Energy Flows
9
Atmospheric CO2 level is the primary focus of concern and for mitigation
10
Keeling Curve
https://scripps.ucsd.edu/programs/keelingcurve/
Highest atmospheric CO2 level in 800,000 years and still climbing
11https://scripps.ucsd.edu/programs/keelingcurve/
100
Constructed by analyzing air trapped in glacial ice core bubbles
12 https://en.wikipedia.org/wiki/Ice_core

3
The CO2 change contribution is physically small but critical
13
1750 – 2005 change in radiation forcinghttp://en.wikipedia.org/wiki/IPCC_Fourth_Assessment_Report
We’ve sped up the slow side of the carbon cycle by digging up fossilized sunshine
14 http://www.ipcc.ch/pdf/assessment-report/ar5/wg1/WG1AR5_Chapter06_FINAL.pdf
Coal ‐ Powder River Basin Fort Union Formation
• Paleocene (56‐66M yrs old)
• 1.3M tons per day
Oil & Gas ‐Williston Basin Bakken Shale Formation
• Late Denovian (359‐419M yrs)
• Horizontal drilling with hydraulic fracturing
• 458k barrels per day
Carbon‐based fossil fuels are from ancient CO2
15
https://en.wikipedia.org/wiki/Fort_Union_Formation
Carbon Cycle Detail
16 1:1,200 bottleneck
We are dealing with very complex systems interacting across wide scales including time
Sulfur CyclesWE Schlesinger, ES Bernhardt, 2013
17 http://faculty.yc.edu/ycfaculty/ags105/week12/biogeochemical_cycles_information/
Observed Consequences: Colombia River BasinPrecipitation Trends (1920 – 2000)
WA MT
IDOR
22% median increase in 20th
century
precipitation increase
precipitation decrease
http://journals.ametsoc.org/doi/pdf/10.1175/BAMS-86-1-39 - similar source

4
Colombia River Basin StudyApril 1 Snow Pack (1950 – 2000)
> 30% declineabove 6000 ft in 20th century
Snow pack increase
Snow pack decrease
The Result: The paradox of more winter flooding and more summer drought
How can precipitation increase but snow pack decline? Climate Change
1.5o F temp increase
1920 – 2000
Temperature increase
Temperature decrease
The Lesson: Small changes can have big impacts!
IPCC target – 3.6o F further increase
The biggest climate change impacts are from biological phenology disruptions
Mountain Pine Beetle Impact 2000‐1421
Species sensitivity to climate change
NW species
Case et al. Biological Conservation 187 (2015) 127‐133
• 7% of plants ( 2 of 27)
• 61% of mammals (21 of 35)
• 69% of birds (78 of 113)
• 90% of amphibians (18 of 20)
• Most common reason was a critical habitat change
National Audubon Society survey of 588 North American bird species
• 21% (126) classified as climate endangered (>50% habitat lost by 2050 with no alternatives)
• by 2080, the state bird of 10 states will not be in the state
22 http://journals.plos.org/plosone/article?id=10.1371/journal.pone.0135350
I predict that a “perfect storm” is approaching livestock production
And I may well be sawing my limb off
Warning:My "Crystal" Ball is a
Brunswick
23
Who to trust on social issues and public policy impacting livestock agriculture?
24Vaclav Smilhttp://www.philiplymbery.com/farmageddon-facts/

5
We need science‐based answers on two scales
Broad scale (circle of concern):
• What is “global warming”?– Or is it climate change?
• Is it occurring? How fast?
• What are potential risks from it? How likely are each? When?
• What are societies and their governments doing about these?
• What could they do? Likely to do? When?
Individual scale (circle of influence):
• If it is occurring, how might it impact my operation?
• How likely? When?
• How might customer concerns impact my operation? Social?
• How might it impact my kids?
• What can I do about any of these?
• When?
25
Science (facts) should lead Technology (actions)What level of certainty do we need or should we have before acting?
Everyone has to evaluate themselves for IOED – the “Illusion of Explanatory Depth”
• Spend 10+ minutes explaining to someone the key concepts and their relationships, drawing a causal model
• To identify knowledge gaps, spend 30 minutes drawing a concept map of the topic
Can’t do that, probably not informed
Don’t fall victim to the Dunning‐Kruger Effect
We need people to have an informed opinion
26 http://www.pinterest.com/pin/366550857142554626/
Cigarette!
Emotional perceptiontrumpsrational science
every time
Which are the jackhammers and which are the cigarettes?
Public (consumer) understanding is neither straightforward nor necessarily rational!
http://www.snopes.com/photos/signs/pregnant.asp27
Tipping Point
Flexible Responsive Lower costs
Rigid Bureaucratic Higher costs
Social License
Aligned:
•Values
• Expectations
• Ethics
Self regulation
Social Control
• Gov. Regulation
• Legislation
• Litigation
• AuditingSingle major event or
impacts of cumulative events
Charlie Arnot ‐ The social license vs. control balance“Science tells us if we can do something
Society tells us if we should do it”
28
Center for Food Integrity Why Science Isn’t Enough ‐What consumers need to trust animal agriculture (2012)
http://www.youtube.com/watch?v=L2IqPmO5aHk2014 Consumer Trust Research: Cracking the Code on Food Issues
http://www.fccouncil.com/files/CFI2014%20Research%20Book.pdf
Exploiting our cognitive biases is a profitable media industry
The Outrage Industry
JM Berry & S Sobieraj, 2014
http://ase.tufts.edu/polsci/prospective/OutrageIndustry.pdf
29
“Framing” is repeatedly using the most positive or negative label to “spin” a concept
Conservative – Frank LuntzLiberal – George Lakoff
30

6
We humans naturally perceive things in our scale well but outside our scale poorly
• Human scale – our size, our day, our travel distance
– http://en.wikipedia.org/wiki/Human_scale
• We develop technology to extend our perception to the telescopic, microscopic, in distance, and in time
– Powers of Ten ‐ https://www.youtube.com/watch?v=0fKBhvDjuy0
• Our perception is easily deceived, particularly in un‐natural scales
– Illusion ‐ http://en.wikipedia.org/wiki/Illusion
• Our comprehension of un‐natural scales is poor
– Geologic time scale ‐http://en.wikipedia.org/wiki/Geologic_time_scale
31 32
We automatically construct and evaluate mental models of systems
http://www.donellameadows.org/systems-thinking-resources/
http://www.donellameadows.org/ http://demingcollaboration.com/
W. Edwards Deming quotes:
• Learning is not compulsory . . . neither is survival
• You can’t manage what you don’t measure
• In God we trust; all others bring data
• Whenever there is fear, you will get wrong figures
Overly simplified mental models lead to erroneous ‘tests’ and bad conclusions
33
Livestock 87 – 94 Tg CH4 yr‐1
IPCC Fig 6-02 Everything should be made as simple as possible but not simpler ‐ Einstein
Note Rice
Use empirical data for comparisons, not hunches
34
http://www.pnas.org/content/95/10/5448.full.pdfhttp://www.ingenia.org.uk/Content/ingenia/issues/issue22/Imperial.pdf
Gabrielli von Kármán diagram
Gaining a broader perspective is most important
TerrestrialBiosphere
This biomantleproduces our food!
35
Practical terrestrial biosphere (zone of life) thickness = 0.0005 of earth’s radius
View from Space Shuttle at altitude of 250 miles
Look up; airliners fly at the upper biosphere boundary
Upper biosphere boundary~ 4 – 10 miles uphorizontally the length of Pullman‐Moscow highway!
36
Jetstream altitude is 23,000 to 52,000 feet
Jetstream from Space Shuttle
https://www.youtube.com/watch?v=xF27e59QU44

7
Two excellent books providing perspective
37
Fred Spier David Christian
https://en.wikipedia.org/wiki/Big_History
Life dramatically affected the earth’s history
38
Stage 1 (3.8–2.4 Ga)
No atmospheric O2
Great Oxygenation
Event
~2,500 new of ~4,500 minerals
appeared
Biogeochemistry
Billion years
Cyanobacteria began
photosynthesis
http://en.wikipedia.org/wiki/Great_Oxygenation_Event
T
Agriculture developed during a period of unusual climate stability
http://en.wikipedia.org/wiki/Paleoclimatology39
Historical Earth Temperature
Agriculture began in ~7 places around
world 7-10 K yrs ago
Two components:Mean & Variation
Complex system dynamics are incomprehensible without computer models but modeling is really hard
Big factors driving changeThe Perfect Storm:
• Human Population Expansion
• Fresh Water Scarcity
• Soil Depletion
• Fossil Fuel Scarcity
• Globalization
• Emerging Infectious Agents
• Global Climate Change
• Genetic Diversity Decrease
Tough positive and negative feedback loops with time lags link all of these factors and problem solutions
40
World map adjusted for population
Nature 439, 800 (16 February 2006) http://www-personal.umich.edu/~mejn/cartograms/
http://www.sasi.group.shef.ac.uk/worldmapper/index.html
19%1.38B
Jan 2017 – 7.4 billion – net of 148 every minute
17%1.28B
4%0.33B
4%0.26B
http://en.wikipedia.org/wiki/List_of_countries_by_population
http://www.census.gov/popclock/
3%0.21B
41
47%3.46B
Human population growth rates are highest in LDC’s
http://en.wikipedia.org/wiki/Population_growthhttps://www.cia.gov/library/publications/the‐world‐factbook/rankorder/2002rank.html
Rule of 72: Population doubles in ~72 / (%rate)Zimbabwe ~ 16 years, 3% ~ 24 years
Qatar – 4.9%
1143
42

8
Big Problem: Global energy usage distribution inequity as shown by Earth at Night
43
https://www.nasa.gov/mission_pages/NPP/news/earth-at-night.html
15%
4%
Bill Gate’s Personal Emissions Equation
44https://www.gatesnotes.com/2016-Annual-Letter
• P – number of people in the world
• S ‐ services used per person
• E ‐ energy to provide the service
• C ‐ carbon content of energy source
• CO2 ‐ carbon dioxide (2015 ‐ 36 billion tons)
World per capita CO2 emissions are unequal
http://data.worldbank.org/indicator/EN.ATM.CO2E.PC 2011 datahttps://en.wikipedia.org/wiki/List_of_countries_by_carbon_dioxide_emissions_per_capita
497T1
1232T3
1117T
2279T5
http://www.viewsoftheworld.net/?p=680 Benjamin D. Henning
1713T
4
45
Rank per capita(4.88T) per capita
Country rank
289T12
1217T17
US Energy: Sources to Uses
https://en.wikipedia.org/wiki/Energy_development#/media/File:LLNLUSEnergy2011.png
US EROEI (Energy Return on Energy Invested) Decline
https://en.wikipedia.org/wiki/Energy_returned_on_energy_investedhttp://www.esf.edu/efb/hall/New_Studies_EROI_final4.pdf
http://www.roboticscaucus.org/ENERGYPOLICYCMTEMTGS/Nov2012AGENDA/documents/DFID_Report1_2012_11_04-2.pdf
EROI of Global Energy Resources: Preliminary status and trends
US Energy Consumption (Quads)
1930
US Peak Oil
w/ CO2
scrubbing
“Low Hanging Fruit” at top
5:1
Ethanol
1:1
TarSands
Hydro
Wind
In ~30 years, population will reach 10 billion
World food production must increase by ~50%!
Where will that additional food come from?
U.S Census Bureau International Data Basehttp://www.census.gov/ipc/www/idb/
FAO Food Outlookhttp://www.fao.org/giews/english/fo/index.htm
1o Human Foodstuffs:1. Wheat ( 80%)2. Rice (100%)3. Coarse Grains ( 22%)2016 ?
10 Billion
7 Billion
48
Remember Rice & CH4?
9
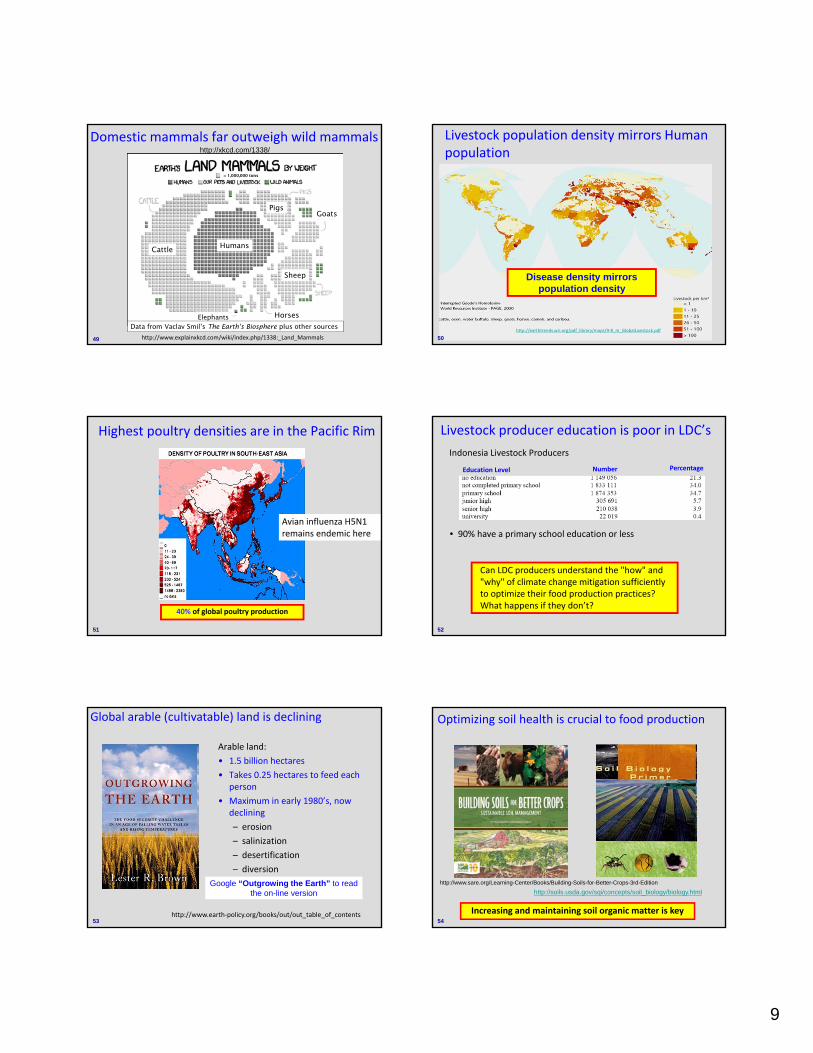
Domestic mammals far outweigh wild mammals
49 http://www.explainxkcd.com/wiki/index.php/1338:_Land_Mammals
Cattle
Horses
Sheep
GoatsPigs
Elephants
Humans
Data from Vaclav Smil’s The Earth’s Biosphere plus other sources
= 1,000,000 tons
http://xkcd.com/1338/
http://earthtrends.wri.org/pdf_library/maps/9‐8_m_GlobalLivestock.pdf
Livestock population density mirrors Human population
Disease density mirrors population density
50
Highest poultry densities are in the Pacific Rim
40% of global poultry production
Avian influenza H5N1 remains endemic here
51
Livestock producer education is poor in LDC’s
Education Level Number Percentage
• 90% have a primary school education or less
Can LDC producers understand the "how" and "why" of climate change mitigation sufficiently to optimize their food production practices? What happens if they don’t?
Indonesia Livestock Producers
52
53
Global arable (cultivatable) land is declining
http://www.earth‐policy.org/books/out/out_table_of_contents
Arable land:
• 1.5 billion hectares
• Takes 0.25 hectares to feed each person
• Maximum in early 1980’s, now declining
– erosion
– salinization
– desertification
– diversion
Google “Outgrowing the Earth” to read the on-line version
http://www.sare.org/Learning-Center/Books/Building-Soils-for-Better-Crops-3rd-Edition
Optimizing soil health is crucial to food production
http://soils.usda.gov/sqi/concepts/soil_biology/biology.html
Increasing and maintaining soil organic matter is key54

10
55
We are currently using arable soil 20 to 100 times faster than natural processes produce it
Crop agriculture is not sustainable without re‐integrating livestock, particularly ruminants
David Montgomery
• Professor of Geomorphology, U Washington http://gis.ess.washington.edu/grg/
• 2008 MacArthur Fellow, $500,000 “genius” award
• Viewing soil as a biological rather than as a chemical system
IMO: The future of livestock agriculture is excellent; how, where and how much we do it will change
Global water situation is tight in some areas
> 75% of flows allocated to agriculture, industry, domestic use
Unmet water needs due to lack of infrastructure (dams, piping)
http://news.bbc.co.uk/2/shared/bsp/hi/pdfs/21_08_06_world_water_week.pdf56
Projected global climate change by season
http://earthobservatory.nasa.gov/Features/GlobalWarming/page6.php
DecJanFeb
JunJulAug
20% precipitation increase
20% precipitation decrease
The dairy cow has the highest per lb water requirement of land mammals
no precipitation change
57
Climate change consequences are already apparent in the Pacific Northwest
• More winter precipitation falling as rain instead of snow
• Increased winter streamflows
• Increased winter flood risks in transient (rain/snow mix) basins
• Reduced snow water storage, particularly in mid‐elevations
• Earlier snow melt and peak runoff (10 to 30 days)
• Decreased late spring and summer streamflows
The Result: The paradox of more winter flooding and more summer drought
58
http://www.ef.org/westcoastclimate/D_PNW%20impacts.pdf
Ogallala‐High Plains Aquifer useful life is declining
http://www.kgs.ku.edu/HighPlains/maps/ofr2005_8_eul_400y_2000_2005.jpg
< 20 yrs
Fillingnow
Average Rainfall
33 inches
12 inches
Higher intensity wx events> More runoff, less recharge
59
Understanding and mitigating climate change effects requires a systems thinking approach
Careful critical thinking that:
• Is based on empirical scientific evidence
• Allows for the occurrence of unintended consequences
• Avoids the “silo effect”
• Avoids “framing”– http://en.wikipedia.org/wiki/Framing_(social_sciences)
• Detects “illusions of explanatory depth” (IOED)
• Includes all the relevant systems
60
http://www.agroecology.org/ http://en.wikipedia.org/wiki/Systems_thinking

11
I predict that the biggest shocks on livestock from climate change will be from disease
IMO: Vector‐borne diseases will provide the nastiest surprises for livestock production
Global climate change
61
Climate change will likely expand many vector‐borne disease ranges
Small climate changes can:
• Markedly shift ranges of tick species
– Ticks are vectors of nasty bovine disease agents
• Markedly alter mosquito populations and their range
• Reduce keystone species, destabilizing vulnerable ecosystems
– Allows proliferation of invasive species
However, due to the many factors involved vector‐borne disease ecology is very complex, making prediction difficult and uncertain!
62
"Prediction is very difficult, especially about the future"
Who said this?
Niels Bohr, Danish physicist
not
Lawrence Peter “Yogi” Berra
Always check your sources!
63
My webpage has materials and links on global climate change and livestock
Google “WSU jmgay”
Index page ‐ http://people.vetmed.wsu.edu/jmgay/courses/
Presentation:
• Increasing Climate Variability and Livestock Production:The Perfect Storm?
proceedings pdf“Identifying Trustworthy Climate Change Information”http://people.vetmed.wsu.edu/jmgay/courses/documents/ClC-IdentifyingTrustworthyClimateChangeInformation.pdf
64
“Let’s be careful out there”
65
Hill Street Blues’s Sergeant Esterhaus’s roll call close (Michael Conrad)
[email protected]://www.vetmed.wsu.edu/courses-jmgay/


![Dynamics of Tipping Cascades on Complex Networkstipping element passes its tipping point, the probability of tipping of a second tipping element is often increased [7], yielding the](https://img.pdfslide.us/doc/110x75/5ecad73c67650774826e54b9/dynamics-of-tipping-cascades-on-complex-networks-tipping-element-passes-its-tipping.jpg)