Embed Size (px)
Citation preview

The Pennsylvania State University
The Graduate School
Department of Engineering Science and Mechanics
DAMAGE TOLERANCE OF LAYER-WISE HYBRID LAMINATES
CONSISTING OF GLASS REINFORCED FLEXIBLE AND
RIGID EPOXY RESINS
A Thesis in
Engineering Mechanics
by
Kirsten Bossenbroek
© 2008 Kirsten Bossenbroek
Submitted in Partial Fulfillment
of the Requirements
for the Degree of
Master of Science
August 2008

ii
The thesis of Kirsten Bossenbroek was reviewed and approved* by the following:
Charles E. Bakis
Distinguished Professor of Engineering Science and Mechanics
Thesis Advisor
Edward C. Smith
Professor of Aerospace Engineering
Clifford J. Lissenden
Associate Professor of Engineering Science and Mechanics
Judith A. Todd
P. B. Breneman Department Head of Engineering Science and Mechanics
Head of the Department of Engineering Science and Mechanics
*Signatures are on file in the Graduate School

iii
ABSTRACT
The objective of this investigation is to develop and characterize co-curing rigid
and flexible epoxies, develop and implement a fabrication process for filament winding
layer-wise hybrid composite structures, and evaluate the effect of including a flexible
matrix composite layer for increasing the damage tolerance of a composite structure.
Rigid composites, which are often found in aerospace structures, tend to be very
brittle and susceptible to damage caused by low velocity impact. This study aims to
investigate the effectiveness of incorporating a flexible matrix composite layer in a
traditional rigid matrix composite laminate. Layer-wise hybrid laminates were fabricated
and quasi-statically indented to simulate low velocity impact. Damage resistance was
evaluated by measuring the delaminated area and evaluating the extent of matrix cracking
through the thickness of the wall. The residual stiffness and strength of the laminates
were measured by testing unindented and indented laminates in axial compression.
It was found that placing a flexible matrix composite, angle-ply layer at a key
interface in the laminate resulted in the highest percent strength retention when compared
to placing the flexible matrix layer at any other location in the laminate or compared to an
all-rigid matrix laminate. The layer-wise hybrid laminate also had the least amount of
intra-ply matrix cracking through the thickness, but did have a larger damaged area
overall.

iv
TABLE OF CONTENTS
List of Figures ............................................................................................................vi
List of Tables .............................................................................................................xii
Acknowledgements ....................................................................................................xiii
Chapter 1 Introduction
1.1Background ...............................................................................................1
1.2 Motivation ................................................................................................2
1.3 Research Objectives .................................................................................3
1.4 Literature Review
1.4.1 Interleaving ...............................................................................4
1.4.2 Layer-wise Hybrid Laminates...................................................7
1.4.3 Test Methods .............................................................................9
1.4.4 Previous Limitations .................................................................9
Chapter 2 Materials and Manufacturing
2.1 Overview ..................................................................................................11
2.2 Development of Flexible Matrix ..............................................................11
2.3 Tube Stacking Sequence and Geometry ..................................................15
2.4 Placement of FMC Layers .......................................................................16
2.5 Filament Winding ....................................................................................18
Chapter 3 Test Methods
3.1 Material Properties
3.1.1 Quasi-static Tests of Neat Resins .............................................23
3.1.2 Quasi-static Tests for Lamina Properties ..................................24
3.2 Quasi-static Indentation ...........................................................................26
3.3 Quasi-static Axial Compression ..............................................................29
v
Chapter 4 Results
4.1 Material Properties
4.1.1 Epoxy Properties .......................................................................32
4.1.2 Lamina Properties .....................................................................34
4.2 Damage Tolerance Results ......................................................................37
4.2.1 Damage Tolerance Results of Five-Ply Tubes..........................39
4.2.2 Damage Tolerance Results of Nine-Ply Tubes .........................48
4.3 Residual Strength Results
4.3.1 Residual Strength Results for Five-Ply Tubes ..........................53
4.3.2 Residual Strength Results for Nine-Ply Tubes .........................75
4.4 Comparison between Laminate Code and Experiments ..........................89
4.5 Summary ..................................................................................................91
Chapter 5 Conclusions and Recommendations .........................................................92
References ..................................................................................................................96
Appendix 1 Flexible and Rigid Epoxy Constituents and Ratios ..............................99
Appendix 2 Pilot Study .............................................................................................101
Appendix 3 Stress-Strain Plots
Neat Epoxy – Elastic Modulus ..........................................................108
Neat Epoxy – Poisson’s Ratio............................................................109
Lamina Properties – Transverse Modulus .........................................110
Lamina Properties – Shear Modulus ..................................................111
Laminate Tubes – Five-Ply Unindented Tubes .................................112
Laminate Tubes – Five-Ply Indented Tubes ......................................113
Laminate Tubes – Nine-Ply Unindented and Indented Tubes ...........114
Appendix 4 Non-Technical Abstract ........................................................................115

vi
LIST OF FIGURES
Figure 2.1: Adverse reaction when polyurethane and epoxy resin are co-cured. .....13
Figure 2.2: Stacking sequence in five- and nine-ply tubes. Shaded layers are the ±2-
degree plies. ...............................................................................................................16
Figure 2.3: Schematic of FMC layer placement in five-ply tubes. Shaded layer is
flexible. ......................................................................................................................17
Figure 2.4: Schematic of FMC layer placement in nine-ply tubes. Shaded layer is
flexible. ......................................................................................................................18
Figure 2.5: Schematic of the filament winding process. ...........................................19
Figure 2.6: Preparation of mandrel for filament winding. ........................................20
Figure 2.7: Springs in location on top of 45 degree inner layer. ..............................20
Figure 2.8: Mandrel with ±2-degree fibers filament wound using springs to control fiber
placement. .................................................................................................................21
Figure 2.9: Part fully wound on mandrel. ..................................................................22
Figure 3.1: Test setup for neat epoxy properties using dogbone specimens. ............24
Figure 3.2: Test setup for lamina properties E2 and G12. ...........................................26
Figure 3.3: Test setup for quasi-static indentation. ....................................................27
Figure 3.4: Force versus displacement for representative five- and nine-ply tubes. .28
Figure 3.5: Steel end caps and Cerrobend low-temperature melting alloy. ...............29
Figure 3.6: Composite tubes potted in Cerrobend and steel end caps. ......................30
Figure 3.7: Axial compression test setup. ..................................................................31
vii
Figure 4.1: Neat epoxy dogbone after failure. ...........................................................34
Figure 4.2: Hoop-wound tubes after failure. ..............................................................35
Figure 4.3: ±45-degree tube during tensile testing. Width of tube was initially uniform.
....................................................................................................................................36
Figure 4.4: Representative indented tube, cut longitudinally. ..................................38
Figure 4.5: Tube wall with no damage with different fiber angle regions labeled. ...39
Figure 4.6: R5 tube after quasi-static indentation with corresponding cross-section.
....................................................................................................................................40
Figure 4.7: R4F1 tube after quasi-static indentation with corresponding cross-section.
....................................................................................................................................41
Figure 4.8: R3F1R1 tube after quasi-static indentation with corresponding cross-section.
....................................................................................................................................42
Figure 4.9: R2F1R2 tube after quasi-static indentation with corresponding cross-section.
....................................................................................................................................43
Figure 4.10: R1F1R3 tube after quasi-static indentation with corresponding cross-section.
....................................................................................................................................44
Figure 4.11: F1R4 tube after quasi-static indentation with corresponding cross-section.
....................................................................................................................................45
Figure 4.12: R9 tube after quasi-static indentation with corresponding cross-section.
....................................................................................................................................49
Figure 4.13: R5P1R3 tube after quasi-static indentation with corresponding cross-section.
....................................................................................................................................50
viii
Figure 4.14: R5F1R3 tube after quasi-static indentation with corresponding cross-section.
....................................................................................................................................51
Figure 4.15: Unindented R5 tubes after axial compression. ......................................53
Figure 4.16: Unindented R4F1 tubes after axial compression. .................................54
Figure 4.17: Unindented R3F1R1 tubes after axial compression. .............................55
Figure 4.18: Unindented R2F1R2 tubes after axial compression. .............................56
Figure 4.19: Unindented R1F1R3 tubes after axial compression. ............................57
Figure 4.20: Unindented F1R4 tubes after axial compression. .................................58
Figure 4.21: Unindented LWH ultimate strength as a percentage of R5 strength. ....59
Figure 4.22: Indented R5 tubes after axial compression. ..........................................60
Figure 4.23: Indented R4F1 tubes after axial compression. .....................................60
Figure 4.24: Indented R3F1R1 tubes after axial compression. .................................61
Figure 4.25: Indented R2F1R2 tubes after axial compression. .................................62
Figure 4.26: Indented R1F1R3 tubes after axial compression. .................................62
Figure 4.27: Indented F1R4 tubes after axial compression. ......................................63
Figure 4.28: CAI strength of tubes as a percent of unindented R5 tubes. .................64
Figure 4.29: Percent strength retention when comparing unindented and indented tubes of
the same type..............................................................................................................67
Figure 4.30: R5 tube cross sections after axial compression: unindented, indented at
indentation, indented away from indentation.............................................................69
Figure 4.31: R4F1 tube cross sections after axial compression: unindented, indented at
indentation, indented away from indentation.............................................................70

ix
Figure 4.32: R3F1R1 tube cross sections after axial compression: unindented, indented at
indentation, indented away from indentation.............................................................71
Figure 4.33: R2F1R2 tube cross sections after axial compression: unindented, indented at
indentation, indented away from indentation.............................................................72
Figure 4.34: R1F1R3 tube cross sections after axial compression: unindented, indented at
indentation, indented away from indentation.............................................................73
Figure 4.35: F1R4 tube cross sections after axial compression: unindented, indented at
indentation, indented away from indentation.............................................................74
Figure 4.36: R9 tubes after axial compression...........................................................76
Figure 4.37: R5P1R3 tubes after axial compression. .................................................76
Figure 4.38 R5F1R3 tubes after axial compression. ..................................................77
Figure 4.39: Strength of Unindented LWH tubes as a percent of unindented R9 tubes.
....................................................................................................................................78
Figure 4.40: Indented R9 tubes after axial compression............................................79
Figure 4.41: Indented R5P1R3 tubes after axial compression. ..................................79
Figure 4.42: Indented R5F1R3 tubes after axial compression. ..................................80
Figure 4.43: CAI strength of tubes as a percent of strength of unindented R9 tubes.
....................................................................................................................................81
Figure 4.44: Percent strength retention when comparing unindented and indented tubes of
the same type..............................................................................................................83
Figure 4.45: R9 tube cross sections after axial compression: unindented, indented at
indentation, indented away from indentation.............................................................85

x
Figure 4.46: R5P1R3 tube cross sections after axial compression: unindented, indented at
indentation, indented away from indentation.............................................................86
Figure 4.47: R5F1R3 tube cross sections after axial compression: unindented, indented at
indentation, indented away from indentation.............................................................88
Figure A2.1: ±15-degree fiber tube after indentation to failure. ................................102
Figure A2.2: Severed fibers cut by interior end supports. .........................................102
Figure A2.3: Excessive deformation of LWH during indentation. ............................103
Figure A2.4: Unindented ±15-degree tube after compression. ..................................104
Figure A2.5: End brooming in an unsupported composite tube. ...............................105
Figure A2.6: Composite tube potted in epoxy with separated inner epoxy disk. ......106
Figure A3.1: Stress versus strain for rigid using strain gages (a) and photos (b). .....108
Figure A3.2: Stress versus strain for partially flexible epoxy using strain gages (a) and
photos (b). ..................................................................................................................108
Figure A3.3: Stress versus strain for flexible epoxy using strain gages (a) and photos (b).
....................................................................................................................................108
Figure A3.4: Transverse strain versus longitudinal strain for rigid epoxy. ...............109
Figure A3.5: Transverse strain versus longitudinal strain for partially flexible epoxy.
....................................................................................................................................109
Figure A3.6: Transverse strain versus longitudinal strain for flexible epoxy............109
Figure A3.7: Stress versus strain for rigid hoop-wound tubes...................................110
Figure A3.8: Stress versus strain for partially flexible hoop-wound tubes................110
Figure A3.9: Stress versus strain for flexible hoop-wound tubes. .............................110
Figure A3.10: Shear stress versus shear strain for rigid angle-ply tubes. ..................111

xi
Figure A3.11: Shear stress versus shear strain for partially flexible angle-ply tubes.
....................................................................................................................................111
Figure A3.12: Shear stress versus shear strain for flexible angle-ply tubes. .............111
Figure A3.13: Stress versus strain for unindented R5 tubes. .....................................112
Figure A3.14: Stress versus strain for unindented R4F1 tubes. .................................112
Figure A3.15: Stress versus strain for unindented R3F1R1 tubes. ............................112
Figure A3.16: Stress versus strain for unindented R2F1R2 tubes. ............................112
Figure A3.17: Stress versus strain for unindented R1F1R3 tubes. ............................112
Figure A3.18: Stress versus strain for unindented F1R4 tubes. .................................112
Figure A3.19: Stress versus strain for indented R5 tubes. .........................................113
Figure A3.20: Stress versus strain for indented R4F1 tubes. .....................................113
Figure A3.21: Stress versus strain for indented R3F1R1 tubes. ................................113
Figure A3.22: Stress versus strain for indented R2F1R2 tubes. ................................113
Figure A3.23: Stress versus strain for indented R1F1R3 tubes. ................................113
Figure A3.24: Stress versus strain for indented F1R4 tubes. .....................................113
Figure A3.25: Stress versus strain for unindented R9 tubes. .....................................114
Figure A3.26: Stress versus strain for indented R9 tubes. .........................................114
Figure A3.27: Stress versus strain for unindented R5P1R3 tubes. ............................114
Figure A3.28: Stress versus strain for indented R5P1R3 tubes. ................................114
Figure A3.29: Stress versus strain for unindented R5F1R3 tubes. ............................114
Figure A3.30: Stress versus strain for indented R5F1R3 tubes. ................................114
xii
LIST OF TABLES
Table 2.1: Tube wall thicknesses [mm] of five-ply tubes. .........................................17
Table 2.2: Tube wall thicknesses [mm] of nine-ply tubes. .......................................18
Table 4.1: Elastic properties of neat epoxy. ...............................................................33
Table 4.2: Lamina properties. ....................................................................................35
Table 4.3: Lamina properties derived from the rule of mixtures. ..............................36
Table 4.4: Length and width of damaged areas from indentation on five-ply tubes.
....................................................................................................................................47
Table 4.5: Indentation force, displacement, and energy per thickness during indentation.
....................................................................................................................................48
Table 4.6: Length and width of damaged areas from indentation on nine-ply tubes.
....................................................................................................................................52
Table 4.7: Modulus and strength of five-ply tubes. ...................................................66
Table 4.8: Modulus and strength of nine-ply tubes. ..................................................82
Table 4.9: Comparison of calculated laminate values to experimental values. .........90
Table A1.1: Epoxy and polyurethane mixture and cure schedule. ............................99
Table A1.2: Epoxy mixtures and cure schedules. ......................................................99
Table A1.3: Polysulfide mixtures and cure schedules. ..............................................99
Table A1.4: Rigid and flexible epoxy mixtures and cure schedules. .........................100

xiii
ACKNOWLEDGEMENTS
I would like to thank my advisor, Dr. Charles Bakis, and my co-advisors, Dr.
Edward Smith and Dr. Kevin Koudela for the opportunity to work on this project and the
guidance and advice I have received along the way. Thanks to Dr. Juska for help with
resin formulations. Also, thanks to the other students working on this project: Pete
Matthews and Sreeni Narayanan, my co-workers in the CMTC who always had the time
to help me, and my friends and fellow grad students in VLRCOE. Finally, I’d like to
thank my parents, Harland and Kathleen Bossenbroek, and John Murphy for their
unending support.
This research was partially funded by the US Government under Agreement No.
W911W6-06-2-0008. The U.S. Government is authorized to reproduce and distribute
reprints notwithstanding any copyright notation thereon. The views and conclusions
contained in this document are those of the author and should not be interpreted as
representing the official policies, either expressed or implied, of the U.S. Government.
Additional funding was provided by the E&F program of the Applied Research
Laboratory at Penn State.

1
Chapter 1
Introduction
1.1 Background
Composite aircraft structures can be damaged by low-velocity blunt impact events
such as hail, bird strikes, tool drops, and “hangar rash” or damage caused while
maneuvering the vehicle inside a hangar. The extent of damage caused by low-velocity
impacts ranges from barely-visible sub-surface damage including matrix cracking and
delamination to visible damage including matrix cracking, fiber breakage, delamination
and permanent deformation. The “damage resistance” of a composite relates to the extent
of these types of damage due to extreme loadings such as impact.
Composite structures that have been damaged by impact tend to fail at lower
loads than comparable structures without impact damage. It has been shown (Cartié and
Irving, 2002) that a higher impact energy translates into a larger delaminated area in the
composite, and furthermore, a reduction in compression after impact (CAI) strength. The
CAI strength of a composite laminate is therefore a measure of the material’s “damage
tolerance”. The aim of this research is to improve the damage resistance and damage
tolerance of composite laminates subjected to out-of-plane local indentation through the
incorporation of flexible matrix composite (FMC) layers within traditional rigid matrix
composite (RMC) layers.

2
1.2 Motivation
The motivation for this investigation stems from the need for advanced rotorcraft
blades capable of lifting extremely heavy payloads and that have more damage tolerance
than current blades. Current materials and design approaches lead to blades that are too
heavy (Zhang and Smith, 2006). One of the main factors leading to excessively heavy
blades is the large knockdown in design strength necessitated by the low CAI strength of
composite laminates. If new materials and design approaches could improve the damage
resistance and damage tolerance of blades, significant weight savings could occur and
repair needs would be minimized. One material approach uses toughened epoxies that
are less brittle; however, these epoxies have lower glass transition temperatures and
lower compressive strengths than rigid epoxies. The concept of interleaving counteracts
these qualities of toughened epoxies by only including thin films or layers of flexible or
toughened material inside rigid epoxy laminates; unfortunately the compressive strength
per unit weight of the laminate is reduced. Another concept involves incorporating fiber
reinforcement into the flexible-epoxy layer thereby creating a layer-wise hybrid (LWH)
laminate. By including fiber reinforcement in all the layers, the compressive strength of
the laminate should improve. Other methods for increasing the damage tolerance and
residual strength of the skin involve including nanotubes, nanofibers, or nanoparticles
such as nanoclays in the composite that will, in theory, increase the amount of fracture
surface and thus energy needed for cracks to grow which will thereby inhibit cracks from
propagating.

3
1.3 Research Objectives
The overall objective of the current investigation is to develop a fabrication
process for LWH laminates that can be incorporated into the fabrication of rotor blade
spars and evaluate the effectiveness of LWH laminates in improving impact damage
tolerance for future application in rotor blade spars. In order to achieve this objective, a
number of preliminary tasks must be completed:
Develop a flexible epoxy that can be used in the filament winding process and is
capable of being co-cured with rigid epoxy,
Characterize flexible and rigid epoxies and composites,
Develop a fabrication process for LWH specimens,
Determine a representative damage tolerance specimen and laminate for the
evaluation of the LWH approach for rotor blade spars,
Quasi-statically indent the various fabricated laminates and evaluate their damage
resistance,
Test unindented and indented laminates in axial compression and evaluate their
strength and stiffness,
Compare experimental stiffnesses of the tested materials to those calculated by
classical laminated plate theory (CLPT).
4
1.4 Literature Review
1.4.1 Interleaving
Rigid matrix composite laminates tend to be very brittle structures due to the
nature of the matrix material. Toughened or flexible matrix materials are less brittle and
more damage tolerant but are also less stiff and can have a lower glass transition
temperature, thereby creating a trade-off between damage tolerance and strength. The
idea of interleaving, or incorporating a thin flexible layer in between rigid layers, allows
the composite to gain the damage tolerance of the flexible epoxy without sacrificing
much strength. However, without fiber reinforcement in the flexible layer, the interlayer
is effectively added weight with little strength benefit.
Numerous studies have been done on the effect interleaving has on damage
resistance and damage tolerance. Lu et al. (1995) investigated the effect of interleaving
when a carbon/epoxy prepreg laminate of 30 unidirectional tapes was interleaved mid-
laminate with three thin, polyethylene-co-acrylic acid (PEAA) films and subjected to
drop-weight impact and a laminate of 24 tapes and two PEAA films was subjected to
static flexure. It was found that interleaving increased the impact penetration energy of
the laminate and also changed the failure mode from compressive to tensile fracture. The
static flexure tests demonstrated that the PEAA film inhibited cracks from propagating
through the thickness.
5
Gandhe and Griffin (1989) also evaluated interleaved laminates. In this case,
unidirectional carbon/epoxy prepreg was interleaved with a thermoplastic interleaf film at
every layer, and the [(0/90)4]S laminate was subjected to drop-weight impact. Damage
resistance was evaluated by comparing the size of delaminations of regular and
interleaved laminates. It was observed that interleaved laminates had smaller
delaminations. Laminates were also subjected to tension and compression after impact
testing. The tension after impact tests showed an increase in strength in the interleaved
laminates, but the compression after impact tests were inconclusive.
Further compression after impact (CAI) testing was done by Xuefeng et al. (2002)
and Yi et al. (2004). In the first study, carbon/epoxy prepreg was made by wet filament
winding unidirectional laminates that were then assembled into laminates with a [45/0/-
45/90]2S stacking sequence; polyether ketone with a phenolphthalein group (PEK-C) thin
films of varying thickness were periodically inserted throughout the laminate. Tensile,
compressive, and flexure moduli as well as tensile, compressive, flexure, and shear
strengths were evaluated. It was found that the interleaved laminates had a slightly
higher compressive strength and modulus, but the other test results were mixed. In the
second study, unidirectional graphite fiber/epoxy prepreg was interleaved with PEK-C by
spraying a dissolved solution of it onto various layers; the stacking sequence was given as
[45/0/-45/90]2S. Placing eight interleafs in between the plies on the back face increased
the CAI strength more than placing the same eight interleafs in between plies on the
impact face; placing eight interleafs in between the central plies increased the CAI
strength even more. Placing 16 interleafs in between all plies resulted in the highest CAI

6
strength. It was also determined that increasing the thickness of the interleaf increased
the CAI strength. In addition to increasing the CAI strength, increasing the number and
thickness of the interleafs also reduced the size of delamination as determined through
ultrasonic c-scan inspection.
Duarte et al. (1999) tested multiple interleaf materials with various perforations to
determine what if any effect they had on impact resistance and damage tolerance.
Carbon/epoxy prepreg tape laminates [45/0/-45/90]2S were interleaved at the interface
between different fiber angles with the following interleaf materials: a thermofusible
polyolefin film as a solid film, perforated, and in open net form, a thermofusible
copolyamide web, and a polyetherimide film. The laminates were subjected to drop
weight impacts followed by ultrasonic c-scan inspection, sectioning, and CAI testing.
The size of the delaminations and CAI strength were used to evaluate the interleaf
materials. It was found that the laminates with lower modulus polyolefin interleafs had
smaller delaminations and lower CAI strength than non-interleaved laminates. The
laminate with the polyetherimide interleaf, with a higher modulus, had smaller
delaminations and higher CAI strength that the non-interleaved laminates.
Chen and Jang (1991) investigated non-woven graphite/epoxy prepreg interleaved
with elastomers mixed with epoxy resins using the double cantilever beam test, end-
notched flexure test, and impact fatigue test. Elastomers used in the flexible layers were
either carboxyl-terminated butadiene acrylonitrile (CTBN) liquid reactive rubber or
polyurethane (PU). It was found that the damage tolerance, determined by the number of

7
impacts before fracture or drop in load, of the laminates increased when interleafs were
included. Also, GIc and GIIc were greater in the interleaved laminate than the non-
interleaved laminate.
1.4.2 Layer-wise Hybrid Laminates
Layer-wise hybrid (LWH) laminates build on the idea of interleaved composites
by adding fibers to the flexible interleaf layers. By adding fiber reinforcement to the
flexible layer, the strength per unit weight of the laminate is expected to increase.
Morii et al. (1995) tested chopped E-glass fiber mats reinforced with rigid
bisphenol-A epoxy resins and a glycol acrylate modified epoxy resin with increased
toughness and flexibility by evaluating the energy absorption when the laminates were
subjected to quasi-static indentation and drop weight impact. It was found that placing
FMC layers on the impact face greatly increased the amount of energy absorbed during
impact when compared to all-rigid laminates.
Sohn et al. (2000) and Walker et al. (2002) added layers of Kevlar whiskers,
Zylon whiskers, PEAA film, or polyamide adhesive (PA) web to a carbon fiber/epoxy
prepreg cross-ply laminate. The laminates were subjected to drop weight impacts of
various energies. Impact energy and the size and extent of delaminations were used in
evaluating the laminates. Some of the laminates were then tested in compression. It was
found that both the interleaved and short fiber reinforced laminates had less damage than
the control laminate, and that the short fiber reinforced laminates had less local and
8
global damage than the interleaved laminate. Also, the residual strength of the
interleaved laminate was lower than the control and short fiber reinforced laminates.
Yuan et al. (1997) tested carbon fiber/epoxy unidirectional prepreg wound into
tubes and interleaved with a modified epoxy reinforced with a poly ethylene terephthalate
(PET) fiber mat and subjected to axial crash loading. The stacking sequences of the tubes
were [(0)5/(90)5/(0)5], [(0)2/(±45)2/(90)2], and [(0)/(±45)7/(0)]. The tubes were evaluated
by comparing the amount of energy absorbed during the loading, and it was found that
the hybrid tubes absorbed more energy than tubes without additional reinforcement.
Other studies have investigated incorporating lower modulus fibers and carbon
fiber tissue to improve damage tolerance and residual strength. Takemura et al. (2001)
placed unidirectional low modulus carbon fiber/epoxy on the side of a unidirectional
carbon fiber/epoxy laminate that would be in compression during a drop-weight impact.
It was found that the impact resistance of the laminate increased due to the higher
compressive strain to failure of the low modulus fiber. Lee et al. (2003) used a non-
woven carbon tissue prepreg interleaf in a carbon fiber prepreg cross-ply laminate that
was subjected to quasi-static indentation. Energy absorbed and the size of the
delaminated area were used to evaluate the hybrid laminate. It was found that the hybrid
laminate had a smaller delaminated area than the laminate without the carbon fiber tissue.

9
1.4.3 Test Methods
Many possible tests could be used to evaluate the damage resistance and damage
tolerance of composite laminates (Masters, 1989). Two possible methods are to damage
the laminate using drop weight impact and then either test the impacted laminate in
compression to determine the residual strength or ultrasonically scan the laminate or
section the laminate to determine the extent and distribution of damage in the laminate.
In this investigation, the composite laminates were quasi-statically indented
roughly following the test method in ASTM D6264. Laminate specimens were not flat
plates as specified, rather closed-cross section structures, and in this case, tubes were
tested. Also, the stacking sequence was modified from the standard to be more
representative of a typical rotor blade spar. Damage resistance was evaluated by
measuring the area of delamination as well as examining the extent of the damage in the
form of matrix cracking, fiber breakage, and delaminations through the thickness of the
laminate at the site of indentation. The test method in ASTM D 7137 was followed when
determining the residual strength of tubes that had been quasi-statically indented.
1.4.4 Previous Limitations
Much research has been done with the goal of improving the damage resistance
and damage tolerance of composite laminates. Much of the research involving
interleafed laminates and some of the research involving layer-wise hybrid laminates
showed promise toward improving damage resistance and damage tolerance. However,
previous studies used different fibers, epoxy systems, stacking sequences, and very

10
importantly, different fabrication methods. The current investigation aims to apply the
general understanding of interleaving and layer-wise hybrid laminates to one very
specific application. The goal of improving a rotor blade design drove the geometry and
stacking sequence of the test specimens. The test specimens were filament wound, so the
materials used needed to have specific attributes and the ability to co-cure. Also, a
specific threat (low-velocity impact damage) and load case (compression) based on the
typical design drivers identified in previous work (Zhang and Smith, 2006), determined
the tests that would be used to evaluate the materials and laminates.

11
Chapter 2
Materials and Manufacturing
2.1 Overview
Filament winding was chosen as the preferred method of fabrication because it
was representative of the fabrication process used for making rotor blades. Furthermore,
wet-winding, or winding with dry fiber pulled through a bath of liquid resin, allows for
either the fiber or the resin to be swapped out and replaced with ease. Filament winding
allows for myriad cross-sectional shapes and fiber angles in structures. Different
mandrels are used depending on the desired shape; for example, circular cross section
mandrels are used to produce tubes, while rounded rectangular cross-section mandrels are
used to wind flat plates. Tubes were chosen for this investigation because they are a
relatively easy shape to wind and are also similar in shape to a rotor blade spar.
Additionally, the closed-cross section shape allows for CAI testing with minimal
interaction between the laminate and the test fixture. When using flat plate laminates, the
plates must be supported on the sides, and it is possible that the edge supports can initiate
failure.
2.2 Development of a Flexible Matrix
In order to make FMCs and LWH laminates, a flexible epoxy system that could
be incorporated into the established fabrication process for rotor blades and that was co-

12
cure compatible with rigid epoxy systems had to be developed first. The first attempt at
mixing known flexible and rigid systems involved mixing flexible polyurethane and rigid
epoxy. The constituents were mixed separately: Adiprene® L100 prepolymer with
Caytur® 21 curative and Dow® D.E.R. 383 bisphenol-A epoxy resin with Huntsman®
Jeffamine® T403 amine curative, and then poured into a container and placed in an oven
for two hours at 80°C then three hours at 125°C. The epoxy, poured in after the
polyurethane, had a higher density and attempted to displace the polyurethane and also
bubbled excessively, leaving huge cavities in itself and also at the interface with the
polyurethane. The polyurethane was filled with much smaller bubbles approximately
0.05 mm in diameter. The interface between the two components, where in contact with
one another, was very weak and could be pulled apart. A cross section of the mixture is
shown in Figure 2.1. The mix ratios used for the epoxy and polyurethane are listed in
Appendix 1 in Table A1.1.

13
Epoxy
Polyurethane
Figure 2.1: Adverse reaction when polyurethane and epoxy resin are co-cured.
The next set of trials involved various combinations of HexionTM
EponTM
8132
bisphenol-A epoxy and 58003 elastomer modified adduct, Huntsman® Jeffamine® T403
and D2000 amine curatives, and HexionTM
EpikureTM
3140 and 3164 polyamine
curatives. Some combinations were more rigid than others; all of the combinations were
able to co-cure. The epoxies were cast into dogbone specimens and were also used to
filament wind rings using S-2 Glass® fibers. The dogbone specimens were flexed by
hand to determine the approximate flexibility of the epoxies. Filament winding small
parts with the epoxies demonstrated that the epoxies had sufficiently low viscosity to be
used in the filament winding process and could co-cure with other epoxies in a composite
structure. These mixes, although co-cure compatible and amenable to the filament
winding process, were initially perceived to be too rigid and were discarded. The exact

14
ratios and epoxies used are listed as formulations B through G in Appendix 1 in Table
A1.2.
The next attempt at a flexible epoxy used Morton-Thiokol LP-3 polysulfide with
HexionTM
EponTM
8132, PACM 20 curing agent, Jeffamine T403 curing agent, DMP-30
(dimethylaminomethyl phenol) epoxy accelerator, and TMPTA (trimethylolpropane
triacrylate) a trifunctional monomer. This mixture required adding the components in a
specific order after specific intervals of time. Initially, the epoxy was very flexible, and
thin specimens could be bent by hand and then slowly return to their initial shape. It was
found, however, that after a few days the epoxy would continue to cure and harden to the
point that it could still bend, but would then tear where the edges had become brittle.
Filament winding or co-curing the polysulfide epoxy with a rigid epoxy was not
attempted. The exact ratios used in these mixtures are given as formulations H and I in
Appendix 1 in Table A1.3.
Finally, a flexible epoxy system containing the same base constituents as the rigid
epoxy system was formulated. Using the same base constituents simplified the
fabrication process and effectively guaranteed the different epoxies would co-cure. The
flexible epoxy used HexionTM
EponTM
8132 and Huntsman Jeffamine® T403, the rigid
epoxy components, with varying amounts of HexionTM
EponTM
58034, an epoxy
modified elastomer adduct. Initial testing used equal parts EponTM
8132 and EponTM
58034, resulting in a very flexible epoxy. Subsequent flexible epoxies used 2:1 and 4:1
ratios of 8132 to 58034. The aforementioned epoxies were used in filament winding and

15
all of the flexible epoxies were found to co-cure with the rigid epoxy. A complete list of
mix ratios is given as formulations J through N in Appendix 1 in Table A1.4. The rigid
(R) epoxy was made using formulation N, the partially flexible (P) epoxy was made
using formulation M, and the flexible (F) epoxy was made using formulation L.
2.3 Tube Stacking Sequence and Geometry
The stacking sequence of the tubes was based on a heavy-lift rotor blade design
done by Zhang and Smith (2006). The ratio and number of 0-degree and ±45-degree
plies varied along the length of the spar, so the mid-span cross-section was taken as an
adequate representation of ply angles found in a typical rotor blade spar. At the mid-spar
location, the ratio of zero-degree plies to angle plies was nearly 50:50 with a stacking
sequence of [(±45)2/(0)30/(±45)33]. In a rotor blade spar, the 0-degree plies are for
bending stiffness while the ±45-degree plies are for torsional stiffness. The development
of this design is documented in Appendix 2.
Two types of tubes were made by filament winding: five-ply tubes and nine-ply
tubes. The stacking sequence of both tubes had an inner ±45-degree layer followed by an
equal number of ±2-degree plies and ±45-degree plies. The ±2-degree plies were used
instead of 0-degree plies to simplify the winding process. The stacking sequence of the
five-ply tubes was [(±45)1/(±2)2/(±45)2], and the stacking sequence of the nine-ply tubes
was [(±45)1/(±2)4/(±45)4]. A schematic of this stacking sequence is shown in Figure 2.2.
The ±2-degree plies are shaded.

16
Figure 2.2: Schematic of stacking sequence of five- and nine-ply tubes. Shaded layers
are the ±2-degree plies.
Five-ply specimens were cut to 70-mm lengths and nine-ply specimens were cut
to 75-mm lengths. Five-ply tubes were, on average, 2.26-mm thick while nine-ply tubes
were, on average, 3.55-mm thick.
2.4 Placement of FMC Layers
In the five-ply tubes, the FMC layer was evaluated in every ply location. In the
nine-ply tubes, only one ply location was replaced with FMC. To record results, each
specimen was assigned a type and number. The type indicates how many plies the part
has as well as the location of any flexible layers; the number denotes different tubes of
the same type. For example, the R5 tube is a five-ply tube that has five rigid plies while
the R3F1R1 tube is also a five-ply tube but has three rigid plies, one flexible ply, and one
rigid ply, in that order from inside to outside. A schematic of the FMC placement in the
five-ply tubes is shown in Figure 2.3 and wall thicknesses for each tube are listed in
[±45/(±2)2/(±45)2] [±45/(±2)4/(±45)4]

17
Table 2.1. An example of a nine-ply tube is R5F1R3 which has five rigid plies, one
flexible ply, then three rigid plies. A schematic of the FMC layer placement in the nine-
ply tubes is shown in Figure 2.4, and wall thicknesses for each tube are listed in Table
2.2.
Figure 2.3: Schematic of FMC layer placement in five-ply tubes. Shaded layer is flexible.
Table 2.1 Tube wall thicknesses [mm] of five-ply tubes.
R5 R4F1 R3F1R1 R2F1R2 R1F1R3 F1R4
Unin
den
ted
1 2.44 2.24 2.39 2.24 2.26 2.25
2 2.47 2.29 2.32 2.20 2.22 2.18
3 2.37 2.24 2.32 2.27 2.27 2.12
Inden
ted
4 2.41 2.33 2.34 2.17 2.30 2.13
5 2.48 2.47 2.30 2.16 2.27 2.11
6 2.44 2.33 2.39 2.14 2.32 2.20
7 2.51 2.32 2.46 2.17 2.29 2.17
R5 R4F1 R3F1R1 R2F1R2 R1F1R3 F1R4

18
Figure 2.4: Schematic of FMC layer placement in nine-ply tubes. Shaded layer is
flexible.
Table 2.2: Tube wall thicknesses [mm] of nine-ply tubes.
R9 R5P1R3 R5F1R3
Unin
den
ted
1 3.80 3.75 3.72
2 3.80 3.61 3.58
3 3.73 3.56 3.53
Inden
ted
4 3.71 3.51 3.56
5 3.68 3.57 3.56
6 3.77 3.56 3.65
7 3.84 3.58 3.60
2.5 Filament Winding
Owens Corning S-2 Glass® fiber 449AA-750, denoting the sizing and yards per
pound, was selected as a representative glass fiber that is suitable for rotor blade spars.
The filament winding process begins with a spool of fiber on a fiber tensioner as seen in
Figure 2.5. The tensioner actively pulls away from the filament winder in order to keep a
constant tension on the fibers. The fiber travels through the tension feed-back sensor and
on to the resin bath. In the room temperature bath, the fiber is soaked in resin and exits
R9 R5P1R3 R5F1R3

19
the bath through an orifice 0.787 mm in diameter resulting in a wet fiber volume fraction
of 55%. The fiber then travels to the carriage of the filament winder. The lateral motion
of the carriage deposits the fiber onto the mandrel at a specific angle by passing over it at
a velocity relative to the angular velocity of the mandrel.
Figure 2.5: Schematic of the filament winding process.
The mandrel used to filament wind the composite tubes is 50.8 mm in diameter,
813 mm long, and made of 6-mm thick aluminum. The mandrel was cleaned with
acetone before each new part was wound onto it. The mandrel was then covered with
Silicone Mold Release (Huron Technologies, Inc.) spray so that the cured part was easy
to remove. Double-sided foam tape, 25-mm wide, was wrapped around each end of the
mandrel just shy of the domed end caps as this was where the coil springs would need to
be held during winding. Coil springs of 65-mm free length were wrapped around the
ends of the mandrel shaft before winding to make for easier implementation after the
inner layer of ±45-degree fibers is wound. A picture of this setup is shown in Figure 2.6.

20
Foam tape
Mandrel
Spring
Figure 2.6: Preparation of mandrel for filament winding.
The inner ±45-degree layer was wound covering the foam tape. After that layer
was wound, the coil springs that were previously linked around each end were moved
onto the taped area of the mandrel. The fibers wrapped around the end caps were
removed. The tape prevented the spring from sliding or rolling off the end of the mandrel
while winding. This stage is shown in Figure 2.7.
±45-degree fibers Spring
Figure 2.7: Springs in location on top of ±45-degree inner layer.
21
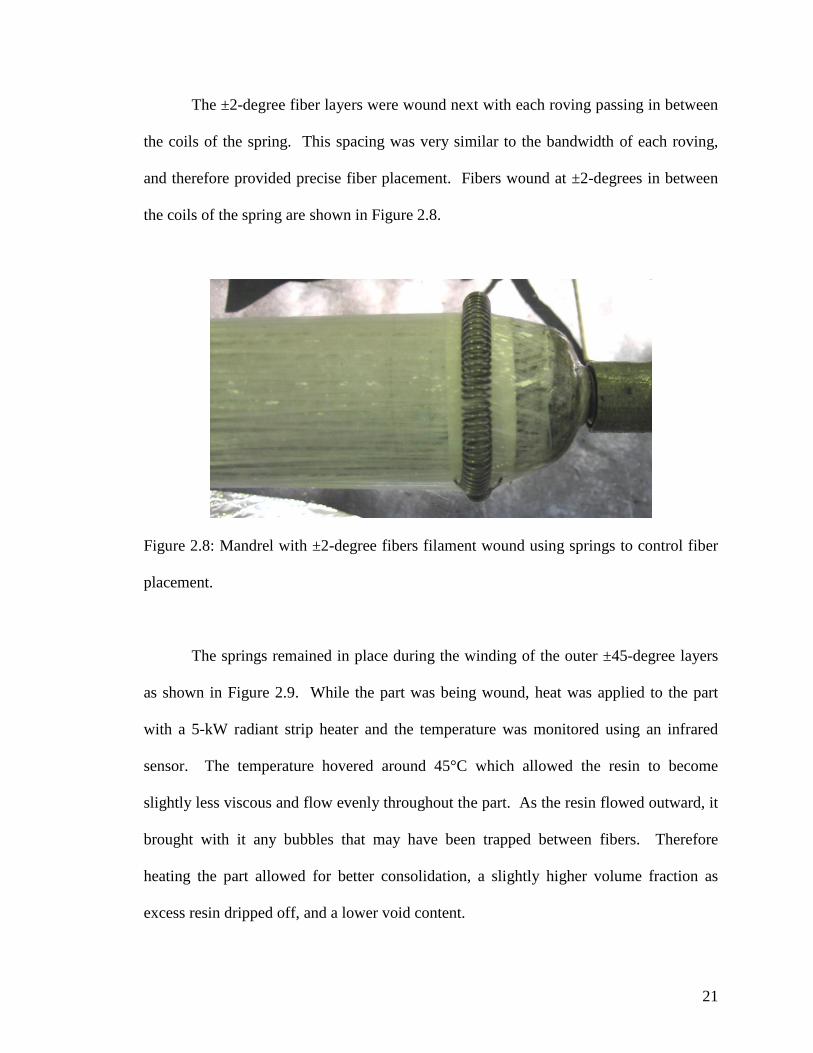
The ±2-degree fiber layers were wound next with each roving passing in between
the coils of the spring. This spacing was very similar to the bandwidth of each roving,
and therefore provided precise fiber placement. Fibers wound at ±2-degrees in between
the coils of the spring are shown in Figure 2.8.
Figure 2.8: Mandrel with ±2-degree fibers filament wound using springs to control fiber
placement.
The springs remained in place during the winding of the outer ±45-degree layers
as shown in Figure 2.9. While the part was being wound, heat was applied to the part
with a 5-kW radiant strip heater and the temperature was monitored using an infrared
sensor. The temperature hovered around 45°C which allowed the resin to become
slightly less viscous and flow evenly throughout the part. As the resin flowed outward, it
brought with it any bubbles that may have been trapped between fibers. Therefore
heating the part allowed for better consolidation, a slightly higher volume fraction as
excess resin dripped off, and a lower void content.

22
Figure 2.9: Part fully wound on mandrel.
Excess fiber around the domed end caps was removed as soon as winding was
completed. Hi-Shrink Tape, 25-mm wide, (Dunstone Company, Inc.) was wrapped
around the final part before it was placed in the oven; unrestrained, the tape shrinks 20%
in length when heated to 80°C. The part was cured for 2 hours at 80°C and then 3 hours
at 125°C. The part was allowed to cool and the shrink tape was removed. The springs
and excess material were then removed from the ends of the tube. The roughly 600-mm-
long tube was then removed from the mandrel and cut into various lengths for testing.

23
Chapter 3
Test Methods
3.1 Material Properties
3.1.1 Quasi-static Tests of Neat Resins
Dogbone-shaped specimens were cast of each type of resin: rigid (R), partially
flexible (P), and flexible (F). The specimens were 25.5 cm in length and approximately
13 x 13 mm in cross-section. Grids were traced onto one side of each dogbone so that
strains could be measured from photos taken at high loads. One longitudinal and one
transverse linear strain gage type CEA-06-125UN-120 (Measurements Group, Raleigh,
NC) were attached to two other sides. This allowed for the elastic modulus, Em, as well
as the Poisson’s ratio, νm, of the neat epoxy to be measured; chord values were calculated
for both using values at 2000 and 6000 longitudinal microstrain. The ultimate strength,
σult, and strain to failure, εf, were obtained from the recorded load and longitudinal strain
at failure. Complete stress-strain and transverse strain-longitudinal strain curves for the
neat epoxies are included in Appendix 3.
The specimens were tested in an MTS 810 test frame with an 89-kN load cell and
18-kN load range using displacement control at the constant rate of 0.15 mm/s. Abrasive
mesh was wrapped around the ends of the dogbones, and dogbones were held in the test

24
frame using hydraulic wedge grips. Load, displacement, transverse strain, and
longitudinal strain were recorded with LabView data acquisition software. In addition,
photos were taken periodically in order to calculate displacements after the strain gages
had exceeded their limits. Results are shown in Appendix 3. The test setup is shown in
Figure 3.1.
Specimen
Strain Gages
Voltmeter (Load)
Figure 3.1: Test setup for neat epoxy properties using dogbone specimens.
3.1.2 Quasi-static Tests for Lamina Properties
Lamina properties, E2, G12, and F2T were found by testing hoop-wound and angle-
ply tubes. The procedures for testing the ±45-degree tubes and the 90-degree tubes were

25
based on the test methods described in ASTM D 3518 and ASTM D 5450. Filament
wound ±45-degree tubes replaced ±45-degree flat plates in ASTM D 3518 and the
filament wound 90-degree tubes used were much smaller in diameter than the tubes
specified in ASTM D 5450. Tubes had a 20 mm inner diameter and had a wall thickness
of approximately 0.8 mm. The tubes were cut to 133-mm lengths and potted into test
fixtures using the two-part fast-drying epoxy cement mixture, Loctite Epoxy Weld
(Henkel, Avon, OH). The potted ends were then clamped into an MTS 810 load frame
with an 89-kN load cell and 18-kN load range where two 25.4-mm extensometers were
affixed on either side of the tube. Each tube was then pulled axially until failure. The
tests were displacement controlled, and the cross-head moved at the constant rate of
0.015 mm/s when testing 90-degree tubes and 0.038 mm/s when testing ±45-degree
tubes. Load and displacement from the two extensometers were recorded using LabView
data acquisition software. The strains calculated from each extensometer were averaged.
Shear strain in the ±45-degree tubes was calculated using γxy = εx - εy, and εy was
calculated iteratively using εx, νxy, and G12. The values at 2000 and 6000 shear
microstrain were used to calculate the chord shear modulus. The hoop wound tubes did
not have as high strain to failure as the angle ply tubes, so chord values were taken over
the greatest linear part of the graph of stress versus longitudinal strain possible. The test
setup used is pictured in Figure 3.2.

26
Extensometers Composite Tube
Figure 3.2: Test setup for lamina properties E2 and G12.
Other lamina properties such as the major Poisson’s ratio, ν12, and the elastic
modulus, E1, were found using the rule of mixtures. The fiber volume fraction was
assumed to be approximately 55% based on the size of the orifice used in the resin bath
during filament winding (i.e. negligible change in Vf from drip-off).
3.2 Quasi-static Indentation
A stainless steel hemispherical tipped 12.7-mm diameter rod was bolted to a
Tinius Olsen 270-kN load frame and was lowered by displacement control at a rate of
0.635 mm/min. to indent the tubes. The test setup for quasi-static indentation is shown in
Figure 3.3.
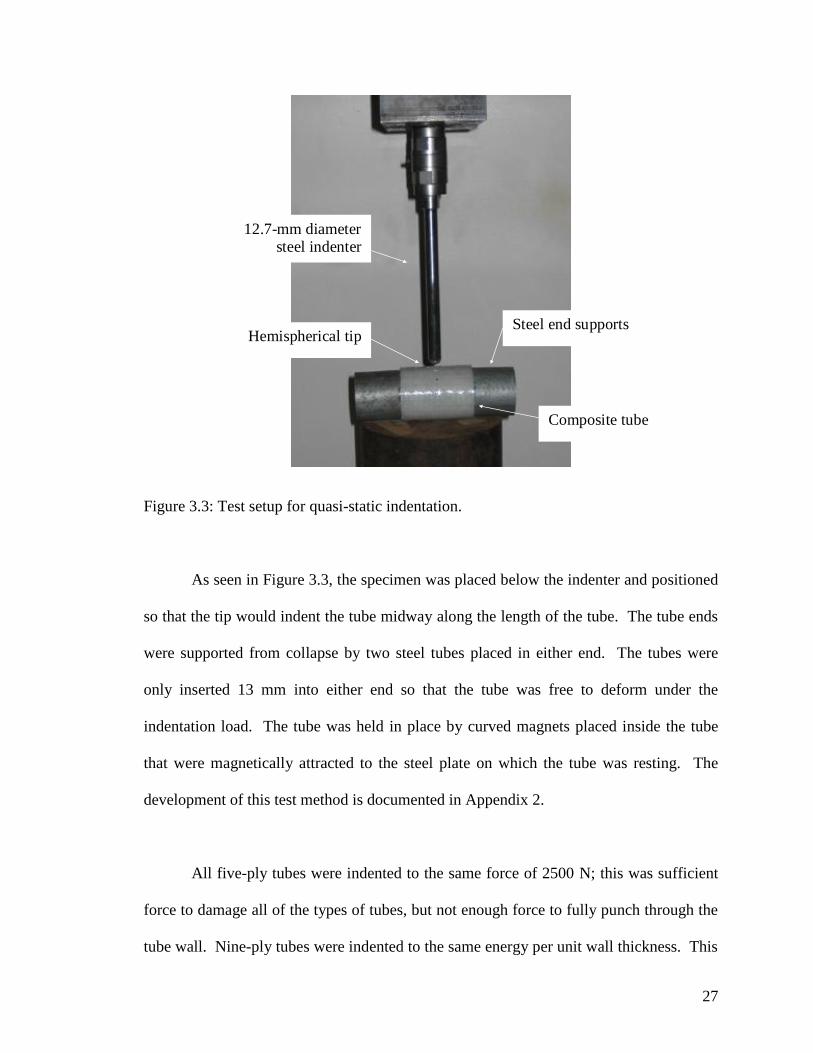
27
12.7-mm diameter steel indenter
Hemispherical tip Steel end supports
Composite tube
Figure 3.3: Test setup for quasi-static indentation.
As seen in Figure 3.3, the specimen was placed below the indenter and positioned
so that the tip would indent the tube midway along the length of the tube. The tube ends
were supported from collapse by two steel tubes placed in either end. The tubes were
only inserted 13 mm into either end so that the tube was free to deform under the
indentation load. The tube was held in place by curved magnets placed inside the tube
that were magnetically attracted to the steel plate on which the tube was resting. The
development of this test method is documented in Appendix 2.
All five-ply tubes were indented to the same force of 2500 N; this was sufficient
force to damage all of the types of tubes, but not enough force to fully punch through the
tube wall. Nine-ply tubes were indented to the same energy per unit wall thickness. This

28
energy was determined by indenting a five-ply laminate to 2500 N while recording the
crosshead displacement; the energy was calculated by integrating the force over the
displacement using the trapezoidal rule in LabView. From this integration, the energy
per unit thickness was calculated and the energy needed to indent the nine-ply laminates
was determined. This value was approximately 2.050 J/mm. Force versus displacement
during indentation is shown in Figure 3.4.
5-ply
9-ply
0
1000
2000
3000
4000
0 0.001 0.002 0.003 0.004 0.005
Displacement (m)
Fo
rce
(N
)
Figure 3.4: Force versus displacement during indentation for representative five- and
nine-ply tubes.

29
3.3 Quasi-static Axial Compression
To prevent end-brooming during axial compression tests, the tube ends were
potted in steel end caps. For the five-ply tubes the steel end caps were machined with
5.28-mm wide, 3.175-mm deep square bottomed grooves recessed into one face. The ID
and OD of the groove were 43.6 mm and 54.15 mm, respectively. The steel end caps
were later re-machined to accommodate thicker specimens. The outer diameter of the
groove was increased from 54.15 to 58.22 mm and the depth was increased from 3.175 to
5.715 mm. This re-machining aimed to maintain the same distance between the tube and
the groove-wall and the same ratio of wall thickness to groove depth as in the end caps
for the five-ply tubes. These grooves were then filled with a low-melt bismuth alloy,
Cerrobend (Bolton Metal Products), which melts at 70°C. The steel end caps and brick
of Cerrobend are shown in Figure 3.5.
Figure 3.5: Steel end caps and Cerrobend low-temperature melting alloy.
The Cerrobend was melted using a hot plate heated to 80°C for approximately 20
minutes at which point it could be poured into the grooves in the steel end caps. When
cooled to room temperature, the metal alloy expands three percent by volume, effectively

30
clamping onto the ends of the composite tubes resulting in clamped-clamped boundary
conditions. Composite tubes potted in the steel end caps using Cerrobend are pictured in
Figure 3.6.
Figure 3.6: Composite tubes potted in Cerrobend and steel end caps.
Potted tubes were tested under axial compression using a Tinius Olsen 270-kN
load frame. The constant crosshead rate was approximately 0.625 mm/min. The load
and crosshead displacement were recorded. The crosshead displacement was measured
using a 12.7-mm potentiometer. A hemispherical bearing was placed below the potted
specimen to remove any bending that may be caused by misaligned end caps. A picture
of the test setup is shown in Figure 3.7. The development of this test method is
documented in Appendix 2.

31
Potentiometer
Hemispherical Bearing
Potentiometer Depressor
Potted Tube
Figure 3.7: Axial compression test setup.

32
Chapter 4
Results
4.1 Material Properties
4.1.1 Epoxy Properties
The results from tensile testing of neat epoxy dogbones are shown in
Table 4.1. The elastic modulus, Em, of the P-epoxy was 41.2% of the R-epoxy modulus,
and the modulus of the F-epoxy was 41.4% of the P-epoxy modulus. The Poisson’s ratio,
νm, of the flexible epoxy is greater than that of the rigid epoxy, but the Poisson’s ratio of
the partially flexible epoxy is considerably lower than both the rigid and flexible epoxy.
The chord modulus and Poisson’s ratio were calculated using the values at 2000 and 6000
με. The ultimate strength of the R-epoxy was the greatest followed by the P-epoxy and
the F-epoxy, and the strain to failure was greatest for the F-epoxy followed by the P-
epoxy and R-epoxy. Some of the strain to failure values, denoted by an asterisk, were not
available because the longitudinal strain gage was either in excess of its usable range or
was not well connected to the lead wires. The displacement of the crosshead is noted
instead. All neat epoxy dogbones broke cleanly across the specimen approximately mid-
way between the grips. A picture of a representative failure is shown in Figure 4.1.
Stress-strain curves are shown in Appendix 3.

33
Table 4.1: Elastic properties of neat epoxy.
Em [GPa] νm σult [MPa] εult [1000με ]
Rigid (R) {cm}
R_1 2.51 0.44 39.3 * {1.22}
R_2 2.48 0.38 41.0 21.0 {0.78}
R_3 1.85 0.40 39.1 18.6 {0.61}
Average (CV%) 2.28 (16) 0.41 (7) 39.8 (2.64) 19.8 (8.48)
Partially Flexible (P)
P_1 0.901 0.28 17.2 * {4.98}
P_2 0.949 0.38 15.6 * {7.28}
P_3 0.969 0.32 16.3 * {8.00}
Average 0.940 (4) 0.33 (17) 16.4 (4.80)
Flexible (F)
F_1 0.302 0.33 6.06 * {5.65}
F_2 0.367 0.49 7.51 * {13.18}
F_3 0.499 0.44 9.63 * {11.39}
Average 0.389 (26) 0.42 (20) 6.79 (15.1)
* Strain to failure data not available; crosshead displacement in is given in curly brackets.

34
Figure 4.1. Neat epoxy dogbone after failure.
4.1.2 Lamina Properties
The transverse modulus, E2, and shear modulus, G12, which were found using
tensile tests described in Section 3.1.2 are shown in Table 4.2. As expected, the
transverse modulus decreased along with the decrease in Em. The transverse modulus of
the P-epoxy lamina was 37.8% that of the R-epoxy lamina, and the transverse modulus of
the F-epoxy lamina was 63.8% that of the P-epoxy lamina. The shear moduli of the P-
and F-epoxy laminas were approximately one fifth the value of the R-epoxy lamina.
Hoop-wound tubes failed when the matrix would crack along the fiber angles; many of
the failures occurred near the end fixtures. A picture of this is shown in Figure 4.2. The

35
±45-degree tubes would elongate and eventually pull out of the end caps, so no failure
values could be calculated. A picture of an elongated FMC tube is shown in Figure 4.3.
Table 4.2: Lamina properties.
E2 [GPa] F2T [MPa] G12 [GPa]
Rigid (R)
R_1 14.8 16.0 3.47
R_2 18.0 23.7 3.48
R_3 19.8 32.5 3.36
Average (CV %) 17.5 (2.5) 24.1 (34) 3.44 (1.9)
Partially Flexible (P)
P_1 6.85 11.1 0.739
P_2 6.33 15.6 1.03
P_3 6.66 11.0 1.11
Average 6.61 (0.3) 12.6 (20) 0.960 (20)
Flexible (F)
F_1 3.64 10.8 1.04
F_2 4.23 11.1 0.698
F_3 4.79 8.46 0.865
Average 4.22 (0.6) 10.1 (14) 0.869 (20)
Failure
Figure 4.2: Hoop-wound tubes after failure.

36
Figure 4.3: ±45-degree tube during tensile testing. Width of tube was initially uniform.
Properties in Table 4.3 were found using the rule of mixtures. The modulus and
Poisson’s ratio used for S-glass were 86 GPa and 0.23 (Daniel, 2006). The values used
for the modulus and Poisson’s ratio for the matrix were taken from Table 4.1. The fiber
volume fraction, or percent of the composite that was fiber, was assumed to be 55%
based on the orifice used during filament winding and the observation of negligible drip-
off.
Table 4.3 Lamina properties derived from the rule of mixtures
E1 [GPa] ν12
Rigid 48.3 0.31
Partially Flexible 47.7 0.28
Flexible 47.5 0.32

37
4.2 Damage Resistance Results
Damage resistance was evaluated in two ways; one of which was by measuring
the length and width of the damaged area caused by quasi-static indentation. Damage in
these tubes consisted of delaminations, matrix cracking, surface whitening, and, in some
cases, fiber breakage. The extent of the damage was determined by shining a bright light
at the back face, or inside, of the tubes. Damaged areas appeared darker than the
surrounding laminate due to the presence of cracks and delaminations that tend to block
light more so than undamaged fiberglass composite. The damaged regions were outlined
with a black solid line to enhance their visibility.
The other way in which damage tolerance was evaluated was by inspecting the
damage through the thickness of the tube wall. To do this, representative unindented and
indented tubes were cut in half longitudinally using a water-cooled circular saw with a
diamond blade. The cut surfaces were then polished using increasingly fine sandpaper up
to 600-grit. The tubes were then inspected using a stereomicroscope and micrographs
were captured of the damaged regions.
Figure 4.4 shows a representative five-ply tube after it had been cut longitudinally
through the indentation site. The extent of the damaged region is denoted by the solid
black line. The area of interest for the micrographs lies on the face of the cut surface in
between the black lines. The micrograph in Figure 4.5 shows an undamaged section of a
nine-ply tube. The different fiber angle regions are noted in the picture and are easier to
see in the thicker tube. This picture shows a tube with no damage from indentation, so

38
undamaged ±45-degree plies are typically a uniform gray and undamaged ±20-degree
plies are white. Intra-laminar matrix cracking in damaged tubes appears as whitening in
these layers while delaminations tend to appear as darker lateral cracks. All micrographs
are oriented so that the outside of the tube is at the top of the picture and the inside of the
tube is at the bottom. For micrographs showing damage from indentation, the tip of the
hemispherical indenter would be oriented perpendicular to the top surface of the tube in
the micrograph.
Section of tube wall shown in micrographs
Figure 4.4: Representative indented tube, cut longitudinally.

39
±±4455--ddeeggrreeee ffiibbeerrss
±±22--ddeeggrreeee ffiibbeerrss
±±4455--ddeeggrreeee ffiibbeerrss
Figure 4.5: Tube wall with no damage with different fiber angle regions labeled.
4.2.1 Damage Resistance Results of Five-Ply Tubes
Figure 4.6 shows an all rigid, R5, tube and the micrograph of its cross section.
The extent of damage, and therefore, dimensions of the area enclosed by the black solid
lines was the smallest of any five-ply tubes. The average width of all three R5 specimens
was 18.8 mm and the average length was 34.3 mm. The shape of the region, of this tube
and all LWH tubes, is defined by the angle of the fibers in the laminate; the left and right
boundaries are marked by ±2-degree fibers while the top and bottom boundaries are
marked by ±45-degree fibers. This also shows that delaminations and matrix cracking
can propagate along the directions of the fibers more easily than normal to the fibers. In
the micrograph, permanent deformation of the tube wall can be seen as the laminate is
curved downward in the middle at the site of the indentation. Also, white lines,
indicating matrix cracking can be seen in the ±45-degree layers, radiating out and
downward from the top surface, and in the ±2-degree layers traveling along the fiber
direction.

40
Figure 4.6: R5 tube after quasi-static indentation with corresponding cross-section.
1 mm

41
Figure 4.7 shows the indented R4F1 tube and the cross section of the indented
area. The damaged region on the R4F1 tube was slightly larger than the R5 tube with an
average width and length of 26.2 mm and 37.9 mm, respectively. In the R4F1 tube, the
FMC layer, in this case, the more flexible of the two FMC resins, is the outermost ply. In
the micrograph, there is slightly less matrix cracking in the top layer of the laminate.
Cracks are still forming, however, in the lower, rigid layers. The cracks follow the same
pattern seen in the R5 tube with cracks radiating out and downward from the site of
indentation in the rigid ±45-degree layer and longitudinal cracks in the ±2-degree layers.
Also, there is less permanent deformation, or curving, of the laminate at the site of
indentation in relation to R5.
Figure 4.7: R4F1 tube after quasi-static indentation with corresponding cross-section.
1 mm

42
The R3F1R1 tube and cross section are shown in Figure 4.8. The length and
width of the damaged area is again larger than the R5 tube and also larger than the R4F1
tube. The average width and length are 22.0 mm and 39.4 mm, respectively. In the
micrograph, there is noticeably less matrix cracking in the top ±45-degree layers.
However, there is still some damage in the ±2-degree fiber layers.
Figure 4.8: R3F1R1 tube after quasi-static indentation with corresponding cross-section.
1 mm
43
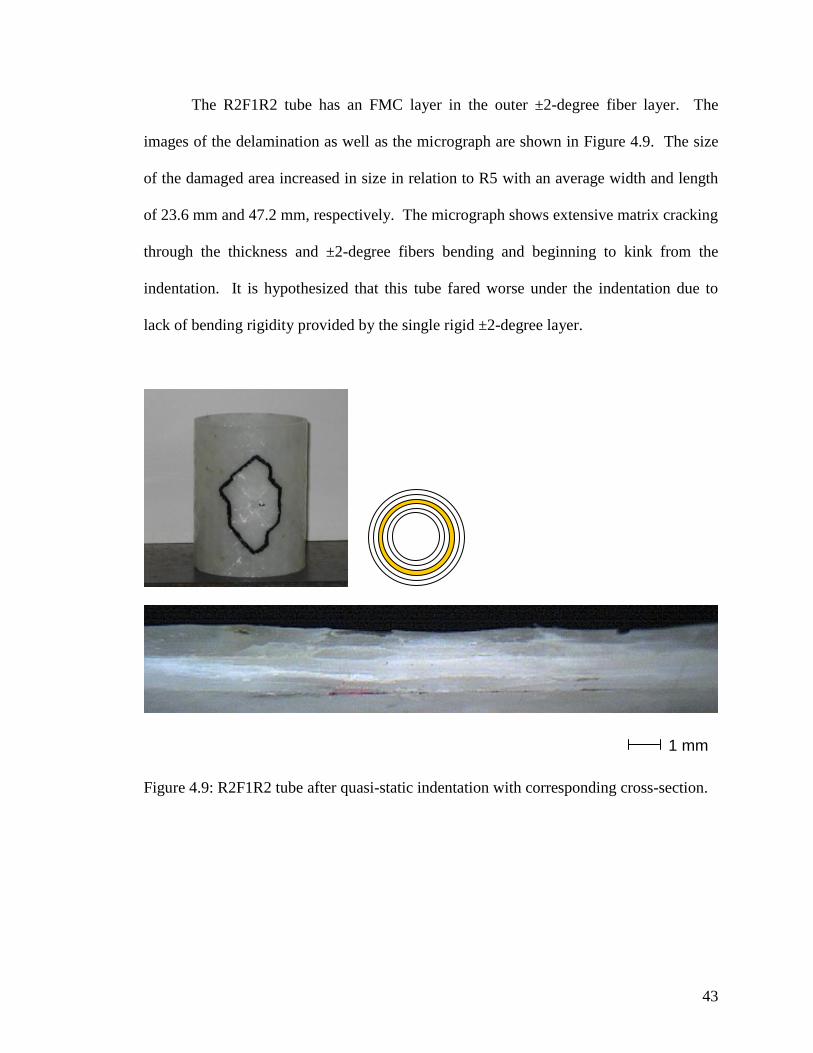
The R2F1R2 tube has an FMC layer in the outer ±2-degree fiber layer. The
images of the delamination as well as the micrograph are shown in Figure 4.9. The size
of the damaged area increased in size in relation to R5 with an average width and length
of 23.6 mm and 47.2 mm, respectively. The micrograph shows extensive matrix cracking
through the thickness and ±2-degree fibers bending and beginning to kink from the
indentation. It is hypothesized that this tube fared worse under the indentation due to
lack of bending rigidity provided by the single rigid ±2-degree layer.
Figure 4.9: R2F1R2 tube after quasi-static indentation with corresponding cross-section.
1 mm

44
The R1F1R3 tube and cross section are shown in Figure 4.10. Again, one of the
±2-degree fiber layers, in this case, the lower, innermost ±2-degree fiber layer was FMC.
The size of the damaged area was larger but similar in size to the R2F1R2 tube which
also had a single FMC ±2-degree layer. The width and length were 22.9 mm and 40.7
mm, respectively. Matrix cracking is visible through the thickness in the micrograph, but
is less severe than the R2F1R2 tube.
Figure 4.10: R1F1R3 tube after quasi-static indentation with corresponding cross-section.
1 mm

45
The indented F1R4 tube is shown in Figure 4.11. These tubes, on average had the
largest damage region, with areas measuring 29.8 mm in width and 55.6 mm in length.
The micrograph shows matrix cracking in the outer layers as well as permanent
deformation of the tube wall. It is hypothesized that placing the FMC layer on the back
face greatly reduced the bending stiffness of the laminate, allowing it to flex more under
the load and therefore sustain greater damage. The FMC layer on the back face also did
not prevent intralaminar cracks from forming in the laminate and propagating through the
thickness.
Figure 4.11: F1R4 tube after quasi-static indentation with corresponding cross-section.
1 mm

46
There did not appear to be any fiber fracture caused by indentation, just intra-
laminar matrix cracking. The amount of matrix cracking was dependent on the location
of the FMC layer with the R3F1R1 tube having the least amount of damage through the
thickness. It was observed that tubes containing an FMC layer flexed more than the R5
tube, and furthermore, tubes containing an FMC-±2-degree layer flexed more than tubes
containing an FMC-±45-degree layer. It was hypothesized that the additional flexure
resulted in additional damage in the laminates. In addition, all LWH laminates had larger
damaged regions; the measurements of length and width of the damaged regions of the
five-ply tubes are shown in Table 4.4.

47
Table 4.4: Length and width of damaged areas from indentation of five-ply
tubes.
Length [mm] Width [mm]
R5
1 31.4 19.6
2 32.7 21.6
3 35.0 17.9
4 38.0 15.9
Average (CV%) 34.3 (5.3) 18.8 (9.8)
R4F1
1 37.5 15.3
2 36.3 19.1
3 39.4 22.9
4 38.5 23.5
Average (CV%) 37.9 (4.1) 20.2 (19)
R3F1R1
1 39.5 24.4
2 39.2 19.5
3 40.7 22.3
4 38.3 21.9
Average (CV%) 39.4 (2.1) 22.0 (11)
R2F1R2
1 47.7 23.6
2 49.3 23.3
3 46.5 21.2
4 45.4 26.4
Average (CV%) 47.2 (2.9) 23.6 (5.6)
R1F1R3
1 41.8 22.8
2 38.9 22.0
3 41.9 20.6
4 40.2 26.2
Average (CV%) 40.7 (4.2) 22.9 (5.0)
F1R4
1 55.5 30.1
2 69.9 29.2
3 43.1 31.5
4 54.0 28.5
Average (CV%) 55.6 (24.1) 29.8 (3.9)
48
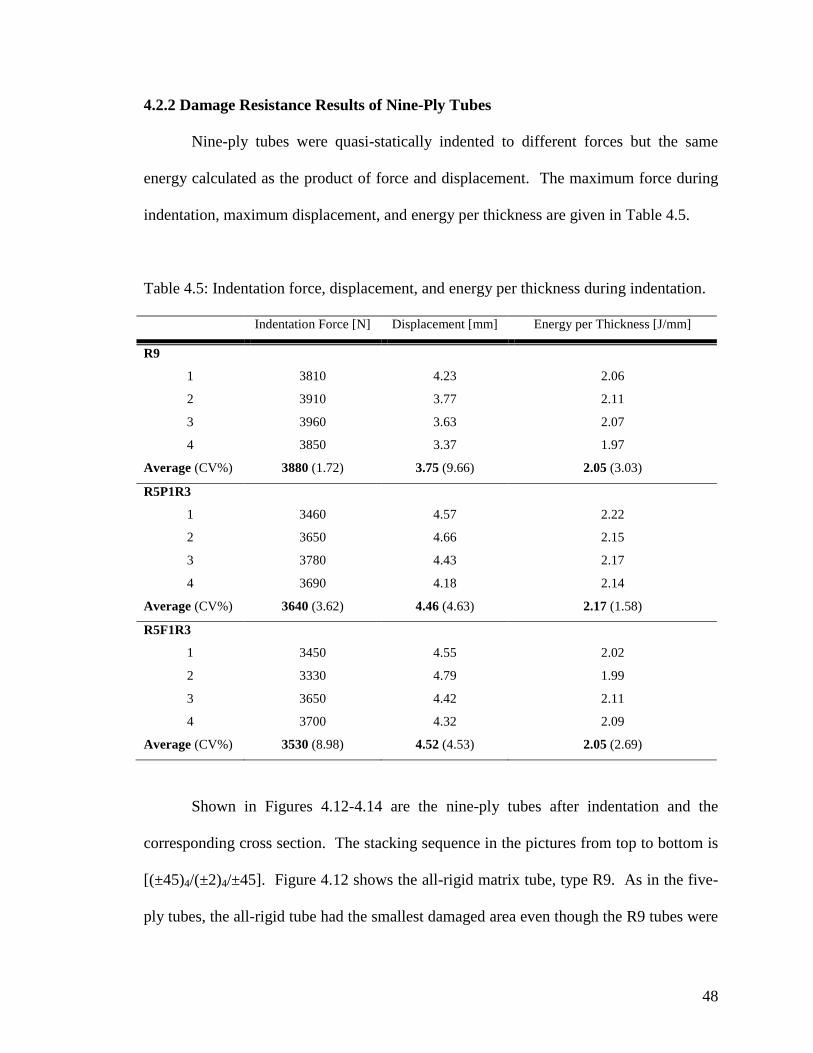
4.2.2 Damage Resistance Results of Nine-Ply Tubes
Nine-ply tubes were quasi-statically indented to different forces but the same
energy calculated as the product of force and displacement. The maximum force during
indentation, maximum displacement, and energy per thickness are given in Table 4.5.
Table 4.5: Indentation force, displacement, and energy per thickness during indentation.
Indentation Force [N] Displacement [mm] Energy per Thickness [J/mm]
R9
1 3810 4.23 2.06
2 3910 3.77 2.11
3 3960 3.63 2.07
4 3850 3.37 1.97
Average (CV%) 3880 (1.72) 3.75 (9.66) 2.05 (3.03)
R5P1R3
1 3460 4.57 2.22
2 3650 4.66 2.15
3 3780 4.43 2.17
4 3690 4.18 2.14
Average (CV%) 3640 (3.62) 4.46 (4.63) 2.17 (1.58)
R5F1R3
1 3450 4.55 2.02
2 3330 4.79 1.99
3 3650 4.42 2.11
4 3700 4.32 2.09
Average (CV%) 3530 (8.98) 4.52 (4.53) 2.05 (2.69)
Shown in Figures 4.12-4.14 are the nine-ply tubes after indentation and the
corresponding cross section. The stacking sequence in the pictures from top to bottom is
[(±45)4/(±2)4/±45]. Figure 4.12 shows the all-rigid matrix tube, type R9. As in the five-
ply tubes, the all-rigid tube had the smallest damaged area even though the R9 tubes were
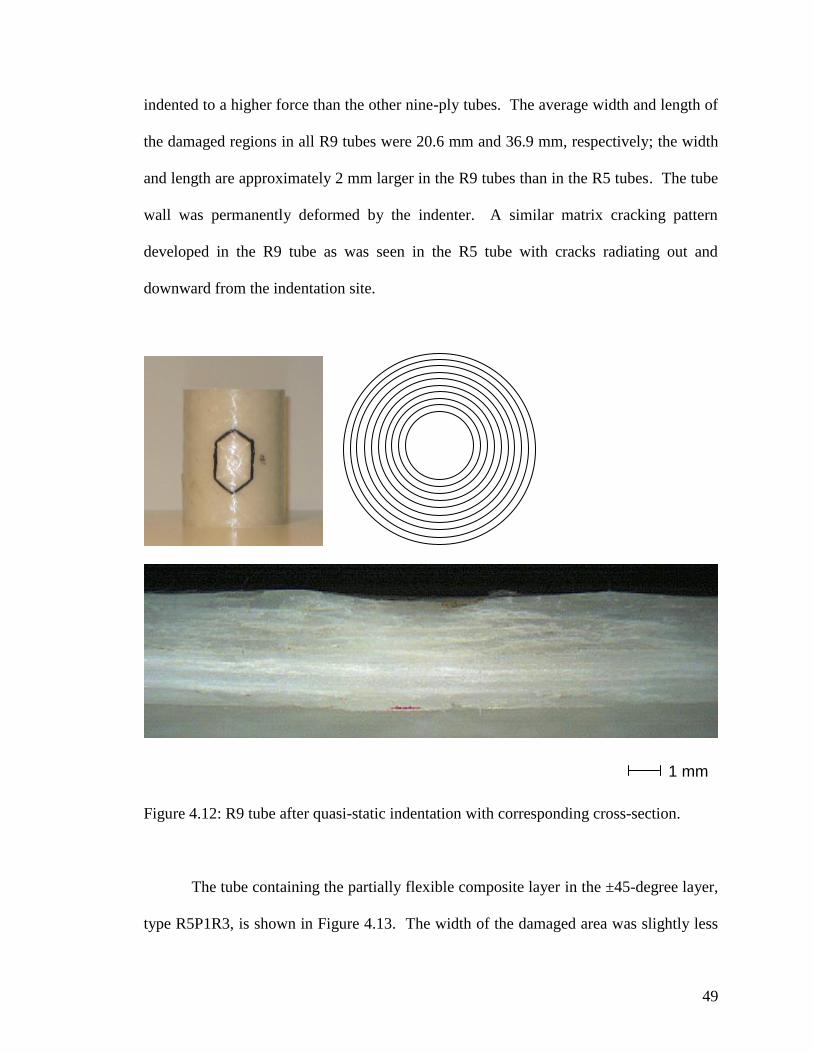
49
indented to a higher force than the other nine-ply tubes. The average width and length of
the damaged regions in all R9 tubes were 20.6 mm and 36.9 mm, respectively; the width
and length are approximately 2 mm larger in the R9 tubes than in the R5 tubes. The tube
wall was permanently deformed by the indenter. A similar matrix cracking pattern
developed in the R9 tube as was seen in the R5 tube with cracks radiating out and
downward from the indentation site.
Figure 4.12: R9 tube after quasi-static indentation with corresponding cross-section.
The tube containing the partially flexible composite layer in the ±45-degree layer,
type R5P1R3, is shown in Figure 4.13. The width of the damaged area was slightly less
1 mm

50
than that of the R9 tube, but the length was longer. The average width and length were
22.0 mm and 36.0 mm, respectively. Permanent deformation at the site of indentation is
again visible. Very faint cracks in the matrix are visible in the outer ±45-degree layers.
Figure 4.13: R5P1R3 tube after quasi-static indentation with corresponding cross-section.
Tube R5F1R3 is shown in Figure 4.14. The damaged area was the largest of all
the nine-ply tubes even though the indentation force was the lowest of the three. The
average width and length were 22.7 mm and 38.2 mm, respectively. Matrix cracking can
be seen in the ±45-degree layers as well as the ±2-degree layers but less cracking than the
R9 tube.
1 mm

51
Figure 4.14: R5F1R3 tube after quasi-static indentation with corresponding cross-section.
Table 4.6 summarizes the damage dimensions for all nine-ply tubes. As
mentioned previously, the nine-ply tubes were each indented to the same energy per unit
wall thickness. Due to the more flexible LWH tube walls deflecting more during
indentation, the same energy per thickness was attained at a lower load. The average
width of the damaged areas still increased even with decreasing load with the R9 tube
having the smallest width. The length of the damaged area was the smallest in the
R5P1R3 tubes followed very closely by the R9 tubes; the R5F1R3 tubes had considerably
longer lengths.
1 mm

52
Table 4.6: Length and width of damaged areas from indentation of nine-ply tubes.
Length [mm] Width [mm]
R9 (CV%)
1 37.5 21.1
2 38.4 20.3
3 37.9 20.4
4 33.9 20.7
Average (CV%) 36.9 (1.2) 20.6 (2.0)
R5P1R3
1 33.5 22.6
2 37.4 22.1
3 37.6 22.2
4 35.4 21.1
Average (CV%) 36.0 (6.4) 22.0 (1.1)
R5F1R3
1 40.8 23.4
2 38.2 21.3
3 35.7 24.0
4 38.1 22.0
Average (CV%) 38.2 (6.7) 22.7 (6.3)

53
4.3 Residual Strength Results
4.3.1 Residual Strength Results for Five-Ply Tubes
Unindented five-ply, [(±45)/(±2)2/(±45)2], R5 tubes after axial compression
failure are shown in Figure 4.15. Red dashed lines indicate the approximate region in
which damage occurred. A bright light was shone at the inside of the tube making the
damaged regions appear darker. The damage included in these regions included matrix
cracking, fiber breakage, and delaminations. Fiber breakage can be seen as a bulging,
white line snaking around the middle of the tube. Some tubes had larger delaminated
areas emanating from the site of fiber breakage. All failures occurred in the middle of the
tube with minimal interaction with the end caps. Typical tubes had damage spread
around three-quarters of the circumference.
Figure 4.15: Unindented R5 tubes after axial compression.

54
Unindented R4F1 tubes after compressive failure are shown in Figure 4.16. The
damaged area on these tubes was considerably smaller than the R5 tubes, and this can be
attributed to the lower load that caused failure and therefore lower energy in the system at
failure.
Figure 4.16: Unindented R4F1 tubes after axial compression.

55
Unindented R3F1R1 tubes are shown in Figure 4.17. The size of the damaged
areas is larger in the R3F1R1 tubes than the R4F1 tubes, and this can be attributed to a
higher load at failure. All of the R3F1R1 tubes had large delaminated regions
surrounding the site of fiber breakage.
Figure 4.17: Unindented R3F1R1 tubes after axial compression.
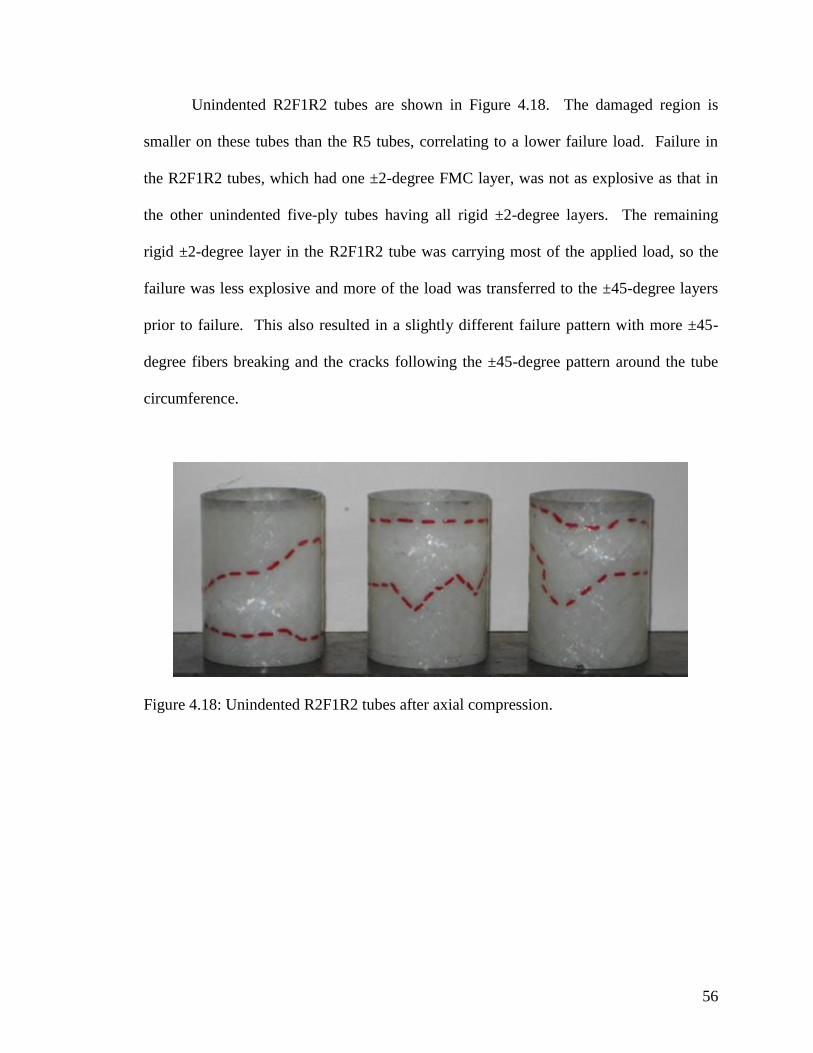
56
Unindented R2F1R2 tubes are shown in Figure 4.18. The damaged region is
smaller on these tubes than the R5 tubes, correlating to a lower failure load. Failure in
the R2F1R2 tubes, which had one ±2-degree FMC layer, was not as explosive as that in
the other unindented five-ply tubes having all rigid ±2-degree layers. The remaining
rigid ±2-degree layer in the R2F1R2 tube was carrying most of the applied load, so the
failure was less explosive and more of the load was transferred to the ±45-degree layers
prior to failure. This also resulted in a slightly different failure pattern with more ±45-
degree fibers breaking and the cracks following the ±45-degree pattern around the tube
circumference.
Figure 4.18: Unindented R2F1R2 tubes after axial compression.

57
Unindented R1F1R3 tubes are shown in Figure 4.19. Although these tubes also
had one FMC ±2-degree layer, they failed at a higher load than the R2F1R2 tubes. This
resulted in a larger delaminated area, but the delaminated area still followed the ±45-
degree fiber lines, indicating once again a more prominent role of the off-axis plies in the
ultimate failure process when one of the ±2-degree layers consists of FMC material.
Figure 4.19: Unindented R1F1R3 tubes after axial compression.

58
Unindented F1R4 tubes are shown in Figure 4.20. These tubes failed at lower
loads and therefore, in general, had smaller delaminated areas. The failure pattern
returned to the ±2-degree fibers breaking and following a straighter line around the
circumference of the tubes.
Figure 4.20: Unindented F1R4 tubes after axial compression.
The average strengths of each type unindented tube shown as a percent of the
average strength of the R5 tubes are shown in Figure 4.21. All LWH tubes, containing
20% FMC, failed at lower loads than the all rigid R5 tubes. The R2F1R2 tubes failed at
the lowest load followed by the F1R4 tubes. The R4F1 tubes and R1F1R3 tubes had the
highest strength next to the R5 tubes. Numerical strength and stiffness values are given
in Table 4.7 on page 66; stress-strain curves are included in Appendix 3.

59
0
20
40
60
80
100
R5 R4F1 R3F1R1 R2F1R2 R1F1R3 F1R4
Figure 4.21: Unindented LWH ultimate strength as a percentage of R5 strength.
Indented R5 tubes after quasi-static axial compression are shown in Figure 4.22.
The damage caused by quasi-static indentation is enclosed by a black solid line while the
damage caused by failure under compression is enclosed by red, dashed lines. The
indented tubes fail in the same mode as the unindented tubes: the ±2-degree fibers buckle
towards the inside of the tube, taking the inner ±45-degree layer with them. The buckled
±2-degree fibers also pull away from the outer ±45-degree fibers creating a large
delaminated area. The failure of the ±2-degree fibers initiated at the site of indentation
where there already existed intralaminar matrix cracking and delamination. The extent of
the damage from compression also appears to be constrained to the same length of the
pre-existing damage.

60
Figure 4.22: Indented R5 tubes after axial compression.
Indented R4F1 tubes after axial compression are shown in Figure 4.23. Again,
the failure initiated at the site of indentation and did not spread outside the length of the
pre-existing damage.
Figure 4.23: Indented R4F1 tubes after axial compression.

61
Figure 4.24 shows indented R3F1R1 tubes after axial compression. The damage
created from failure was slightly larger than damage seen on the R5 and R4F1 tubes.
Figure 4.24: Indented R3F1R1 tubes after axial compression.
Figure 4.25 shows indented R2F1R2 tubes after axial compression. These tubes
had one FMC ±2-degree layer, rendering them less stiff in compression. As seen in the
unindented R2F1R2 tubes, fiber breakage of the ±2-degree fibers followed the ±45-
degree lines instead of maintaining a straighter line traveling around the circumference of
the tube. It is therefore plausible that more of the load was transferred to the ±45-degree
fibers in comparison to the tubes with all ±2-degree plies made of RMC. The height of
the delaminated area was relatively narrow, corresponding to a lower load at failure, but
the path of damage traveled farther circumferentially than the damage caused from
indentation.

62
Figure 4.25: Indented R2F1R2 tubes after axial compression.
Indented R1F1R3 tubes after axial compression are shown in Figure 4.26. These
tubes also had one FMC ±2-degree layer, but the FMC layer was closer to the inside and
therefore the failure mode regarding the path of the ±2-degree fibers breaking more
closely resembled the failure mode of other LWH tubes with ±45-degree FMC layers,
that is, it traveled in a straight line around the middle of the tube. The delaminated area
still followed the lines of the ±45-degree fibers.
Figure 4.26: Indented R1F1R3 tubes after axial compression.

63
Indented F1R4 tubes after axial compression are shown in Figure 4.27. These
tubes had the largest damaged regions from indentation with one tube delaminating the
entire length of tube. The delaminations caused by compression were shorter in height,
corresponding to a lower load at failure.
Figure 4.27: Indented F1R4 tubes after axial compression.
Figure 4.28 shows the strength of the indented tubes as a percentage of the
strength of the unindented R5 tube. The R2F1R2 tubes failed at the lowest load followed
by the F1R4 tubes just as was the case in the unindeted tubes. The R5 tubes still had the
highest strength of the indented tubes followed by the R1F1R3 tubes.

64
0
20
40
60
80
100
R5 R4F1 R3F1R1 R2F1R2 R1F1R3 F1R4
Figure 4.28: CAI strength of tubes as a percentage of unindented R5 tubes.
The modulus, strength, and percent reductions in strength are shown in Table 4.7
on page 66. The highest average modulus for unindented tubes belonged to the R1F1R3
type tubes with a value of 15.4 GPa. The all rigid tubes, type R5, had an average
modulus of 14.9 GPa which was brought down with specimen number 2 which had a
much lower value than the other specimens. LWH tube type F1R4 had the lowest
average modulus of 11 GPa. For the indented tubes, type R1F1R3 again had the highest
modulus of 15.1 GPa and type R2F1R2 had the lowest modulus of 9.01 GPa. The
highest average ultimate strength was 221 MPa for the unindented R5 tubes and the
lowest was 165 MPa for the unindented F1R4 tubes. The unindented ultimate strength
tended to decrease as the FMC layer was placed closer to the inside of the tube with the

65
only anomaly being the R1F1R3 tube which had a higher ultimate strength than both the
R2F1R2 tubes and the R3F1R1 tubes. The lowest ultimate strength of the F1R4 tubes
also coincides with the F1R4 tubes having the lowest average unindented modulus. The
highest average ultimate strength in the indented tubes also belonged to the R5 tubes with
a value of 161 MPa. The lowest ultimate strength was 86 MPa belonging to the R2F1R2
tubes. The lowest ultimate strength of the indented R2F1R2 tubes also coincides with the
R2F1R2 tubes having the lowest indented modulus. The percent reduction in strength
when comparing indented to unindented tubes of the same type is the greatest for LWH
type R2F1R2 which lost 50% of its original strength from indentation. The best
performing tube was type R3F1R1 which only lost 18.7% of its strength. This drop in
strength was less than the percent reduction in strength seen by the R5 tubes which lost
27.1% of their strength. However, the percent reduction in strength of the unindented
LWH tubes compared to the unindented strength of the R5 tubes shows that all of the
LWH tubes are initially weaker than the R5 tubes, and this can be attributed to the
presence of the FMC layer.

66
Table 4.7: Modulus and strength of five-ply tubes.
R5 R4F1 R3F1R1 R2F1R2 R1F1R3 F1R4
Modulus [GPa] 1 16.5 14.6 13.4 13.3 16.0 8.2
2 12.1 13.8 14.7 14.7 13.5 13.9
3 16.1 13.6 14.9 13.5 16.7 10.9
U* 14.9 (16.1) 14.0 (3.9) 14.3 (5.7) 13.8 (5.8) 15.4 (11.0) 11.0 (26.0)
Modulus [GPa] 1 12.8 15.0 13.4 7.79 16.3 9.22
2 14.3 15.7 13.1 9.45 14.0 10.0
3 13.5 12.6 12.5 9.81 15.0 13.9
I* 13.5 (5.3) 14.4 (11.5) 12.9 (2.7) 9.01 (11.9) 15.1 (7.6) 11.1 (22.8)
Ultimate 1 216 216 180 163 189 150
Strength 2 224 210 183 181 176 174
[MPa] 3 222 205 185 172 206 171
U 221 (1.8) 211 (2.6) 182 (1.4) 172 (5.2) 190 (8.1) 165 (7.9)
Ultimate 1 159 128 153 81 143 90
Strength 2 163 146 149 87 166 101
[MPa] 3 163 144 142 90 142 133
I 161 (1.3) 139 (7.3) 148 (3.7) 86 (5.7) 150 (9.1) 108 (21.1)
% Reduction in
Strength
(I – U)
U
-27.1 -34.1 -18.7 -50.0 -21.1 -34.5
% Reduction in
Strength
(U – R5)
R5
0.00 -4.60 -17.3 -22.1 -13.7 -25.3
* U = Unindented, I = Indented
The percent retention in strength when comparing unindented and indented like
tubes is shown in Figure 4.29. The tubes with the highest percent retention are R3F1R1
tubes with 81.3%. The all rigid tubes only retained 72.9% of their unindented strength.
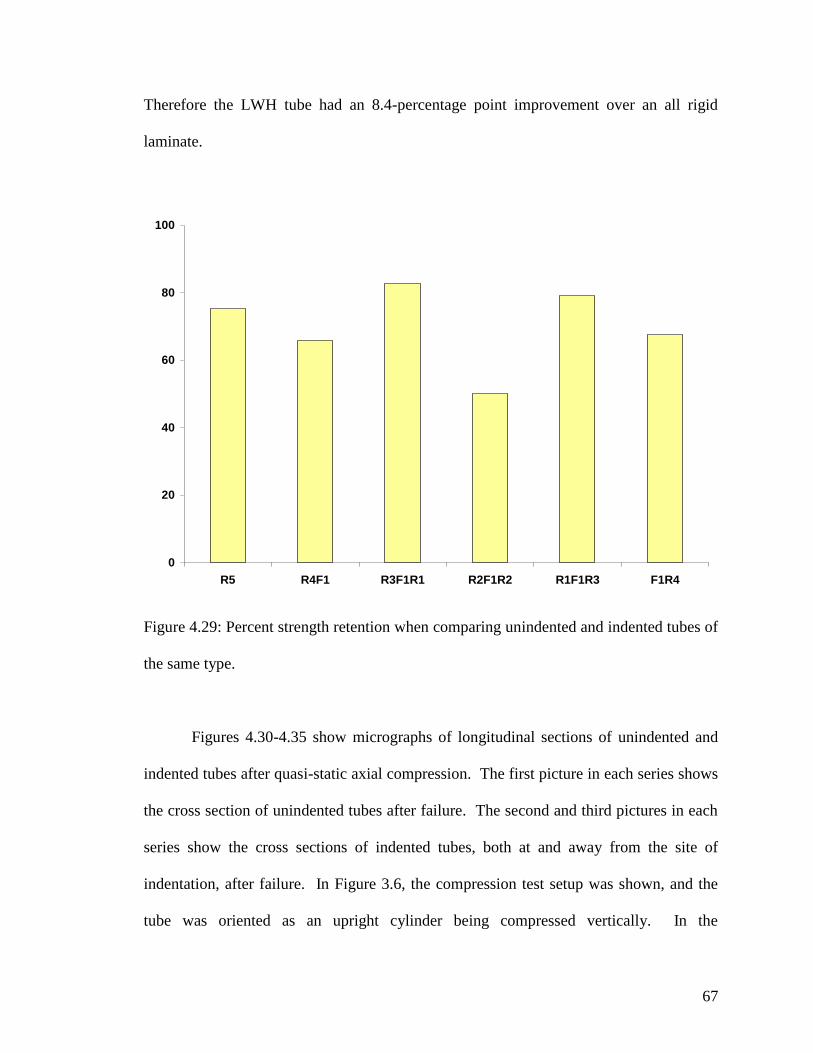
67
Therefore the LWH tube had an 8.4-percentage point improvement over an all rigid
laminate.
0
20
40
60
80
100
R5 R4F1 R3F1R1 R2F1R2 R1F1R3 F1R4
Figure 4.29: Percent strength retention when comparing unindented and indented tubes of
the same type.
Figures 4.30-4.35 show micrographs of longitudinal sections of unindented and
indented tubes after quasi-static axial compression. The first picture in each series shows
the cross section of unindented tubes after failure. The second and third pictures in each
series show the cross sections of indented tubes, both at and away from the site of
indentation, after failure. In Figure 3.6, the compression test setup was shown, and the
tube was oriented as an upright cylinder being compressed vertically. In the
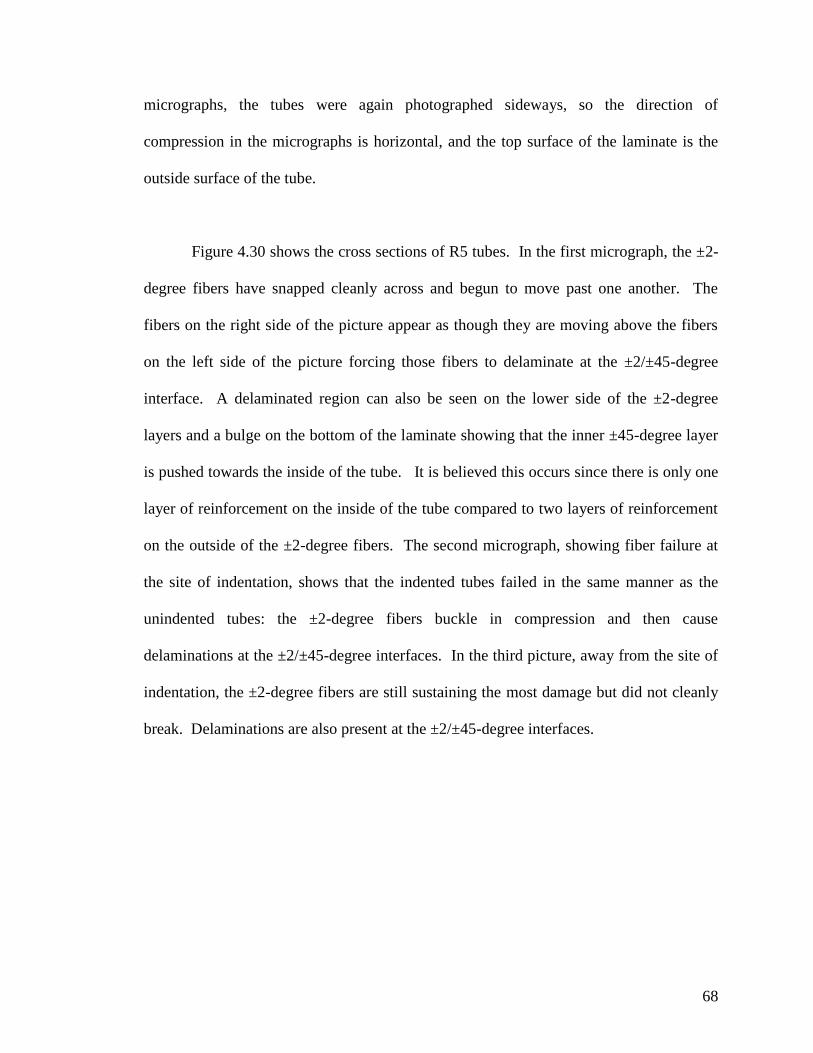
68
micrographs, the tubes were again photographed sideways, so the direction of
compression in the micrographs is horizontal, and the top surface of the laminate is the
outside surface of the tube.
Figure 4.30 shows the cross sections of R5 tubes. In the first micrograph, the ±2-
degree fibers have snapped cleanly across and begun to move past one another. The
fibers on the right side of the picture appear as though they are moving above the fibers
on the left side of the picture forcing those fibers to delaminate at the ±2/±45-degree
interface. A delaminated region can also be seen on the lower side of the ±2-degree
layers and a bulge on the bottom of the laminate showing that the inner ±45-degree layer
is pushed towards the inside of the tube. It is believed this occurs since there is only one
layer of reinforcement on the inside of the tube compared to two layers of reinforcement
on the outside of the ±2-degree fibers. The second micrograph, showing fiber failure at
the site of indentation, shows that the indented tubes failed in the same manner as the
unindented tubes: the ±2-degree fibers buckle in compression and then cause
delaminations at the ±2/±45-degree interfaces. In the third picture, away from the site of
indentation, the ±2-degree fibers are still sustaining the most damage but did not cleanly
break. Delaminations are also present at the ±2/±45-degree interfaces.

69
Figure 4.30: R5 tube cross sections after axial compression: unindented, indented at
indentation, indented away from indentation.
1 mm
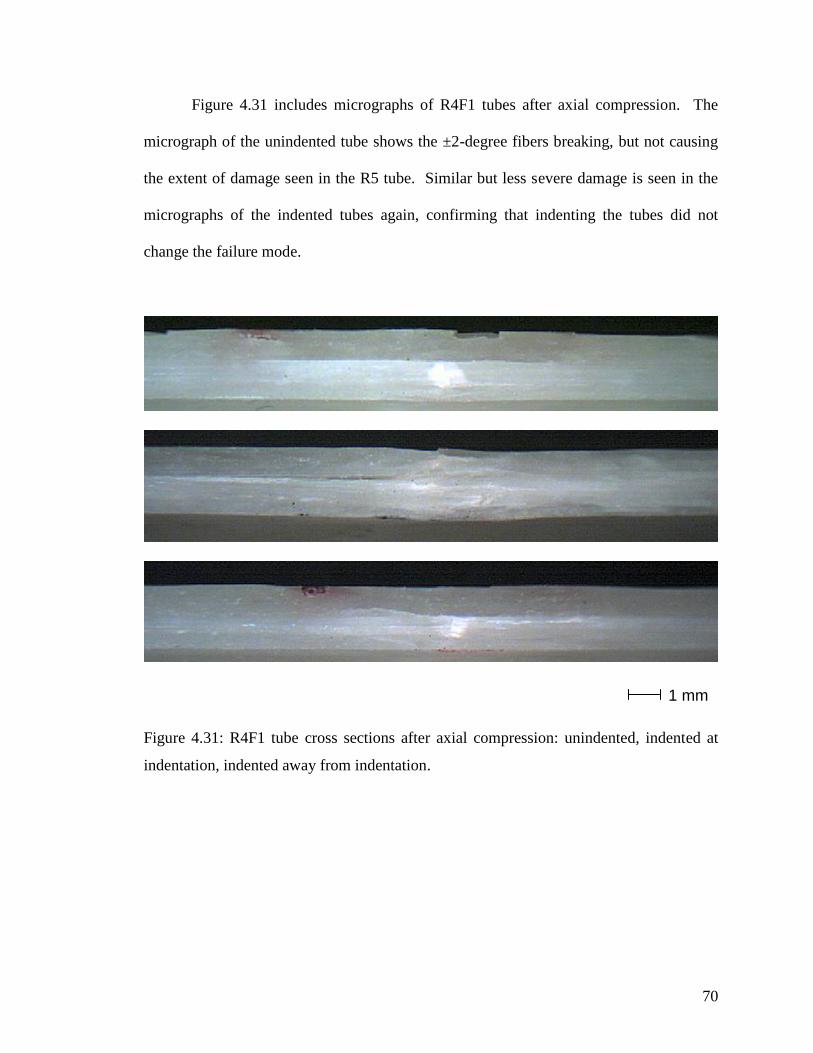
70
Figure 4.31 includes micrographs of R4F1 tubes after axial compression. The
micrograph of the unindented tube shows the ±2-degree fibers breaking, but not causing
the extent of damage seen in the R5 tube. Similar but less severe damage is seen in the
micrographs of the indented tubes again, confirming that indenting the tubes did not
change the failure mode.
Figure 4.31: R4F1 tube cross sections after axial compression: unindented, indented at
indentation, indented away from indentation.
1 mm
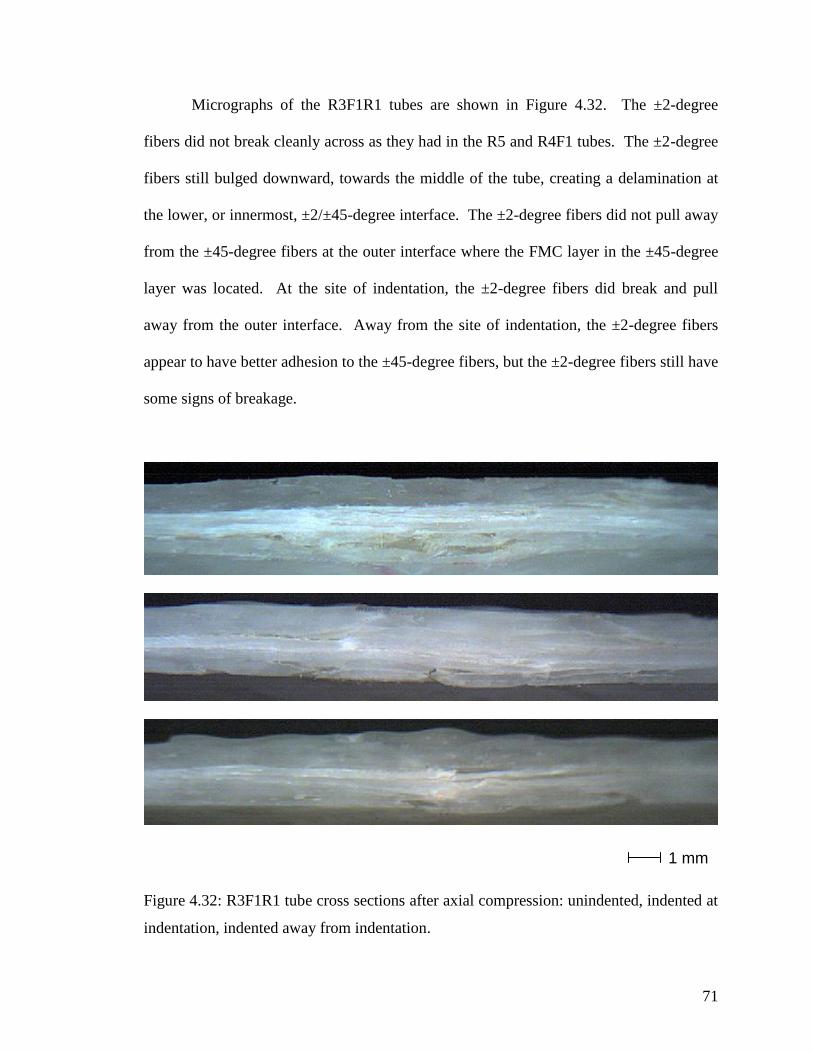
71
Micrographs of the R3F1R1 tubes are shown in Figure 4.32. The ±2-degree
fibers did not break cleanly across as they had in the R5 and R4F1 tubes. The ±2-degree
fibers still bulged downward, towards the middle of the tube, creating a delamination at
the lower, or innermost, ±2/±45-degree interface. The ±2-degree fibers did not pull away
from the ±45-degree fibers at the outer interface where the FMC layer in the ±45-degree
layer was located. At the site of indentation, the ±2-degree fibers did break and pull
away from the outer interface. Away from the site of indentation, the ±2-degree fibers
appear to have better adhesion to the ±45-degree fibers, but the ±2-degree fibers still have
some signs of breakage.
Figure 4.32: R3F1R1 tube cross sections after axial compression: unindented, indented at
indentation, indented away from indentation.
1 mm

72
Figure 4.33 shows micrographs of R2F1R2 tubes. In the unindented tube, the
FMC layer fibers can be seen buckling and pulling away from the RMC fibers in the ±45-
degree layer. In the indented tubes, both at and away from the site of indentation,
delaminations occurred at that same interface.
Figure 4.33: R2F1R2 tube cross sections after axial compression: unindented, indented at
indentation, indented away from indentation.
1 mm

73
Figure 4.34 shows micrographs of R1F1R3 tubes. The unindented tubes have
delaminations at the mid-laminate ±2/±45-degree interface, between the third and fourth
plies from the bottom of the micrograph, while the indented tubes have delaminations at
the inner-laminate ±2/±45-degree interface, between the first and second plies.
Figure 4.34: R1F1R3 tube cross sections after axial compression: unindented, indented at
indentation, indented away from indentation.
1 mm

74
Figure 4.35 shows micrographs of F1R4 tubes. The ±2-degree fibers in the
unindented tubes did not break cleanly across as they had in other tubes, however, the ±2-
degree fibers do appear to have a clean break at the site of indentation. Away from the
site of indentation, the ±2-degree fibers again break in multiple locations.
Figure 4.35: F1R4 tube cross sections after axial compression: unindented, indented at
indentation, indented away from indentation.
1 mm

75
It is believed that the R3F1R1 tubes had the highest percent retention in strength
when comparing like laminates due to the placement of the FMC layer at the outer
±2/±45-degree interface. Having the FMC layer coincide with ±45-degree fibers reduced
the influence of replacing one fifth of the tube with a lower modulus epoxy by it being in
a less-load bearing layer. Also, by being part-way through the laminate, the FMC layer
prevented cracks from forming at that critical location and other cracks from propagating
through the thickness.
4.3.2 Residual Strength Results for Nine-Ply Tubes
Figures 4.36-4.38 show unindented nine-ply [±45/(±2)4/(±45)4] tubes after axial
compression. The hybridization arrangement of these tubes was designed on the
observation that placing the FMC layer at the outer ±2/±45-degree interface in the ±45-
degree ply demonstrated the greatest percent retention in compression after impact
strength in the five-ply tubes. This series of tests also investigated the effect of using
different modulus epoxies in the FMC layer. The R9 tube is all rigid, the R5P1R3 tube
uses a partially flexible epoxy in the FMC layer, and the R5F1R3 uses the more flexible
epoxy in the FMC layer.
Figure 4.36 shows the R9 tubes after quasi-static axial compression. Unlike the
R5 tubes, the R9 tubes experienced fiber breakage that spread along the ±45-degree fiber
lines. Whitening, indicating fiber breakage and fibers bulging out from the surface, can
be seen on all of the tubes. The size of the delaminated areas covered most of the height

76
of the tubes at some point around the circumference. The delaminated areas also
followed the lines of the ±45-degree fibers.
Figure 4.36: R9 tubes after axial compression.
Figure 4.37 shows the R5P1R3 tubes after compression. The delaminations again
covered most of the height of the tubes and followed the lines of the ±45-degree fibers.
Also, whitening from fiber breakage can be seen along the ±45-degree lines, but is less
defined than on the R9 tubes.
Figure 4.37: R5P1R3 tubes after axial compression.

77
Figure 4.38 shows the unindented R5F1R3 tubes after compression. The
delaminated region stretches from the edge of one end cap to the other on all of the tubes
at some point around the circumference. The delaminations follow both the ±2-degree
lines as well as the ±45-degree lines. Less whitening was seen on these tubes than any
other type.
Figure 4.38: R5F1R3 tubes after axial compression.
Figure 4.39 shows the percent strength of the LWH tubes when compared to the
strength of the R9 tubes. The all-RMC tube had the highest strength, and as expected, the
tube with one P-epoxy layer had a higher percent strength than the tube with one F-epoxy
layer. Numerical strength and stiffness values are shown in Table 4.7 and stress-strain
curves are included in Appendix 3.

78
0
20
40
60
80
100
R P F
Figure 4.39: Strength of Unindented LWH tubes as a percentage of unindented R9 tubes.
Figures 4.40-4.42 show indented nine-ply tubes after quasi-static indentation.
The black solid lines indicate the area damaged during quasi-static indentation while the
red dashed lines indicate the area damaged during axial compression.
Indented R9 tubes are shown in Figure 4.40. Unlike the five-ply tubes, the
damage caused during compression spread out above and below the pre-existing damage.
Fiber breakage can be seen extending from the site of indentation outward at ±45-degree
angles. The whitening of the fiber breakage does not spread as far out to the sides as it
had on the unindented tubes. The delaminations also follow the lines of the ±45-degree
fibers.

79
Figure 4.40: Indented R9 tubes after axial compression.
Indented R5P1R3 tubes are shown in Figure 4.41. The delaminations follow the
same pattern as the R9 tubes, but no fiber breakage or bulging of the outer surface could
be seen.
Figure 4.41: Indented R5P1R3 tubes after axial compression.
Indented R5F1R3 tubes are shown in Figure 4.42. The damage caused by
compression was very similar to that found in the R5P1R3 tubes in that the delaminations
followed ±45-degree lines and little or no fiber breakage could be seen from the outside
of the tube.

80
Figure 4.42: Indented R5F1R3 tubes after axial compression.
The strength of the indented tubes as a percent of the strength of the unindented
R9 tube is shown in Figure 4.43. Based on the five-ply tube results, it was expected that
the R9 tube, labeled as column R, would retain the most strength followed by the
R5P1R3 tubes (column P) and the R5F1R3 tubes (column F). However, the R5F1R3
tubes retained more strength than the tubes made with a less flexible matrix in the FMC
layer. This drop in CAI strength could be because the R5P1R3 tubes were indented to a
slightly (6%) higher energy per unit thickness than the R9 and R5F1R3 tubes (Table 4.5).

81
0
20
40
60
80
100
R P F
Figure 4.43: CAI strength of tubes as a percentage of strength of unindented R9 tubes.
The moduli, strengths, and percent reductions in strength for the nine-ply tubes
are shown in Table 4.8. The modulus for the unindented nine-ply tubes was highest for
tube type R5P1F3 and lowest for type R9 with moduli of 19.7 GPa and 16.2 GPa,
respectively. The modulus for the indented nine-ply tubes was highest for type R5F1R3,
but this can be attributed to specimen 1 of that type having an unusually high modulus.
The unindented R9 tubes had the highest ultimate strength (198 MPa). The lowest
unindented ultimate strength belonged to the R5F1R3 tubes that had an average strength
of 155 MPa. The indented R9 tubes also had the highest ultimate strength of all the
indented tubes; however, the R5P1R3 tubes had the lowest indented ultimate strength.
The percent reduction in strength when comparing unindented and indented tubes of the

82
same type was the lowest (27.14%) for the R5F1R3 tubes and highest for the R5P1R3
tubes (50.41%).
Table 4.8: Modulus and strength of nine-ply tubes.
R9 R5P1R3 R5F1R3
Modulus [GPa] 1 14.3 18.0 14.3
2 16.7 20.8 18.2
3 17.6 20.4 17.4
Average (CV%) U* 16.2 (10.6) 19.7 (7.5) 16.6 (12.4)
Modulus [GPa] 1 15.6 11.5 17.0
2 15.9 12.2 14.6
3 14.1 15.4 15.4
I* 15.2 (6.6) 13.0 (16.0) 15.7 (7.9)
Ultimate Strength [MPa] 1 215 174 159
2 176 176 165
3 202 184 140
U 198 (10.0) 178 (3.0) 155 (8.5)
Ultimate Strength [MPa] 1 131 89 113
2 155 83 113
3 139 92 113
I 142 (8.5) 88 (5.4) 113 (0.2)
% Reduction in
Strength
(Indented – Unindented)
Unindented
-28.5 -50.4 -27.1
% Reduction in
Strength
(Unindented – R5)
R5
0.00 -10.1 -21.9
* U = Unindented, I = Indented
The percent strength retention when comparing unindented and indented tubes of
the same type is shown in Figure 4.44. LWH type R5F1R3, the tube with the more

83
flexible FMC layer, had the highest percent retention in strength at 72.9% which is a
slight improvement over the R9 tube which retained 71.5% of its strength. It had been
expected that the overall percent retentions in strength would improve across the board
with a lower percentage of FMC in the laminates. One possible explanation is that the
constant energy used to indent the nine-ply tubes in fact inflicted more damage in the
nine-ply tubes than the constant force used to indent the five-ply tubes.
0
20
40
60
80
100
R P F
Figure 4.44: Percent strength retention when comparing unindented and indented tubes of
the same type.
Figures 4.45-4.47 show micrographs of longitudinal cross sections of the nine-ply
tubes at the site of failure in unindented tubes and indented tubes both at and away from

84
the site of indentation. The top surface in the micrograph is the outer surface of the tube,
and moving downward are four ±45-degree layers, four ±2-degree layers, and one ±45-
degree layer. The ±2-degree layers appear lighter than the ±45-degree layers.
Cross sections of R9 tubes after axial compression are shown in Figure 4.45. The
unindented tube failed when the ±2-degree fibers buckled. Unlike in the five-ply tubes,
the ±2-degree layers could not break cleanly across all of the ±2-degree plies. Instead,
the fracture moved at a 45-degree angle from one angle interface to the other. Similar to
the five-ply all-rigid tube, R5, the R9 tube also had delaminations at the interfaces
between the different fiber angles. Matrix cracking can be seen in the ±45-degree layers
in the indented R9 tube, but the damage from failure under compression is mostly in the
±2-degree fibers. Again, there are regions that are delaminated between the ±2-degree
plies and the ±45-degree plies on either side and also between layers of ±2-degree fibers.
Away from the site of indentation, some of the ±2-degree fibers were able to break
cleanly across the ±2-degree layer, but then the crack turns and travels along the direction
of the ±2-degree fibers.

85
Figure 4.45: R9 tube cross sections after axial compression: unindented, indented at
indentation, indented away from indentation.
Figure 4.46 shows the tube with the partially flexible FMC layer, type R5P1R3.
The ±2-degree fibers appear to have been shredded instead of breaking or kinking in the
unindented tube cross section. Most if not all of the delamination occurred within the ±2-
degree fibers and not at the interfaces between the ±2-degree fibers and the ±45-degree
fibers. A similar pattern appears in the indented tube at the site of indetation. The
1 mm

86
“shredded” region is located mostly between two ±2-degree layers while all of the ±2-
degree fibers appear to kink instead of break. Also at the site of indentation, permanent
deformation on the top surface can be seen as well as matrix cracking throughout the
±45-degree fibers. Away from the site of indentation, fibers behave in the same manner.
Figure 4.46: R5P1R3 tube cross sections after axial compression: unindented, indented at
indentation, indented away from indentation.
1 mm

87
Micrographs of the R5F1R3 tubes are shown in Figure 4.47. The unindented tube
has kinked fibers similar to the R5P1R3 tube, but the failure region is more confined and
without the “shredded” appearance. It appears that there is some delamination at both
±2/±45-degree interfaces. The indented tube at the site of indentation has no visible
permanent deformation at the top surface and has very faint matrix cracking. Only a few
of the ±2-degree fiber layers appear to be broken, and the fibers are only slightly
displaced. Away from the site of indentation, more of the ±2-degree fibers are broken; it
appears they are still kinking instead of breaking cleanly across the ±2-degree layer, but
the region over which they bend is much smaller than in either of the nine-ply tubes.
Delaminations are not visible in either of the micrographs.

88
Figure 4.47: R5F1R3 tube cross sections after axial compression: unindented, indented at
indentation, indented away from indentation.
1 mm

89
4.4 Comparison between Lamination Theory and Experiments
Experimental axial modulus results were compared to a classical laminated plate
theory analysis that takes into account various material properties and generates laminate
properties based on the specified stacking sequence and ply thickness. Inputs included in
the code were fiber angles, E1, E2, G12, and ν12, and thickness for each ply. The values
used in the analysis are listed in Tables 4.1-4.3. Values for E1, calculated using rule of
mixtures, correlated with published values for unidirectional S-glass reinforced epoxy
(Daniel, 2006). However, in the analysis of the five-ply tubes, the theory more closely
matched the results if the value for E1 was similar to a woven S-glass/epoxy lamina. In
the filament winding process, the tows of fibers are effectively woven one tow at a time.
The value used for E1 in the five-ply tubes was 26.3 GPa, 54.3% of the rule-of-mixtures
value. This value was found by fitting the calculated modulus to the experimental
modulus. This same knockdown was applied to E1 for the flexible epoxy, and these
values were used in the analysis for the five-ply LWH tubes. Fitting the calculated
modulus to the experimental modulus in the nine-ply tubes yielded an intermediate E1 of
32.8 GPa; this value is 67.8% of the rule-of mixtures value for E1. The E1 values for the
partially flexible and flexible epoxies were also reduced to this percent of their original
value, and these values were used in the analysis for the nine-ply LWH tubes. The
laminate modulus output from the analysis and percent error compared to the
experimental values are shown in Table 4.9.

90
Table 4.9: Comparison of calculated laminate values to experimental values.
Five-Ply
Calculated Ex [GPa]
Calculated Ex [GPa] Experimental Ex
[GPa] E1 from ROM E1 fitted to R5
R5 27.0 14.9 14.9
R4F1 26.7 12.9 14.0
R3F1R1 26.7 12.9 14.3
R2F1R2 25.5 11.0 13.8
R1F1R3 25.5 11.0 15.4
F1R4 26.7 12.9 11.0
Nine-Ply E1 from ROM E1 fitted to R9
R9 28.7 16.2 16.2
R5P1R3 27.9 15.2 19.7
R5F1R3 27.7 15.2 16.6
The modulus of the laminate calculated by the CLPT code using the rule-of-
mixtures value for E1 was considerably higher for the five-ply tubes than the
experimental value. One possible explanation for the experimental modulus being lower
than the rule-of-mixtures calculated modulus is voids in the laminates and other
imperfections from the fabrication process such as fiber undulations which can
dramatically decrease E1. The experimental values of the nine-ply tubes were slightly
closer to the rule-of-mixtures calculated values than the five-ply tubes.

91
4.5 Summary
LWH laminates have mixed results in damage resistance. LWH laminates tended
to have larger damaged regions including delaminations, fiber breakage, and matrix
cracking in both the cases of constant indentation force and constant indentation energy
per unit thickness when compared to all-rigid epoxy laminates. However, when the
indented tubes were inspected through the thickness, LWH laminates had more diffuse
damage and less matrix cracking especially when the FMC layer was placed towards the
middle of the laminate.
In the five-ply tubes, placing an FMC layer at the outer ±2/±45-degree interface in
the ±45-degree layer improves the percent strength retention by eight percentage points
compared to the all rigid, R5, tube. It is believed this is caused by the ±45-degree FMC
layer inhibiting intra-laminar cracks from forming in the dissimilar ply interface and then
propagating through the thickness.
Placing the FMC layer at the outer ±2/±45-degree interface in the ±45-degree
layer of the nine-ply tube yielded similar results as the five-ply tubes, but to a lesser
degree. The FMC layer in the R5F1R3 laminate appears to be the most beneficial when
concerned with strength retention in a laminate. The R5F1R3 laminate has very minimal
damage from indentation and was therefore able to retain the highest percent of its
unindented strength.
92
Chapter 5
Conclusions and Recommendations
In this investigation, fiber dominated laminates, representative of rotor blades,
have been filament wound using LWH laminates. It has been shown that strategically
placing an FMC layer in an RMC laminate, thereby creating a layer-wise hybrid laminate
can increase both the damage resistance and damage tolerance of a composite laminate
when comparing laminates of the same type. Placing the FMC layer at the interface
between different fiber angles stops interlaminar cracks from forming at the interface and
prevents cracks elsewhere from propagating through the interface and the entire thickness
of the laminate. In traditional, RMC laminates, intra-laminar matrix cracks could be seen
radiating out and downward through the ±45-degree fiber layers from the site of quasi-
static indentation in addition to delaminations at the ±2/±45-degree fiber layer interface
and within the ±2-degree layers. With the addition of an FMC layer at this interface,
there was less matrix cracking in the RMC ±45-degree layers and smaller delaminations
in the ±2-degree layers. In the LWH laminates tested in compression after indentation,
there appeared to be better bonding at the ±2/±45-degree interface resulting in an eight
percentage point improvement in strength retention over the all-rigid matrix laminate in
the five-ply tubes but only a one percentage point improvement over the all-rigid matrix
laminate in the nine-ply tubes.

93
The LWH laminates did have larger damaged areas due to more diffuse matrix
cracking, in terms of length and width, from quasi-static indentation than the RMC
laminates. The five-ply tubes were all indented to the same force, and, therefore, the
LWH laminates were indented to a higher energy than the RMC laminates. This
discrepancy was mediated when testing the nine-ply tubes which were all indented to the
same energy per unit thickness. Even though the LWH nine-ply tubes were indented to a
lower force than the RMC tubes, the damaged areas on the LWH tubes were still larger
than those on the RMC tubes. The larger areas can be attributed to larger cracks in the
matrix spreading parallel to the surface of the laminate, since the micrographs of the
longitudinal cross sections of the tubes indicated less severe matrix cracks through the
thickness in the LWH tubes.
The LWH laminates also had lower ultimate strengths than the RMC laminates of
the same stacking sequence when tested in compression without prior damage. This was
expected as each LWH laminate had one lamina of FMC and both the partially flexible
and flexible epoxies had lower elastic moduli than the rigid epoxy. In general, the
laminate modulus also decreased with the addition of an FMC lamina.
The nine-ply tubes with the partially flexible FMC layer, R5P1R3, had the worst
percent retention in strength. Inspecting the micrographs indicated poor fiber/matrix
bonding in the ±2-degree layers. It is unclear at this time whether the problem lies in the
fabrication of the R5P1F1 specimens or in the material itself. Other material properties
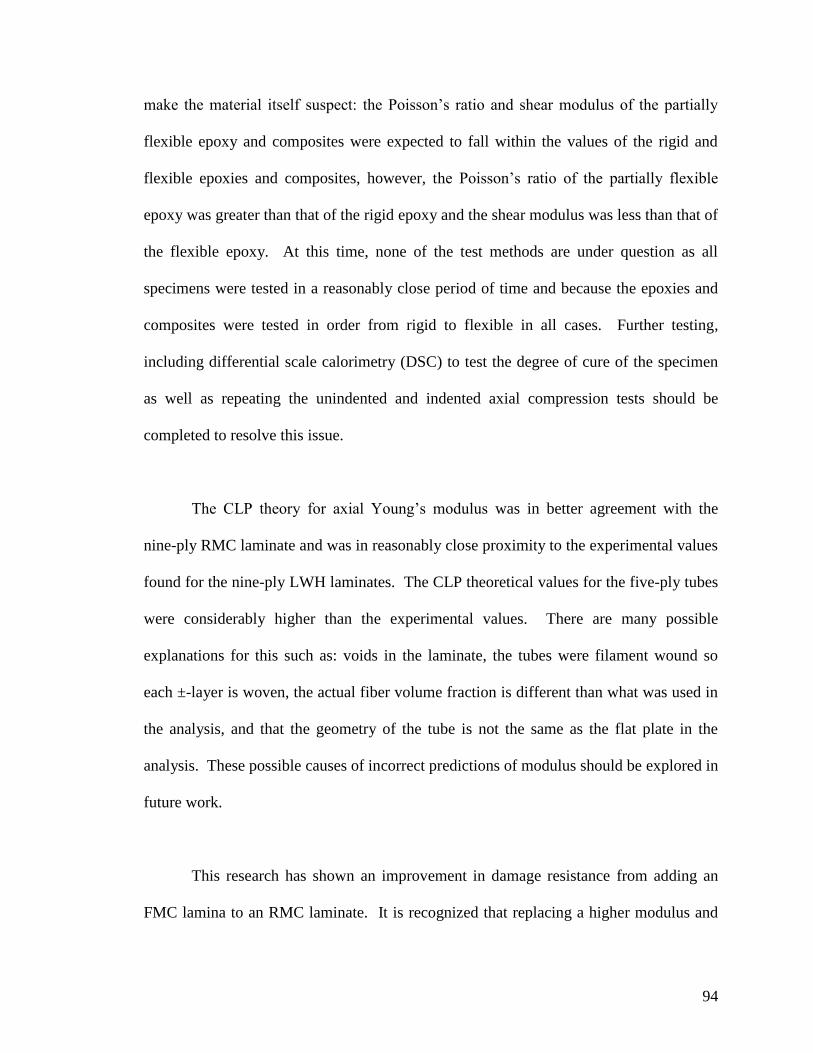
94
make the material itself suspect: the Poisson’s ratio and shear modulus of the partially
flexible epoxy and composites were expected to fall within the values of the rigid and
flexible epoxies and composites, however, the Poisson’s ratio of the partially flexible
epoxy was greater than that of the rigid epoxy and the shear modulus was less than that of
the flexible epoxy. At this time, none of the test methods are under question as all
specimens were tested in a reasonably close period of time and because the epoxies and
composites were tested in order from rigid to flexible in all cases. Further testing,
including differential scale calorimetry (DSC) to test the degree of cure of the specimen
as well as repeating the unindented and indented axial compression tests should be
completed to resolve this issue.
The CLP theory for axial Young’s modulus was in better agreement with the
nine-ply RMC laminate and was in reasonably close proximity to the experimental values
found for the nine-ply LWH laminates. The CLP theoretical values for the five-ply tubes
were considerably higher than the experimental values. There are many possible
explanations for this such as: voids in the laminate, the tubes were filament wound so
each ±-layer is woven, the actual fiber volume fraction is different than what was used in
the analysis, and that the geometry of the tube is not the same as the flat plate in the
analysis. These possible causes of incorrect predictions of modulus should be explored in
future work.
This research has shown an improvement in damage resistance from adding an
FMC lamina to an RMC laminate. It is recognized that replacing a higher modulus and

95
higher strength lamina with one that has a lower modulus and lower strength will cause a
drop in modulus and strength for the entire laminate, so continuing research should
investigate comparing RMC and LWH laminates that begin with the same strength and
possibly modulus and then evaluate the performance of the LWH laminate based on a
normalized weight. Also, various drop-impact events of different energies should be
included in evaluating both damage tolerance and residual strength. Finally, fatigue
testing comparing RMC and LWH laminates both before and after damage has been
introduced should be investigated.

96
References
ASTM D 3518, 2007, Standard Test Method for In-Plane Shear Response of Polymer
Matrix Composite Materials by Tensile Test of a ±45° Laminate, American
Society for Testing Materials, West Conshohocken, PA.
ASTM D 5450, 2006, Standard Test Method for Transverse Tensile Properties of Hoop
Wound Polymer Matrix Composite Cylinders, American Society for Testing
Materials, West Conshohocken, PA.
ASTM D 6264, 2004, Standard Test Method for Measuring Damage Resistance of Fiber-
Reinforced Polymer-Matrix Composite to Concentrated Quasi-Static Indentation
Force, American Society for Testing Materials, West Conshohocken, PA.
ASTM D 638, 2003, Standard Test Method for Tensile Properties of Plastics, American
Society for Testing Materials, West Conshohocken, PA.
ASTM D 7137, 2005, Standard Test Method for Compressive Residual Strength
Properties of Damaged Polymer Matrix Composite Plates, American Society for
Testing Materials, West Conshohocken, PA.
Cartié, D. D. R., Irving, P. E., 2002, “Effect of resin and fibre properties on impact and
compression after impact performance of CFRP,” Composites: Part A, Vol. 33,
pp. 483-493.
Chen, S. F., Jang, B. Z., 1991, “Fracture behavior of interleaved fiber-resin Composites,”
Composites Science and Technology, Vol. 41, pp. 77-97.
Daniel, I. M., Ishai, O., 2006, Engineering Mechanics of Composite Materials, 2nd Ed.

97
Duarte, A., Herszberg, I., Paton, R., 1999, “Impact resistance and tolerance of interleaved
tape laminates,” Composite Structures, Vol. 47, pp. 753-758
Gandhe, G. V., Griffin, O. H., 1989, “Post-impact characterization of interleaved
composite materials,” SAMPE Quarterly, July, pp.55-58.
Lee, S. H., Aono, Y., Noguchi, H., Cheong, S. K., 2003, “Damage mechanism of hybrid
composites with nonwoven carbon tissue subjected to quasi-static indentation
loads,” Journal of Composite Materials, Vol. 37, pp. 333-349.
Lu, W. H., Liao, F. S., Su, A. C., Kao, P. W., Hsu, T. J., 1995, “Effect of interleaving on
the impact response of a unidirectional carbon/epoxy composite,” Composites,
Vol. 26, No. 3, pp. 215-222.
Masters, J.E., 1989, “Improved impact and delamination resistance through interleafing,”
Key Engineering Materials, Vol. 37, pp. 317-347.
Morii, T., Hamada, H., Desaeger, M., Gotoh, A., Yokoyama, A., Verpoest, I., Maekawa,
Z. I., 1995, “Damage tolerance of glass mat/epoxy laminates hybridized with
flexible resin under static and impact loading,” Composite Structures, Vol. 32, pp.
133-139.
Sohn, M. S., Hu, X. Z., Kim, J. K., Walker, L., 2000, “Impact damage characterization of
carbon fiber/epoxy composites with multi-layer reinforcement,” Composites: Part
B, Vol. 31, pp. 681-691.
Takemura, S., Kobayashi, A. S., Ohno, H., 2001, “Improved flexural impact properties of
hybrid laminate reinforced with low-modulus carbon fiber,” Proceedings of the
42nd
AIAA/ASME/ASCE/AHS/ASC SDM Conference, Seattle, WA, pp.1974-1983.

98
Walker, L., Sohn, M. S., Hu, X. Z., 2002, “Improving impact resistance of carbon-fiber
composites through interlaminar reinforcement,” Composites: Part A, Vol. 33, pp.
893-902.
Xuefeng, A. N., Shuangying, J. I., Bangming, T., Zilong, Z., Xiao-Su, Y., 2002,
“Toughness improvement of carbon laminates by periodic interleaving thin
thermoplastic films,” Journal of Material Science Letters, Vol. 21, pp. 1763-1765.
Yi, X.-S., An, X. F., 2004, “Effect of interleaf sequence on impact damage and residual
strength in a graphite/epoxy laminate,” Journal of Materials Science, Vol. 39, pp.
3253-3255.
Yuan, Q., Kerth, S., Karger-Kocsis, J., Friedrich, K., 1997, “Crash and energy absorption
behaviour of interleaved carbon-fibre-reinforced epoxy tubes,” Journal of
Material Science Letters, Vol. 16, pp. 1793-1796.
Yuan, Q., Karger-Kocsis, J., Ye, L., 2001, “Impact properties of interleaved carbon fibre
reinforced epoxy composite tubes,” Advanced Composites Letters, Vol. 10, No. 1,
pp. 35-40.
Zhang, J. and Smith, E., 2006, “Design methodology and analysis of composite blades
for a low weight rotor,” American Helicopter Society, AHS Vertical Lift Design
Conference, Alexandria, VA, pp. 397-404.

99
Appendix 1
Flexible and Rigid Epoxy Constituents and Ratios
Each mixture is given in grams.
Table A1.1: Epoxy and polyurethane mixture and cure schedule.
D.E.R. 383 Jeffamine®
T403
Adiprene® L100 Caytur® 21 Cure
Temperature
Cure Time
bisphenol-A
epoxy resin
amine curative prepolymer curative (°C) (hrs)
A 100 43 100 21 80
125
2
3
Table A1.3: Polysulfide mixtures and cure schedules.
EponTM
8132 PACM
20
Jeffamine
® T403
LP-3 DMP 30 TMPTA Cure
Temperature
Cure Time
bispehol-A
epoxy resin
curing
agent
amine
curative
poly-
sulfide acceler-
ator
monomer (°C) (hrs)
H 100 21.8 40.4 0.90 2 80 2.5
I 100 29.06 40.4 0.90 2 80 2.5
Table A1.2: Epoxy mixtures and cure schedules.
EponTM
8132
EponTM
58003
EponTM
58006
Jeffamine®
T403
Jeffamine®
D2000
EpikureTM
3140
EpikureTM
3164
Cure
Temp
Cure
Time
bis-A
epoxy
resin
elastomer elastomer amine
curative
amine
curative
amine
curative
amine
curative (°C) (hrs)
B 100 136
C 100 50
D 100 20 12 100
E 100 30 30 110
F 100 50 133 100
G 100 50 133 100

100
Table A1.4: Rigid and flexible epoxy mixtures and cure schedules.
EponTM
8132
EponTM
58034
Jeffamine
T403
Jeffamine
D2000
EpikureTM
3164
Cure
Temperature
Cure
Time
bis-A epoxy
resin
elastomer amine curative amine curative amine curative (°C) (hrs)
J 100 50 133 100 80
125
2
3
K 100 100 68 80
125
2
3
L 100 50 54 80
125
2
3
M 100 25 47 80
125
2
3
N 100 39.5 80
125
2
3
Formulation L is the flexible epoxy type F.
Formulation M is the partially flexible epoxy type P.
Formulation N is the rigid epoxy type R.

101
Appendix 2
Pilot Study
An initial pilot study was conducted for determining the stacking sequence,
matrix material, quasi-static indentation and compression procedures, and the evaluation
of damage resistance and residual strength of filament wound composite tubes.
Initially, two types of tubes were fabricated on a 50.8-mm-diameter. Each tube
consisted of four ±15-degree layers. One tube was all rigid matrix composite (RMC),
and the other tube had two inner layers of RMC and two outer layers of flexible matrix
composite (FMC). The rigid epoxy used was Epon 8132 cured with Jeffamine T403.
The flexible epoxy used had equal parts Epon 8132 and Epon 58034 both cured with
Jeffamine T403. The exact ratios used are given as formulations K and N in Appendix 1,
Table A1.4.
A rigid tube was quasi-statically indented first to determine the maximum load
that could be applied to the tube before the steel indenter would completely collapse or
punch through the tube wall. At a load of approximately 3500 N, the indenter punched
through the side of the tube taking a large wedge of composite with it. A picture of this
tube is shown in Figure A2.1. The indentation load was then reduced to 3000 N, but the
steel end supports still cut into the inner fibers of the composite tube. A picture of this
damage is shown in Figure A2.2. The indentation force was reduced further to 2700 N,
and then all of the RMC tubes were indented to this force.
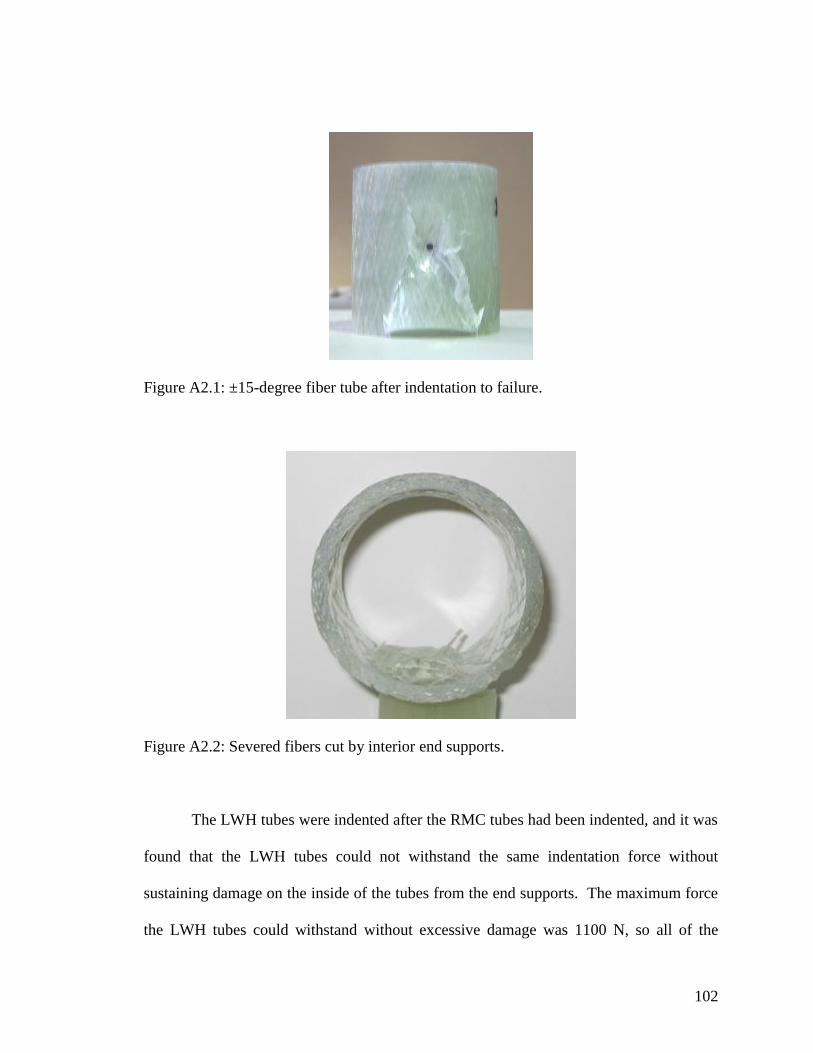
102
Figure A2.1: ±15-degree fiber tube after indentation to failure.
Figure A2.2: Severed fibers cut by interior end supports.
The LWH tubes were indented after the RMC tubes had been indented, and it was
found that the LWH tubes could not withstand the same indentation force without
sustaining damage on the inside of the tubes from the end supports. The maximum force
the LWH tubes could withstand without excessive damage was 1100 N, so all of the

103
LWH tubes were indented to this lesser load A picture of the excessive deformation of
the LWH tube while being indented is shown in Figure A2.3.
Figure A2.3: Excessive deformation of LWH during indentation.
From these tests, it was determined that all types of tubes to be tested should be
indented initially to determine an acceptable force or energy with which to indent all of
the specimens so that comparisons of the damage can be made after the testing. Also, the
sharp edges of the end supports were filed down to form a curved surface which would
not cut into the interior fibers of the tube if it were to deform under indentation.

104
Following indentation, the ±15-degree tubes were tested in axial compression
until failure. Both unindented and indented tubes were tested. A picture of an
unindented RMC tube is shown in Figure A2.4. In the tube, the composite failed along
the ±15-degree fiber lines. After this round of testing, it was determined that the stacking
sequence of [±15]4 was not representative of the fiber angles and ratios of those fiber
angles typically found in a rotor blade spar.
Figure A2.4: Unindented ±15-degree tube after compression.
The 67% knockdown in unindented strength when comparing RMC and LWH
tubes confirmed the idea that the flexible epoxy in the FMC layers was too soft and not
providing enough strength to support the fibers in those layers in compression. In
subsequent tests, more-rigid flexible epoxies were used. These epoxies used the same

105
constituents as the flexible epoxy in this trial, but had a smaller ratio of Epon 58034 to
Epon 8132. See formulations L and M in Appendix 1, Table A1.4
Once a new stacking sequence was chosen, [±45/(±2)2/(±45)2], and the tubes were
fabricated, indented, and tested in compression, a new failure mode emerged. Most of
the unindented tubes and the indented RMC tubes failed by brooming at the ends. A
picture of brooming is shown in Figure A2.5. Brooming describes the appearance of the
fibers at one or both ends of the specimen where the fibers spread outward and
delaminate just at the end of the laminate. It is not considered a valid failure mode since
the location of failure is just at the bare end of the laminate.
Figure A2.5: End brooming in an unsupported composite tube.

106
To counteract the ends brooming, the tubes were potted in rigid epoxy with the
idea that the extra support around the ends would constrain the edges and allow the tubes
to fail in the middle section away from the ends. Unfortunately, as seen in Figure A2.6,
the tubes, when subjected to compression, would compress and expand radially outward
similar to pushing on a Chinese finger trap. This caused the tube to pull away from the
inner disk of epoxy and to, once again, fail by brooming.
Figure A2.6: Composite tube potted in epoxy with separated inner epoxy disk.
An attempt was made to increase the stiffness of the potting mixture by adding
sand. The mixture did not completely separate from the inside of the tube as the epoxy-
only mixture had done, but the sand-epoxy mixture did crack radially outward from the
tube on the outside allowing the tube to again fail by brooming.

107
The next and final attempt at constraining the tube ends was to pot the ends in
steel end caps using Cerrobend, a low-temperature melting alloy. This procedure worked
well and is described in Chapter 3.

108
Appendix 3
Stress-Strain Plots
Neat Epoxy – Elastic Modulus
0
10
20
30
40
50
0 10000 20000 30000 40000 50000
Strain ()
Str
ess (
MP
a)
0
10
20
30
40
50
0 10000 20000 30000 40000 50000
Strain ()
Str
es
s (
MP
a)
(a) (b) Figure A3.1: Stress versus strain for rigid epoxy using strain gages (a) and photos (b).
Breaks in data in (a) are the result of poor attachment of the lead wires to the strain gage.
0
10
20
30
40
50
0 10000 20000 30000 40000 50000
Strain ()
Str
ess (
MP
a)
0
10
20
30
40
50
0 100000 200000 300000 400000
Strain ()
Str
es
s (
MP
a)
(a) (b) Figure A3.2: Stress versus strain for partially flexible epoxy using strain gages (a) and photos (b).
0
10
20
30
40
50
0 10000 20000 30000 40000 50000
Strain ()
Str
ess (
MP
a)
0
10
20
30
40
50
0 100000 200000 300000 400000
Strain ()
Str
es
s (
MP
a)
(a) (b) Figure A3.3: Stress versus strain for flexible epoxy using strain gages (a) and photos (b).
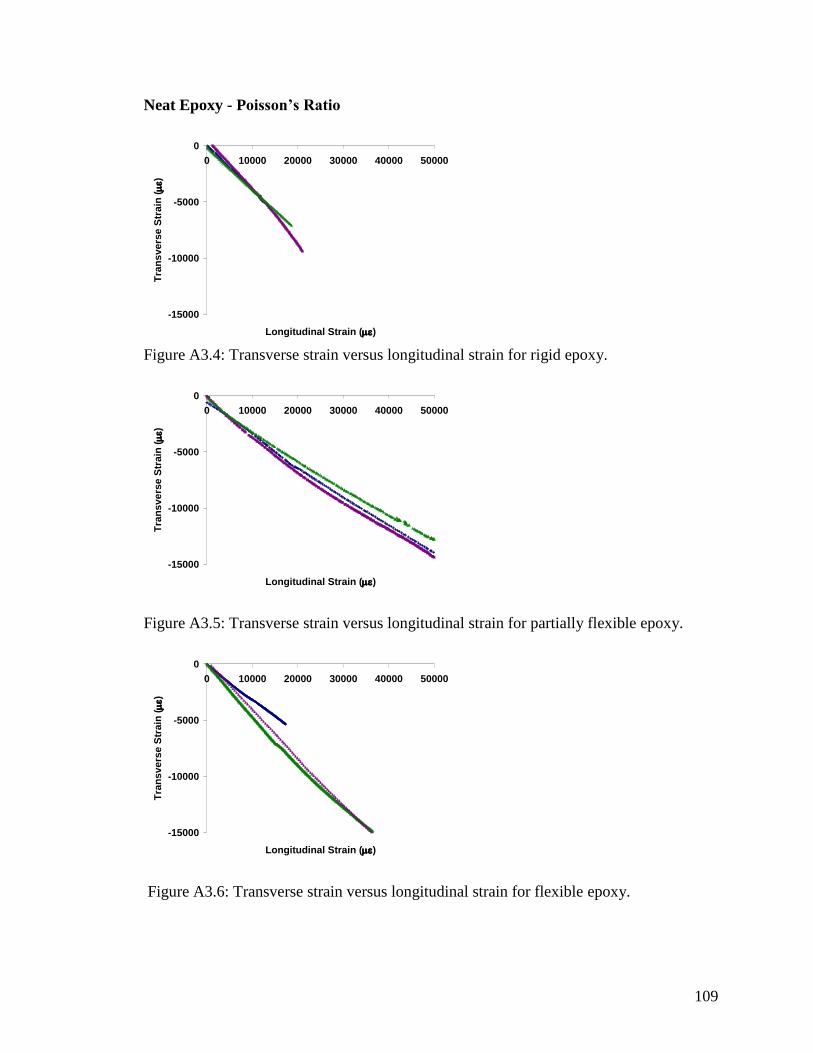
109
Neat Epoxy - Poisson’s Ratio
-15000
-10000
-5000
0
0 10000 20000 30000 40000 50000
Longitudinal Strain ()
Tra
ns
ve
rse
Str
ain
()
Figure A3.4: Transverse strain versus longitudinal strain for rigid epoxy.
-15000
-10000
-5000
0
0 10000 20000 30000 40000 50000
Longitudinal Strain ()
Tra
ns
ve
rse
Str
ain
()
Figure A3.5: Transverse strain versus longitudinal strain for partially flexible epoxy.
-15000
-10000
-5000
0
0 10000 20000 30000 40000 50000
Longitudinal Strain ()
Tra
ns
ve
rse
Str
ain
()
Figure A3.6: Transverse strain versus longitudinal strain for flexible epoxy.

110
Lamina Properties – Transverse Modulus
0
10
20
0.0000 0.0005 0.0010
Strain (m/m)
Str
es
s (
MP
a)
Figure A3.7: Stress versus strain for rigid hoop-wound tubes.
0
10
20
0.0000 0.0005 0.0010
Strain (m/m)
Str
es
s (
MP
a)
Figure A3.8: Stress versus strain for partially flexible hoop-wound tubes.
0
10
20
0.0000 0.0005 0.0010
Strain (m/m)
Str
es
s (
MP
a)
Figure A3.9: Stress versus strain for flexible hoop-wound tubes.

111
Lamina Properties – Shear Modulus
0
10
20
30
40
50
0.000 0.002 0.004 0.006 0.008
12 (m/m)
t 12
(M
Pa
)
Figure A3.10: Shear stress versus shear strain for rigid angle-ply tubes.
0
10
20
30
40
50
0.000 0.002 0.004 0.006 0.008
12 (m/m)
t 12 (
MP
a)
Figure A3.11: Shear stress versus shear strain for partially flexible angle-ply tubes.
0
10
20
30
40
50
0.000 0.002 0.004 0.006 0.008
12 (m/m)
t 12 (
MP
a)
Figure A3.12: Shear stress versus shear strain for flexible angle-ply tubes.

112
Laminate Tubes
Five-Ply Unindented Tubes
0
100
200
300
400
0.000 0.010 0.020
Strain (m/m)
Str
ess (
MP
a)
0
100
200
300
400
0.000 0.010 0.020
Strain (m/m)
Str
ess (
MP
a)
Figure A3.13: Stress versus strain for R5 tubes. Figure A3.14: Stress versus strain for R4F1 tubes.
0
100
200
300
400
0.000 0.010 0.020
Strain (m/m)
Str
ess (
MP
a)
0
100
200
300
400
0.000 0.010 0.020
Strain (m/m)
Str
ess (
MP
a)
Figure A3.15: Stress versus strain for R3F1R1 tubes. Figure A3.16: Stress versus strain for R2F1R2 tubes.
0
100
200
300
400
0.000 0.010 0.020
Strain (m/m)
Str
ess (
MP
a)
0
100
200
300
400
0.000 0.010 0.020
Strain (m/m)
Str
ess (
MP
a)
Figure A3.17: Stress versus strain for R1F1R3 tubes. Figure A3.18: Stress versus strain for F1R4 tubes.

113
Laminate Tubes
Five-Ply Indented Tubes
0
100
200
300
400
0.000 0.010 0.020
Strain (m/m)
Str
ess (
MP
a)
0
100
200
300
400
0.000 0.010 0.020
Strain (m/m)
Str
ess (
MP
a)
Figure A3.19: Stress versus strain for R5 tubes. Figure A3.20: Stress versus strain for R4F1 tubes.
0
100
200
300
400
0.000 0.010 0.020
Strain (m/m)
Str
ess (
MP
a)
0
100
200
300
400
0.000 0.010 0.020
Strain (m/m)
Str
ess (
MP
a)
Figure A3.21: Stress versus strain for R3F1R1 tubes. Figure A3.22: Stress versus strain for R2F1R2 tubes.
0
100
200
300
400
0.000 0.010 0.020
Strain (m/m)
Str
ess (
MP
a)
0
100
200
300
400
0.000 0.010 0.020
Strain (m/m)
Str
ess (
MP
a)
Figure A3.23: Stress versus strain for R1F1R3 tubes. Figure A3.24: Stress versus strain for F1R4 tubes.
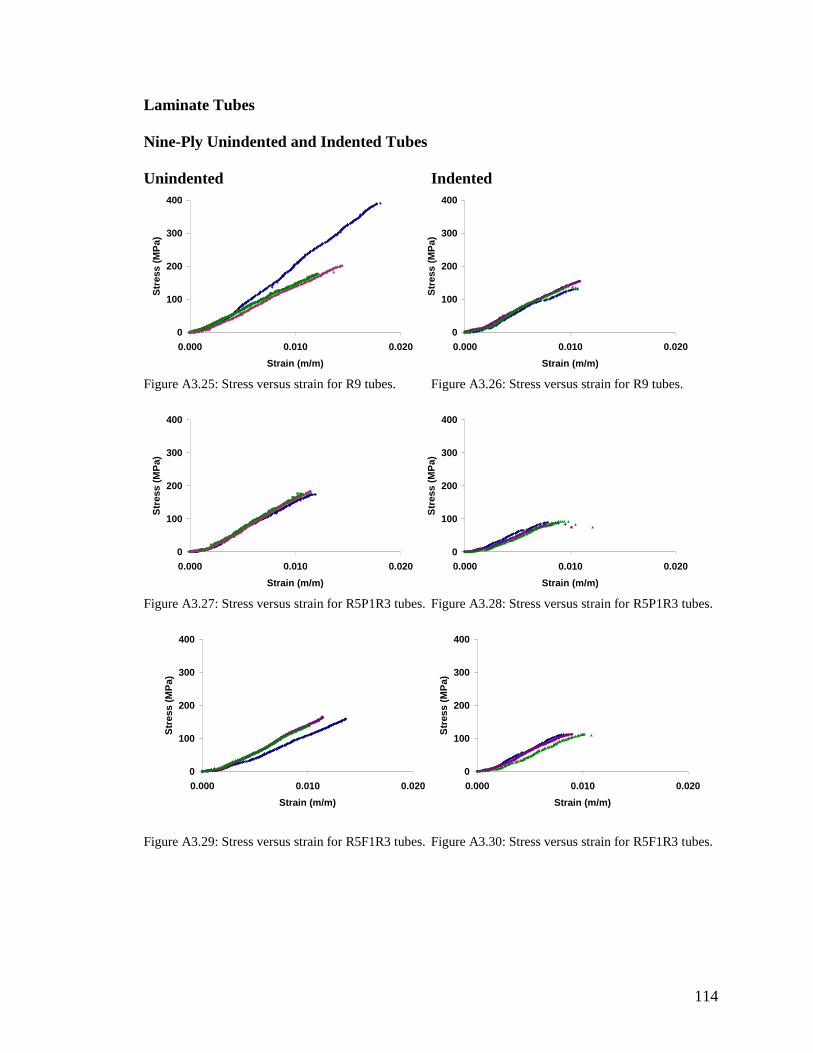
114
Laminate Tubes
Nine-Ply Unindented and Indented Tubes
Unindented Indented
0
100
200
300
400
0.000 0.010 0.020
Strain (m/m)
Str
ess (
MP
a)
0
100
200
300
400
0.000 0.010 0.020
Strain (m/m)
Str
ess (
MP
a)
Figure A3.25: Stress versus strain for R9 tubes. Figure A3.26: Stress versus strain for R9 tubes.
0
100
200
300
400
0.000 0.010 0.020
Strain (m/m)
Str
ess (
MP
a)
0
100
200
300
400
0.000 0.010 0.020
Strain (m/m)
Str
ess (
MP
a)
Figure A3.27: Stress versus strain for R5P1R3 tubes. Figure A3.28: Stress versus strain for R5P1R3 tubes.
0
100
200
300
400
0.000 0.010 0.020
Strain (m/m)
Str
ess (
MP
a)
0
100
200
300
400
0.000 0.010 0.020
Strain (m/m)
Str
ess (
MP
a)
Figure A3.29: Stress versus strain for R5F1R3 tubes. Figure A3.30: Stress versus strain for R5F1R3 tubes.
115
Appendix 4
Non-Technical Abstract
Fiber reinforced polymer composites, materials found in many aerospace
structures, tend to be very brittle and susceptible to damage caused by low velocity
impacts. This study aims to investigate the effect of incorporating a flexible matrix
composite (FMC) layer in a traditional rigid matrix composite (RMC) laminate, thereby
making a layer-wise hybrid (LWH) laminate, on damage resistance and residual strength.
RMC and LWH laminate tubes were fabricated and quasi-statically indented to simulate
low velocity impact. The tube geometry and stacking sequence were chosen to be
representative of a typical rotorcraft blade spar, the specific aerospace structure of
interest in this project. Tubes of two different thickness that had the FMC layer at the
same location that had less matrix cracking also had a higher percent strength retention
than the five- and nine-ply RMC tubes. However, on a simple strength basis, adding an
FMC layer anywhere in the tube was shown to lead to a loss in performance.