Embed Size (px)
Citation preview
NASA Technical Memorandum 110303
Damage-Tolerance Characteristics of Composite Fuselage Sandwich Structures With Thick Facesheets
David M. McGowan and Damodar R. AmburLangley Research Center, Hampton, Virginia
February 1997
National Aeronautics andSpace AdministrationLangley Research CenterHampton, Virginia 23681-0001
1
DAMAGE-TOLERANCE CHARACTERISTICS OF COMPOSITE FUSELAGESANDWICH STRUCTURES WITH THICK FACESHEETS
David M. McGowan and Damodar R. AmburNASA Langley Research Center
Hampton, VA 23681-0001
ABSTRACT
Damage tolerance characteristics and results from experimental and analytical studies of a
composite fuselage keel sandwich structure subjected to low-speed impact damage and discrete-source
damage are presented. The test specimens are constructed from graphite-epoxy skins bonded to a
honeycomb core, and they are representative of a highly loaded fuselage keel structure. Results of
compression-after-impact (CAI) and notch-length sensitivity studies of 5-in.-wide by 10-in-long
specimens are presented. A correlation between low-speed-impact dent depth, the associated damage
area, and residual strength for different impact-energy levels is described; and a comparison of the
strength for undamaged and damaged specimens with different notch-length-to-specimen-width ratios
is presented. Surface strains in the facesheets of the undamaged specimens as well as surface strains
that illustrate the load redistribution around the notch sites in the notched specimens are presented and
compared with results from finite element analyses. Reductions in strength of as much as 53.1 percent
for the impacted specimens and 64.7 percent for the notched specimens are observed.
INTRODUCTION
One of the primary goals of the Advanced Composites Technology (ACT) program is to develop
the enabling technology that will allow composite materials to be used in the primary wing and
fuselage structures of the next generation advanced subsonic transport aircraft. As part of the ACT
program, the Boeing Commercial Aircraft Group (BCAG) has been working to develop cost-effective
and structurally efficient composite fuselage structure.1 The focus of this work has been on the
fuselage section just aft of the main landing gear wheel well of a modern wide-body transport which is
designated as section 46 on a Boeing aircraft. This fuselage section is 33-feet long and 20-feet in
diameter, and contains crown, side and keel quadrant sections as shown in Fig. 1.2 As illustrated in
Fig. 1, the current fuselage design concept utilizes skin-stringer construction in the crown quadrant
section and sandwich construction in the side and keel quadrant sections.
2
Sandwich structures have been used extensively in stiffness-critical aircraft secondary structures.
The application of sandwich structures in aircraft has been restricted in the past due to its undesirable
moisture absorption and moisture retention characteristics, and due to an insufficient understanding of
low-speed impact-damage mechanisms and the effect of such damage, as well as discrete-source
damage, on the structural performance of such structures. Sandwich structures still have the potential
for improved structural efficiency and reduced manufacturing cost. Now that sandwich concepts are
being considered for application to aircraft primary structures, understanding the effects of low-speed
impact damage and penetration damage on sandwich structures has become more important. A joint
NASA/Boeing study has been conducted as part of the ACT program to address of the technology
issues associated with using composite-facesheet sandwich structure in subsonic transport fuselage
side and keel panel applications. This study consisted of manufacturing, testing and analyzing full-
scale keel- and side-quadrant-section sandwich panels.
As part of an ongoing effort to develop keel panel structure for section 46 of the fuselage, a keel
panel representative of the forward part of the section 46 keel was designed and fabricated by the
Boeing Commercial Airplane Group. The panel is constructed from graphite-epoxy facesheets varying
in thickness along the panel length from 50 to 36 plies bonded to a fiberglass honeycomb core. An
experimental and analytical study of this keel panel with thick facesheets was conducted at NASA
Langley Research Center to understand the load distribution and failure mechanisms of the panel with
and without impact and discrete-source damage.3 The impact-damage conditions simulated in the
experimental study of Ref. 3 correspond to barely visible impact damage (BVID). For the test panel
studied, BVID was considered to have occurred when the residual dent depth on the facesheet
measured at the impact site was greater than or equal to 0.05 in. or if the impact-energy level was equal
to 100 ft-lb. The damage conditions at different locations of the panel corresponding to different
impact-energy levels were determined using impact-damage screening-test results from another panel
of the same design. The impact-damage screening-test results indicated that a significant amount of
through-the-thickness damage occurred in the facesheet at much lower impact-energy levels than for
monolithic laminates with the same construction features as the facesheets. Also, for impact-energy
levels as high as 100 ft-lbs, the residual dent-depth values were much less than 0.05 in. for thick
facesheet sandwich plates. These impact-damage characteristics also suggest that, for low-level
impact-energy levels, considerable reduction in compression-after-impact strength occurs for the
sandwich structures, and the reduction in strength could be much greater if a dent-depth value of 0.05
in. was used as a BVID criterion. The dent-depth criterion assumed in the study of Ref. 3 does not
appear to be appropriate for the damage-tolerant design of sandwich structures with thick facesheets
and needs further investigation.
3
Discrete-source damage was simulated in the study of Ref. 3 by machining a 2-in.-long notch
across the specimen width through both facesheets of the panel. The ratio of the specimen width to the
notch length for this specimen condition is equal to 5, which is adequate to avoid boundary effects on
the panel response. There is currently a lack of information on the effect of notch size on the failure
modes and residual strength of compression-loaded sandwich structures with thick facesheets that are
candidates for aircraft primary structural applications.
The present paper describes the results of a compression-after-impact (CAI) study and a notch-
length sensitivity study of specimens machined from the large fuselage test panel studied in Ref. 3.
Experimental results for undamaged specimens will be compared with results from finite element
analyses. The results of the CAI studies will provide a correlation between low-speed-impact dent
depth, the associated damage area, and the residual strength for different impact-energy levels. A
comparison of the undamaged and residual strength of specimens with different specimen-width-to-
notch-length ratios will also be presented. Facesheet surface strains from the experiments that illustrate
the load redistribution around the notch sites will be presented and compared with results from finite
element analyses.
DESCRIPTION OF TEST SPECIMENS
The forward keel panel test article studied in Ref. 3 is representative of the structure that would be
used in the keel quadrant section of the highly compression loaded forward end of fuselage section 46.
As discussed in Ref. 2, the current keel-quadrant-section design utilizes a solid 152-ply laminate at the
forward end of section 46. As the magnitude of the compression loads become smaller towards the
lightly loaded aft end of the keel quadrant section, the structure transitions to a sandwich construction
with 12-ply facesheets at the aft end. To accommodate the changes in the thickness of the facesheets
required to attain this transition, it is necessary that a certain number of plies be terminated or dropped
in the facesheets along the length of the keel quadrant section. The fuselage forward keel panel studied
in Ref. 3 is representative of this type of structure in that it has thick facesheets (≥ 36-ply laminates)
and contains several dropped plies along the panel length.
The test panel studied in Ref. 3 was machined from a larger manufacturing demonstration panel
that was fabricated to gain manufacturing scale-up experience with tow-placed composite structures
with dropped plies.1 This manufacturing demonstration panel, designated FK1, was designed and
fabricated by the Boeing Commercial Airplane Group under NASA contract NAS1-18889 as part of
4
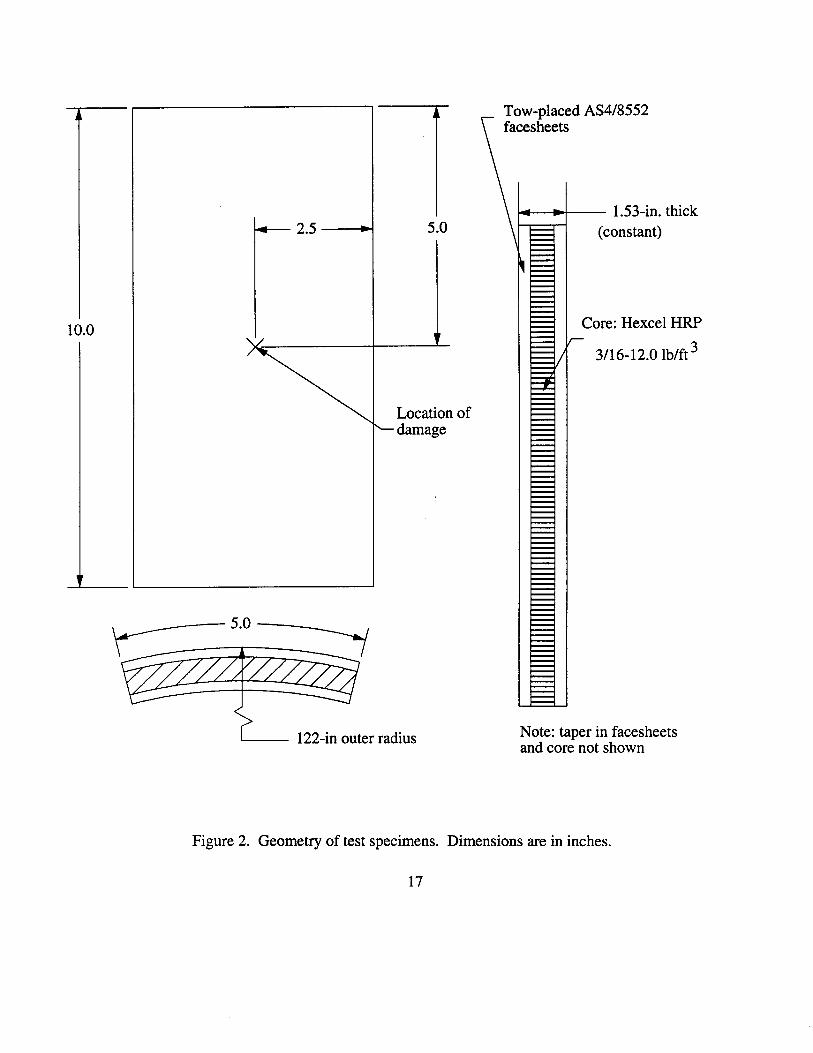
the ACT program. The facesheets are fabricated from Hercules, Inc. AS4/8552 graphite-epoxy pre-
impregnated tow material using a tow placement manufacturing process. The honeycomb core is
Hexcel, Corp. fiberglass Heat Resistant Phenolic (HRP) core material with a 3/16-in. cell size and a
density of 12 lb/ft3. The core is co-bonded to the two facesheets using a film adhesive. Where plies
are dropped in a facesheet, the outer thickness of the sandwich panel is maintained at a constant
thickness by tapering the thickness of the core to match the inner surfaces of the facesheets. The
details of the laminates used and the locations of the dropped plies in this panel are given in Ref. 3.
A total of twelve 5-in.-wide by 10-in.-long specimens were machined from the keel panel in Ref. 3
and the remnants of the larger manufacturing demonstration panel. These specimens have an outer
mold line (OML) radius of curvature of 122 inches, and a constant thickness of 1.53 inches, as shown
in Fig. 2. To obtain the number of specimens necessary for the present study (ten), some of the
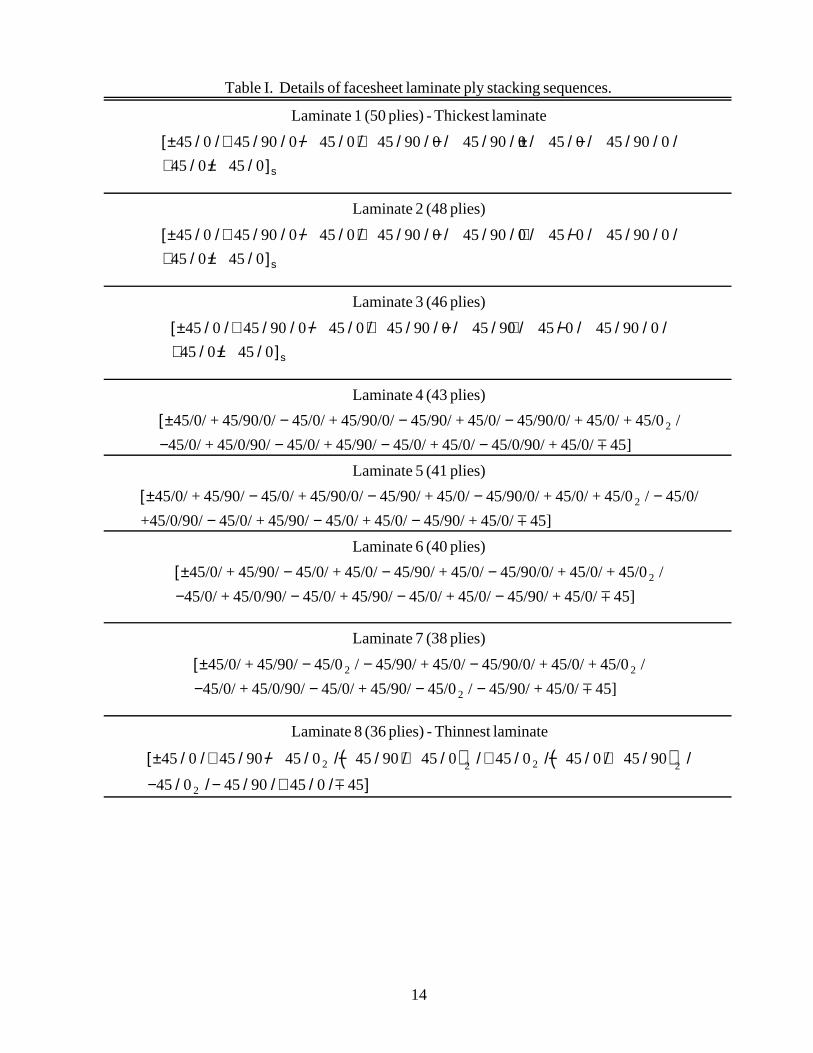
specimens were machined from areas of the panel that contain dropped plies. A total of eight different
laminates appear in five of the ten specimens studied. The ply orientations for these laminates are
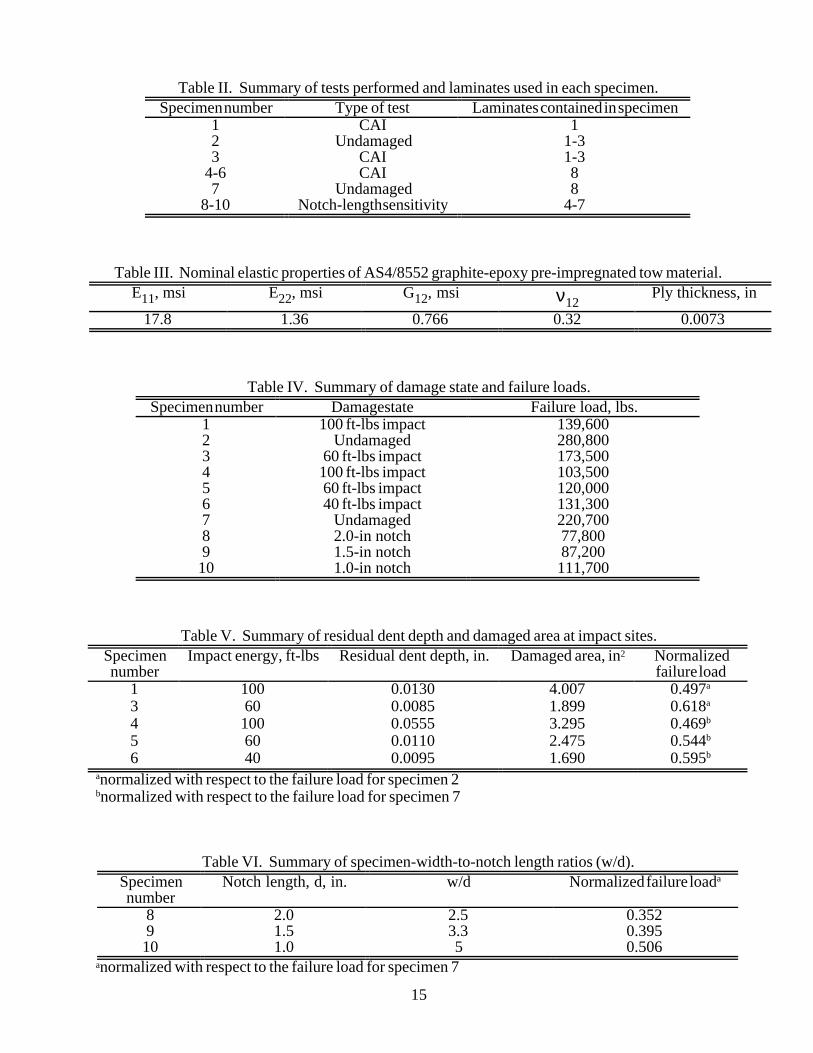
given in Table I. A list of the specimen number, the type of test performed on each specimen, and the
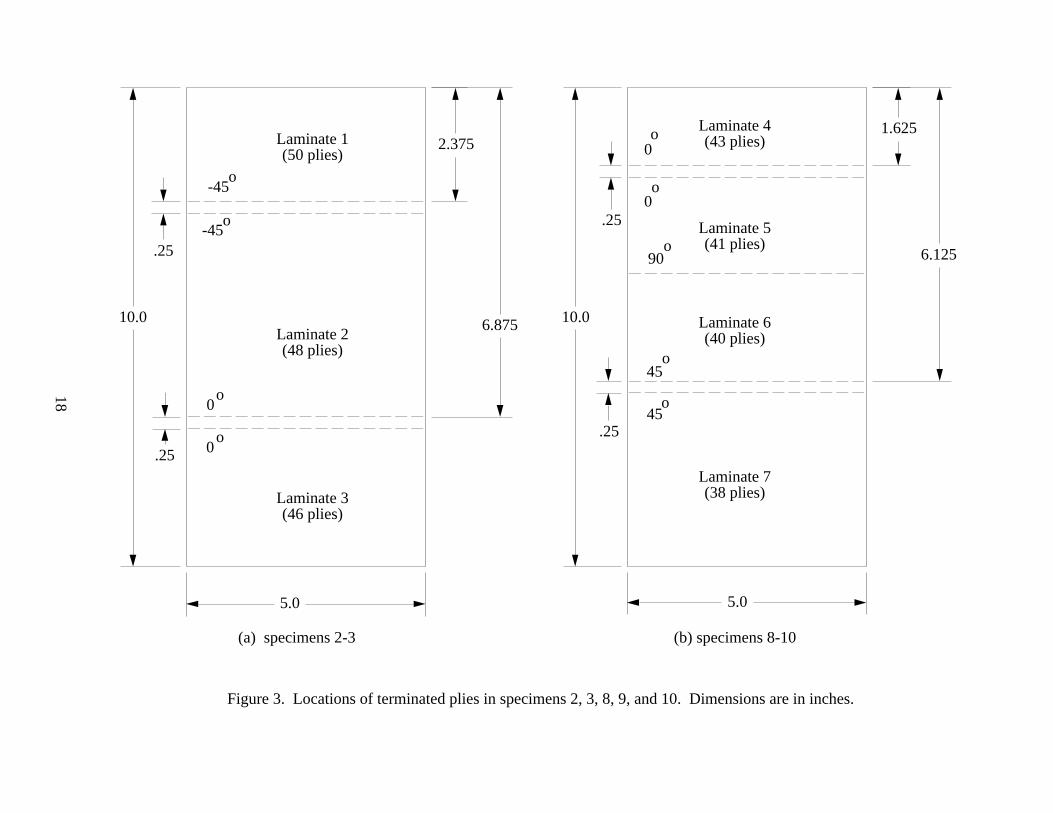
laminates contained in each specimen is given in Table II. As indicated in Table II, specimens 2 and 3
are identical to each other, while specimens 8, 9, and 10 are identical to each other. Schematic
diagrams of these two sets of specimens that show the locations of these laminates in the different test
specimens are given in Fig. 3. In Fig. 3, the dropped plies are represented by dashed lines, and the
orientation of the dropped ply is shown near each line. The nominal elastic properties of the
AS4/8552 pre-impregnated tow material are given in Table III.
APPARATUS AND TEST CONDITIONS
Tests of ten 5-in.-wide by 10-in.-long specimens were conducted. These specimens were tested
with three different damage conditions: undamaged, impact-damaged, and notched. The test matrix for
the study is summarized in Table IV. The impact-energy levels selected for the compression-after-
impact (CAI) tests were based on the results from the impact-damage screening tests presented in Ref.
3. Three notch lengths were selected to provide data for a range of specimen-width-to-notch-length
ratios. The failure loads for all the specimens tested are summarized in Table IV.
The core at the five-inch-wide loaded ends of the specimens was removed to a depth of 0.5 inches,
and epoxy resin material was potted between the facesheets to prevent an end-brooming failure. The
potted ends were machined flat and parallel to each other to assure that a uniform load is applied to the
specimen. The ten-inch-long edges were not supported. For the CAI tests, the OML surface of the
5
panel was painted white so that a shadow moiré interferometry technique could be used to monitor the
out-of-plane displacements and to observe any local response such as delamination buckling and
growth at the impact-damaged sites. For the notch-length sensitivity study, a photoelastic coating was
applied to the OML so that surface strain gradients could be obtained using an optical photoelastic
technique.4 The details of the impact damage levels and the notches are described in the next section.
As indicated previously, a shadow moiré interferometry technique was used for the CAI tests to
monitor out-of-plane displacements of the facesheets and to monitor damage growth around the
damage sites. A 5-in.-wide by 9-in.-long area in the center of the panel was monitored on the convex
surface of the panel. The moiré fringe patterns were recorded using still photography and video
photography. The response of the concave surface of the panel was also recorded using video
photography.
A 0.04-in.-thick PS-1 birefringent photoelastic coating made by the Measurements Group was
used in this study. The photoelastic coating was bonded to the specimen with a premachined notch
using PC-1 adhesive. After curing the adhesive, the notch geometry of the test specimen was
machined into the photoelastic coating to match the test specimen. The response of the thick facesheet
sandwich panels is not expected to be influenced by the photoelastic coating since the photoelastic
coating has negligible inplane stiffness compared to the sandwich facesheet. The fringe coefficient of
the photoelastic coating is 1875 µin./in. per fringe order. A Vishay Model 031 reflection polariscope
was used during the tests to obtain the color fringe information that represents the strain state in the
specimen. The photoelastic fringe patterns were recorded using still photography, and the convex
surface of the specimens were video taped to record the failure of the specimens.
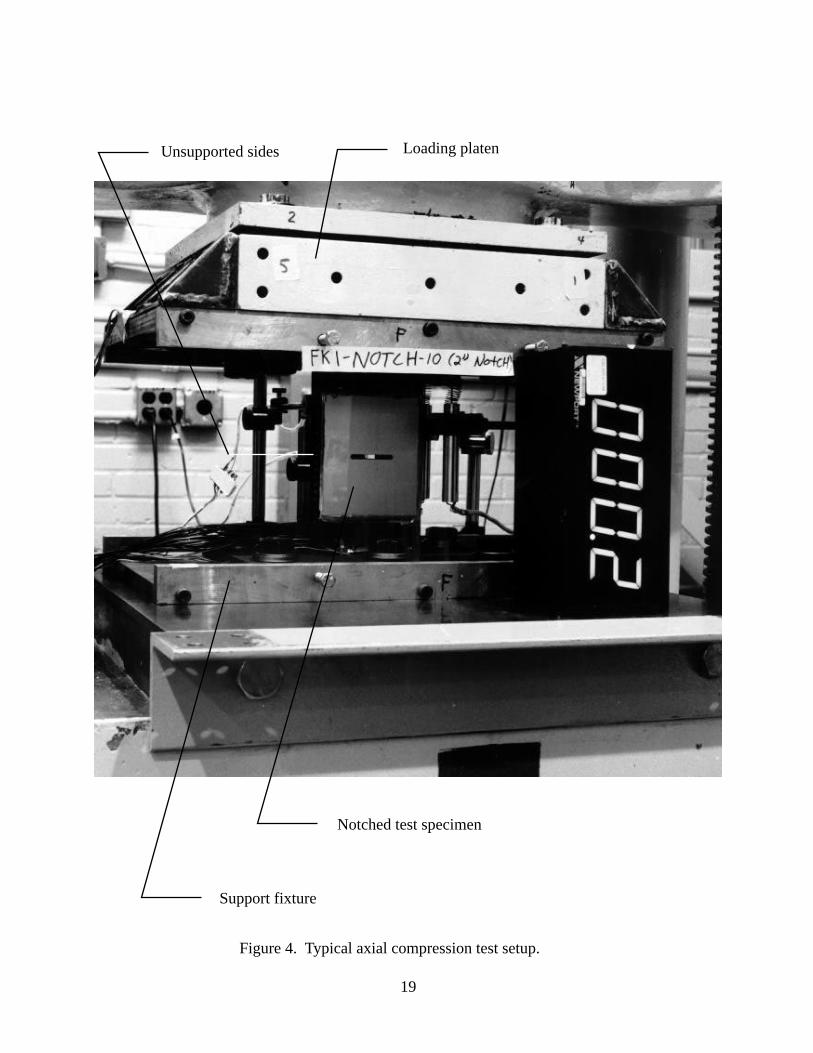
For all tests, the potted ends of the specimens were loaded in uniaxial compression in a 300-kip-
capacity hydraulic test machine. The test setup for the test of a notched specimen is shown in Fig. 4.
The loaded edges of the specimens were clamped into a curved steel support fixture to provide a
clamped boundary condition at those edges. The unloaded edges of the specimens were unsupported.
Surface strains were measured using electrical resistance strain gages. Direct-current displacement
transducers (DCDT’s) were used to measure out-of-plane displacements of the facesheets as well as
the stroke of the test machine loading platen. The locations of the strain gages for the undamaged
specimens are shown in Fig. 5. The locations of the strain gages for the impacted and notched
specimens are shown in Figs. 6 and 7, respectively. The axial load applied to the specimens was
measured using the test machine load cell. The strain gage, DCDT, and load data were recorded using
a digital data acquisition system. Data were taken at one second intervals while loading the specimens
to failure.
6
DESCRIPTION OF DAMAGE CONDITIONS
Both low-speed impact damage and discrete-source damage are simulated in the present study. A
summary of the damage state in which each specimen was tested is presented in Table IV. The
compression-after-impact (CAI) specimens were impacted using a dropped-weight impact apparatus5
with an 11.8-lb mass and a 1-inch-diameter hemispherical tup. Impact energies ranging from 40 ft-lbs
to 100 ft-lbs were used to impact the specimens. A schematic of the specimen support setup used to
impact these specimens is shown in Fig. 8. As shown in the figure, the supports used consist of
curved wooden supports and steel I-beams mounted to a rigid table. The specimens were clamped to
the support beams to minimize specimen rebound after impact. Other specimen response parameters
measured include the residual dent depth at the impact site and the area of the damaged site. The
damage area was measured from the ultrasonic C-scan images of the damage site. The damage area in
the CAI specimens is represented approximately by the circle of radius R in Fig. 6. The value of R for
each specimen is indicated in the figure.
The impact energies used in the present study were selected based upon the results of the impact-
damage screening tests described in Ref. 3. These screening tests showed that significant internal
damage can occur for impact energies that are significantly lower than 100 ft-lbs even when the
residual dent depth at the impact site is much smaller than 0.05 in. Measured values of the residual
dent depth and damage area at the impact sites are summarized in Table V. As seen in the table, a dent
depth value greater than or equal to 0.05 inches only occurred in specimen 4 that was impacted with an
energy level of 100 ft-lbs. This specimen is constructed using the thinnest laminate in the structure (36
plies). The important trend to note in Table V is that a considerable amount of damage occurs for
impact energies well below 100 ft-lbs. Furthermore, although the dent depth is only 0.013 inches for
the thickest specimen (specimen 1) for an impact-energy level of 100 ft-lbs, the damaged area is 4.15
in2. Except for specimen 4, the impact-damage conditions simulated in the present study do not satisfy
the conventional criteria for barely visible impact damage (BVID), and these conditions would be
considered to be non-visible damage. The damaged sites on these specimens exhibited very little
surface damage, and if this damage were to occur in-service on an aircraft structure, it is very likely
that the damage would go undetected during a routine visual inspection. Therefore, for this less than
BVID condition, the performance of the structure must not be degraded below the design strain value
by this damage. The possibility that this type of impact damage might occur during the lifetime of a
civil transport aircraft is not small. It is therefore important that the effect of this type of damage on the
structural response of the fuselage structure be well understood and the appropriate BVID conditions
7
be defined. Results of studies of the effect of low-speed impact damage on the response of composite-
facesheet sandwich structure is given in references 6-10.
Discrete-source damage is simulated in the present study by a notch machined through both
facesheets at the mid-length of the specimen. The details of a typical notch are shown in Fig. 9. As
shown in the figure, the length of the notch is 0.19 inches. Three specimens were tested with notch
lengths varying from 1.0 to 2.0 inches. A summary of the notch lengths and different specimen-
width-to-notch-length ratios is presented in Table VI. The facesheets for all three notched specimens
are identical.
ANALYTICAL MODEL
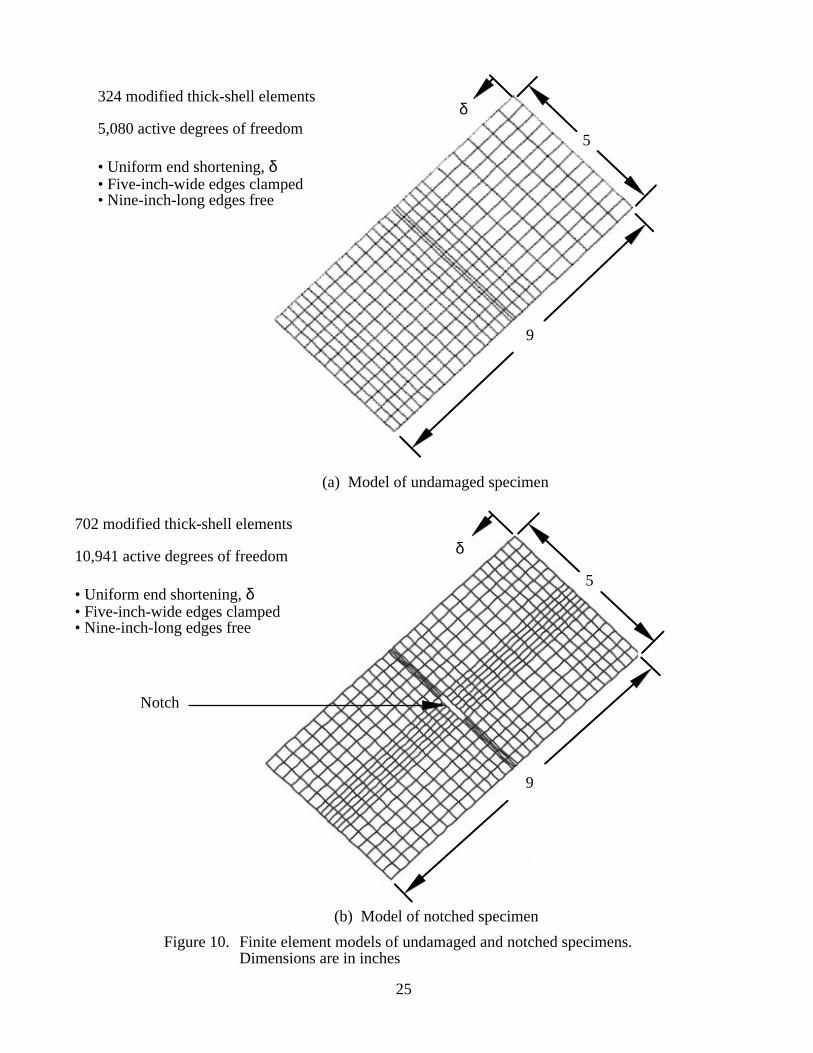
The undamaged and notched specimens were analyzed using the DIAL finite element code.11 The
specimens were modeled as a combination of several sandwich plates each having a different facesheet
stacking sequence and sandwich core thickness. The dropped plies and variations in core thickness in
the test panel were therefore accounted for. An eight-node modified thick-shell element was used for
modeling the plate. These elements are shear deformable and account for the large shear deformations
associated with sandwich construction. The finite element model of an undamaged specimen is shown
in Fig. 10(a). This model has a total of 324 elements and a total of 5,080 active degrees of freedom.
Load is applied to the model by specifying a uniform end shortening, δ, at one of the five-inch-wide
edges, as shown in the figure. The potted ends of the panel in the test fixture are not modeled; thus,
the total length of the model is 9.0 inches. The effect of the potting is simulated by clamping the
loaded edges of the model. The 10-inch-long unloaded edges of the model are free, and the wide-
column buckling load is predicted to be 328 kips. The finite element model of a specimen with a 1-in.-
long notch is shown in Fig. 10(b). This model has a total of 702 elements and a total of 10,941 active
degrees of freedom. As shown in the figure, additional elements are used in the region of the notch to
improve the mesh refinement to better represent the stress gradients in that region.
RESULTS AND DISCUSSION
Experimental results are presented for the CAI and notch-length sensitivity studies, and analytical
results are presented for the undamaged and notched specimens. Experimental load-shortening results
and experimental and analytical global surface strain results are presented and compared for the
8
undamaged specimens. Experimental surface strain results around the impact sites are presented for
the CAI tests. Experimental and analytical surface strain results around the notch sites are compared
for the notch-length sensitivity studies. Finally, the failure modes for the specimens are described.
Compression-After-Impact (CAI) Study
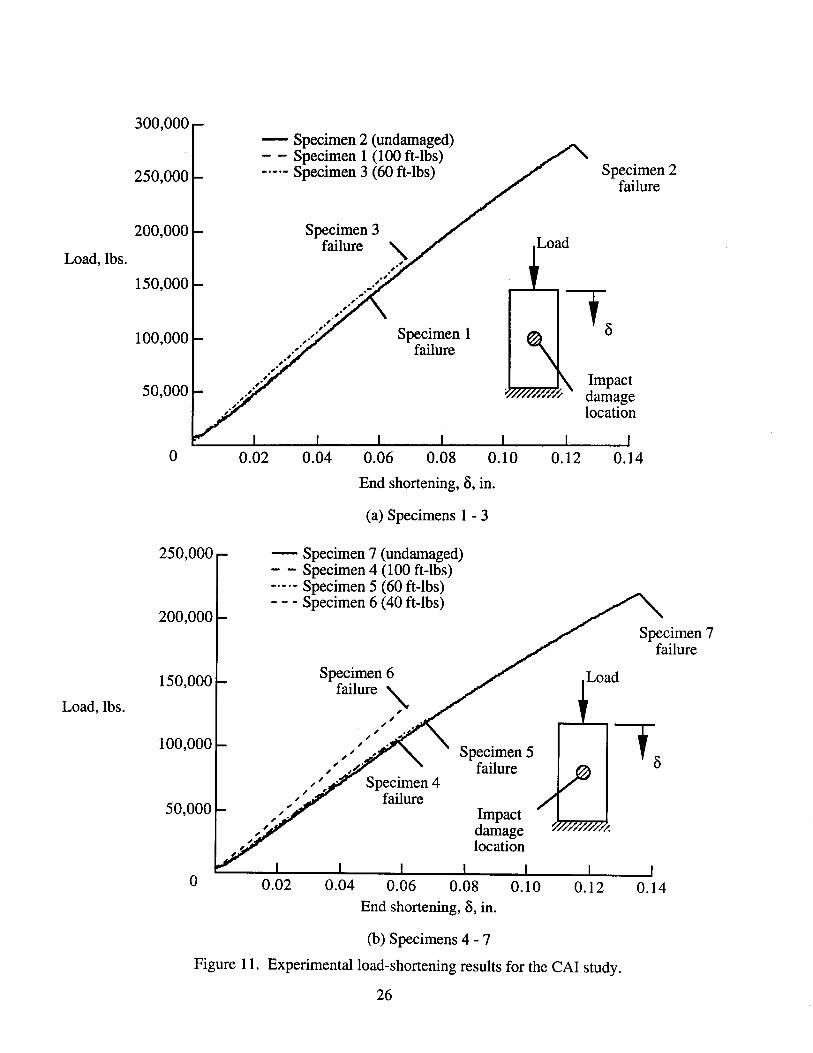
Load-shortening results are presented in Fig. 11(a) for specimens 1-3 and in Fig. 11(b) for
specimens 4-7. As seen in Fig. 11(a), the global stiffness of specimens 1-3 is not affected by the
presence of the impact damage. This trend is also noted for the thinner facesheet specimens 4-7.
Impact damaged specimen 6 exhibited a higher stiffness than the others, which appears to be an
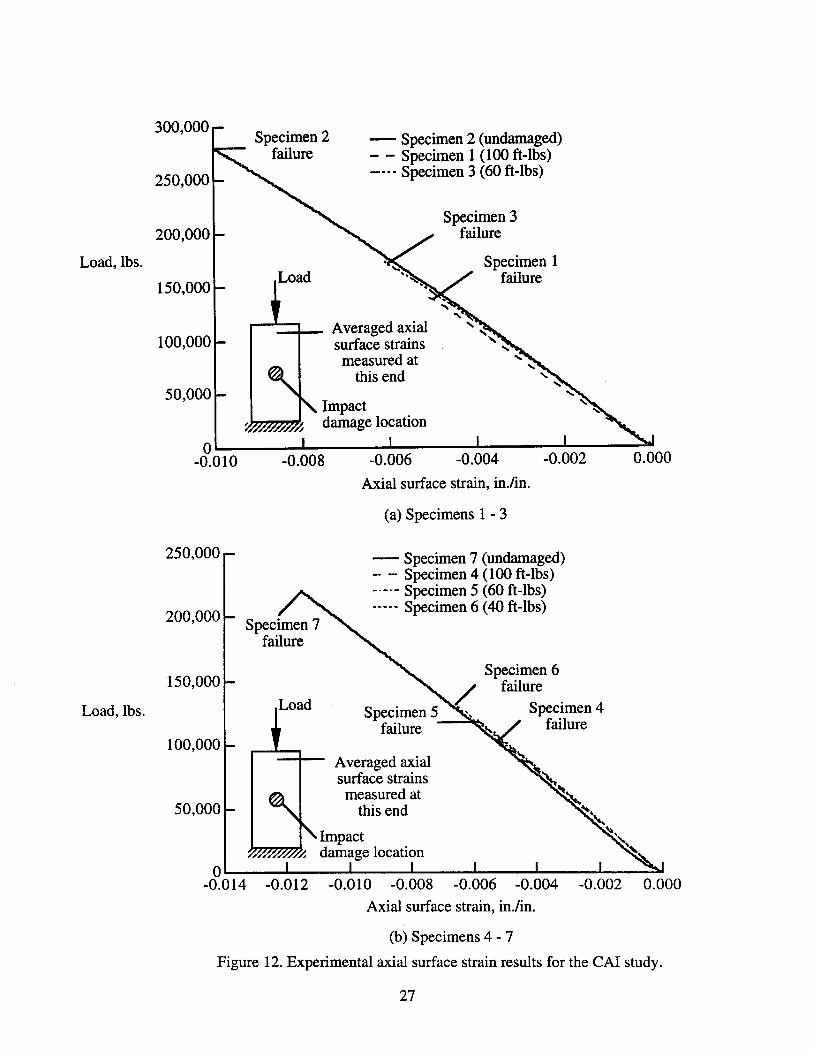
anomaly. Experimental axial surface strain results are presented in Fig. 12(a) for specimens 1 - 3 and
in Fig. 12(b) for specimens 4-7. The surface strain results presented in these figures are far field
results near the loaded edge of the specimens. The strain values presented are averaged values of
back-to-back strain gage pairs near the right and left edges of the specimens. As shown in Figs. 12,
the far field strain values for all of the CAI specimens are very close to one another indicating that the
impact damage has insignificant influence on the global axial stiffness of the specimens. Failure
strains for specimens 1 and 4 with 100 ft-lbs of impact energy are approximately 5,000 µin./in.
suggesting that the current design practice of using 4,000-5,000 µin./in. for the ultimate load condition
is valid.
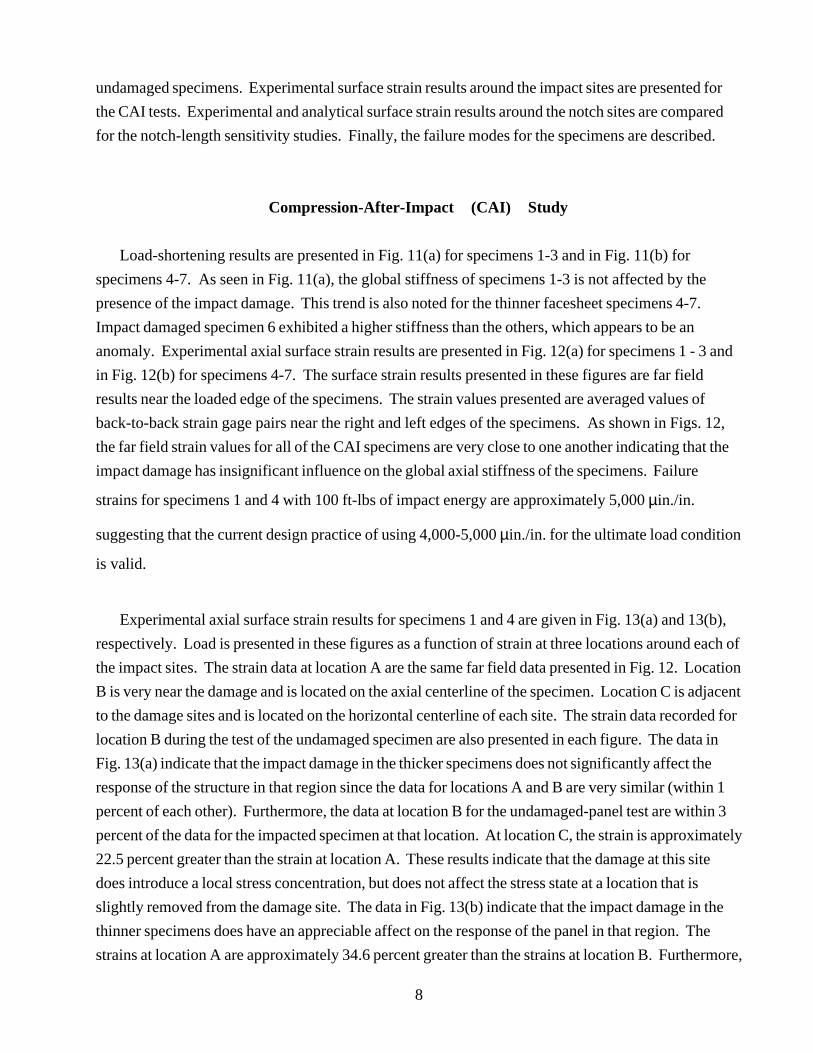
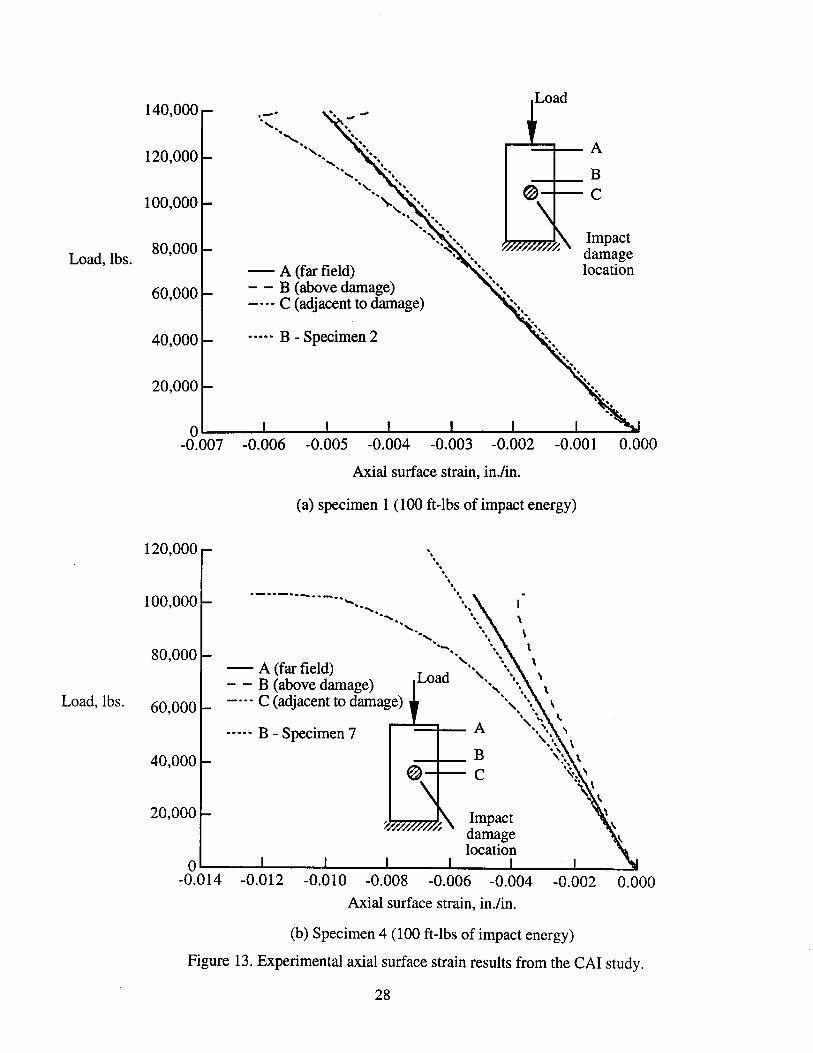
Experimental axial surface strain results for specimens 1 and 4 are given in Fig. 13(a) and 13(b),
respectively. Load is presented in these figures as a function of strain at three locations around each of
the impact sites. The strain data at location A are the same far field data presented in Fig. 12. Location
B is very near the damage and is located on the axial centerline of the specimen. Location C is adjacent
to the damage sites and is located on the horizontal centerline of each site. The strain data recorded for
location B during the test of the undamaged specimen are also presented in each figure. The data in
Fig. 13(a) indicate that the impact damage in the thicker specimens does not significantly affect the
response of the structure in that region since the data for locations A and B are very similar (within 1
percent of each other). Furthermore, the data at location B for the undamaged-panel test are within 3
percent of the data for the impacted specimen at that location. At location C, the strain is approximately
22.5 percent greater than the strain at location A. These results indicate that the damage at this site
does introduce a local stress concentration, but does not affect the stress state at a location that is
slightly removed from the damage site. The data in Fig. 13(b) indicate that the impact damage in the
thinner specimens does have an appreciable affect on the response of the panel in that region. The
strains at location A are approximately 34.6 percent greater than the strains at location B. Furthermore,
9
the strains at location B for the undamaged specimen are 47.4 percent greater than those at location B
for the impacted specimen. This difference in strains represents the effect of the impact damage on the
response of the specimen since the data from location B for the undamaged specimen is close to that
for location A for the impact-damaged specimen. The strains at location C are 2.38 times larger than
those at location A at failure. Therefore, although the damaged area in specimen 4 is smaller than that
in specimen 1, the stress concentration is much larger, and the load redistribution in the specimen is
more extensive.
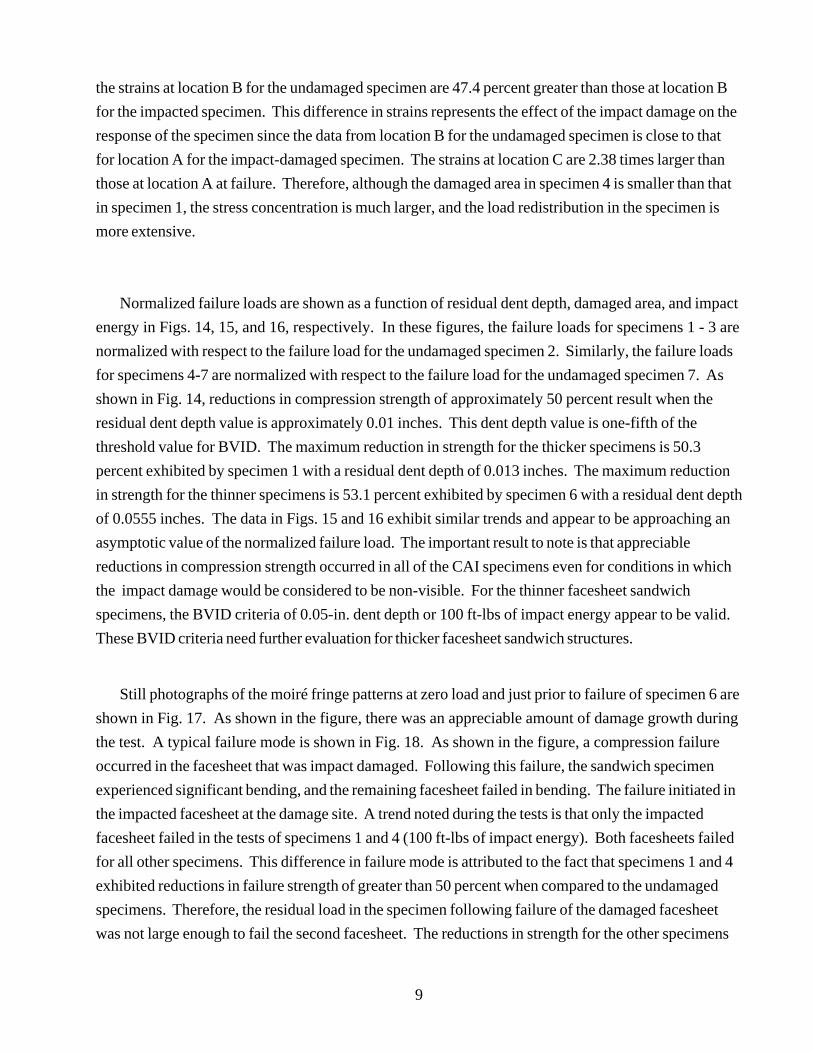
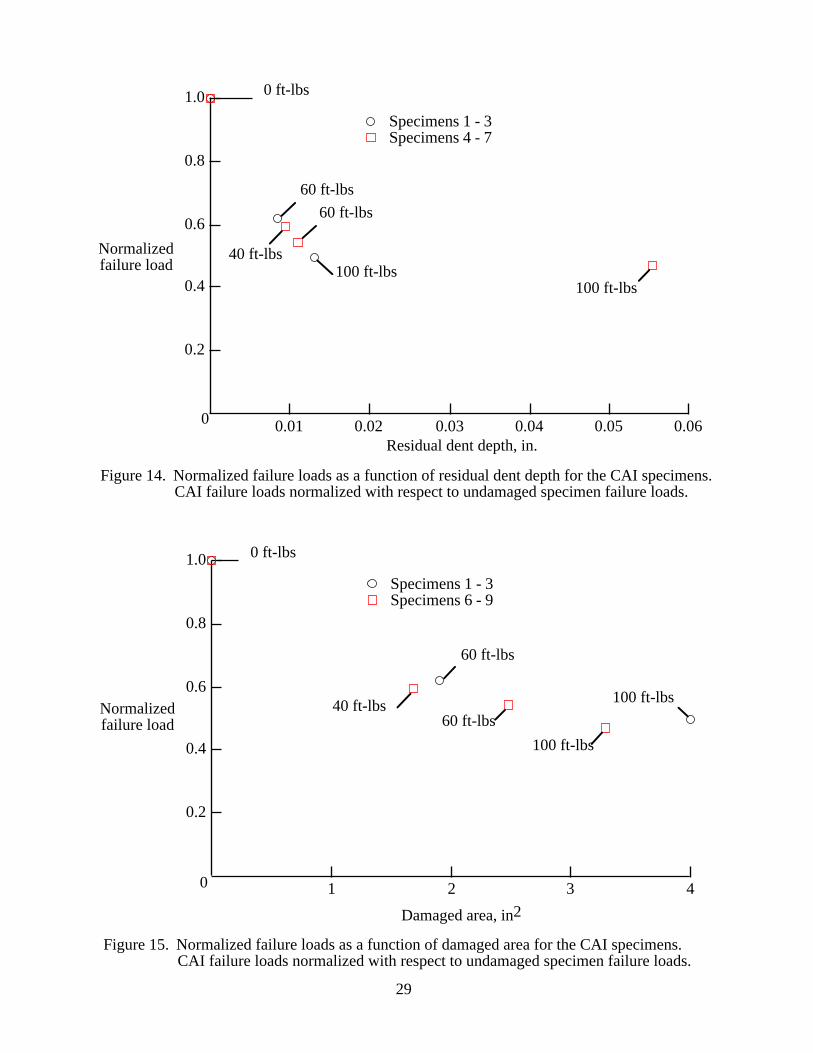
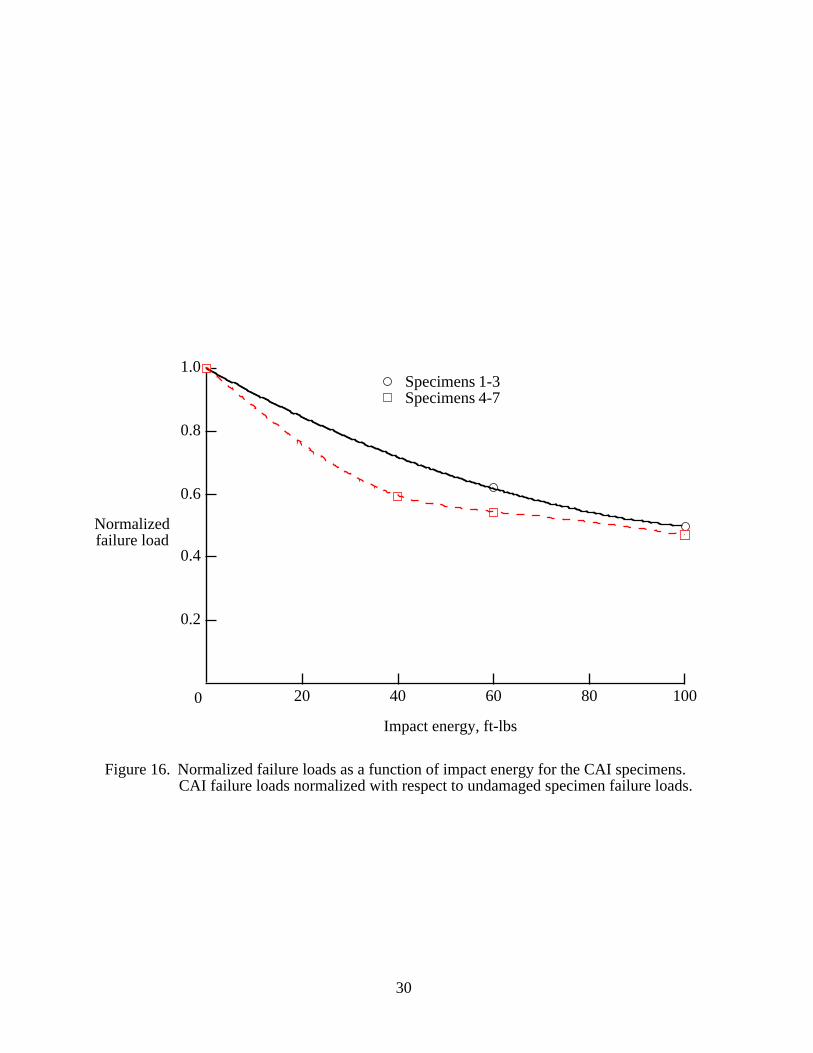
Normalized failure loads are shown as a function of residual dent depth, damaged area, and impact
energy in Figs. 14, 15, and 16, respectively. In these figures, the failure loads for specimens 1 - 3 are
normalized with respect to the failure load for the undamaged specimen 2. Similarly, the failure loads
for specimens 4-7 are normalized with respect to the failure load for the undamaged specimen 7. As
shown in Fig. 14, reductions in compression strength of approximately 50 percent result when the
residual dent depth value is approximately 0.01 inches. This dent depth value is one-fifth of the
threshold value for BVID. The maximum reduction in strength for the thicker specimens is 50.3
percent exhibited by specimen 1 with a residual dent depth of 0.013 inches. The maximum reduction
in strength for the thinner specimens is 53.1 percent exhibited by specimen 6 with a residual dent depth
of 0.0555 inches. The data in Figs. 15 and 16 exhibit similar trends and appear to be approaching an
asymptotic value of the normalized failure load. The important result to note is that appreciable
reductions in compression strength occurred in all of the CAI specimens even for conditions in which
the impact damage would be considered to be non-visible. For the thinner facesheet sandwich
specimens, the BVID criteria of 0.05-in. dent depth or 100 ft-lbs of impact energy appear to be valid.
These BVID criteria need further evaluation for thicker facesheet sandwich structures.
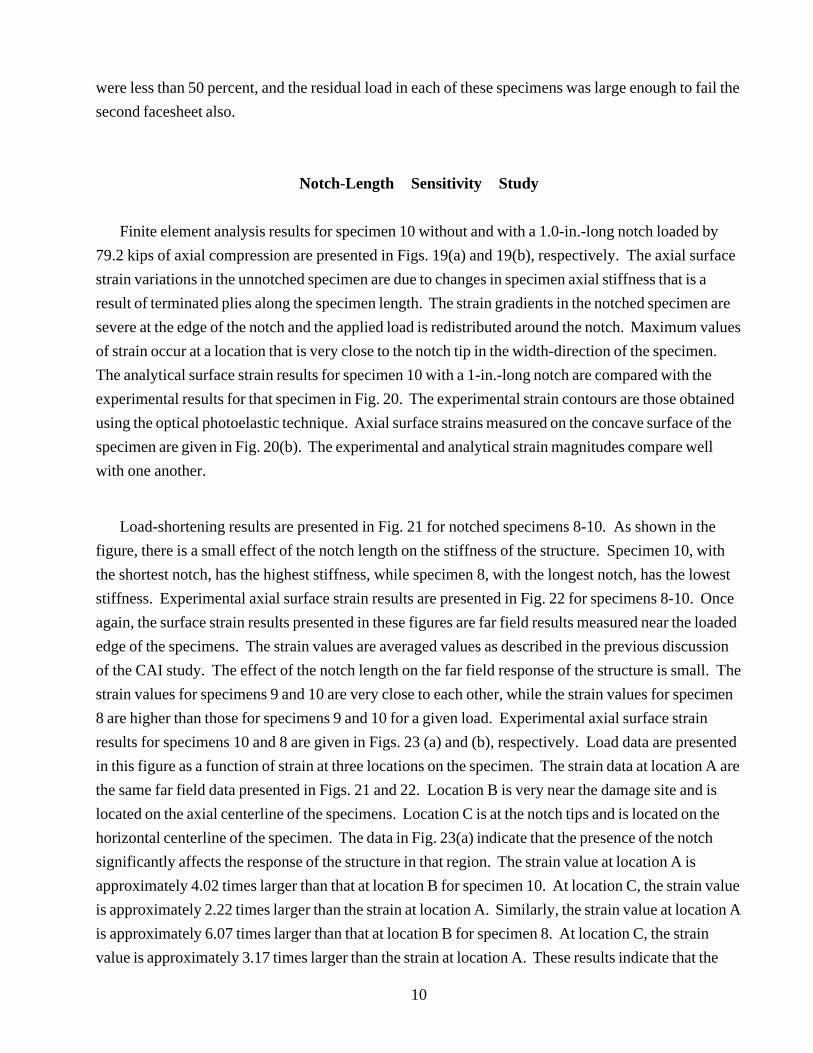
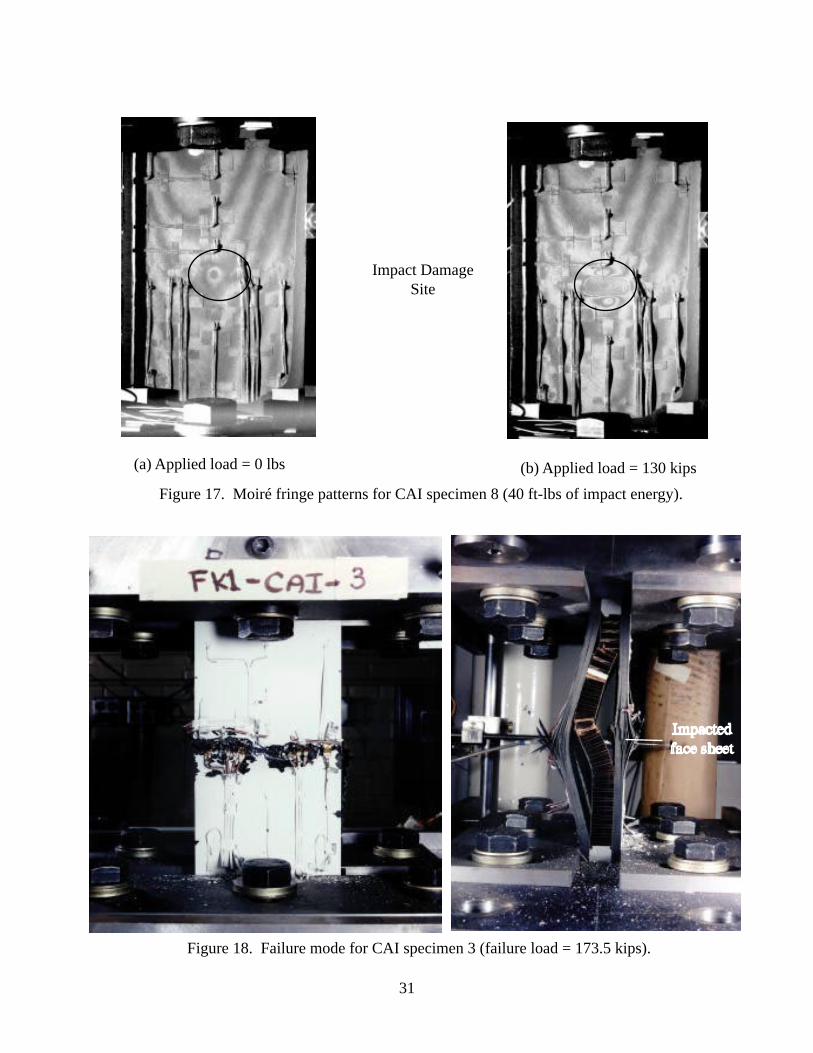
Still photographs of the moiré fringe patterns at zero load and just prior to failure of specimen 6 are
shown in Fig. 17. As shown in the figure, there was an appreciable amount of damage growth during
the test. A typical failure mode is shown in Fig. 18. As shown in the figure, a compression failure
occurred in the facesheet that was impact damaged. Following this failure, the sandwich specimen
experienced significant bending, and the remaining facesheet failed in bending. The failure initiated in
the impacted facesheet at the damage site. A trend noted during the tests is that only the impacted
facesheet failed in the tests of specimens 1 and 4 (100 ft-lbs of impact energy). Both facesheets failed
for all other specimens. This difference in failure mode is attributed to the fact that specimens 1 and 4
exhibited reductions in failure strength of greater than 50 percent when compared to the undamaged
specimens. Therefore, the residual load in the specimen following failure of the damaged facesheet
was not large enough to fail the second facesheet. The reductions in strength for the other specimens
10
were less than 50 percent, and the residual load in each of these specimens was large enough to fail the
second facesheet also.
Notch-Length Sensitivity Study
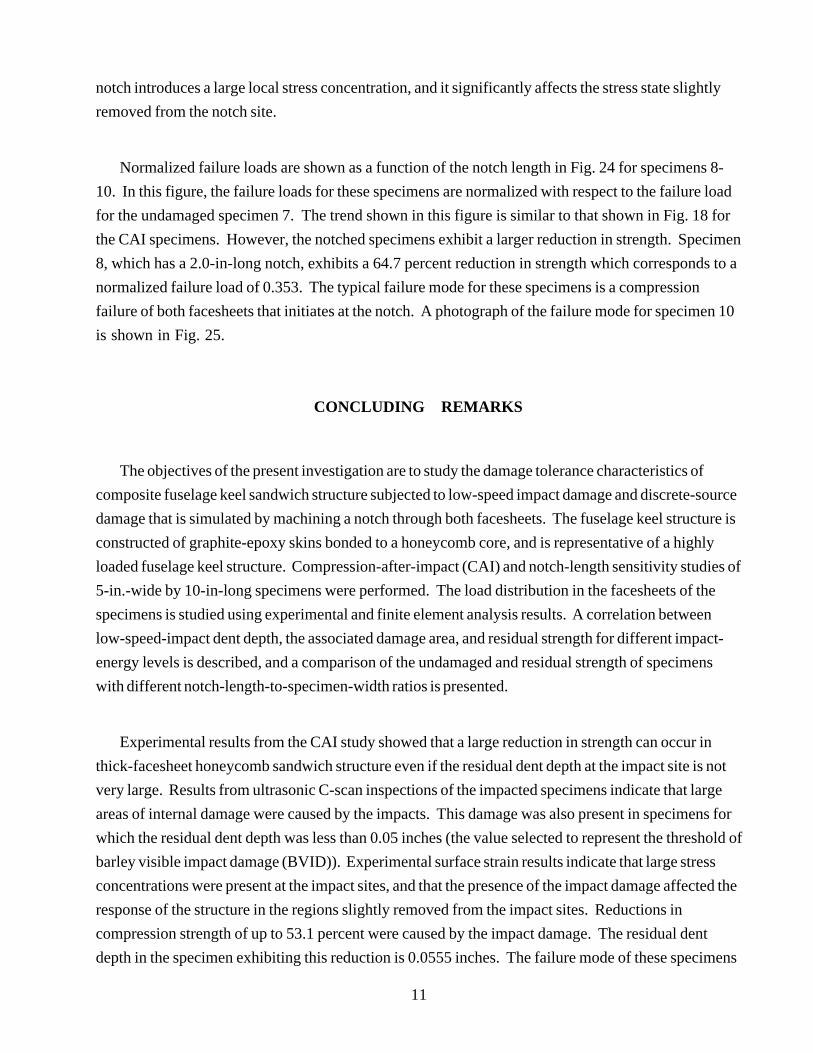
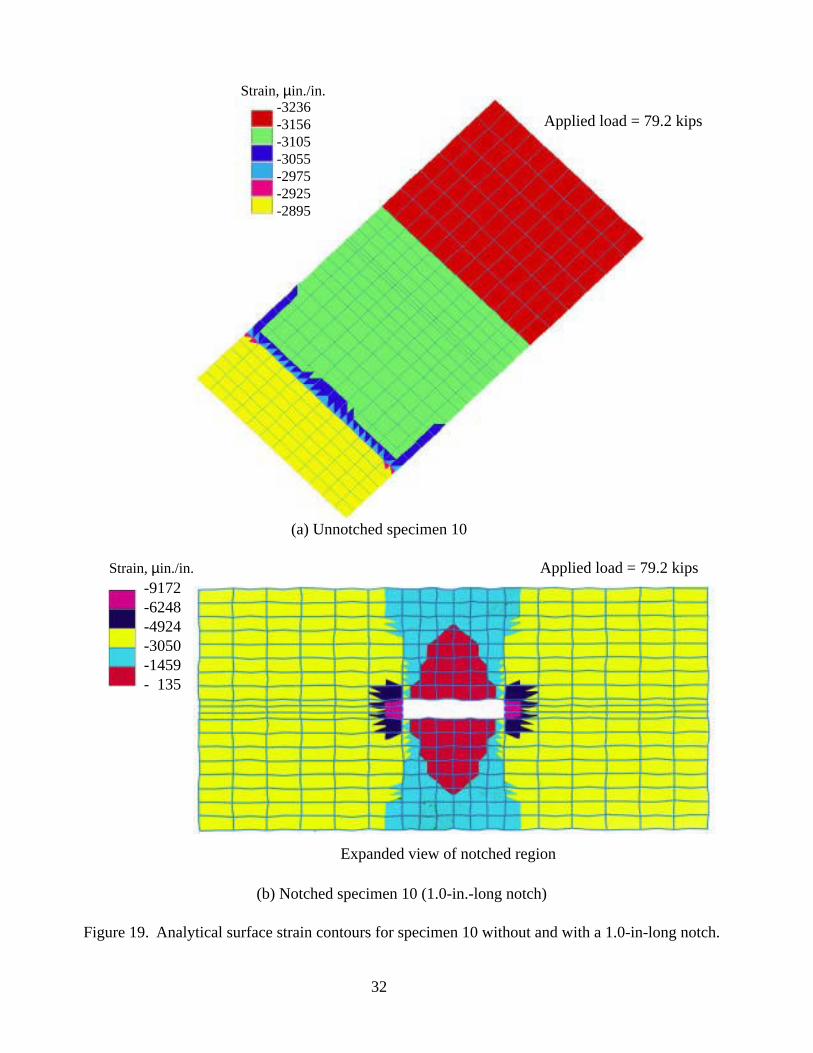
Finite element analysis results for specimen 10 without and with a 1.0-in.-long notch loaded by
79.2 kips of axial compression are presented in Figs. 19(a) and 19(b), respectively. The axial surface
strain variations in the unnotched specimen are due to changes in specimen axial stiffness that is a
result of terminated plies along the specimen length. The strain gradients in the notched specimen are
severe at the edge of the notch and the applied load is redistributed around the notch. Maximum values
of strain occur at a location that is very close to the notch tip in the width-direction of the specimen.
The analytical surface strain results for specimen 10 with a 1-in.-long notch are compared with the
experimental results for that specimen in Fig. 20. The experimental strain contours are those obtained
using the optical photoelastic technique. Axial surface strains measured on the concave surface of the
specimen are given in Fig. 20(b). The experimental and analytical strain magnitudes compare well
with one another.
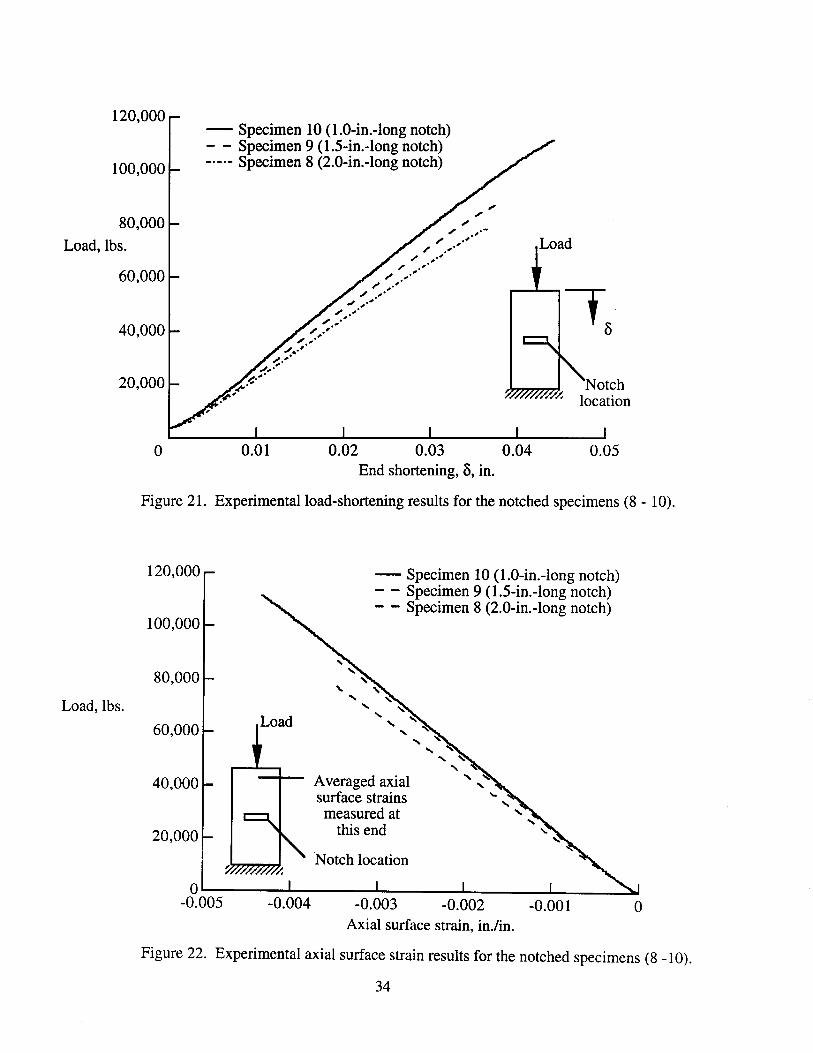
Load-shortening results are presented in Fig. 21 for notched specimens 8-10. As shown in the
figure, there is a small effect of the notch length on the stiffness of the structure. Specimen 10, with
the shortest notch, has the highest stiffness, while specimen 8, with the longest notch, has the lowest
stiffness. Experimental axial surface strain results are presented in Fig. 22 for specimens 8-10. Once
again, the surface strain results presented in these figures are far field results measured near the loaded
edge of the specimens. The strain values are averaged values as described in the previous discussion
of the CAI study. The effect of the notch length on the far field response of the structure is small. The
strain values for specimens 9 and 10 are very close to each other, while the strain values for specimen
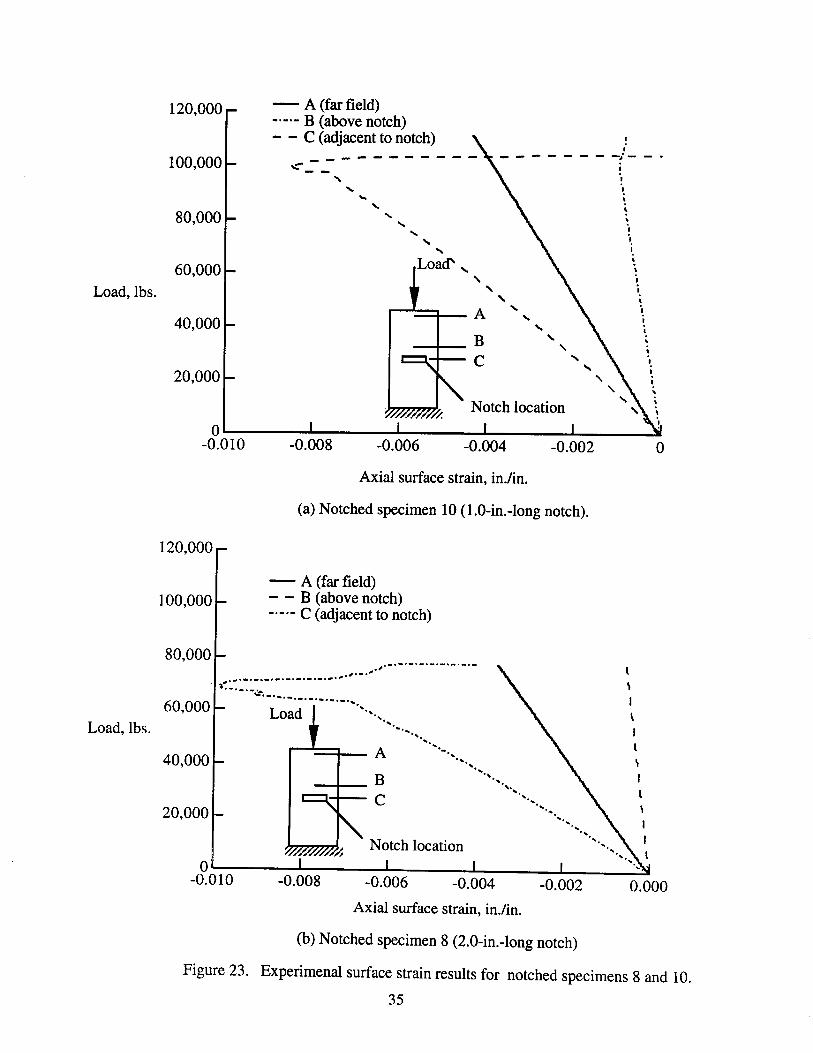
8 are higher than those for specimens 9 and 10 for a given load. Experimental axial surface strain
results for specimens 10 and 8 are given in Figs. 23 (a) and (b), respectively. Load data are presented
in this figure as a function of strain at three locations on the specimen. The strain data at location A are
the same far field data presented in Figs. 21 and 22. Location B is very near the damage site and is
located on the axial centerline of the specimens. Location C is at the notch tips and is located on the
horizontal centerline of the specimen. The data in Fig. 23(a) indicate that the presence of the notch
significantly affects the response of the structure in that region. The strain value at location A is
approximately 4.02 times larger than that at location B for specimen 10. At location C, the strain value
is approximately 2.22 times larger than the strain at location A. Similarly, the strain value at location A
is approximately 6.07 times larger than that at location B for specimen 8. At location C, the strain
value is approximately 3.17 times larger than the strain at location A. These results indicate that the
11
notch introduces a large local stress concentration, and it significantly affects the stress state slightly
removed from the notch site.
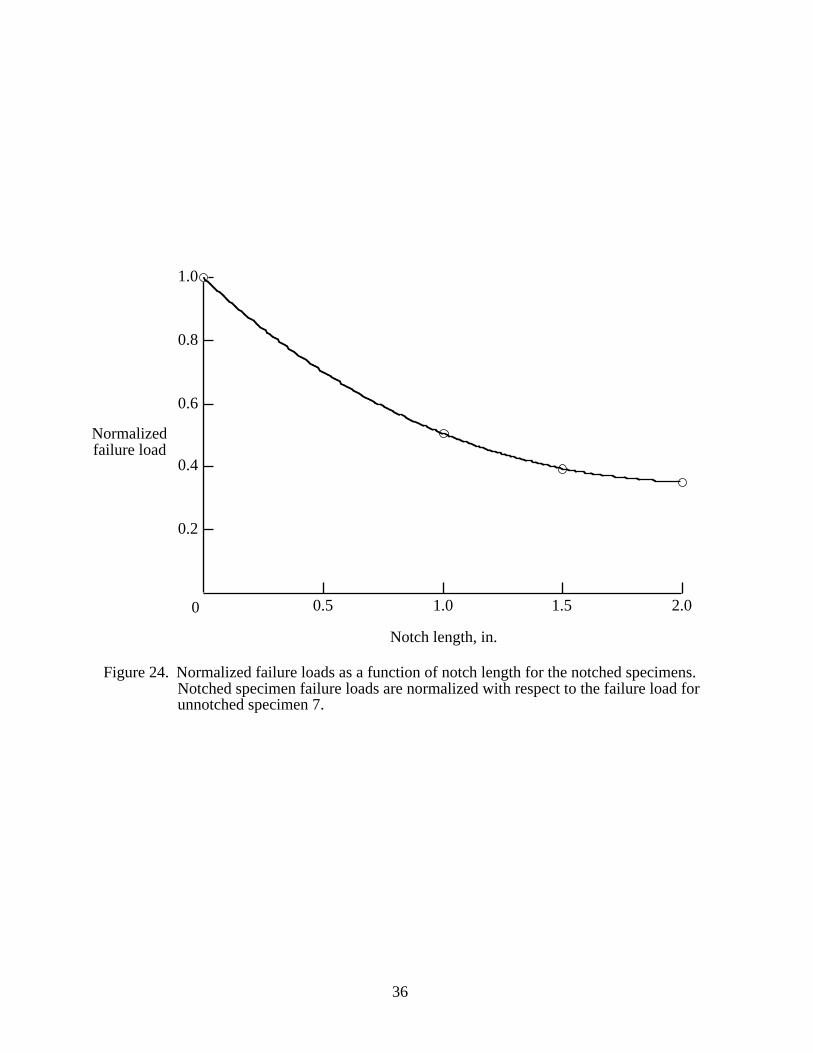
Normalized failure loads are shown as a function of the notch length in Fig. 24 for specimens 8-
10. In this figure, the failure loads for these specimens are normalized with respect to the failure load
for the undamaged specimen 7. The trend shown in this figure is similar to that shown in Fig. 18 for
the CAI specimens. However, the notched specimens exhibit a larger reduction in strength. Specimen
8, which has a 2.0-in-long notch, exhibits a 64.7 percent reduction in strength which corresponds to a
normalized failure load of 0.353. The typical failure mode for these specimens is a compression
failure of both facesheets that initiates at the notch. A photograph of the failure mode for specimen 10
is shown in Fig. 25.
CONCLUDING REMARKS
The objectives of the present investigation are to study the damage tolerance characteristics of
composite fuselage keel sandwich structure subjected to low-speed impact damage and discrete-source
damage that is simulated by machining a notch through both facesheets. The fuselage keel structure is
constructed of graphite-epoxy skins bonded to a honeycomb core, and is representative of a highly
loaded fuselage keel structure. Compression-after-impact (CAI) and notch-length sensitivity studies of
5-in.-wide by 10-in-long specimens were performed. The load distribution in the facesheets of the
specimens is studied using experimental and finite element analysis results. A correlation between
low-speed-impact dent depth, the associated damage area, and residual strength for different impact-
energy levels is described, and a comparison of the undamaged and residual strength of specimens
with different notch-length-to-specimen-width ratios is presented.
Experimental results from the CAI study showed that a large reduction in strength can occur in
thick-facesheet honeycomb sandwich structure even if the residual dent depth at the impact site is not
very large. Results from ultrasonic C-scan inspections of the impacted specimens indicate that large
areas of internal damage were caused by the impacts. This damage was also present in specimens for
which the residual dent depth was less than 0.05 inches (the value selected to represent the threshold of
barley visible impact damage (BVID)). Experimental surface strain results indicate that large stress
concentrations were present at the impact sites, and that the presence of the impact damage affected the
response of the structure in the regions slightly removed from the impact sites. Reductions in
compression strength of up to 53.1 percent were caused by the impact damage. The residual dent
depth in the specimen exhibiting this reduction is 0.0555 inches. The failure mode of these specimens
12
is a compression failure that initiates at the impact damage site of the impact-damaged facesheet and a
bending failure of the undamaged facesheet and. From the results of this investigation, it appears that
the 0.05-in. dent depth or 100 ft-lbs of impact energy BVID criteria are applicable only to sandwich
structures with a certain thickness facesheet and different criteria are required for thick-facesheet
sandwich structures.
Experimental results from the notch-length sensitivity study show that large reductions in
compression strength occur for notched thick-facesheet honeycomb sandwich structure. Experimental
surface strain results indicate that large stress concentrations were present at the notch sites, and that
the presence of the notch affected the response of the structure in the regions slightly removed from the
impact sites. Reductions in compression strength of up to 64.7 percent are noted. The failure mode of
these specimens is a compression failure of both facesheets that initiates at the notch.
REFERENCES
1. Smith, P. J.; Ilcewicz, L. B.; and Olson, J. T.: Advanced Technology Composite Fuselage.
Proceedings of the Fifth NASA/DoD/ARPA Advanced Composites Technology Conference, NASA
CP-3294, 1995, pp. 1-31.
2. Avery, W. B.; Flynn, B. W.; Hanson, C. T.; Scholz, D. B.; Murphy, D. P.; Carberry, D. J.;
Dopker, B.; Williams, A. M.; and Ilcewicz, L. B.: Design and Structural Development of a
Composite Fuselage Keel Panel. Proceedings of the Fifth NASA/DoD/ARPA Advanced Composites
Technology Conference, NASA CP-3294, 1995, pp. 463-496.
3. McGowan, D. M.; and Ambur, D. R.: Compression Response of a Sandwich Fuselage Keel Panel
With and Without Damage. Presented at the Sixth NASA/DoD/ARPA Advanced Composites
Technology Conference, Anaheim, CA, August 7-11, 1995.
4. Dally, J. W.; and Riley, W. F.: Experimental Stress Analysis, Third Edition., Chapters 12-13.McGraw-Hill, Inc., New York, NY, 1991.
5. Ambur, D. R.; Prasad, C. B.; and Waters, W. A.: An Internally Damped, Self-Arresting Dropped
Weight Apparatus for Studying the Low-Speed Impact Response of Composite Structures. Journal of
Experimental Mechanics, Vol. 33, No. 1, March 1995, pp. 64-69.
13
6. Ambur, D. R.; and Cruz, J. R.: Low-Speed Impact Response Characteristics of Composite
Sandwich Plates. AIAA Paper 95-1460, April 1995.
7. Bernard, M. L.; and Lagace, P. A.: Impact Resistance of Composite Sandwich Plates. Journal of
Reinforced Plastics and Composites, Vol. 8, September 1989, pp. 432-445.
8. Tsang, P. H. W.; and Dugundji, J.: Damage Resistance of Graphite-Epoxy Sandwich Panels
Under Low Speed Impacts. Journal of the American Helicopter Society, Vol. 37, No. 1, January
1992, pp. 75-81.
9. Koller, M. G.: Elastic Impact of Spheres on Sandwich Plates. Journal of Applied Mathematics
and Physics, Vol. 37, March 1986, pp. 256-269.
10. Lee, L. J.; Huang, K. Y.; and Fann, Y. J.: Dynamic Responses of Composite Sandwich Plates
Impacted by a Rigid Ball. Journal of Composite Materials, Vol. 27, No. 13, 1993, pp. 1238-1256.
11. Anonymous: DIAL Finite Element Structural Analysis System, Version L3D3. Lockheed
Missiles and Space Company, August, 1991.
14
Table I. Details of facesheet laminate ply stacking sequences.
Laminate 1 (50 plies) - Thickest laminate
[ / / / / / / / / / / / / / / / / / /
/ / / ]
± + − + − ± −+ ±
45 0 45 90 0 45 0 45 90 0 45 90 0 45 0 45 90 0
45 0 45 0 s
Laminate 2 (48 plies)
[ / / / / / / / / / / / / / / / / / /
/ / / ]
± + − + − + −+ ±
45 0 45 90 0 45 0 45 90 0 45 90 0 45 0 45 90 0
45 0 45 0 s
Laminate 3 (46 plies)
[ / / / / / / / / / / / / / / / / /
/ / / ]
± + − + − + −+ ±
45 0 45 90 0 45 0 45 90 0 45 90 45 0 45 90 0
45 0 45 0 s
Laminate 4 (43 plies)
[± − − −− − − −
45/0/ + 45/90/0/ 45/0/ + 45/90/0/ 45/90/ + 45/0/ 45/90/0/ + 45/0/ + 45/0 /
45/0/ + 45/0/90/ 45/0/ + 45/90/ 45/0/ + 45/0/ 45/0/90/ + 45/0/ 45]2
m
Laminate 5 (41 plies)
[± − − − −− − −
45/0/ + 45/90/ 45/0/ + 45/90/0/ 45/90/ + 45/0/ 45/90/0/ + 45/0/ + 45/0 / 45/0/
+45/0/90/ 45/0/ + 45/90/ 45/0/ + 45/0/ 45/90/ + 45/0/ 45]2
m
Laminate 6 (40 plies)
[± − − −− − − −
45/0/ + 45/90/ 45/0/ + 45/0/ 45/90/ + 45/0/ 45/90/0/ + 45/0/ + 45/0 /
45/0/ + 45/0/90/ 45/0/ + 45/90/ 45/0/ + 45/0/ 45/90/ + 45/0/ 45]2
m
Laminate 7 (38 plies)
[± − − −− − − −
45/0/ + 45/90/ 45/0 / 45/90/ + 45/0/ 45/90/0/ + 45/0/ + 45/0 /
45/0/ + 45/0/90/ 45/0/ + 45/90/ 45/0 / 45/90/ + 45/0/ 45]2 2
2 m
Laminate 8 (36 plies) - Thinnest laminate
[ / / / / / / / / / / / / / / / /
/ / / / / / ]
± + − − +( ) + − +( )− − +
45 0 45 90 45 0 45 90 45 0 45 0 45 0 45 90
45 0 45 90 45 0 45
2 2 2 2
2 m
15
Table II. Summary of tests performed and laminates used in each specimen.Specimen number Type of test Laminates contained in specimen
1 CAI 12 Undamaged 1-33 CAI 1-3
4-6 CAI 87 Undamaged 8
8-10 Notch-length sensitivity 4-7
Table III. Nominal elastic properties of AS4/8552 graphite-epoxy pre-impregnated tow material.E11, msi E22, msi G12, msi ν12
Ply thickness, in
17.8 1.36 0.766 0.32 0.0073
Table IV. Summary of damage state and failure loads.Specimen number Damage state Failure load, lbs.
1 100 ft-lbs impact 139,6002 Undamaged 280,8003 60 ft-lbs impact 173,5004 100 ft-lbs impact 103,5005 60 ft-lbs impact 120,0006 40 ft-lbs impact 131,3007 Undamaged 220,7008 2.0-in notch 77,8009 1.5-in notch 87,20010 1.0-in notch 111,700
Table V. Summary of residual dent depth and damaged area at impact sites.Specimennumber
Impact energy, ft-lbs Residual dent depth, in. Damaged area, in2 Normalizedfailure load
1 100 0.0130 4.007 0.497a
3 60 0.0085 1.899 0.618a
4 100 0.0555 3.295 0.469b
5 60 0.0110 2.475 0.544b
6 40 0.0095 1.690 0.595b
anormalized with respect to the failure load for specimen 2bnormalized with respect to the failure load for specimen 7
Table VI. Summary of specimen-width-to-notch length ratios (w/d).Specimennumber
Notch length, d, in. w/d Normalized failure loada
8 2.0 2.5 0.3529 1.5 3.3 0.39510 1.0 5 0.506
anormalized with respect to the failure load for specimen 7

Aft fuselage Section 46
Exploded view
Side quadrant - sandwich
Crown quadrant - skin stringer
Keel quadrant - sandwich
Figure 1. Details of a generic wide-body transport aircraft fuselage structure.
16
2.375
6.875
.25
.25
5.0
10.0
Laminate 1(50 plies)
Laminate 3(46 plies)
Laminate 2(48 plies)
1.625
.25
.25
6.125
5.0
10.0
Laminate 4(43 plies)
Laminate 5(41 plies)
Laminate 6(40 plies)
Laminate 7(38 plies)
Figure 3. Locations of terminated plies in specimens 2, 3, 8, 9, and 10. Dimensions are in inches.
(a) specimens 2-3 (b) specimens 8-10
-45
45
45
90
0
0
o
-45o
0o
0o
o
o
o
o
o
18
Notched test specimen
Support fixture
Loading platen
Figure 4. Typical axial compression test setup.
Unsupported sides
19
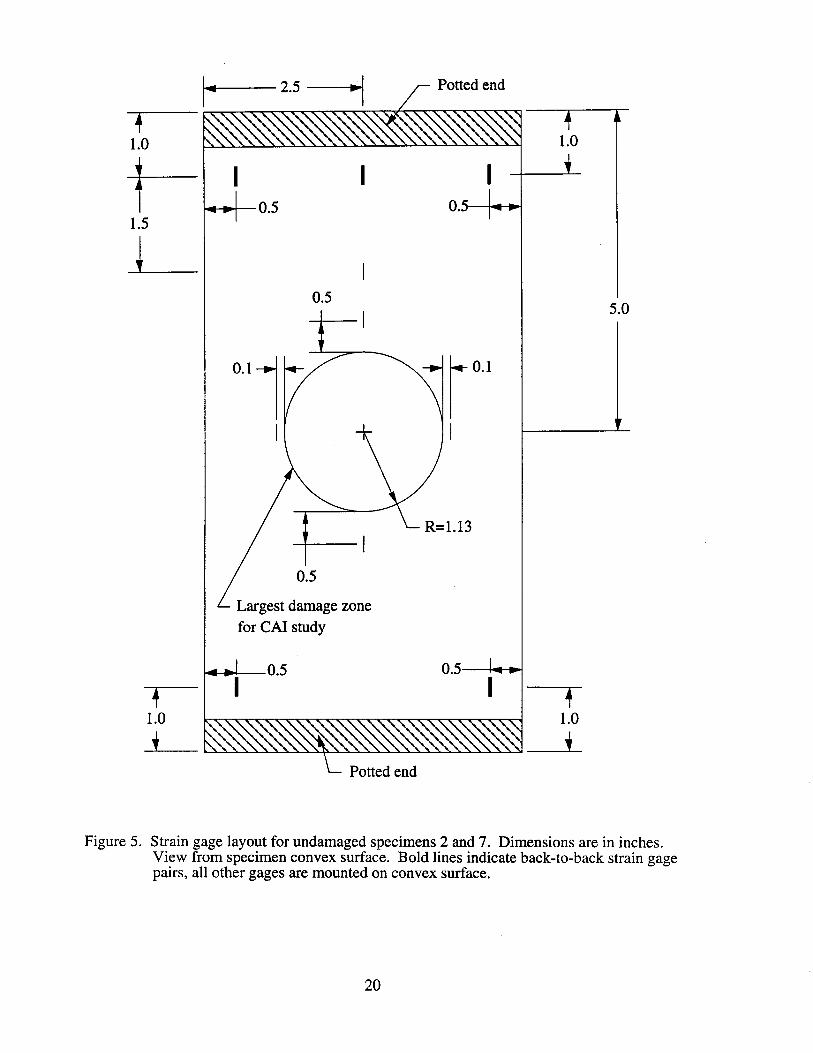
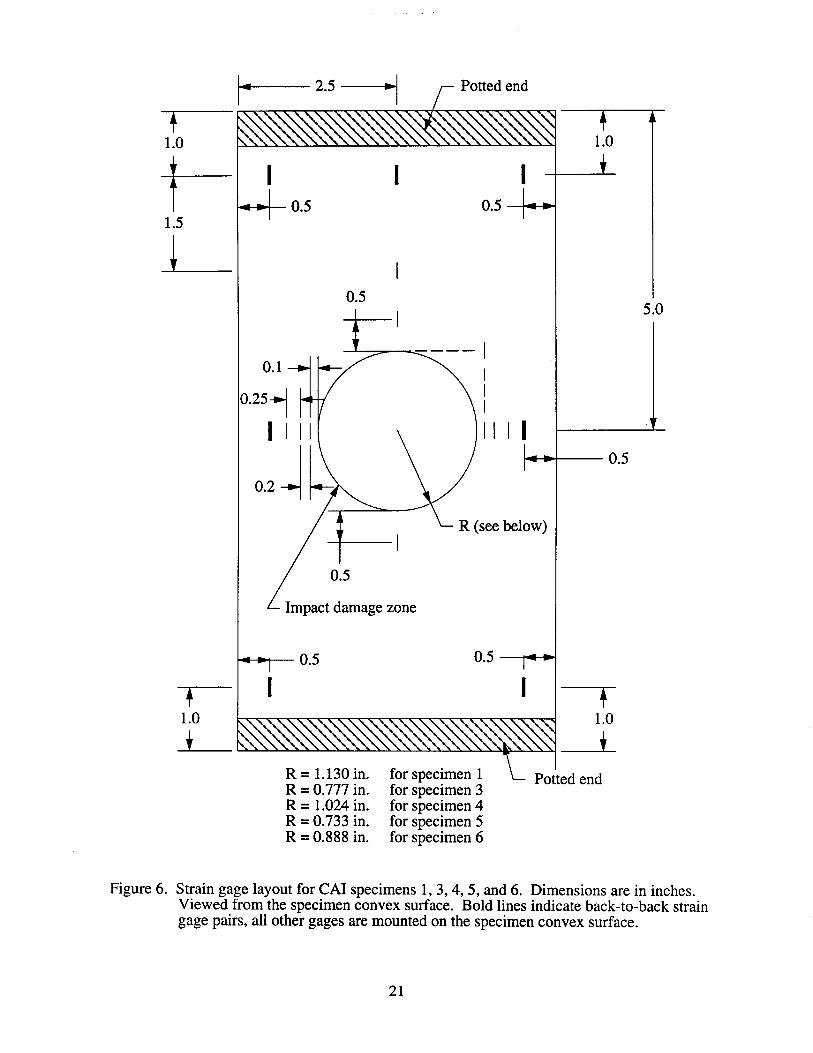
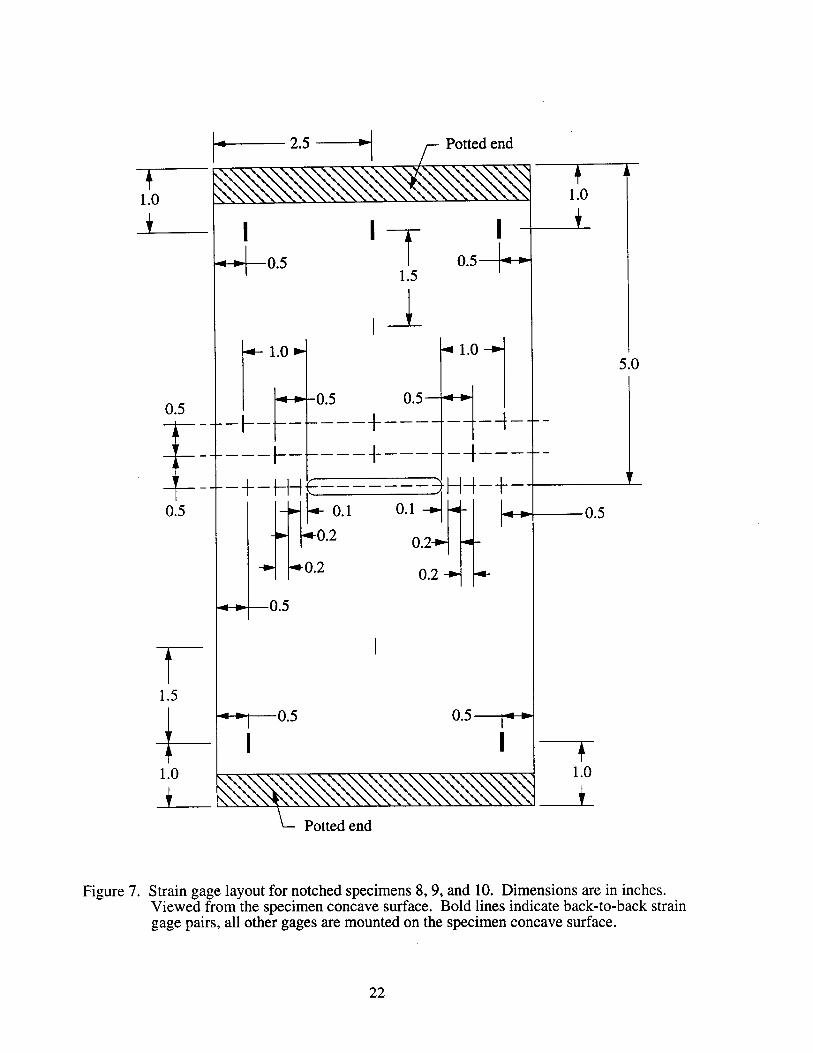
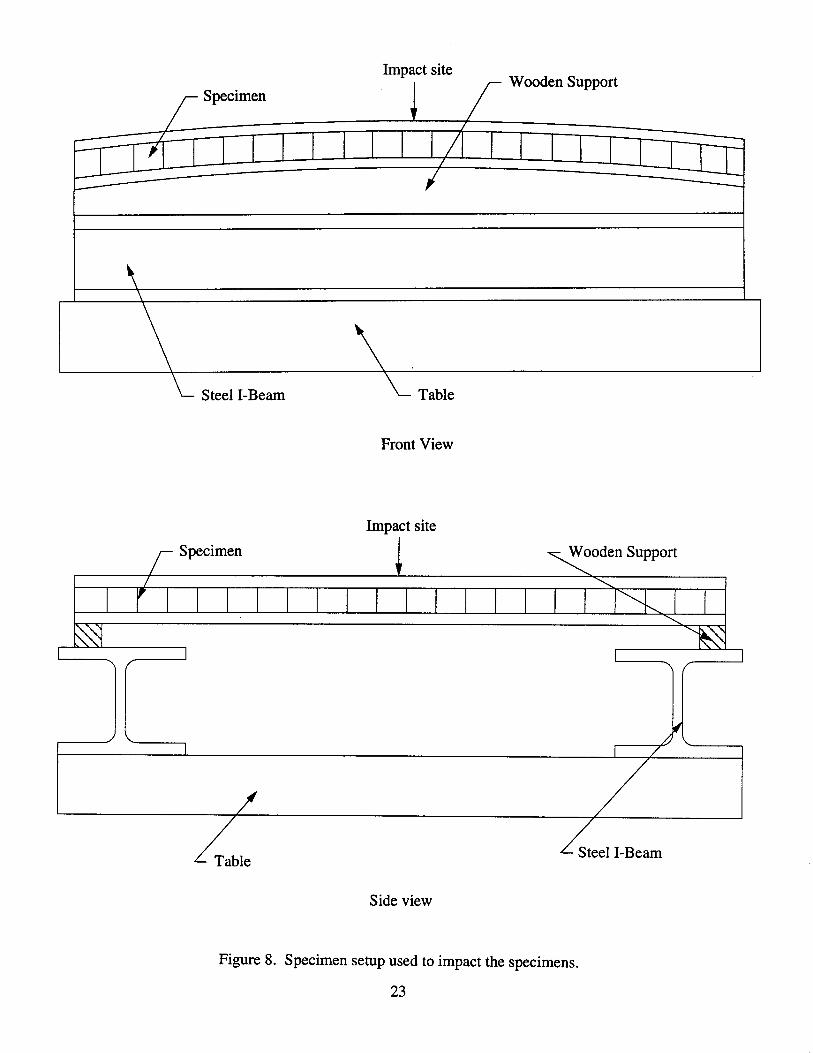
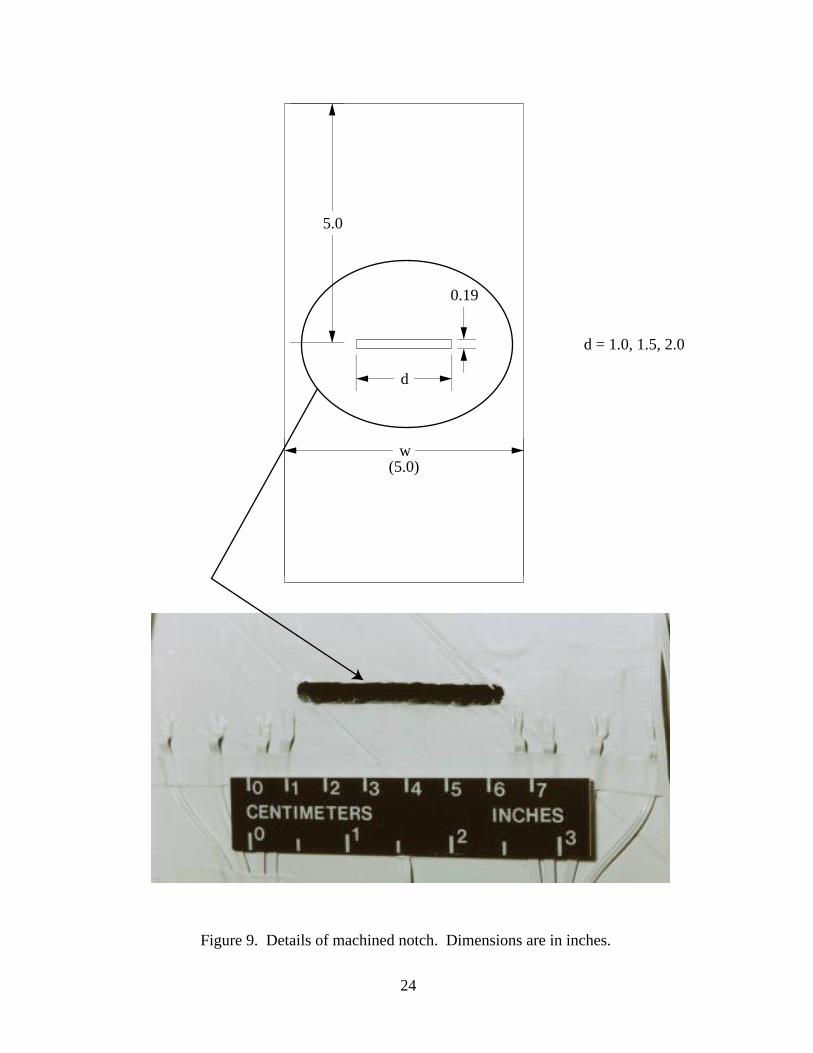
Figure 9. Details of machined notch. Dimensions are in inches.
5.0
d
w
0.19
(5.0)
d = 1.0, 1.5, 2.0
24
(a) Model of undamaged specimen
(b) Model of notched specimen
324 modified thick-shell elements
5,080 active degrees of freedom
• Uniform end shortening, δ• Five-inch-wide edges clamped• Nine-inch-long edges free
Figure 10. Finite element models of undamaged and notched specimens. Dimensions are in inches
δ
5
9
702 modified thick-shell elements
10,941 active degrees of freedom
• Uniform end shortening, δ• Five-inch-wide edges clamped• Nine-inch-long edges free
δ
5
9
Notch
25
1.0
0.8
0.6
0.4
0.2
0.060.050.040.030.020.01
Specimens 1 - 3 Specimens 4 - 7
1.0
0.8
0.6
0.4
0.2
4321
Specimens 1 - 3 Specimens 6 - 9
Normalizedfailure load
Damaged area, in2
0
Normalizedfailure load
Residual dent depth, in.
Figure 14. Normalized failure loads as a function of residual dent depth for the CAI specimens.CAI failure loads normalized with respect to undamaged specimen failure loads.
0
0 ft-lbs
60 ft-lbs
40 ft-lbs
60 ft-lbs
100 ft-lbs100 ft-lbs
0 ft-lbs
40 ft-lbs
60 ft-lbs
60 ft-lbs
100 ft-lbs
100 ft-lbs
Figure 15. Normalized failure loads as a function of damaged area for the CAI specimens.CAI failure loads normalized with respect to undamaged specimen failure loads.
29
1.0
0.8
0.6
0.4
0.2
10080604020
Specimens 1-3 Specimens 4-7
Normalizedfailure load
Impact energy, ft-lbs
0
Figure 16. Normalized failure loads as a function of impact energy for the CAI specimens.CAI failure loads normalized with respect to undamaged specimen failure loads.
30
Impact DamageSite
(a) Applied load = 0 lbs (b) Applied load = 130 kips
Figure 17. Moiré fringe patterns for CAI specimen 8 (40 ft-lbs of impact energy).
Figure 18. Failure mode for CAI specimen 3 (failure load = 173.5 kips).
Impactedface sheet
31
(b) Notched specimen 10 (1.0-in.-long notch)
Figure 19. Analytical surface strain contours for specimen 10 without and with a 1.0-in-long notch.
(a) Unnotched specimen 10
Applied load = 79.2 kips-3236-3156-3105-3055-2975-2925-2895
Strain, µin./in.
Strain, µin./in. Applied load = 79.2 kips-9172-6248-4924-3050-1459- 135
Expanded view of notched region
32
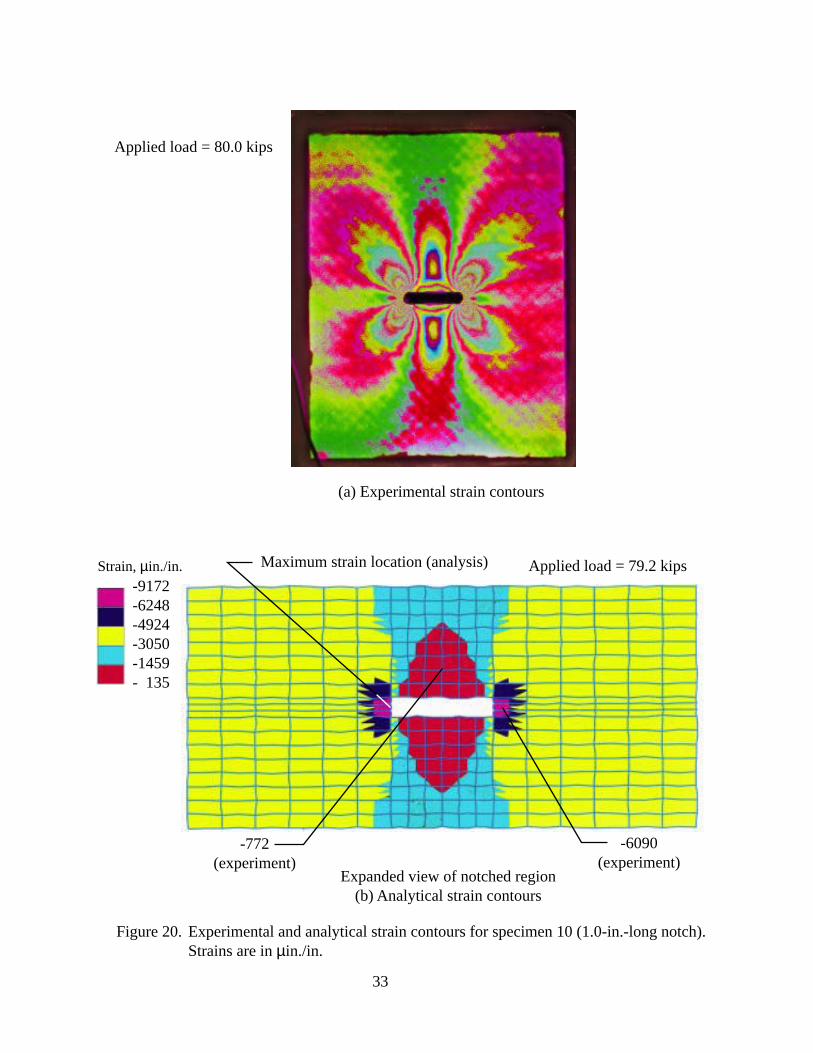
Figure 20. Experimental and analytical strain contours for specimen 10 (1.0-in.-long notch).Strains are in µin./in.
Applied load = 80.0 kips
Applied load = 79.2 kips-9172-6248-4924-3050-1459- 135
Strain, µin./in.
Expanded view of notched region(b) Analytical strain contours
(a) Experimental strain contours
-6090(experiment)
-772(experiment)
Maximum strain location (analysis)
33
1.0
0.8
0.6
0.4
0.2
2.01.51.00.5
Normalizedfailure load
Notch length, in.
0
Figure 24. Normalized failure loads as a function of notch length for the notched specimens.Notched specimen failure loads are normalized with respect to the failure load for unnotched specimen 7.
36
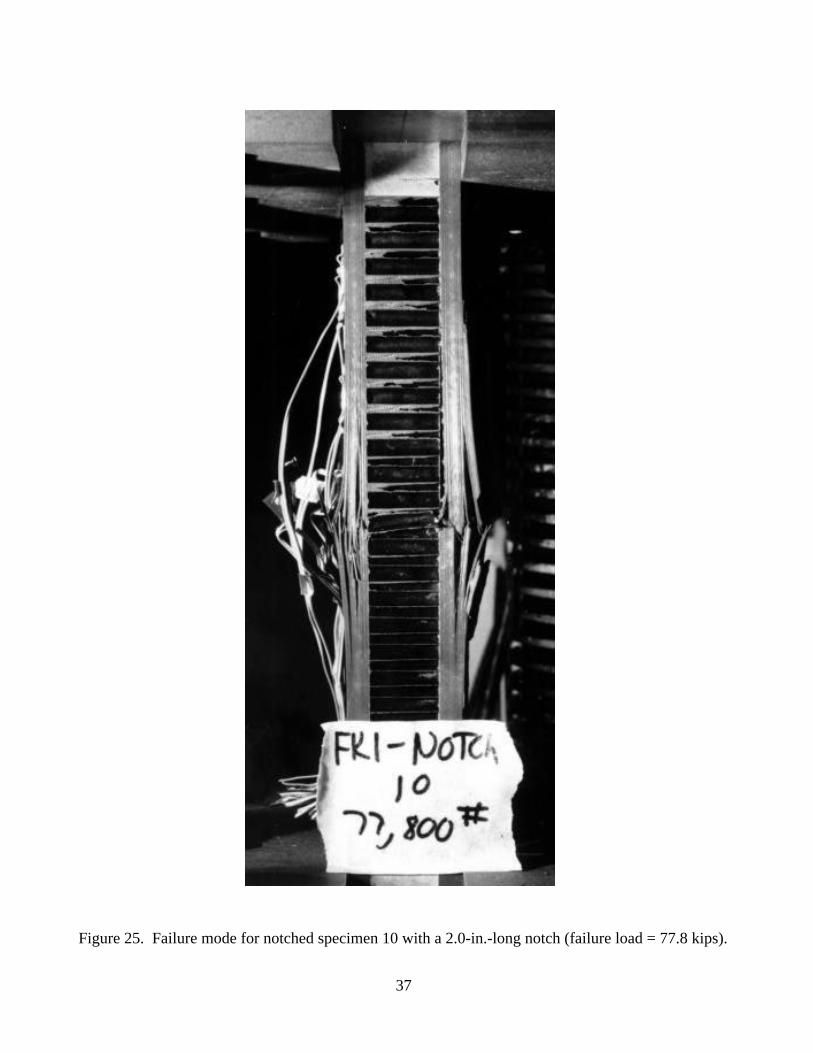
Figure 25. Failure mode for notched specimen 10 with a 2.0-in.-long notch (failure load = 77.8 kips).
37