Embed Size (px)
Citation preview
infrastructures
Article
Damage Detection in Fiber-Reinforced FoamedUrethane Composite Railway Bearers UsingAcoustic Emissions
Pasakorn Sengsri 1 , Chayut Ngamkhanong 1 , Andre Luis Oliveira de Melo 1,Mayorkinos Papaelias 2 and Sakdirat Kaewunruen 1,*
1 Laboratory for Track Engineering and Operations for Future Uncertainties (TOFU Lab),School of Engineering, The University of Birmingham, Edgbaston B15 2TT, Birmingham, UK;[email protected] (P.S.); [email protected] (C.N.);[email protected] (A.L.O.d.M.)
2 School of Metallurgy and Materials, The University of Birmingham, Edgbaston B15 2TT, Birmingham, UK;[email protected]
* Correspondence: [email protected]
Received: 25 May 2020; Accepted: 19 June 2020; Published: 21 June 2020�����������������
Abstract: To a certain degree, composite railway sleepers and bearers have been recently employed asa replacement for conventional timber sleepers. Importantly, attributed to the rise in traffic demand,structural health monitoring of track structural members is essential to improve the maintenanceregime and reduce risks imposed by any structural damage. A potential modern technique fordetecting damage in railway components by using energy waves is called acoustic emission (AE).This technique has been widely used for concrete structures in other engineering applications, but theapplication for composites is relatively limited. Recently, fiber-reinforced foamed urethane (FFU)composites have been utilized as railway sleepers and bearers for applications in the railway industry.Neither does a design standard exist, nor have the inspection and monitoring criteria been properlyestablished. In this study, three-point bending tests were performed together with using the AEmethod to detect crack growth in FFU composite beams. The ultimate state behaviors are considered toobtain the failure modes. This paper is thus the world’s first to focus on damage detection approachesfor FFU composite beams using AE technology, additionally identifying the load-deflection curvesof the beams. According to the experimental results, it is apparent that the failure modes of FFUcomposite beams are likely to be in brittle modes. Through finite element method, the resultswere in good agreement with less than 0.14% discrepancy between the experimental and numericaldata. The attractive insights into an alternative technique for damage assessment of the compositecomponents will help railway engineers to establish structural monitoring guidelines for railwaycomposite sleepers and bearers.
Keywords: railway sleepers and bearers; acoustic emission (AE); Fiber-reinforced Foamed Urethane(FFU); composite structures
1. Introduction
To date, the railway industry has embarked on the adoption of composite materials for railinfrastructures. Recent developments aim for the applications of composite materials to either rollingstock or infrastructure components such as train bogies, train bodies, railway sleepers and bearers,and so on. The general materials employed to fabricate railway sleepers and bearers are timber,concrete, and steel with 20, 50, and 50-year design life, respectively [1]. Over almost 200 years, timbersleepers and bearers have been used in railway tracks around the world, and they are aged and
Infrastructures 2020, 5, 50; doi:10.3390/infrastructures5060050 www.mdpi.com/journal/infrastructures
Infrastructures 2020, 5, 50 2 of 18
need to be replaced. A main benefit of these wooden sleepers and bearers is their flexibility, whichresults in an excellent ability to withstand vibrations induced by dynamic loads in the railway tracksystem [1]. On the other hand, the demand for other materials has grown because of a scarcity ofgood quality timber, expensive cost, and more maintenance needs. At the same time, concrete andsteel sleepers and bearers have emerged as choices for new tracks; their size and structural integritycommonly limit their use to positions where successful sleeper/bearer replacement is undertaken [2].Thus, new wooden sleepers and bearers remain a more favorable alternative in a short term to replacethe deteriorated sleepers and bearers in areas consisting of maintenance of existing timber tracks,turnout sleepers and bearers (switch ties), and transoms (bridge ties) [2]. Additionally, their improvedlife cycle is significantly beneficial to these areas, which are very difficult to maintain. Another benefitof employing these sleepers is to be able to handle the constant increase in concern throughout theexisting environment in the present industry because of its sustainable method.
Recently, reinforced polymer sleepers and bearers have become a potential alternative to timbersleepers and bearers. Compared to concrete and steel, reinforced polymers can be designed to mimictimber behavior, require nearly no maintenance, and are more sustainable from an environmentalperspective. However, the cost is still approximately 5–10 times higher than that of a standard timbersleepers and bearers, making them commercially unviable [2]. In Australia, there have been twodifferent types of polymer sleepers and bearers (polymer sleepers with short or no glass fibers and withlong longitudinal glass fiber reinforcement) used in railway systems, and they have been available inthe market for some time. Over the past 40 years, fiber-reinforced foamed urethane (FFU) compositeshave been applied to railway track system as sleepers or bearers to replace the conventional ageingtimber sleepers and bearers. Due to the time-dependent capacity of timber components, it is importantto develop polymer and composite sleepers that have a longer service life and can replace the old timbersleepers. FFU sleepers and bearers are reinforced with long continuous glass fiber reinforcementsin the longitudinal direction. The longitudinal shear strength and stiffness is mainly controlled bylong glass fibers, whilst it is dominated by polymers in the lateral direction [3]. The sleepers andbearers are suitable for ballasted rail tracks where stresses in them are controlled by bending loading,but less than ideal in special areas (i.e., turnout systems, transoms), where these sleepers and bearersare subjected to a high degree of combined flexural and shear forces as well as impact loading [3].Moreover, FFU sleepers and bearers have superior properties to standard timber ones, for example,light weight; good resistance to water absorption, heat, and corrosion; easy drill ability; and more than50 years of design life [3]. In the other words, a key challenge for railway engineers is to deal with lowshear strength and shear modulus, limited design flexibility, low fire resistance, and high cost of FFUsleepers and bearers [3]. In terms of occupational health and safety during installation of FFU sleepersand bearers, we strongly suggest that personal protective equipment (PPE) for environmental healthbe required during on-site drilling of FFU sleepers and bearers in railway tracks. This is because smallglass fibers can reach the lower part of the lungs, resulting in the increased risk of adverse health effects.
In practice, railway sleepers and bearers are some of the most critical structural elements in railwaytrack infrastructures. The key functions of railway sleepers and bearers are to support the rails and toredistribute trainloads to the underlying layers [4]. They also help to ascertain safe rail gauge thatpermits trains to travel securely [5–7]. Thus, their structural behavior and performance over their entireservice life are critical to assure public safety [8–11]. It is important to note that a railway track can bedegraded over time, resulting in poorer track performance. Hence, it is very necessary to monitor andinspect their conditions, in order to prioritize and plan effectively the maintenance regime. The use ofnon-destructive technologies (NDTs) for such an inspection is still very limited due to the lack of insightinto the structural performance with respect to a monitoring system. However, a significant increasein operational demand (e.g., to operate trains more frequently and more hours) has restricted theability for visual inspections. The requirement for an adequate monitoring system of railway sleepersand bearers cannot be neglected. In fact, the combination of NDTs and the advancement of "smartertracks" can potentially attenuate the risk imposed by any damage to structural components. Railway
Infrastructures 2020, 5, 50 3 of 18
engineers would gain the benefits of the developed smarter tracks (via the installation of sensors andreal-time condition monitoring system) for future maintenance activities and railway services [12,13].
Presently, common damage detection techniques, in addition to visual observation,are unsuccessful to identify any component damage in real-time, and they cannot perform to completelyreduce track possessions. Interestingly, acoustic emission technology has been extensively used innumerous engineering applications to detect crack growth, remaining life, source of damage, and fatiguelife of structural members. Therefore, there is a high potential that AE application for railway compositebeams can be realized. The AE function can collect real-time damage data and eliminate the drawbacksof the conventional methods of NDTs, leading to more secured railway tracks as well as minimizinglong-term maintenance costs.
Based on previous literature, the behaviors of composite structures used in the railway industryhave not been fully investigated. It is important to note that the industry frequently hesitates toadopt new composites, because of lack of a historical track record and adequate practical experience.Since standard testing methods are not sufficient to replace an element design approach, a certainmonitoring and design approach requires future track maintenance that has adequately correct detailsabout the exact service life of the structural and safety-critical element for harmful effects on railenvironments. Recently, there have been numerous tasks to improve railway track performance so thatrailway tracks could be designed up to 50 years with conventional routine maintenance. Nevertheless,most of the railway sleepers and bearers could have pre-mature failure because of irregularities.Accordingly, the requirement of turnout bearers is to replace and adapt properly structural designand monitoring networks, in order to ensure the safety limit and structural reliability, which can bemaintained with long term sustainability [14–16]. This paper identifies the potential of AE sensingfor the evaluation of the responses of FFU composite beams. Three-point bending tests were carriedout in order to use AE sensing techniques to detect the real-time crack growth. The failure modesand load-deflection curves of FFU beams were also identified. The insight of this study will providesignificant engineering guidelines and assessments for structural health monitoring of FFU compositesleepers and bearers in public use.
2. Materials and Methods
2.1. Fiber-Reinforced Foamed Urethane Material
Fiber-reinforced foamed urethane (FFU) material for railway applications has been developed bySEKISUI Chemical Gmbh [17]. The FFU composite is an advanced material inspired by timber, whichwas first produced by Sekisui in 1978. Recently, the FFU composite material has been extensivelyutilized in Japan’s railway infrastructures, from high-speed Shinkansen to regional trains and urbansubway networks. Over decades, FFU sleepers have been installed in more than 870 km of railwaytracks, and the primary areas of applications are at railway switches and crossings and transom bridges.According to Gunther [18], earlier studies identified that wood sleepers (which are made of at least70 percent of original wood content) are vulnerable to be damaged due to aggressive loadings and tobe eroded due to the weather conditions. As a result, these concerns have led to intensive research foradvanced materials to compensate for the weak performance of the wooden sleepers and to recoverthe advantages of the wooden sleepers (such as damping and constructability). The properties of FFUsynthetic material are tuned to be nearly equal to those of native timber materials.
However, it is noted that the service life of FFU material is much longer than that of nativetimber materials, and the weathering resistance is even better. The FFU composites are easier to beproduced and the resources of composites are widely available. The FFU material has higher electricalinsulation in both wet and dry conditions and can be mass-produced. In 1996, various static anddynamic investigations on first synthetic sleepers from the experimental track sections were carriedout by Railway Technical Research Institute (RTRI). The lifecycle of the FFU sleeper is predicted to beover 50 years, depending on the outcomes collected at the time [18]. Furthermore, once the Technical
Infrastructures 2020, 5, 50 4 of 18
University of Munich showed that the FFU composite sleepers effectively behave under fatigueloadings, this test aimed to highlight the superior redistribution of plastic displacement occurred byhigh trackpad forces, sleeper screw pulling forces, and derailment impact loadings. The FFU materialis much more enduring than a native wood material. Takai et al. [19] pointed out the durability basedon the use of Japanese FFU sleepers for more than 15 years, mainly for the open plain tracks and fora transom bridge. The result showed that after 15 years of use, the short sleepers had no cracks ordamage on the surface, and had no flexural deformation on the whole component. The whole colorand size of the FFU composite sleepers were stable.
2.2. Acoustic Emission Sensing
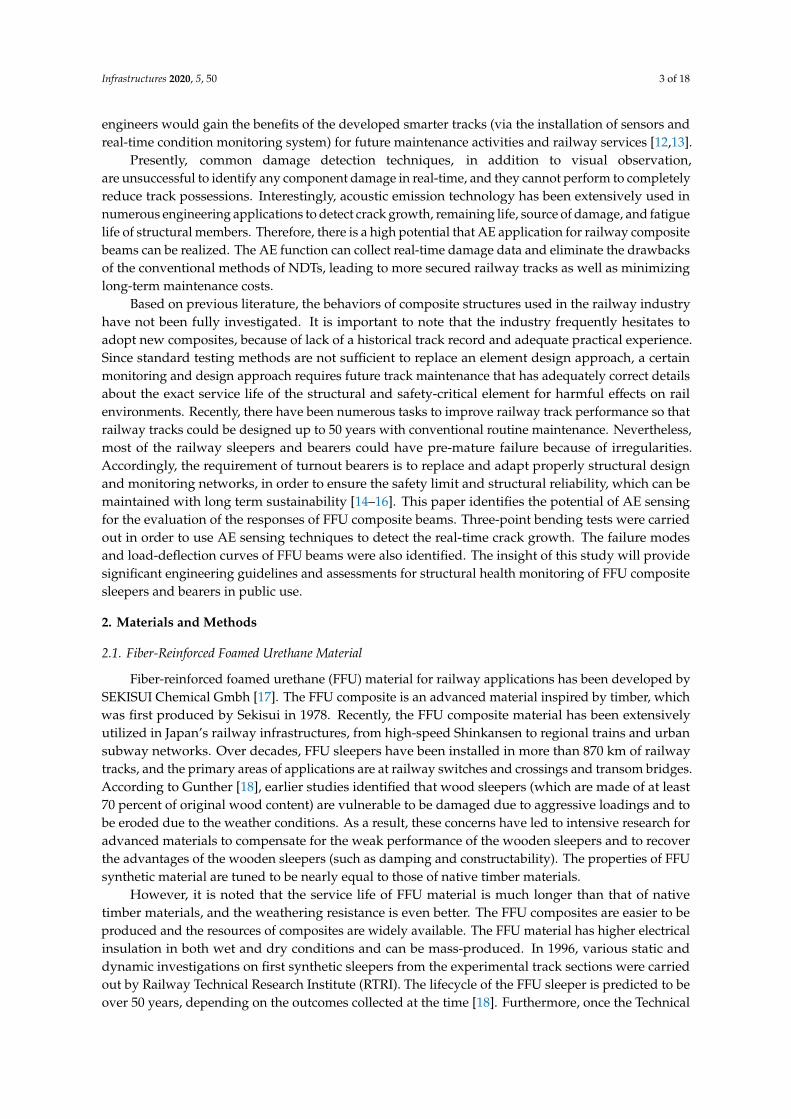
In 1950, many early types of research utilizing AE were conducted, and various concepts leading toits most effective application, whether industrially or commercially came about. There was immediatedevelopment in the technology in later decades, and by the 1970s it was an important approachof structural monitoring. Acoustic emission (AE) defines the production of transient elastic wavesby an immediate redistribution of stress in a material. When a structure is imposed to externalforces, also known as an external stimulus (change in temperature, force, or pressure), local sourcesrelease the stress waves to the surface of a material, and they are recorded by devices or sensors [20],as demonstrated in Figure 1. Basically, crack initiation and propagation, which appear in FFU railwaysleepers, is the stress sources, for example, when the loading of rolling stock is applied to a sleeper,influencing crack propagation, and then a signal is released from the tip of the crack identifying itsposition and growth rate. The AE waves are likely to be interfaced by a passing train, which generatesdisturbances called extraneous noise [20]. This noise is detectable by its clearly noticeable frequencyspectra; thus, it is able to be found for the important AE waves [21]. Furthermore, current technologydeals with this problem by utilizing the master–slave method. This means using “guard sensors” toeradicate extraneous noise [22].
Infrastructures 2020, 5, x FOR PEER REVIEW 4 of 18
fatigue loadings, this test aimed to highlight the superior redistribution of plastic displacement occurred by high trackpad forces, sleeper screw pulling forces, and derailment impact loadings. The FFU material is much more enduring than a native wood material. Takai et al. [19] pointed out the durability based on the use of Japanese FFU sleepers for more than 15 years, mainly for the open plain tracks and for a transom bridge. The result showed that after 15 years of use, the short sleepers had no cracks or damage on the surface, and had no flexural deformation on the whole component. The whole color and size of the FFU composite sleepers were stable.
2.2. Acoustic Emission Sensing
In 1950, many early types of research utilizing AE were conducted, and various concepts leading to its most effective application, whether industrially or commercially came about. There was immediate development in the technology in later decades, and by the 1970s it was an important approach of structural monitoring. Acoustic emission (AE) defines the production of transient elastic waves by an immediate redistribution of stress in a material. When a structure is imposed to external forces, also known as an external stimulus (change in temperature, force, or pressure), local sources release the stress waves to the surface of a material, and they are recorded by devices or sensors [20], as demonstrated in Figure 1. Basically, crack initiation and propagation, which appear in FFU railway sleepers, is the stress sources, for example, when the loading of rolling stock is applied to a sleeper, influencing crack propagation, and then a signal is released from the tip of the crack identifying its position and growth rate. The AE waves are likely to be interfaced by a passing train, which generates disturbances called extraneous noise [20]. This noise is detectable by its clearly noticeable frequency spectra; thus, it is able to be found for the important AE waves [21]. Furthermore, current technology deals with this problem by utilizing the master–slave method. This means using "guard sensors" to eradicate extraneous noise [22].
Figure 1. Acoustic emission (AE) technique.
Accordingly, the acoustic emission technique (AET) has been generally utilized for damage detection of structures and real-time data collection. Compared to other non-destructive testing (NDT) techniques, there are two important differences between AET and NDT. The first key is that AET produces its own signal. For another difference, AET is often used to detect movement on structures during operation, whilst most other conventional techniques determine existing geometrical discontinuities. However, the AE method can only qualitatively measure how much damage is carried in a structure. A further disadvantage of AE is that it gives intense noise signals.
2.2.1. Application of AE Sensors
One of the most useful situations of using AE sensing is long-term observation. Once the AE technology has been placed it can be left to perform structural health monitoring without physical maintenance. Therefore, this possible method is helpful to identify the damages. In the last 40 years, a structural health monitoring technique was used for determining the locations of fiber breaks, in order to identify the actual distribution of fiber fragments, when a load was applied to a composite sample consisting of a single fiber to analyze the failure test [23]. After this, the shear strength of the fiber–matrix interface was identified by the micro-mechanical simulation from the measurement of fragmentation lengths [23]. Another instance of using the acoustic emission (AE) approach is for concrete engineering. This approach is able to monitor concrete structures in practice and also to
Figure 1. Acoustic emission (AE) technique.
Accordingly, the acoustic emission technique (AET) has been generally utilized for damagedetection of structures and real-time data collection. Compared to other non-destructive testing(NDT) techniques, there are two important differences between AET and NDT. The first key is thatAET produces its own signal. For another difference, AET is often used to detect movement onstructures during operation, whilst most other conventional techniques determine existing geometricaldiscontinuities. However, the AE method can only qualitatively measure how much damage is carriedin a structure. A further disadvantage of AE is that it gives intense noise signals.
2.2.1. Application of AE Sensors
One of the most useful situations of using AE sensing is long-term observation. Once the AEtechnology has been placed it can be left to perform structural health monitoring without physicalmaintenance. Therefore, this possible method is helpful to identify the damages. In the last 40 years,a structural health monitoring technique was used for determining the locations of fiber breaks,in order to identify the actual distribution of fiber fragments, when a load was applied to a compositesample consisting of a single fiber to analyze the failure test [23]. After this, the shear strength of
Infrastructures 2020, 5, 50 5 of 18
the fiber–matrix interface was identified by the micro-mechanical simulation from the measurementof fragmentation lengths [23]. Another instance of using the acoustic emission (AE) approach is forconcrete engineering. This approach is able to monitor concrete structures in practice and also toevaluate the damage level of structures. According to Masayasu [24], a standard referred to as the AEKaiser phenomenon in the suggested practice has been now set by the Japan Non-destructive TestingAssociation. Damaged qualifications define the ratio relationship between the load and calm of thenew AE parameter [24]. Additionally, this led to investigating the possibility of damage detection inreinforced concrete beams under incrementally repeated loading. The outcomes indicate that the twotypes of qualified damages are certain with the real damages of the beam [25]. A third example of thismight be, in 2012, the task of repair for the Hammersmith flyover in London, which utilized more than400 AE sensors in order to detect tendon failure [26].
The AE system was not only completely efficient. This is because the AE devices were placed forlong periods of time after the initial construction; thus, the already defected structure was taken as thebase condition [27]. For a railway application, implementation on tracks would have the identical flaw,as damage to the sleepers may only be detected during installation, even if the structure had alreadyfailed. Nevertheless, the data remains useful as the sleepers with the most propagating cracks can beidentified. In a further example of using the AE technique, A Clark et al. [28] conducted an experimentusing the AE method to determine damage in railway prestressed concrete sleepers. It was foundthat this method could give precise data, exactly detecting the position and range of sleeper damage.Obviously, it provides a successfully fundamental criterion for material damage and service life. It is ofextreme importance for timely maintenance of elements and secure operation of structures to preventunpredictable incidents. As a result of these cases, applications on railway structures are likely tohave the identical imperfection, as damage to the sleeper may be particularly detected during theinstallation. Nevertheless, the data collections remain useful as the sleepers with the most continuouscracking can be determined.
2.2.2. Kaiser Effect
AE signals produced under various loading patterns can provide useful information in terms ofthe structural integrity of a material. The possible AE signals could be identified when the previousloading has been suddenly surpassed. The increase in rate is known as the Kaiser peak, and thisphenomenon is known as the Kaiser effect. Later, the extend of the research was not restricted tometallic materials. This led to many researchers investigating studies of acoustic emission techniquesfor concrete damage detection. The results indicate that the Kaiser effect is acceptable for experimentson concrete engineering [29]. Holcomb [30] stated that in 1950, Kaiser was the first German whoresearched AE technology in training. Furthermore, Joseph Kaiser mentioned that a material almostgenerates no identified emission signals until the prior highest stress degree is gained, under elasticbehavior [31]. Hence, the Kaiser effect is very significant for repeated loads of railway systems.Other studies have also shown that a repeated load would not impact the acoustic emission outcomesuntil the previous highest stress degree was carried out [31].
2.3. Methodology
2.3.1. Three Point Bending Test
Based on EN 13230-2 bending testing [32], it requires positive and negative bending tests forsleepers at the rail seat support. Only positive bending tests were achieved due to the symmetricalshape of the specimens. This means that the samples have the same positive and negative capacity.The setup of the three-point bending test is shown in Figure 2. The criterion needs articulated supportand must be 100 mm wide, made of steel with Brinell:HBW > 240. A static load was applied atthe mid-span to conduct a 3-point bending test. Note that the three-point bending behavior willexcite the center-bound issues connected to poorly maintained ballast beds. When the railway beam
Infrastructures 2020, 5, 50 6 of 18
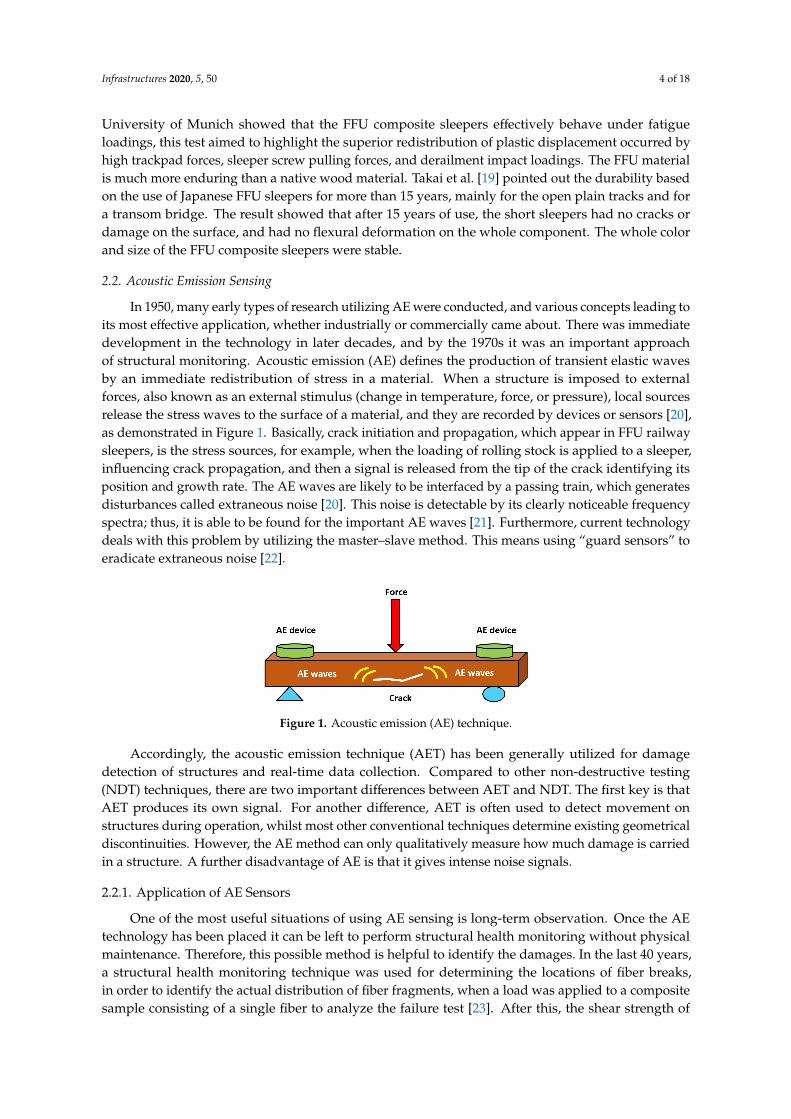
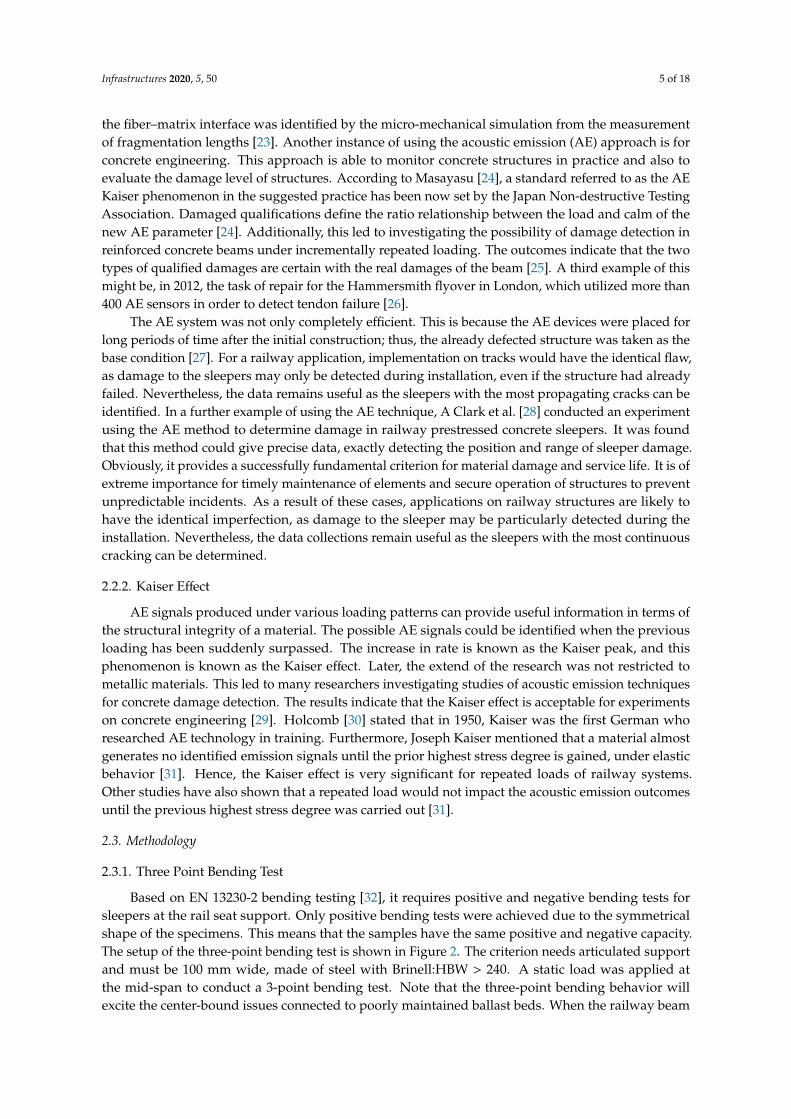
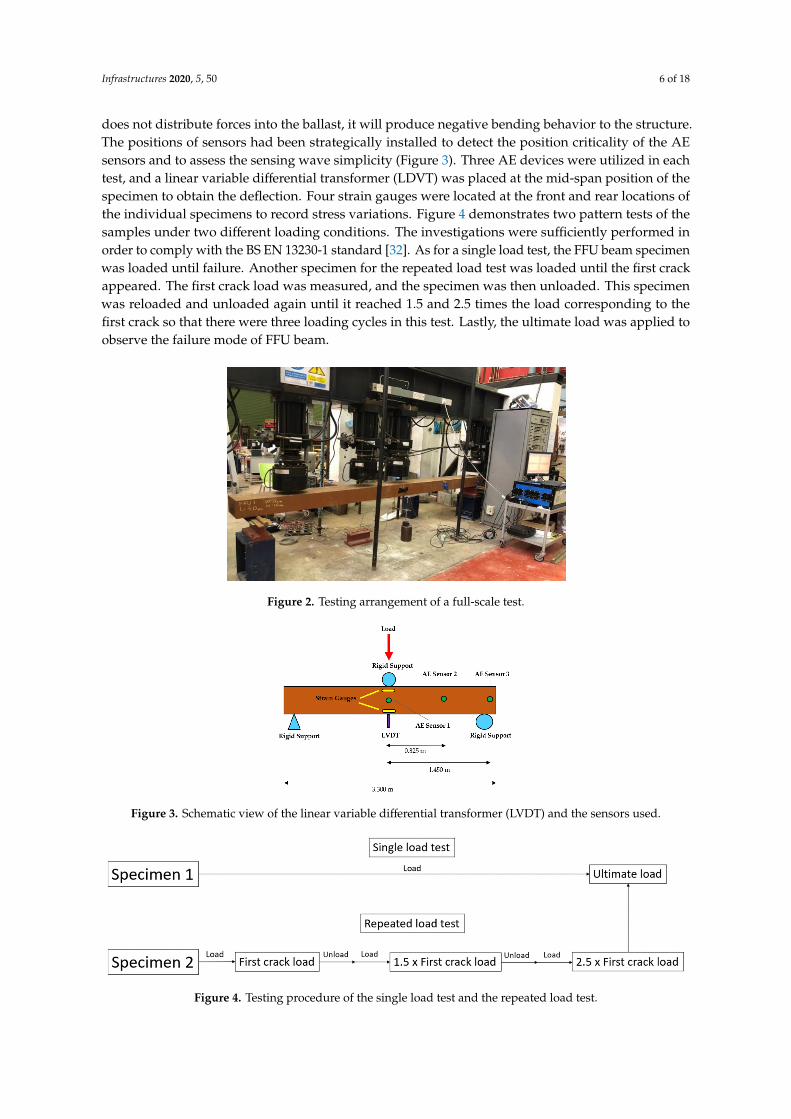
does not distribute forces into the ballast, it will produce negative bending behavior to the structure.The positions of sensors had been strategically installed to detect the position criticality of the AEsensors and to assess the sensing wave simplicity (Figure 3). Three AE devices were utilized in eachtest, and a linear variable differential transformer (LDVT) was placed at the mid-span position of thespecimen to obtain the deflection. Four strain gauges were located at the front and rear locations ofthe individual specimens to record stress variations. Figure 4 demonstrates two pattern tests of thesamples under two different loading conditions. The investigations were sufficiently performed inorder to comply with the BS EN 13230-1 standard [32]. As for a single load test, the FFU beam specimenwas loaded until failure. Another specimen for the repeated load test was loaded until the first crackappeared. The first crack load was measured, and the specimen was then unloaded. This specimenwas reloaded and unloaded again until it reached 1.5 and 2.5 times the load corresponding to thefirst crack so that there were three loading cycles in this test. Lastly, the ultimate load was applied toobserve the failure mode of FFU beam.
Infrastructures 2020, 5, x FOR PEER REVIEW 6 of 18
individual specimens to record stress variations. Figure 4 demonstrates two pattern tests of the samples under two different loading conditions. The investigations were sufficiently performed in order to comply with the BS EN 13230-1 standard [32]. As for a single load test, the FFU beam specimen was loaded until failure. Another specimen for the repeated load test was loaded until the first crack appeared. The first crack load was measured, and the specimen was then unloaded. This specimen was reloaded and unloaded again until it reached 1.5 and 2.5 times the load corresponding to the first crack so that there were three loading cycles in this test. Lastly, the ultimate load was applied to observe the failure mode of FFU beam.
2.3.2. AE Equipment
AE measurement was achieved throughout the mechanical experiments of all the sample types to monitor and assess damage growth under bending loading. The AE waves were identified and collected utilizing a 4-channel DAQ AE network generated from Physical Acoustic Corporation (PAC, now Mistras). The data acquisition was conducted using “AE-Win” software. The AE waves were determined employing wideband PAC-WD piezoelectric acoustic transducers performing at a frequency range of 20 to 1000 kHz. The data acquisition network used was a custom-built AE and vibration acquisition network able to continuously record the full waveform for periods of a few seconds. The custom-built acquisition network was comprised of the following parts:
• A computer with a customized data logging program. • An Agilent U2531A 4 channel data acquisition card. • A 4-channel decoupling hub. • MISTRAS wide bandwidth AE amplifier given by PAC. • A PAC model 2/4/6 preamplifier operating with a range of frequency from 20 to 1200 kHz. • A wideband PAC-WD piezoelectric AE sensor operating with a range of frequency from 20 to
1000 kHz.
Figure 2. Testing arrangement of a full-scale test.
Figure 3. Schematic view of the linear variable differential transformer (LVDT) and the sensors
used.
Figure 2. Testing arrangement of a full-scale test.
Infrastructures 2020, 5, x FOR PEER REVIEW 6 of 18
individual specimens to record stress variations. Figure 4 demonstrates two pattern tests of the samples under two different loading conditions. The investigations were sufficiently performed in order to comply with the BS EN 13230-1 standard [32]. As for a single load test, the FFU beam specimen was loaded until failure. Another specimen for the repeated load test was loaded until the first crack appeared. The first crack load was measured, and the specimen was then unloaded. This specimen was reloaded and unloaded again until it reached 1.5 and 2.5 times the load corresponding to the first crack so that there were three loading cycles in this test. Lastly, the ultimate load was applied to observe the failure mode of FFU beam.
2.3.2. AE Equipment
AE measurement was achieved throughout the mechanical experiments of all the sample types to monitor and assess damage growth under bending loading. The AE waves were identified and collected utilizing a 4-channel DAQ AE network generated from Physical Acoustic Corporation (PAC, now Mistras). The data acquisition was conducted using “AE-Win” software. The AE waves were determined employing wideband PAC-WD piezoelectric acoustic transducers performing at a frequency range of 20 to 1000 kHz. The data acquisition network used was a custom-built AE and vibration acquisition network able to continuously record the full waveform for periods of a few seconds. The custom-built acquisition network was comprised of the following parts:
• A computer with a customized data logging program. • An Agilent U2531A 4 channel data acquisition card. • A 4-channel decoupling hub. • MISTRAS wide bandwidth AE amplifier given by PAC. • A PAC model 2/4/6 preamplifier operating with a range of frequency from 20 to 1200 kHz. • A wideband PAC-WD piezoelectric AE sensor operating with a range of frequency from 20 to
1000 kHz.
Figure 2. Testing arrangement of a full-scale test.
Figure 3. Schematic view of the linear variable differential transformer (LVDT) and the sensors
used.
Figure 3. Schematic view of the linear variable differential transformer (LVDT) and the sensors used.Infrastructures 2020, 5, x FOR PEER REVIEW 7 of 18
Figure 4. Testing procedure of the single load test and the repeated load test.
3. Experimental Results
3.1. Crack Propagation and Failure Mode
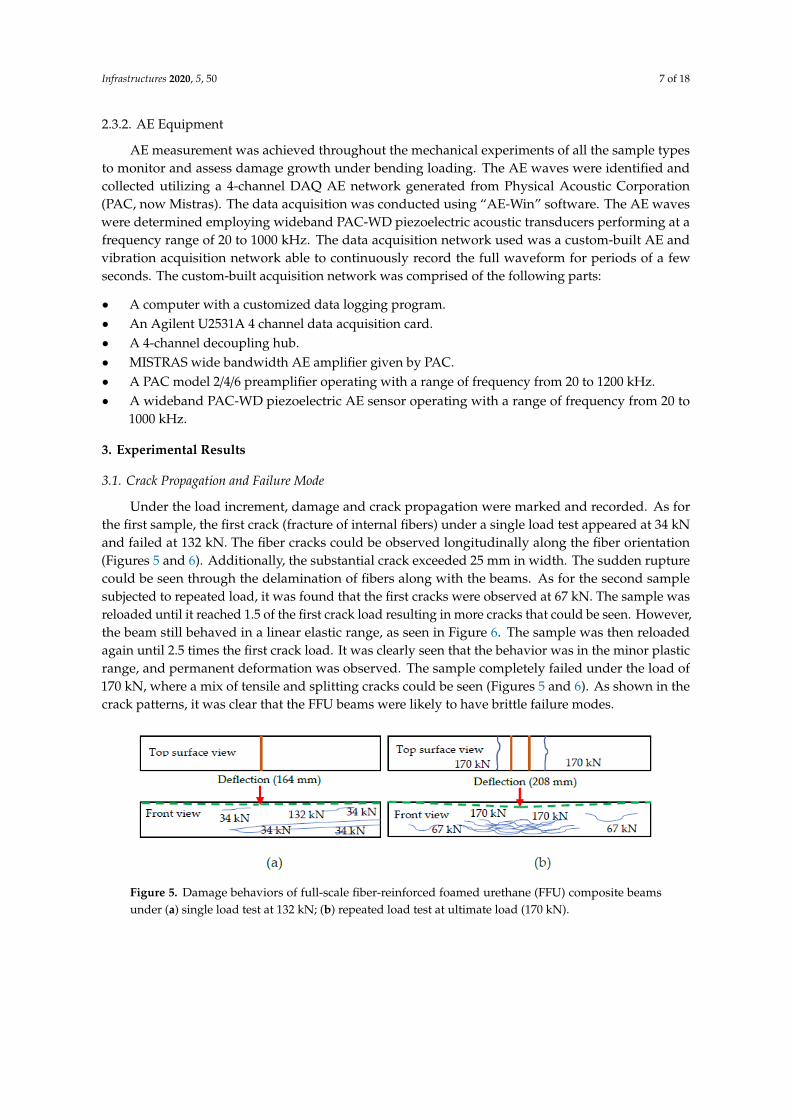
Under the load increment, damage and crack propagation were marked and recorded. As for the first sample, the first crack (fracture of internal fibers) under a single load test appeared at 34 kN and failed at 132 kN. The fiber cracks could be observed longitudinally along the fiber orientation (Figures 5 and 6). Additionally, the substantial crack exceeded 25 mm in width. The sudden rupture could be seen through the delamination of fibers along with the beams. As for the second sample subjected to repeated load, it was found that the first cracks were observed at 67 kN. The sample was reloaded until it reached 1.5 of the first crack load resulting in more cracks that could be seen. However, the beam still behaved in a linear elastic range, as seen in Figure 6. The sample was then reloaded again until 2.5 times the first crack load. It was clearly seen that the behavior was in the minor plastic range, and permanent deformation was observed. The sample completely failed under the load of 170 kN, where a mix of tensile and splitting cracks could be seen (Figures 5 and 6). As shown in the crack patterns, it was clear that the FFU beams were likely to have brittle failure modes.
Figure 5. Damage behaviors of full-scale fiber-reinforced foamed urethane (FFU) composite beams under (a) single load test at 132 kN; (b) repeated load test at ultimate load (170 kN).
(a)
(b)
Figure 4. Testing procedure of the single load test and the repeated load test.
Infrastructures 2020, 5, 50 7 of 18
2.3.2. AE Equipment
AE measurement was achieved throughout the mechanical experiments of all the sample typesto monitor and assess damage growth under bending loading. The AE waves were identified andcollected utilizing a 4-channel DAQ AE network generated from Physical Acoustic Corporation(PAC, now Mistras). The data acquisition was conducted using “AE-Win” software. The AE waveswere determined employing wideband PAC-WD piezoelectric acoustic transducers performing at afrequency range of 20 to 1000 kHz. The data acquisition network used was a custom-built AE andvibration acquisition network able to continuously record the full waveform for periods of a fewseconds. The custom-built acquisition network was comprised of the following parts:
• A computer with a customized data logging program.• An Agilent U2531A 4 channel data acquisition card.• A 4-channel decoupling hub.• MISTRAS wide bandwidth AE amplifier given by PAC.• A PAC model 2/4/6 preamplifier operating with a range of frequency from 20 to 1200 kHz.• A wideband PAC-WD piezoelectric AE sensor operating with a range of frequency from 20 to
1000 kHz.
3. Experimental Results
3.1. Crack Propagation and Failure Mode
Under the load increment, damage and crack propagation were marked and recorded. As forthe first sample, the first crack (fracture of internal fibers) under a single load test appeared at 34 kNand failed at 132 kN. The fiber cracks could be observed longitudinally along the fiber orientation(Figures 5 and 6). Additionally, the substantial crack exceeded 25 mm in width. The sudden rupturecould be seen through the delamination of fibers along with the beams. As for the second samplesubjected to repeated load, it was found that the first cracks were observed at 67 kN. The sample wasreloaded until it reached 1.5 of the first crack load resulting in more cracks that could be seen. However,the beam still behaved in a linear elastic range, as seen in Figure 6. The sample was then reloadedagain until 2.5 times the first crack load. It was clearly seen that the behavior was in the minor plasticrange, and permanent deformation was observed. The sample completely failed under the load of170 kN, where a mix of tensile and splitting cracks could be seen (Figures 5 and 6). As shown in thecrack patterns, it was clear that the FFU beams were likely to have brittle failure modes.
Infrastructures 2020, 5, x FOR PEER REVIEW 7 of 18
Figure 4. Testing procedure of the single load test and the repeated load test.
3. Experimental Results
3.1. Crack Propagation and Failure Mode
Under the load increment, damage and crack propagation were marked and recorded. As for the first sample, the first crack (fracture of internal fibers) under a single load test appeared at 34 kN and failed at 132 kN. The fiber cracks could be observed longitudinally along the fiber orientation (Figures 5 and 6). Additionally, the substantial crack exceeded 25 mm in width. The sudden rupture could be seen through the delamination of fibers along with the beams. As for the second sample subjected to repeated load, it was found that the first cracks were observed at 67 kN. The sample was reloaded until it reached 1.5 of the first crack load resulting in more cracks that could be seen. However, the beam still behaved in a linear elastic range, as seen in Figure 6. The sample was then reloaded again until 2.5 times the first crack load. It was clearly seen that the behavior was in the minor plastic range, and permanent deformation was observed. The sample completely failed under the load of 170 kN, where a mix of tensile and splitting cracks could be seen (Figures 5 and 6). As shown in the crack patterns, it was clear that the FFU beams were likely to have brittle failure modes.
Figure 5. Damage behaviors of full-scale fiber-reinforced foamed urethane (FFU) composite beams under (a) single load test at 132 kN; (b) repeated load test at ultimate load (170 kN).
(a)
(b)
Figure 5. Damage behaviors of full-scale fiber-reinforced foamed urethane (FFU) composite beamsunder (a) single load test at 132 kN; (b) repeated load test at ultimate load (170 kN).
Infrastructures 2020, 5, 50 8 of 18
Infrastructures 2020, 5, x FOR PEER REVIEW 7 of 18
Figure 4. Testing procedure of the single load test and the repeated load test.
3. Experimental Results
3.1. Crack Propagation and Failure Mode
Under the load increment, damage and crack propagation were marked and recorded. As for the first sample, the first crack (fracture of internal fibers) under a single load test appeared at 34 kN and failed at 132 kN. The fiber cracks could be observed longitudinally along the fiber orientation (Figures 5 and 6). Additionally, the substantial crack exceeded 25 mm in width. The sudden rupture could be seen through the delamination of fibers along with the beams. As for the second sample subjected to repeated load, it was found that the first cracks were observed at 67 kN. The sample was reloaded until it reached 1.5 of the first crack load resulting in more cracks that could be seen. However, the beam still behaved in a linear elastic range, as seen in Figure 6. The sample was then reloaded again until 2.5 times the first crack load. It was clearly seen that the behavior was in the minor plastic range, and permanent deformation was observed. The sample completely failed under the load of 170 kN, where a mix of tensile and splitting cracks could be seen (Figures 5 and 6). As shown in the crack patterns, it was clear that the FFU beams were likely to have brittle failure modes.
Figure 5. Damage behaviors of full-scale fiber-reinforced foamed urethane (FFU) composite beams under (a) single load test at 132 kN; (b) repeated load test at ultimate load (170 kN).
(a)
(b)
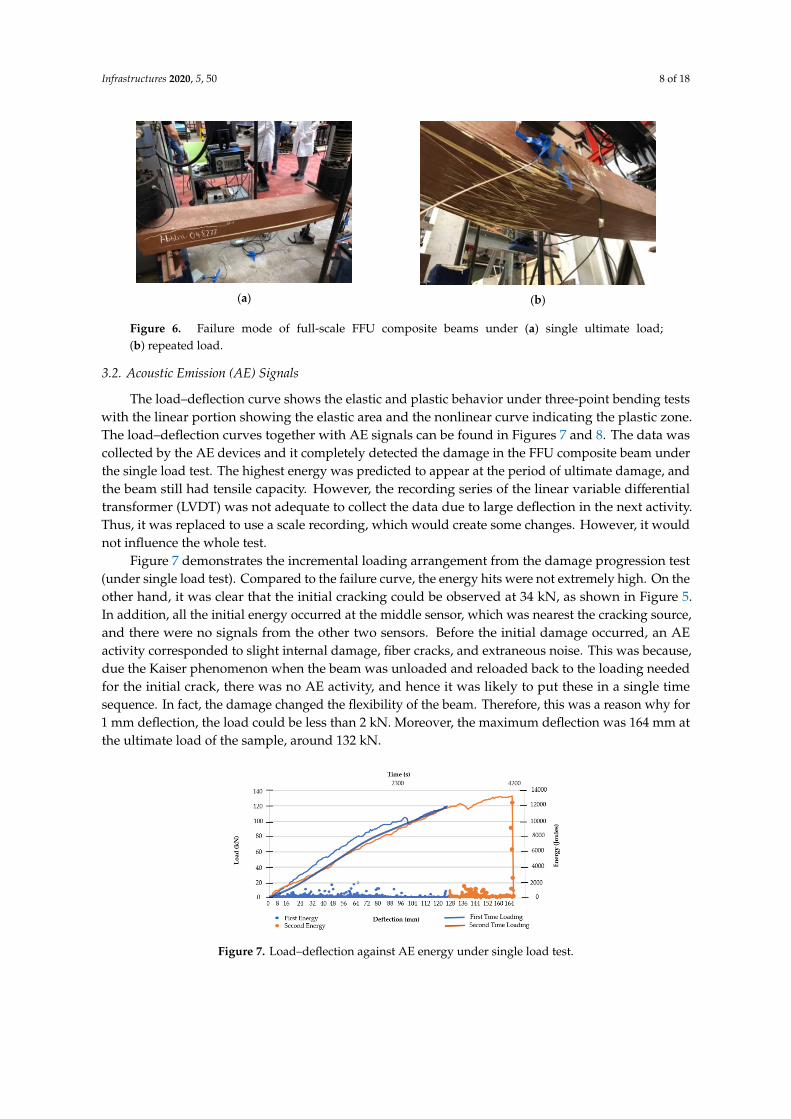
Figure 6. Failure mode of full-scale FFU composite beams under (a) single ultimate load;(b) repeated load.
3.2. Acoustic Emission (AE) Signals
The load–deflection curve shows the elastic and plastic behavior under three-point bending testswith the linear portion showing the elastic area and the nonlinear curve indicating the plastic zone.The load–deflection curves together with AE signals can be found in Figures 7 and 8. The data wascollected by the AE devices and it completely detected the damage in the FFU composite beam underthe single load test. The highest energy was predicted to appear at the period of ultimate damage, andthe beam still had tensile capacity. However, the recording series of the linear variable differentialtransformer (LVDT) was not adequate to collect the data due to large deflection in the next activity.Thus, it was replaced to use a scale recording, which would create some changes. However, it wouldnot influence the whole test.
Figure 7 demonstrates the incremental loading arrangement from the damage progression test(under single load test). Compared to the failure curve, the energy hits were not extremely high. On theother hand, it was clear that the initial cracking could be observed at 34 kN, as shown in Figure 5.In addition, all the initial energy occurred at the middle sensor, which was nearest the cracking source,and there were no signals from the other two sensors. Before the initial damage occurred, an AEactivity corresponded to slight internal damage, fiber cracks, and extraneous noise. This was because,due the Kaiser phenomenon when the beam was unloaded and reloaded back to the loading neededfor the initial crack, there was no AE activity, and hence it was likely to put these in a single timesequence. In fact, the damage changed the flexibility of the beam. Therefore, this was a reason why for1 mm deflection, the load could be less than 2 kN. Moreover, the maximum deflection was 164 mm atthe ultimate load of the sample, around 132 kN.
Infrastructures 2020, 5, x FOR PEER REVIEW 8 of 18
Figure 6. Failure mode of full-scale FFU composite beams under (a) single ultimate load; (b) repeated load.
3.2. Acoustic Emission (AE) Signals
The load–deflection curve shows the elastic and plastic behavior under three-point bending tests with the linear portion showing the elastic area and the nonlinear curve indicating the plastic zone. The load–deflection curves together with AE signals can be found in Figures 7 and 8. The data was collected by the AE devices and it completely detected the damage in the FFU composite beam under the single load test. The highest energy was predicted to appear at the period of ultimate damage, and the beam still had tensile capacity. However, the recording series of the linear variable differential transformer (LVDT) was not adequate to collect the data due to large deflection in the next activity. Thus, it was replaced to use a scale recording, which would create some changes. However, it would not influence the whole test.
Figure 7. Load–deflection against AE energy under single load test.
(a) (b)
(c) (d)
Figure 8. Load–deflection against AE energy under repeated load: (a) fist crack load; (b) 1.5 times the first crack load; (c) 2.5 times the first crack load; (d) ultimate load (170 kN).
Figure 7 demonstrates the incremental loading arrangement from the damage progression test (under single load test). Compared to the failure curve, the energy hits were not extremely high. On the other hand, it was clear that the initial cracking could be observed at 34 kN, as shown in Figure 5. In addition, all the initial energy occurred at the middle sensor, which was nearest the cracking
Figure 7. Load–deflection against AE energy under single load test.
Infrastructures 2020, 5, 50 9 of 18
Infrastructures 2020, 5, x FOR PEER REVIEW 8 of 18
Figure 6. Failure mode of full-scale FFU composite beams under (a) single ultimate load; (b) repeated load.
3.2. Acoustic Emission (AE) Signals
The load–deflection curve shows the elastic and plastic behavior under three-point bending tests with the linear portion showing the elastic area and the nonlinear curve indicating the plastic zone. The load–deflection curves together with AE signals can be found in Figures 7 and 8. The data was collected by the AE devices and it completely detected the damage in the FFU composite beam under the single load test. The highest energy was predicted to appear at the period of ultimate damage, and the beam still had tensile capacity. However, the recording series of the linear variable differential transformer (LVDT) was not adequate to collect the data due to large deflection in the next activity. Thus, it was replaced to use a scale recording, which would create some changes. However, it would not influence the whole test.
Figure 7. Load–deflection against AE energy under single load test.
(a) (b)
(c) (d)
Figure 8. Load–deflection against AE energy under repeated load: (a) fist crack load; (b) 1.5 times the first crack load; (c) 2.5 times the first crack load; (d) ultimate load (170 kN).
Figure 7 demonstrates the incremental loading arrangement from the damage progression test (under single load test). Compared to the failure curve, the energy hits were not extremely high. On the other hand, it was clear that the initial cracking could be observed at 34 kN, as shown in Figure 5. In addition, all the initial energy occurred at the middle sensor, which was nearest the cracking
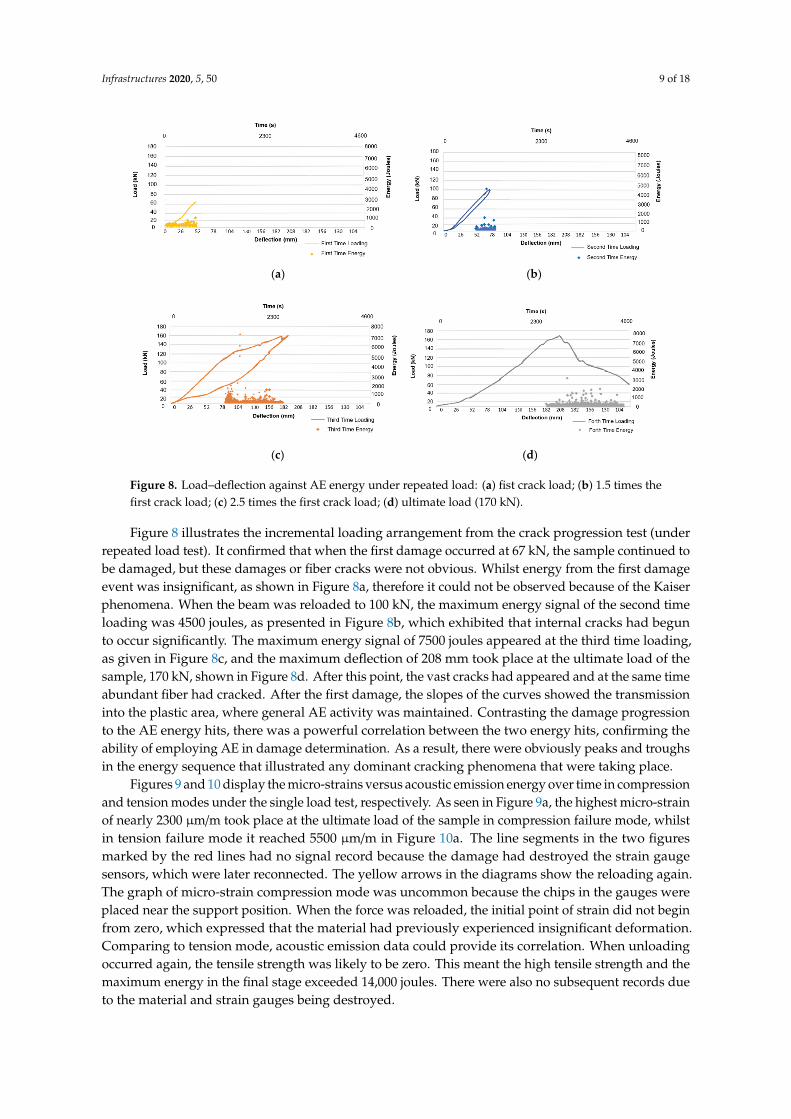
Figure 8. Load–deflection against AE energy under repeated load: (a) fist crack load; (b) 1.5 times thefirst crack load; (c) 2.5 times the first crack load; (d) ultimate load (170 kN).
Figure 8 illustrates the incremental loading arrangement from the crack progression test (underrepeated load test). It confirmed that when the first damage occurred at 67 kN, the sample continued tobe damaged, but these damages or fiber cracks were not obvious. Whilst energy from the first damageevent was insignificant, as shown in Figure 8a, therefore it could not be observed because of the Kaiserphenomena. When the beam was reloaded to 100 kN, the maximum energy signal of the second timeloading was 4500 joules, as presented in Figure 8b, which exhibited that internal cracks had begunto occur significantly. The maximum energy signal of 7500 joules appeared at the third time loading,as given in Figure 8c, and the maximum deflection of 208 mm took place at the ultimate load of thesample, 170 kN, shown in Figure 8d. After this point, the vast cracks had appeared and at the same timeabundant fiber had cracked. After the first damage, the slopes of the curves showed the transmissioninto the plastic area, where general AE activity was maintained. Contrasting the damage progressionto the AE energy hits, there was a powerful correlation between the two energy hits, confirming theability of employing AE in damage determination. As a result, there were obviously peaks and troughsin the energy sequence that illustrated any dominant cracking phenomena that were taking place.
Figures 9 and 10 display the micro-strains versus acoustic emission energy over time in compressionand tension modes under the single load test, respectively. As seen in Figure 9a, the highest micro-strainof nearly 2300 µm/m took place at the ultimate load of the sample in compression failure mode, whilstin tension failure mode it reached 5500 µm/m in Figure 10a. The line segments in the two figuresmarked by the red lines had no signal record because the damage had destroyed the strain gaugesensors, which were later reconnected. The yellow arrows in the diagrams show the reloading again.The graph of micro-strain compression mode was uncommon because the chips in the gauges wereplaced near the support position. When the force was reloaded, the initial point of strain did not beginfrom zero, which expressed that the material had previously experienced insignificant deformation.Comparing to tension mode, acoustic emission data could provide its correlation. When unloadingoccurred again, the tensile strength was likely to be zero. This meant the high tensile strength and themaximum energy in the final stage exceeded 14,000 joules. There were also no subsequent records dueto the material and strain gauges being destroyed.
Infrastructures 2020, 5, 50 10 of 18
Infrastructures 2020, 5, x FOR PEER REVIEW 9 of 18
source, and there were no signals from the other two sensors. Before the initial damage occurred, an AE activity corresponded to slight internal damage, fiber cracks, and extraneous noise. This was because, due the Kaiser phenomenon when the beam was unloaded and reloaded back to the loading needed for the initial crack, there was no AE activity, and hence it was likely to put these in a single time sequence. In fact, the damage changed the flexibility of the beam. Therefore, this was a reason why for 1 mm deflection, the load could be less than 2 kN. Moreover, the maximum deflection was 164 mm at the ultimate load of the sample, around 132 kN.
Figure 8 illustrates the incremental loading arrangement from the crack progression test (under repeated load test). It confirmed that when the first damage occurred at 67 kN, the sample continued to be damaged, but these damages or fiber cracks were not obvious. Whilst energy from the first damage event was insignificant, as shown in Figure 8a, therefore it could not be observed because of the Kaiser phenomena. When the beam was reloaded to 100 kN, the maximum energy signal of the second time loading was 4500 joules, as presented in Figure 8b, which exhibited that internal cracks had begun to occur significantly. The maximum energy signal of 7500 joules appeared at the third time loading, as given in Figure 8c, and the maximum deflection of 208 mm took place at the ultimate load of the sample, 170 kN, shown in Figure 8d. After this point, the vast cracks had appeared and at the same time abundant fiber had cracked. After the first damage, the slopes of the curves showed the transmission into the plastic area, where general AE activity was maintained. Contrasting the damage progression to the AE energy hits, there was a powerful correlation between the two energy hits, confirming the ability of employing AE in damage determination. As a result, there were obviously peaks and troughs in the energy sequence that illustrated any dominant cracking phenomena that were taking place.
Figures 9 and 10 display the micro-strains versus acoustic emission energy over time in compression and tension modes under the single load test, respectively. As seen in Figure 9a, the highest micro-strain of nearly 2300 μm/m took place at the ultimate load of the sample in compression failure mode, whilst in tension failure mode it reached 5500 μm/m in Figure 10a. The line segments in the two figures marked by the red lines had no signal record because the damage had destroyed the strain gauge sensors, which were later reconnected. The yellow arrows in the diagrams show the reloading again. The graph of micro-strain compression mode was uncommon because the chips in the gauges were placed near the support position. When the force was reloaded, the initial point of strain did not begin from zero, which expressed that the material had previously experienced insignificant deformation. Comparing to tension mode, acoustic emission data could provide its correlation. When unloading occurred again, the tensile strength was likely to be zero. This meant the high tensile strength and the maximum energy in the final stage exceeded 14,000 joules. There were also no subsequent records due to the material and strain gauges being destroyed.
(a) (b)
Figure 9. Micro-strain and AE energy over time in compression mode under single load test (a) micro-strain; (b) AE energy.
Figure 9. Micro-strain and AE energy over time in compression mode under single load test(a) micro-strain; (b) AE energy.Infrastructures 2020, 5, x FOR PEER REVIEW 10 of 18
(a) (b)
Figure 10. Micro-strain and AE energy over time in tension mode under single load test (a) micro-strain; (b) AE energy.
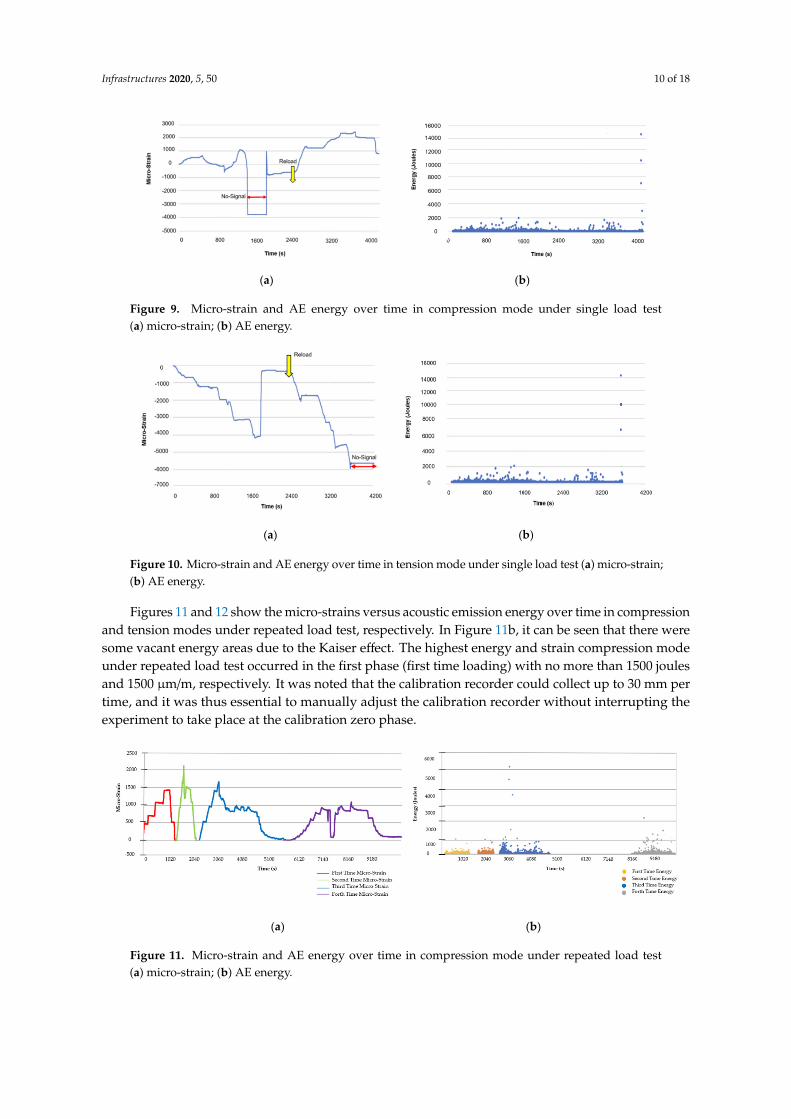
Figures 11 and 12 show the micro-strains versus acoustic emission energy over time in compression and tension modes under repeated load test, respectively. In Figure 11b, it can be seen that there were some vacant energy areas due to the Kaiser effect. The highest energy and strain compression mode under repeated load test occurred in the first phase (first time loading) with no more than 1500 joules and 1500 μm/m, respectively. It was noted that the calibration recorder could collect up to 30 mm per time, and it was thus essential to manually adjust the calibration recorder without interrupting the experiment to take place at the calibration zero phase.
(a) (b)
Figure 11. Micro-strain and AE energy over time in compression mode under repeated load test (a) micro-strain; (b) AE energy.
(a) (b)
Figure 12. Micro-strain and AE energy over time in tension mode under repeated load test (a) micro-strain; (b) AE energy.
Figure 10. Micro-strain and AE energy over time in tension mode under single load test (a) micro-strain;(b) AE energy.
Figures 11 and 12 show the micro-strains versus acoustic emission energy over time in compressionand tension modes under repeated load test, respectively. In Figure 11b, it can be seen that there weresome vacant energy areas due to the Kaiser effect. The highest energy and strain compression modeunder repeated load test occurred in the first phase (first time loading) with no more than 1500 joulesand 1500 µm/m, respectively. It was noted that the calibration recorder could collect up to 30 mm pertime, and it was thus essential to manually adjust the calibration recorder without interrupting theexperiment to take place at the calibration zero phase.
Infrastructures 2020, 5, x FOR PEER REVIEW 10 of 18
(a) (b)
Figure 10. Micro-strain and AE energy over time in tension mode under single load test (a) micro-strain; (b) AE energy.
Figures 11 and 12 show the micro-strains versus acoustic emission energy over time in compression and tension modes under repeated load test, respectively. In Figure 11b, it can be seen that there were some vacant energy areas due to the Kaiser effect. The highest energy and strain compression mode under repeated load test occurred in the first phase (first time loading) with no more than 1500 joules and 1500 μm/m, respectively. It was noted that the calibration recorder could collect up to 30 mm per time, and it was thus essential to manually adjust the calibration recorder without interrupting the experiment to take place at the calibration zero phase.
(a) (b)
Figure 11. Micro-strain and AE energy over time in compression mode under repeated load test (a) micro-strain; (b) AE energy.
(a) (b)
Figure 12. Micro-strain and AE energy over time in tension mode under repeated load test (a) micro-strain; (b) AE energy.
Figure 11. Micro-strain and AE energy over time in compression mode under repeated load test(a) micro-strain; (b) AE energy.
Infrastructures 2020, 5, 50 11 of 18
Infrastructures 2020, 5, x FOR PEER REVIEW 10 of 18
(a) (b)
Figure 10. Micro-strain and AE energy over time in tension mode under single load test (a) micro-strain; (b) AE energy.
Figures 11 and 12 show the micro-strains versus acoustic emission energy over time in compression and tension modes under repeated load test, respectively. In Figure 11b, it can be seen that there were some vacant energy areas due to the Kaiser effect. The highest energy and strain compression mode under repeated load test occurred in the first phase (first time loading) with no more than 1500 joules and 1500 μm/m, respectively. It was noted that the calibration recorder could collect up to 30 mm per time, and it was thus essential to manually adjust the calibration recorder without interrupting the experiment to take place at the calibration zero phase.
(a) (b)
Figure 11. Micro-strain and AE energy over time in compression mode under repeated load test (a) micro-strain; (b) AE energy.
(a) (b)
Figure 12. Micro-strain and AE energy over time in tension mode under repeated load test (a) micro-strain; (b) AE energy.
Figure 12. Micro-strain and AE energy over time in tension mode under repeated load test(a) micro-strain; (b) AE energy.
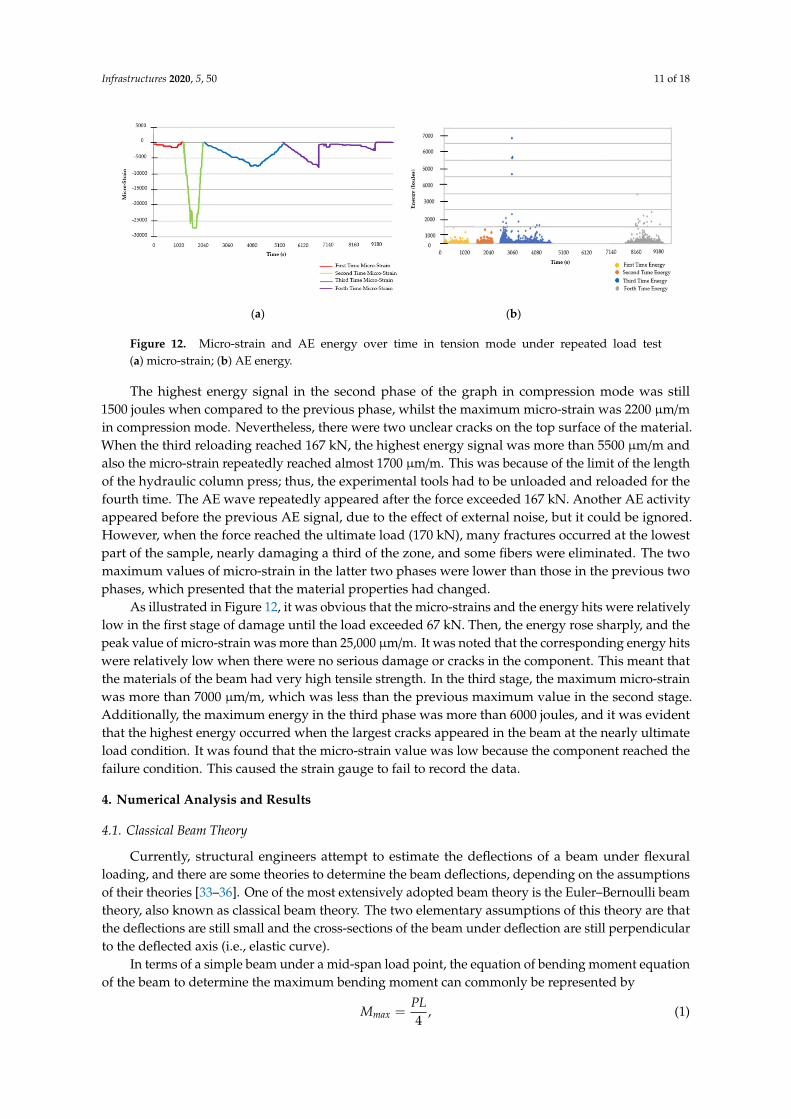
The highest energy signal in the second phase of the graph in compression mode was still1500 joules when compared to the previous phase, whilst the maximum micro-strain was 2200 µm/min compression mode. Nevertheless, there were two unclear cracks on the top surface of the material.When the third reloading reached 167 kN, the highest energy signal was more than 5500 µm/m andalso the micro-strain repeatedly reached almost 1700 µm/m. This was because of the limit of the lengthof the hydraulic column press; thus, the experimental tools had to be unloaded and reloaded for thefourth time. The AE wave repeatedly appeared after the force exceeded 167 kN. Another AE activityappeared before the previous AE signal, due to the effect of external noise, but it could be ignored.However, when the force reached the ultimate load (170 kN), many fractures occurred at the lowestpart of the sample, nearly damaging a third of the zone, and some fibers were eliminated. The twomaximum values of micro-strain in the latter two phases were lower than those in the previous twophases, which presented that the material properties had changed.
As illustrated in Figure 12, it was obvious that the micro-strains and the energy hits were relativelylow in the first stage of damage until the load exceeded 67 kN. Then, the energy rose sharply, and thepeak value of micro-strain was more than 25,000 µm/m. It was noted that the corresponding energy hitswere relatively low when there were no serious damage or cracks in the component. This meant thatthe materials of the beam had very high tensile strength. In the third stage, the maximum micro-strainwas more than 7000 µm/m, which was less than the previous maximum value in the second stage.Additionally, the maximum energy in the third phase was more than 6000 joules, and it was evidentthat the highest energy occurred when the largest cracks appeared in the beam at the nearly ultimateload condition. It was found that the micro-strain value was low because the component reached thefailure condition. This caused the strain gauge to fail to record the data.
4. Numerical Analysis and Results
4.1. Classical Beam Theory
Currently, structural engineers attempt to estimate the deflections of a beam under flexuralloading, and there are some theories to determine the beam deflections, depending on the assumptionsof their theories [33–36]. One of the most extensively adopted beam theory is the Euler–Bernoulli beamtheory, also known as classical beam theory. The two elementary assumptions of this theory are thatthe deflections are still small and the cross-sections of the beam under deflection are still perpendicularto the deflected axis (i.e., elastic curve).
In terms of a simple beam under a mid-span load point, the equation of bending moment equationof the beam to determine the maximum bending moment can commonly be represented by
Mmax =PL4
, (1)
Infrastructures 2020, 5, 50 12 of 18
where Mmax is the maximum bending moment (Nm), P is the load point at mid-span of the beam(N), and L is the full length of the beam measured between centers of support (m). As is known,the maximum deflection of a simply supported beam appears at the mid-point. Hence, the equation ofthe maximum deflections can be identified by
δmax =PL3
48EI, (2)
Herein, δmax is the maximum deflections at the centre (m), E denotes the elastic modulus of thematerial from that the beam is manufactured (N/m2), and I expresses the area moment of inertia (m4).
4.2. A Finite Element Model of the FFU Composite Beam
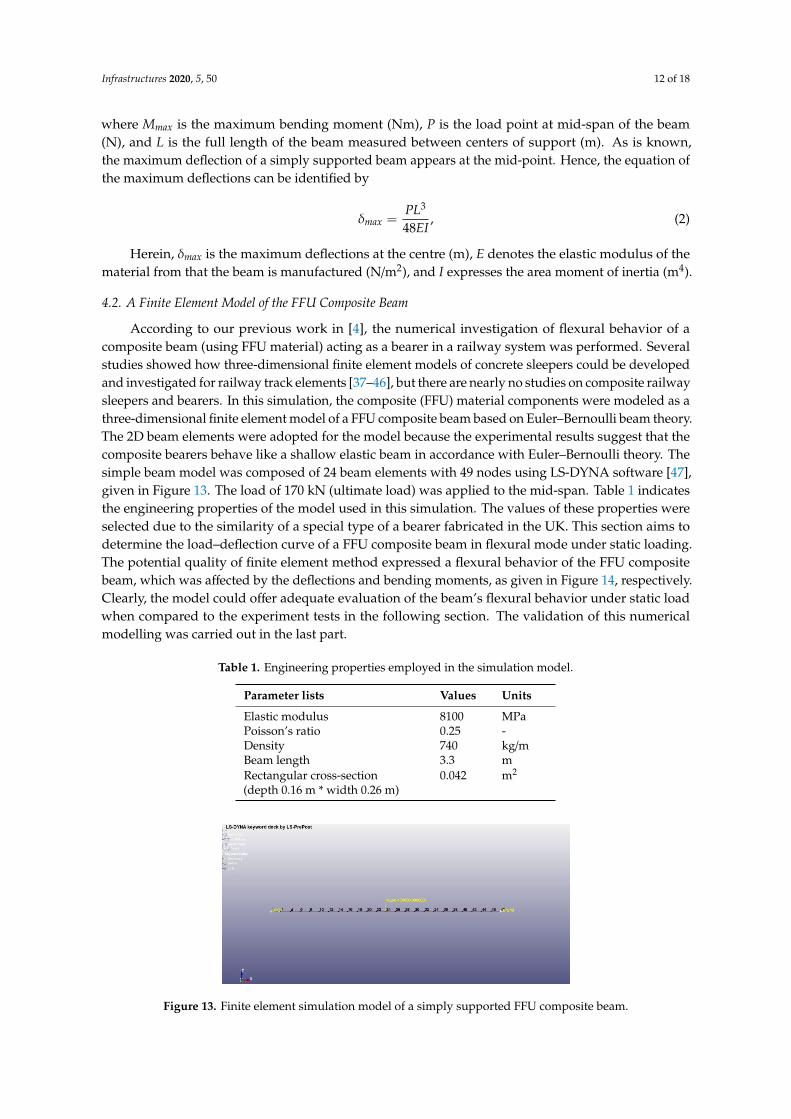
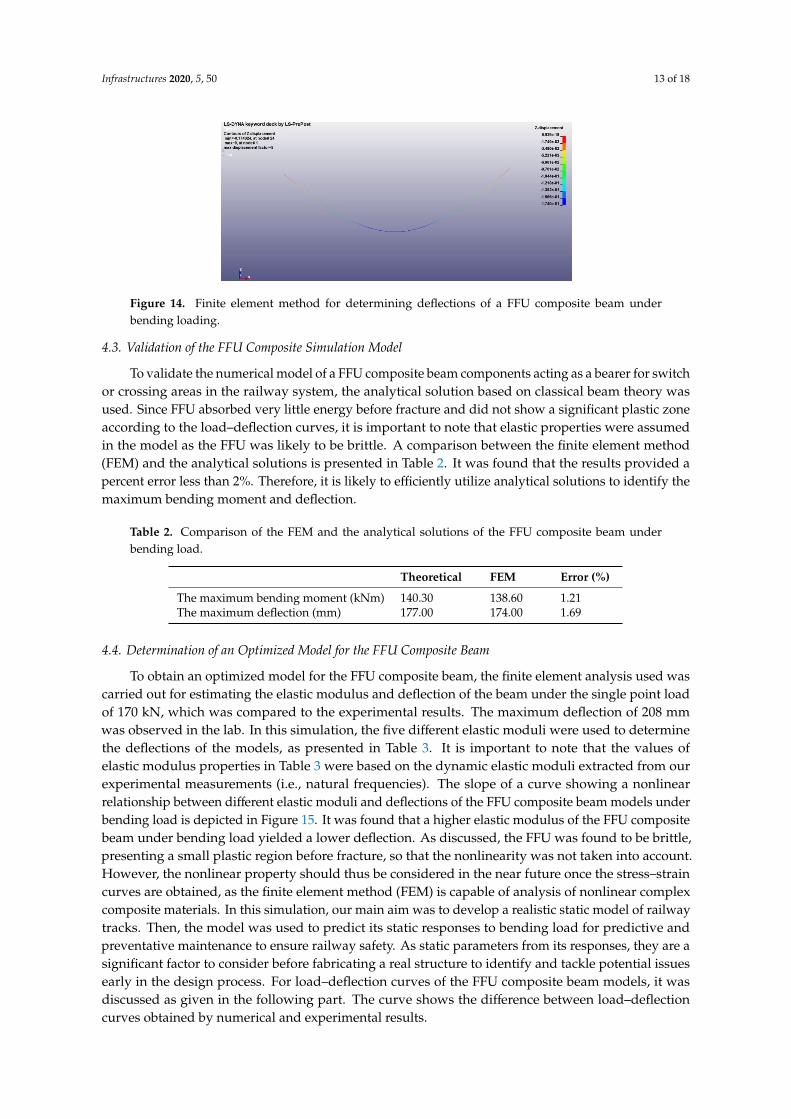
According to our previous work in [4], the numerical investigation of flexural behavior of acomposite beam (using FFU material) acting as a bearer in a railway system was performed. Severalstudies showed how three-dimensional finite element models of concrete sleepers could be developedand investigated for railway track elements [37–46], but there are nearly no studies on composite railwaysleepers and bearers. In this simulation, the composite (FFU) material components were modeled as athree-dimensional finite element model of a FFU composite beam based on Euler–Bernoulli beam theory.The 2D beam elements were adopted for the model because the experimental results suggest that thecomposite bearers behave like a shallow elastic beam in accordance with Euler–Bernoulli theory. Thesimple beam model was composed of 24 beam elements with 49 nodes using LS-DYNA software [47],given in Figure 13. The load of 170 kN (ultimate load) was applied to the mid-span. Table 1 indicatesthe engineering properties of the model used in this simulation. The values of these properties wereselected due to the similarity of a special type of a bearer fabricated in the UK. This section aims todetermine the load–deflection curve of a FFU composite beam in flexural mode under static loading.The potential quality of finite element method expressed a flexural behavior of the FFU compositebeam, which was affected by the deflections and bending moments, as given in Figure 14, respectively.Clearly, the model could offer adequate evaluation of the beam’s flexural behavior under static loadwhen compared to the experiment tests in the following section. The validation of this numericalmodelling was carried out in the last part.
Table 1. Engineering properties employed in the simulation model.
Parameter lists Values Units
Elastic modulus 8100 MPaPoisson’s ratio 0.25 -Density 740 kg/mBeam length 3.3 mRectangular cross-section(depth 0.16 m * width 0.26 m)
0.042 m2
Infrastructures 2020, 5, x FOR PEER REVIEW 12 of 18
developed and investigated for railway track elements [37–46], but there are nearly no studies on composite railway sleepers and bearers. In this simulation, the composite (FFU) material components were modeled as a three-dimensional finite element model of a FFU composite beam based on Euler–Bernoulli beam theory. The 2D beam elements were adopted for the model because the experimental results suggest that the composite bearers behave like a shallow elastic beam in accordance with Euler–Bernoulli theory. The simple beam model was composed of 24 beam elements with 49 nodes using LS-DYNA software [47], given in Figure 13. The load of 170 kN (ultimate load) was applied to the mid-span. Table 1 indicates the engineering properties of the model used in this simulation. The values of these properties were selected due to the similarity of a special type of a bearer fabricated in the UK. This section aims to determine the load–deflection curve of a FFU composite beam in flexural mode under static loading. The potential quality of finite element method expressed a flexural behavior of the FFU composite beam, which was affected by the deflections and bending moments, as given in Figure 14, respectively. Clearly, the model could offer adequate evaluation of the beam’s flexural behavior under static load when compared to the experiment tests in the following section. The validation of this numerical modelling was carried out in the last part.
Table 1. Engineering properties employed in the simulation model.
Parameter lists Values Units Elastic modulus 8100 MPa Poisson’s ratio 0.25 - Density 740 kg/m Beam length 3.3 m Rectangular cross-section (depth 0.16 m * width 0.26 m)
0.042 m2
Figure 13. Finite element simulation model of a simply supported FFU composite beam.
Figure 14. Finite element method for determining deflections of a FFU composite beam under bending loading.
4.3. Validation of the FFU Composite Simulation Model
To validate the numerical model of a FFU composite beam components acting as a bearer for switch or crossing areas in the railway system, the analytical solution based on classical beam theory
Figure 13. Finite element simulation model of a simply supported FFU composite beam.
Infrastructures 2020, 5, 50 13 of 18
Infrastructures 2020, 5, x FOR PEER REVIEW 12 of 18
developed and investigated for railway track elements [37–46], but there are nearly no studies on composite railway sleepers and bearers. In this simulation, the composite (FFU) material components were modeled as a three-dimensional finite element model of a FFU composite beam based on Euler–Bernoulli beam theory. The 2D beam elements were adopted for the model because the experimental results suggest that the composite bearers behave like a shallow elastic beam in accordance with Euler–Bernoulli theory. The simple beam model was composed of 24 beam elements with 49 nodes using LS-DYNA software [47], given in Figure 13. The load of 170 kN (ultimate load) was applied to the mid-span. Table 1 indicates the engineering properties of the model used in this simulation. The values of these properties were selected due to the similarity of a special type of a bearer fabricated in the UK. This section aims to determine the load–deflection curve of a FFU composite beam in flexural mode under static loading. The potential quality of finite element method expressed a flexural behavior of the FFU composite beam, which was affected by the deflections and bending moments, as given in Figure 14, respectively. Clearly, the model could offer adequate evaluation of the beam’s flexural behavior under static load when compared to the experiment tests in the following section. The validation of this numerical modelling was carried out in the last part.
Table 1. Engineering properties employed in the simulation model.
Parameter lists Values Units Elastic modulus 8100 MPa Poisson’s ratio 0.25 - Density 740 kg/m Beam length 3.3 m Rectangular cross-section (depth 0.16 m * width 0.26 m)
0.042 m2
Figure 13. Finite element simulation model of a simply supported FFU composite beam.
Figure 14. Finite element method for determining deflections of a FFU composite beam under bending loading.
4.3. Validation of the FFU Composite Simulation Model
To validate the numerical model of a FFU composite beam components acting as a bearer for switch or crossing areas in the railway system, the analytical solution based on classical beam theory
Figure 14. Finite element method for determining deflections of a FFU composite beam underbending loading.
4.3. Validation of the FFU Composite Simulation Model
To validate the numerical model of a FFU composite beam components acting as a bearer for switchor crossing areas in the railway system, the analytical solution based on classical beam theory wasused. Since FFU absorbed very little energy before fracture and did not show a significant plastic zoneaccording to the load–deflection curves, it is important to note that elastic properties were assumedin the model as the FFU was likely to be brittle. A comparison between the finite element method(FEM) and the analytical solutions is presented in Table 2. It was found that the results provided apercent error less than 2%. Therefore, it is likely to efficiently utilize analytical solutions to identify themaximum bending moment and deflection.
Table 2. Comparison of the FEM and the analytical solutions of the FFU composite beam underbending load.
Theoretical FEM Error (%)
The maximum bending moment (kNm) 140.30 138.60 1.21The maximum deflection (mm) 177.00 174.00 1.69
4.4. Determination of an Optimized Model for the FFU Composite Beam
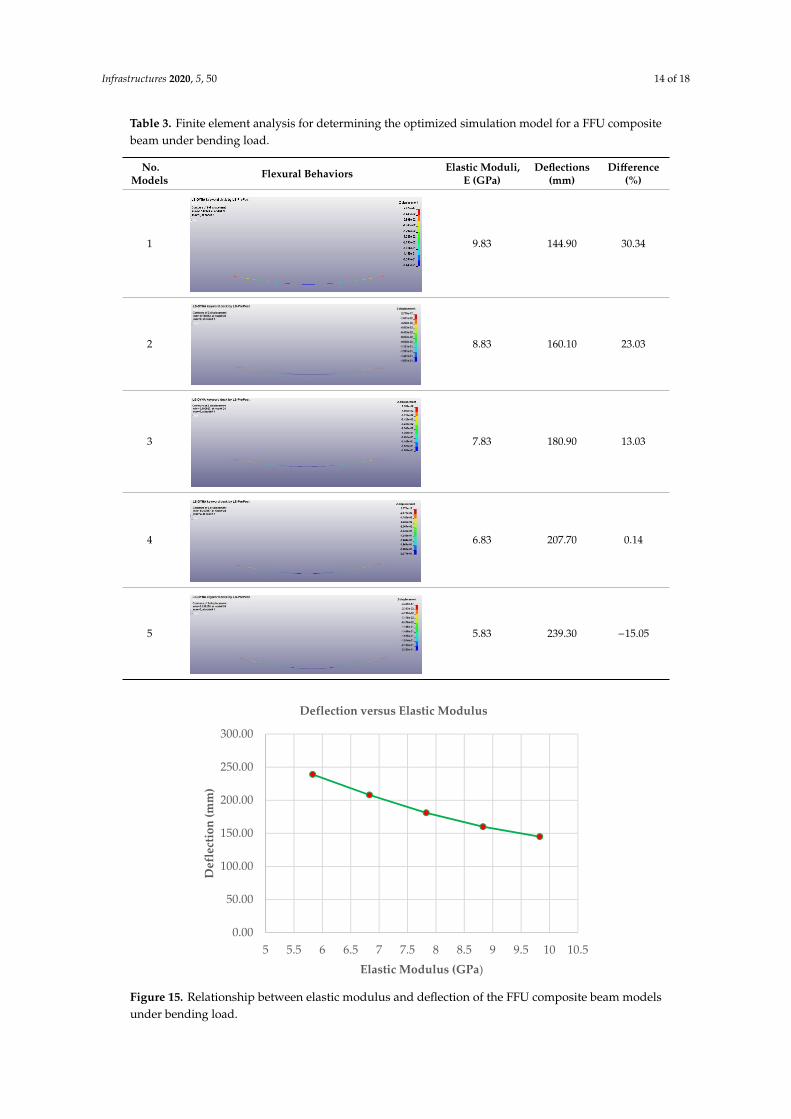
To obtain an optimized model for the FFU composite beam, the finite element analysis used wascarried out for estimating the elastic modulus and deflection of the beam under the single point loadof 170 kN, which was compared to the experimental results. The maximum deflection of 208 mmwas observed in the lab. In this simulation, the five different elastic moduli were used to determinethe deflections of the models, as presented in Table 3. It is important to note that the values ofelastic modulus properties in Table 3 were based on the dynamic elastic moduli extracted from ourexperimental measurements (i.e., natural frequencies). The slope of a curve showing a nonlinearrelationship between different elastic moduli and deflections of the FFU composite beam models underbending load is depicted in Figure 15. It was found that a higher elastic modulus of the FFU compositebeam under bending load yielded a lower deflection. As discussed, the FFU was found to be brittle,presenting a small plastic region before fracture, so that the nonlinearity was not taken into account.However, the nonlinear property should thus be considered in the near future once the stress–straincurves are obtained, as the finite element method (FEM) is capable of analysis of nonlinear complexcomposite materials. In this simulation, our main aim was to develop a realistic static model of railwaytracks. Then, the model was used to predict its static responses to bending load for predictive andpreventative maintenance to ensure railway safety. As static parameters from its responses, they are asignificant factor to consider before fabricating a real structure to identify and tackle potential issuesearly in the design process. For load–deflection curves of the FFU composite beam models, it wasdiscussed as given in the following part. The curve shows the difference between load–deflectioncurves obtained by numerical and experimental results.
Infrastructures 2020, 5, 50 14 of 18
Table 3. Finite element analysis for determining the optimized simulation model for a FFU compositebeam under bending load.
No.Models Flexural Behaviors Elastic Moduli,
E (GPa)Deflections
(mm)Difference
(%)
1
Infrastructures 2020, 5, x FOR PEER REVIEW 13 of 18
was used. Since FFU absorbed very little energy before fracture and did not show a significant plastic zone according to the load–deflection curves, it is important to note that elastic properties were assumed in the model as the FFU was likely to be brittle. A comparison between the finite element method (FEM) and the analytical solutions is presented in Table 2. It was found that the results provided a percent error less than 2%. Therefore, it is likely to efficiently utilize analytical solutions to identify the maximum bending moment and deflection.
Table 2. Comparison of the FEM and the analytical solutions of the FFU composite beam under bending load.
Theoretical FEM Error (%) The maximum bending moment (kNm) 140.30 138.60 1.21 The maximum deflection (mm) 177.00 174.00 1.69
4.4. Determination of an Optimized Model for the FFU Composite Beam
To obtain an optimized model for the FFU composite beam, the finite element analysis used was carried out for estimating the elastic modulus and deflection of the beam under the single point load of 170 kN, which was compared to the experimental results. The maximum deflection of 208 mm was observed in the lab. In this simulation, the five different elastic moduli were used to determine the deflections of the models, as presented in Table 3. It is important to note that the values of elastic modulus properties in Table 3 were based on the dynamic elastic moduli extracted from our experimental measurements (i.e., natural frequencies). The slope of a curve showing a nonlinear relationship between different elastic moduli and deflections of the FFU composite beam models under bending load is depicted in Figure 15. It was found that a higher elastic modulus of the FFU composite beam under bending load yielded a lower deflection. As discussed, the FFU was found to be brittle, presenting a small plastic region before fracture, so that the nonlinearity was not taken into account. However, the nonlinear property should thus be considered in the near future once the stress–strain curves are obtained, as the finite element method (FEM) is capable of analysis of nonlinear complex composite materials. In this simulation, our main aim was to develop a realistic static model of railway tracks. Then, the model was used to predict its static responses to bending load for predictive and preventative maintenance to ensure railway safety. As static parameters from its responses, they are a significant factor to consider before fabricating a real structure to identify and tackle potential issues early in the design process. For load–deflection curves of the FFU composite beam models, it was discussed as given in the following part. The curve shows the difference between load–deflection curves obtained by numerical and experimental results.
Table 3. Finite element analysis for determining the optimized simulation model for a FFU composite beam under bending load.
No. Models Flexural Behaviors Elastic Moduli, E
(GPa)
Deflections (mm)
Difference (%)
1
9.83 144.90 30.34
9.83 144.90 30.34
2
Infrastructures 2020, 5, x FOR PEER REVIEW 14 of 18
2
8.83
160.10
23.03
3
7.83
180.90
13.03
4
6.83
207.70
0.14
5
5.83
239.30
–15.05
Figure 15. Relationship between elastic modulus and deflection of the FFU composite beam models under bending load.
5. Discussion
0.00
50.00
100.00
150.00
200.00
250.00
300.00
5 5.5 6 6.5 7 7.5 8 8.5 9 9.5 10 10.5
Def
lect
ion
(mm
)
Elastic Modulus (GPa)
Deflection versus Elastic Modulus
8.83 160.10 23.03
3
Infrastructures 2020, 5, x FOR PEER REVIEW 14 of 18
2
8.83
160.10
23.03
3
7.83
180.90
13.03
4
6.83
207.70
0.14
5
5.83
239.30
–15.05
Figure 15. Relationship between elastic modulus and deflection of the FFU composite beam models under bending load.
5. Discussion
0.00
50.00
100.00
150.00
200.00
250.00
300.00
5 5.5 6 6.5 7 7.5 8 8.5 9 9.5 10 10.5
Def
lect
ion
(mm
)
Elastic Modulus (GPa)
Deflection versus Elastic Modulus
7.83 180.90 13.03
4
Infrastructures 2020, 5, x FOR PEER REVIEW 14 of 18
2
8.83
160.10
23.03
3
7.83
180.90
13.03
4
6.83
207.70
0.14
5
5.83
239.30
–15.05
Figure 15. Relationship between elastic modulus and deflection of the FFU composite beam models under bending load.
5. Discussion
0.00
50.00
100.00
150.00
200.00
250.00
300.00
5 5.5 6 6.5 7 7.5 8 8.5 9 9.5 10 10.5
Def
lect
ion
(mm
)
Elastic Modulus (GPa)
Deflection versus Elastic Modulus
6.83 207.70 0.14
5
Infrastructures 2020, 5, x FOR PEER REVIEW 14 of 18
2
8.83
160.10
23.03
3
7.83
180.90
13.03
4
6.83
207.70
0.14
5
5.83
239.30
–15.05
Figure 15. Relationship between elastic modulus and deflection of the FFU composite beam models under bending load.
5. Discussion
0.00
50.00
100.00
150.00
200.00
250.00
300.00
5 5.5 6 6.5 7 7.5 8 8.5 9 9.5 10 10.5
Def
lect
ion
(mm
)
Elastic Modulus (GPa)
Deflection versus Elastic Modulus
5.83 239.30 −15.05
Infrastructures 2020, 5, x FOR PEER REVIEW 14 of 18
3
7.83
180.90
13.03
4
6.83
207.70
0.14
5
5.83
239.30
–15.05
Figure 15. Relationship between elastic modulus and deflection of the FFU composite beam models under bending load.
5. Discussion
Based on experimental results, in both cases under single load test and repeated load test, it was found that the acoustic emission (AE) sensing technology was successful in the identification of initial crack activities. The energy hit occurred by these cracks correlated well with other parameters. AE activities were ineffective to anticipate at the end of the experiments when failure was likely to appear. Therefore, the failure mechanisms for these FFU composite beams should be repeatedly evaluated. Obviously, the data collected directly via AE identified the behavior of FFU composite beams under bending load. The experimental load–deflection curves provided a simple approach of real-time damage determination because vertical deformation recordings can detect changes in structural integrity. Furthermore, the load–deflection curves between the experimental and numerical data were found to be bi-linearly and linearly proportional, respectively. A comparison of the load–deflection curves with five different moduli of the FFU composite beam under bending load between the experimental and numerical data is presented in Figure 16. The results were in good agreement with less than 0.14% discrepancy when the elastic modulus of 6.83 GPa was chosen. Besides, the FFU
0.00
50.00
100.00
150.00
200.00
250.00
300.00
5 5.5 6 6.5 7 7.5 8 8.5 9 9.5 10 10.5
Def
lect
ion
(mm
)
Elastic Modulus (GPa)
Deflection versus Elastic Modulus
Figure 15. Relationship between elastic modulus and deflection of the FFU composite beam modelsunder bending load.
Infrastructures 2020, 5, 50 15 of 18
5. Discussion
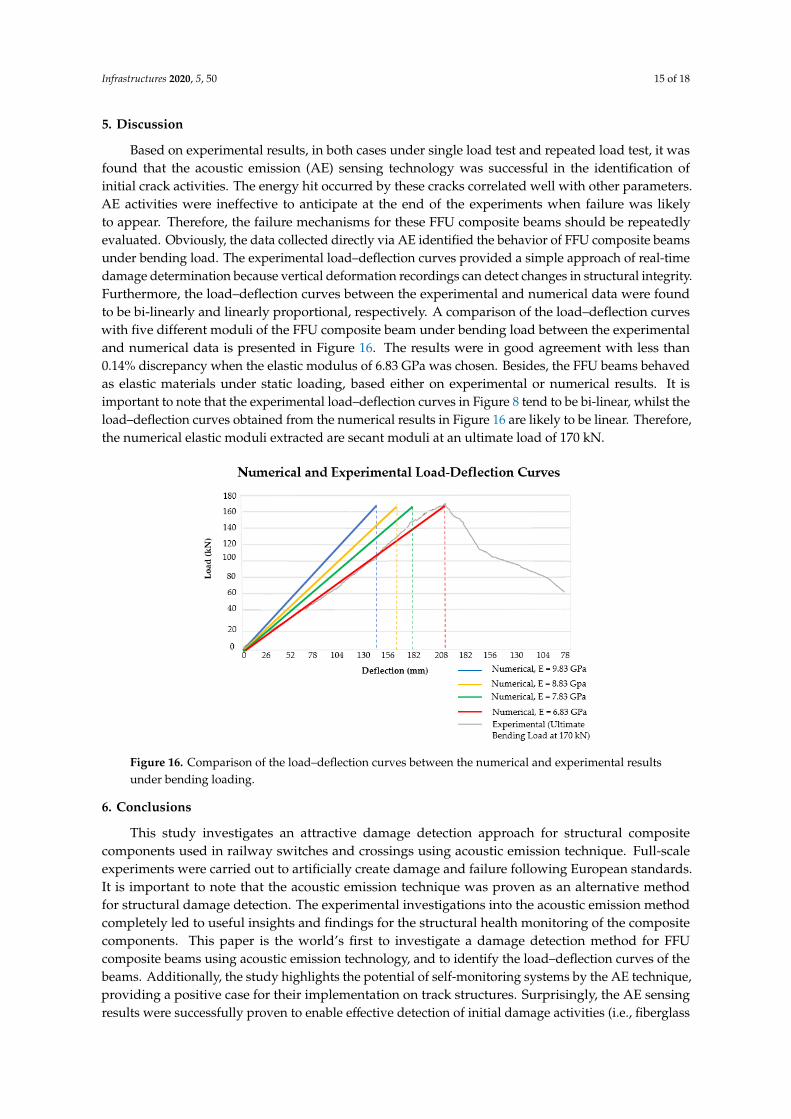
Based on experimental results, in both cases under single load test and repeated load test, it wasfound that the acoustic emission (AE) sensing technology was successful in the identification ofinitial crack activities. The energy hit occurred by these cracks correlated well with other parameters.AE activities were ineffective to anticipate at the end of the experiments when failure was likelyto appear. Therefore, the failure mechanisms for these FFU composite beams should be repeatedlyevaluated. Obviously, the data collected directly via AE identified the behavior of FFU composite beamsunder bending load. The experimental load–deflection curves provided a simple approach of real-timedamage determination because vertical deformation recordings can detect changes in structural integrity.Furthermore, the load–deflection curves between the experimental and numerical data were foundto be bi-linearly and linearly proportional, respectively. A comparison of the load–deflection curveswith five different moduli of the FFU composite beam under bending load between the experimentaland numerical data is presented in Figure 16. The results were in good agreement with less than0.14% discrepancy when the elastic modulus of 6.83 GPa was chosen. Besides, the FFU beams behavedas elastic materials under static loading, based either on experimental or numerical results. It isimportant to note that the experimental load–deflection curves in Figure 8 tend to be bi-linear, whilst theload–deflection curves obtained from the numerical results in Figure 16 are likely to be linear. Therefore,the numerical elastic moduli extracted are secant moduli at an ultimate load of 170 kN.
Infrastructures 2020, 5, x FOR PEER REVIEW 15 of 18
beams behaved as elastic materials under static loading, based either on experimental or numerical results. It is important to note that the experimental load–deflection curves in Figure 8 tend to be bi-linear, whilst the load–deflection curves obtained from the numerical results in Figure 16 are likely to be linear. Therefore, the numerical elastic moduli extracted are secant moduli at an ultimate load of 170 kN.
Figure 16. Comparison of the load–deflection curves between the numerical and experimental results under bending loading.
6. Conclusions
This study investigates an attractive damage detection approach for structural composite components used in railway switches and crossings using acoustic emission technique. Full-scale experiments were carried out to artificially create damage and failure following European standards. It is important to note that the acoustic emission technique was proven as an alternative method for structural damage detection. The experimental investigations into the acoustic emission method completely led to useful insights and findings for the structural health monitoring of the composite components. This paper is the world’s first to investigate a damage detection method for FFU composite beams using acoustic emission technology, and to identify the load–deflection curves of the beams. Additionally, the study highlights the potential of self-monitoring systems by the AE technique, providing a positive case for their implementation on track structures. Surprisingly, the AE sensing results were successfully proven to enable effective detection of initial damage activities (i.e., fiberglass snaps). The comparative results for the load–deflection curves were in good agreement with less than 0.14% discrepancy between the experimental and numerical data. These interesting insights will help railway engineers to effectively detect and monitor any damage in FFU composite beams, also developing realistic static sleeper/bearer models of railway tracks. Some findings from this study can be drawn as follows: • FFU composite beams can fail in a brittle mode of failure. • The rupture of FFU composite beams occurs rapidly through the delamination of fibers along the
beams. • There is no AE activity within FFU composite beams when the maximum loading does not exceed
the previous loading, due to the Kaiser effect. • The load–deflection curves of FFU composite beams are approximately bi-linearly proportional
even if the structure is damaged. • In this paper, the optimized FFU composite beam model has the elastic modulus E = 6.83 GPa
when damages occur at the ultimate static load.
Figure 16. Comparison of the load–deflection curves between the numerical and experimental resultsunder bending loading.
6. Conclusions
This study investigates an attractive damage detection approach for structural compositecomponents used in railway switches and crossings using acoustic emission technique. Full-scaleexperiments were carried out to artificially create damage and failure following European standards.It is important to note that the acoustic emission technique was proven as an alternative methodfor structural damage detection. The experimental investigations into the acoustic emission methodcompletely led to useful insights and findings for the structural health monitoring of the compositecomponents. This paper is the world’s first to investigate a damage detection method for FFUcomposite beams using acoustic emission technology, and to identify the load–deflection curves of thebeams. Additionally, the study highlights the potential of self-monitoring systems by the AE technique,providing a positive case for their implementation on track structures. Surprisingly, the AE sensingresults were successfully proven to enable effective detection of initial damage activities (i.e., fiberglass
Infrastructures 2020, 5, 50 16 of 18
snaps). The comparative results for the load–deflection curves were in good agreement with lessthan 0.14% discrepancy between the experimental and numerical data. These interesting insightswill help railway engineers to effectively detect and monitor any damage in FFU composite beams,also developing realistic static sleeper/bearer models of railway tracks. Some findings from this studycan be drawn as follows:
• FFU composite beams can fail in a brittle mode of failure.• The rupture of FFU composite beams occurs rapidly through the delamination of fibers along
the beams.• There is no AE activity within FFU composite beams when the maximum loading does not exceed
the previous loading, due to the Kaiser effect.• The load–deflection curves of FFU composite beams are approximately bi-linearly proportional
even if the structure is damaged.• In this paper, the optimized FFU composite beam model has the elastic modulus E = 6.83 GPa
when damages occur at the ultimate static load.
Author Contributions: Conceptualization, S.K. and M.P.; methodology, S.K.; software, S.K. and M.P.; validation,P.S., A.L.O.d.M., and C.N.; formal analysis, P.S., A.L.O.d.M., and C.N.; investigation, S.K., P.S., A.L.O.d.M., andC.N.; resources, S.K., M.P.; writing—original draft preparation, P.S.; writing—review and editing, S.K. and C.N.;visualization, P.S., and A.L.O.d.M.; supervision, S.K. and M.P.; project administration, S.K.; funding acquisition,S.K. All authors have read and agreed to the published version of the manuscript.
Funding: This research was funded by European Commission, grant numbers: H2020-MSCA-RISE No. 691135.
Acknowledgments: The authors are sincerely grateful to European Commission for the financial sponsorship ofthe H2020-MSCA-RISE Project No. 691135 “RISEN: Rail Infrastructure Systems Engineering Network,” whichenables a global research network that tackles the grand challenge of railway infrastructure resilience and advancedsensing in extreme environments (www.risen2rail.eu).
Conflicts of Interest: The authors declare no conflict of interest.
References
1. Ferdous, W.; Manalo, A.; Van, G.; Aravinthan, T. Evaluation of an Innovative Composite Railway Sleeper fora Narrow-Gauge Track under Static Load. J. Compos. Constr. 2018, 22, 04017050. [CrossRef]
2. Van Erp, G.; Mckay, M. Recent Australian Developments in Fibre Composite Railway Sleepers. Electron. J.Struct. Eng. 2013, 13, 62–66.
3. Ferdous, W.; Manalo, A.; Van Erp, G.; Aravinthan, T.; Kaewunruen, S.; Remennikov, A. Composite railwaysleepers – Recent developments, challenges and future prospects. Compos. Struct. 2015, 134, 158–168.[CrossRef]
4. Kaewunruen, S.; Sengsri, P.; de Melo, A.L.O. Experimental and Numerical Investigations of FlexuralBehaviour of Composite Bearers in Railway Switches and Crossings. In Sustainable Issues in TransportationEngineering; Mohammad, L., Abd El-Hakim, R., Eds.; GeoMEast 2019 Sustainable Civil Infrastructures;Springer: Cham, Switzerland, 2019.
5. Silva, É.A.; Pokropski, D.; You, R.; Kaewunruen, S. Comparison of structural design methods for railwaycomposites and plastic sleepers and bearers. Aust. J. Struct. Eng. 2017, 18, 160–177. [CrossRef]
6. Kaewunruen, S. Discussion of “Evaluation of an Innovative Composite Railway Sleeper for a Narrow-GaugeTrack under Static Load” by Wahid Ferdous, Allan Manalo, Gerard Van Erp, Thiru Aravinthan, and KazemGhabraie. J. Compos. Constr. 2019, 23, 07018001. [CrossRef]
7. Kaewunruen, S.; Remennikov, A.M.; Murray, M.H. Introducing a new limit states design concept to railwayconcrete sleepers: An Australian experience. Front. Mater. 2014, 1. [CrossRef]
8. Remennikov, A.M.; Kaewunruen, S. A review of loading conditions for railway track structures due to trainand track vertical interaction. Struct. Control Health Monit. 2008, 15, 207–234. [CrossRef]
9. Remennikov, A.; Kaewunruen, S. Experimental Investigation on Dynamic Railway Sleeper/Ballast Interaction.Exp. Mech. 2006, 46, 57–66. [CrossRef]
Infrastructures 2020, 5, 50 17 of 18
10. Kaewunruen, S.; Remennikov, A.M. Application of vibration measurements and finite element modelupdating for structural health monitoring of ballasted railtrack sleepers with voids and pockets. In MechanicalVibrations: Measurement, Effects and Control; Nova Science Publishers: New York, NY, USA, 2009.
11. Kaewunruen, S.; Remennikov, A. Dynamic Effect on Vibration Signatures of Cracks in Railway PrestressedConcrete Sleepers. Adv. Mater. Res. 2008, 41–42, 233–239. [CrossRef]
12. Ngamkhanong, C.; Kaewunruen, S.; Costa, B.J.A. State-of-the-Art Review of Railway Track ResilienceMonitoring. Infrastructures 2018, 3, 3. [CrossRef]
13. Gamage, E.K.; Kaewunruen, S.; Remennikov, A.M.; Ishida, T. Toughness of Railroad Concrete Crossties withHoles and Web Openings. Infrastructures 2017, 2, 3. [CrossRef]
14. Kaewunruen, S.; You, R.; Ishida, M. Composites for Timber-Replacement Bearers in Railway Switches andCrossings. Infrastructures 2017, 2, 13. [CrossRef]
15. Kaewunruen, S.; Remennikov, A.M. Structural Safety of Railway Prestressed Concrete Sleepers. Aust. J.Struct. Eng. 2009, 9, 129–140. [CrossRef]
16. Griffin, D.W.P.; Mirza, O.; Kwok, K.; Kaewunruen, S. Finite Element Modelling of Modular Precast Compositesfor Railway Track Support Structure: A Battle to Save Sydney Harbour Bridge. Aust. J. Struct. Eng. 2015, 16,150–168. [CrossRef]
17. SEKISUI Chemical Gmb, FFU Synthetic Railway Sleepers. Available online: https://www.sekisui-rail.com/
en/ffu-synthetic-wood.html (accessed on 10 January 2020).18. Gunther, K. FFU synthetic sleeper- Project in Europe. Constr. Build. Mater. 2015, 92, 42–50.19. Takai, H.; Sato, Y.; Sato, K. Japanese Twenty Five years Experiences and Standardization of Synthetic Sleeper.
Available online: http://www.railway-research.org/IMG/pdf/589.pdf (accessed on 15 January 2020).20. NDT Resource Centre. Acoustic Emission (AE)—Introduction to Acoustic Emission Testing. Available online:
https://www.nde-ed.org/AboutNDT/aboutndt.htm (accessed on 20 January 2020).21. Graham, L.J.; Alers, G.A. Acoustic Emission in the Frequency Domain. In Monitoring Structural Integrity
by Acoustic Emission; American Society for Testing and Materials: West Conshohocken, PA, USA, 1975;pp. 11–39.
22. Yilmazer, P. Structural Health Condition Monitoring of Rails Using Acoustic Emission Techniques.Master’s Thesis, The University of Birmingham, Birmingham, UK, 2012.
23. Netravali, A.; Topoleski, L.; Sachse, W.; Phoenix, S. An acoustic emission technique for measuring fibrefragment length distributions in the single-fibre- composite test. Compos. Sci. Technol. 1989, 35, 13–29.[CrossRef]
24. Masayasu, O.; Masakatsu, U.; Takahisa, O.; Yuyama, S. Damage Assessment of Reinforced Concrete BeamsQualified by Acoustic Emission. Struct. J. 2002, 99, 411–417.
25. Nguyen, T.; Narintsoa, R.; Balayssaca, J. Characterization of damage in concrete beams under bending withAcoustic Emission Technique (AET). Constr. Build. Mater. 2018, 187, 487–500. [CrossRef]
26. Ramboll UK Ltd. Hammersmith Flyover—Phase 2 Refurbishment and Strengthening (HFO2). Availableonline: http://www.ramboll.co.uk/projects/ruk/hammersmith-flyover-phase-2#UHPFRC (accessed on25 January 2020).
27. Webb, G.T.; Vardanega, P.J.; Fidler, P.R.A.; Middleton, C.R. Analysis of Structural Health Monitoring Datafrom Hammersmith Flyover. J. Bridge Eng. 2014, 19, 05014003. [CrossRef]
28. Janeliukstis, R.; Clark, A.; Papaelias, M.; Kaewunruen, S. Flexural cracking-induced acoustic emission peakfrequency shift in railway prestressed concrete sleepers. Eng. Struct. 2019, 178, 493–505. [CrossRef]
29. Mccab, W.; Koerner, M.; Loard, J. An acoustic emission behavior of concrete laboratory specimens. ACI J.1976, 13, 367–376.
30. Holcomb, D.J. General Theory of the Kaiser Effect. J. Rock Mech. Min. Sci. Geomech. Abstr. 1993, 30, 929–935.[CrossRef]
31. Grosse, C. Acoustic Emission (AE)—Kaiser Effect, NDT Encyclopedia. 2002. Available online: http://www.ndt.net/ndtaz/content.php?id=476 (accessed on 10 April 2020).
32. BSI Standards Publication Railway Applications—Track—Concrete Sleepers and Bearers Part 2: Prestressed MonoblockSleepers; British Standards Institution (BSI): London, UK, 2016.
33. CALC RESOURSE. Calculation Tools & Engineering Resources. Deflections and Slopes of Simply SupportedBeam. Available online: https://calcresource.com/statics-simple-beam.html (accessed on 25 April 2020).
34. Hibbeler, R.C. Mechanics of Materials, 7th ed.; Pearson—Prentice Hall: Englewood Cliffs, NJ, USA, 2007.
Infrastructures 2020, 5, 50 18 of 18
35. Michael, R.; Lindeburg, P.E. PPI Mechanical Engineering Reference Manual for the PE Exam, 13th ed.; (Hardcover)Comprehensive Reference Manual for the NCEES PE Exam; Professional Publications, Inc. (PPI): Belmont,CA, USA, 2013.
36. Richard, G. Budynas. Shigley’s Mechanical Engineering Design in SI Units, 10th ed.; McGraw-Hill Education:New York, NY, USA, 2014.
37. Cai, Z. Modelling of Rail Track Dynamics and Wheel/Rail Interaction. Ph.D. Thesis, Department of CivilEngineering, Queen’s University, Kingston, ON, Canada, 1992.
38. Grassie, S.L. Dynamic modelling of concrete railway sleepers. J. Sound Vib. 1995, 187, 799–813. [CrossRef]39. Kaewunruen, S.; Remennikov, A.M. Sensitivity analysis of free vibration characteristics of an in situ railway
concrete sleeper to variations of rail pad parameters. J. Sound Vib. 2006, 298, 453–461. [CrossRef]40. Neilsen, J.C.O. Eigenfrequencies and eigenmodes of beam structures on an elastic foundation. J. Sound Vib.
1991, 145, 479–487. [CrossRef]41. Remennikov, A.M.; Kaewunruen, S. Determination of prestressing force in railway concrete sleepers using
dynamic relaxation technique. J. Perform. Const. Fac. 2015, 29, 04014134. [CrossRef]42. Kaewunruen, S.; Lian, Q. Digital twin aided sustainability-based lifecycle management for railway turnout
systems. J. Clean. Prod. 2019, 228, 1537–1551. [CrossRef]43. Kaewunruen, S.; Remennikov, A.M. Field trials for dynamic characteristics of railway track and its components
using impact excitation technique. NDT&E Int. 2007, 40, 510–519. [CrossRef]44. Kaewunruen, S.; Ngamkhanong, C.; Ng, J. Influence of time-dependent material degradation on life cycle
serviceability of interspersed railway tracks due to moving train loads. Eng. Struct. 2019, 199, 109625.[CrossRef]
45. Kaewunruen, S.; Sussman, J.M.; Matsumoto, A. Grand challenges in transportation and transit systems.Front. Built Environ. 2016, 2, 4. [CrossRef]
46. Janeliukstis, R.; Kaewunruen, S. A novel separation technique of flexural loading-induced acoustic emissionsources in railway prestressed concrete sleepers. IEEE Access. 2019, 7, 51426–51440. [CrossRef]
47. Livermore Software Technology Corporation (LSTC). LS-dyna® Keyword User’s Manual; Volume I, Version971; 2007. Available online: http://lstc.com/pdf/ls-dyna_971_manual_k.pdf (accessed on 29 April 2020).
© 2020 by the authors. Licensee MDPI, Basel, Switzerland. This article is an open accessarticle distributed under the terms and conditions of the Creative Commons Attribution(CC BY) license (http://creativecommons.org/licenses/by/4.0/).