Embed Size (px)
Citation preview
DAM FOUNDATION GROUTING at GIBE III DAM: A CASE STUDY
Giuseppe Pittalis Alessandro Cagiano Antonio Pietrangeli Binyam Tesfamariam
Studio Ing. G. Pietrangeli Srl, Via Cicerone 28 – 00193 Rome
1- Introduction Gibe III, located in the Southern Nations, Nationalities and Peoples’ Region of Ethiopia, is the third plant of the Gibe-Omo cascade comprising Gilgel Gibe (IP=200 MW) and Gibe II (IP=420 MW), both operating, Koysha (under construction) and Gibe V (planned). It includes a 250 m high RCC gravity dam which is the world’s highest of its kind. The plant, with its 1’870 MW of installed power and 6’400 GWh of annual energy production, is one of the most important projects in the Ethiopian Government’s commitment to meet the country’s present and future power requirements. The Ethiopian Electric Power company (EEP) is the employer, Salini-Impregilo SpA the EPC general contractor and Studio Pietrangeli Srl the designer. The project is almost completed (spillway works and radial gates installation on the central portion of the dam crest are on-going). The impounding started at the beginning of 2015, bringing forward the power production which started in October 2015. At the end of the 2016 rainy season the reservoir level had reached elevation 865 m a.s.l., corresponding to a maximum head of about 215 m over the dam foundation. This paper illustrates the main features of the grouting works, the injection parameters, the observed correlations between rock-mass characteristic, permeability, grout take and the closure criteria adopted for the curtain grouting.
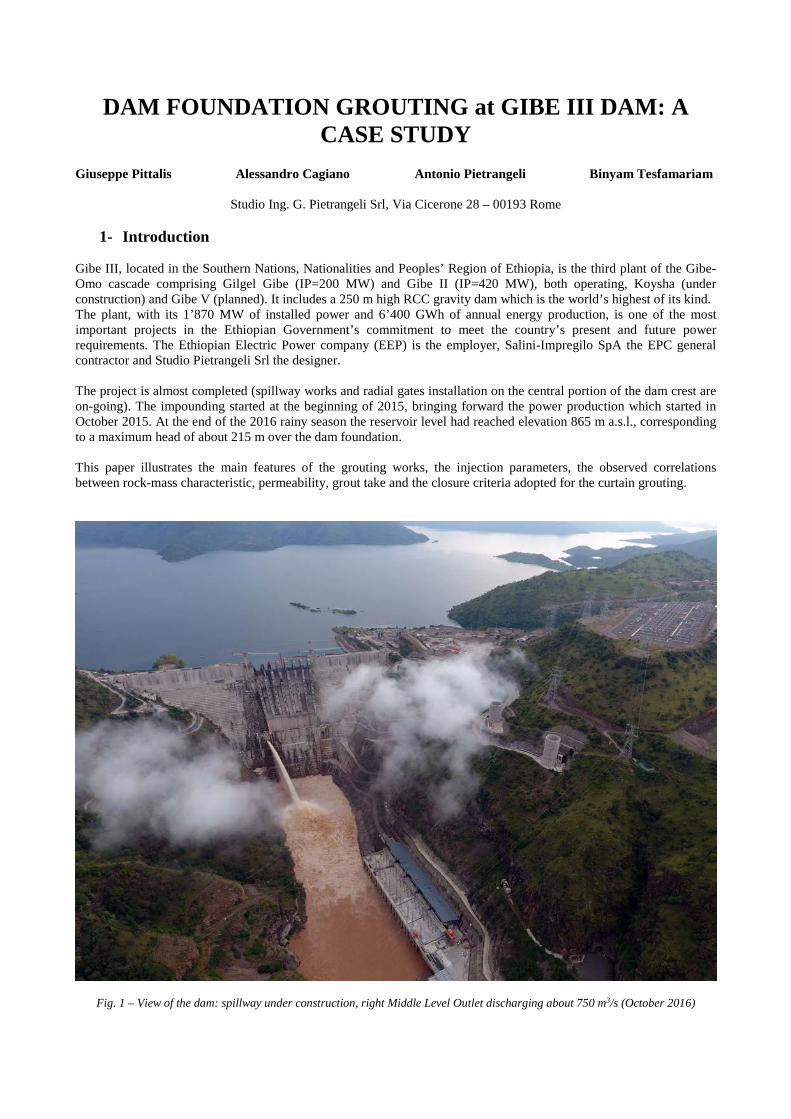
Fig. 1 – View of the dam: spillway under construction, right Middle Level Outlet discharging about 750 m3/s (October 2016)
2- Geological and Geostructural Setting The dam site area is situated on the Jima volcanic formation which characterizes the main part of the South-Western Ethiopian highland. The formation belongs to the tertiary volcano sedimentary units and is mainly constituted of trachyte, basalts, pyroclastics and rhyolite. In the central part, the RCC dam is founded on a dark/light grey trachytic body. The structure of the rock massif is blocky with moderately to widely-spaced sub-vertical joints (almost parallel and perpendicular to river alignment) usually healed with calcite. Sub-horizontal and low persistent joints are observed in the shallow part of the rock massif. The upper zone of the trachytic body has a very low permeability, generally less than 1 UL (with the exception of the zone 5-10 m below the RCC-rock contact where the permeability increases slightly up to 2-3 UL, due to the disturbance and stress relief induced by the excavation).
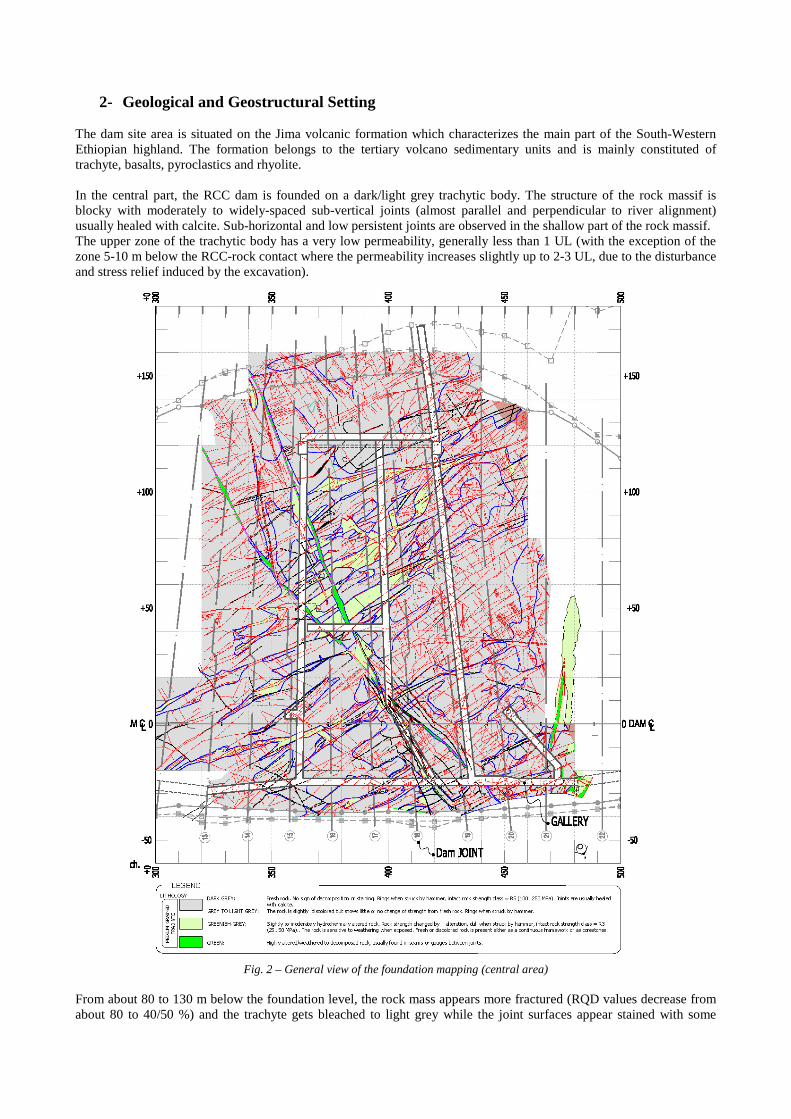
Fig. 2 – General view of the foundation mapping (central area)
From about 80 to 130 m below the foundation level, the rock mass appears more fractured (RQD values decrease from about 80 to 40/50 %) and the trachyte gets bleached to light grey while the joint surfaces appear stained with some
greenish grey trachyte. In this portion of the foundation the roof of a confined artesian aquifer has been detected. The permeability of this lower zone is one order of magnitude higher than that of the upper zone (i.e., 10 up to 30 UL). In some boreholes, at the base of the trachytic body, an impervious level of plastic blacky material has been encountered, with the predominant presence of kaolinite besides muscovite and illite. Slightly-weathered trachyte (SW-T), corresponding to the superficial and effusive part of the magmatic body, is largely observed on the dam abutments. Sub-vertical joints, formed during the cooling process, favoured the weathering and chemical degradation of the intact rock, producing the typical pattern of concentric weathered bands at the crossing between major joints, SW-T is generally blocky to very blocky (two main joint sets and one/two secondary joint sets) with rough to slightly rough, generally undulated, joints and medium to high (main joint sets), or low/medium persistence (secondary joint sets), closed or with small apertures (few millimetres), generally iron-stained or with calcitic infilling. Permeability is in general low to moderate (2-8 UL), slightly higher than that of the dark/light grey trachytic body in the river bed area. Columnar and vacuolar basalt flows, interbedded by metric series of pyroclastic rocks and continental erosional deposits constituted of heterogenic pebbles, are found above the trachytic body, in the upper portion of the dam abutments. Figure 2 illustrates the geological mapping of the central part of the dam foundation area, carried out during the excavation works, and the layout of the dam galleries at the lower level. The presence of the two sub-vertical main joints sets, parallel and perpendicular to the river, is fairly evident. Some weak zones were observed in the trachytic body. These zones are mostly constituted of highly altered/decomposed trachyte bands, potentially erodible, resulting from hydrothermal alteration processes along major persistent vertical joints (bright green areas in Figure 2).
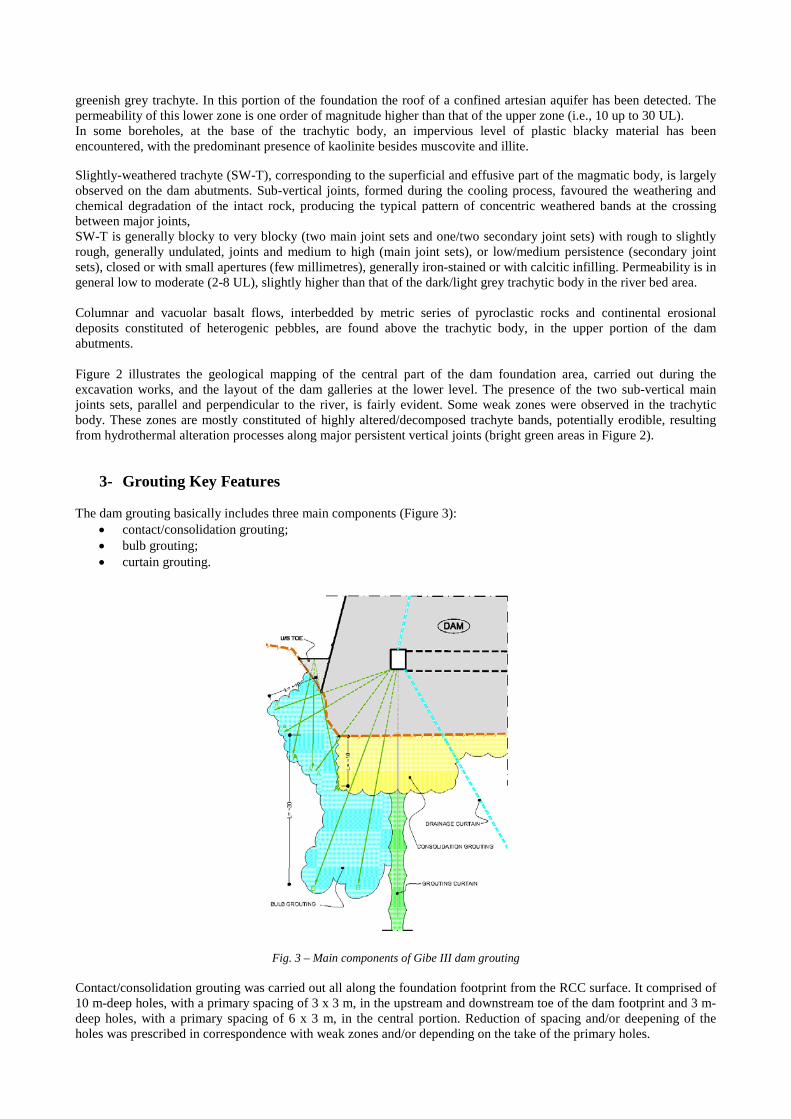
3- Grouting Key Features The dam grouting basically includes three main components (Figure 3):
• contact/consolidation grouting; • bulb grouting; • curtain grouting.
Fig. 3 – Main components of Gibe III dam grouting Contact/consolidation grouting was carried out all along the foundation footprint from the RCC surface. It comprised of 10 m-deep holes, with a primary spacing of 3 x 3 m, in the upstream and downstream toe of the dam footprint and 3 m-deep holes, with a primary spacing of 6 x 3 m, in the central portion. Reduction of spacing and/or deepening of the holes was prescribed in correspondence with weak zones and/or depending on the take of the primary holes.
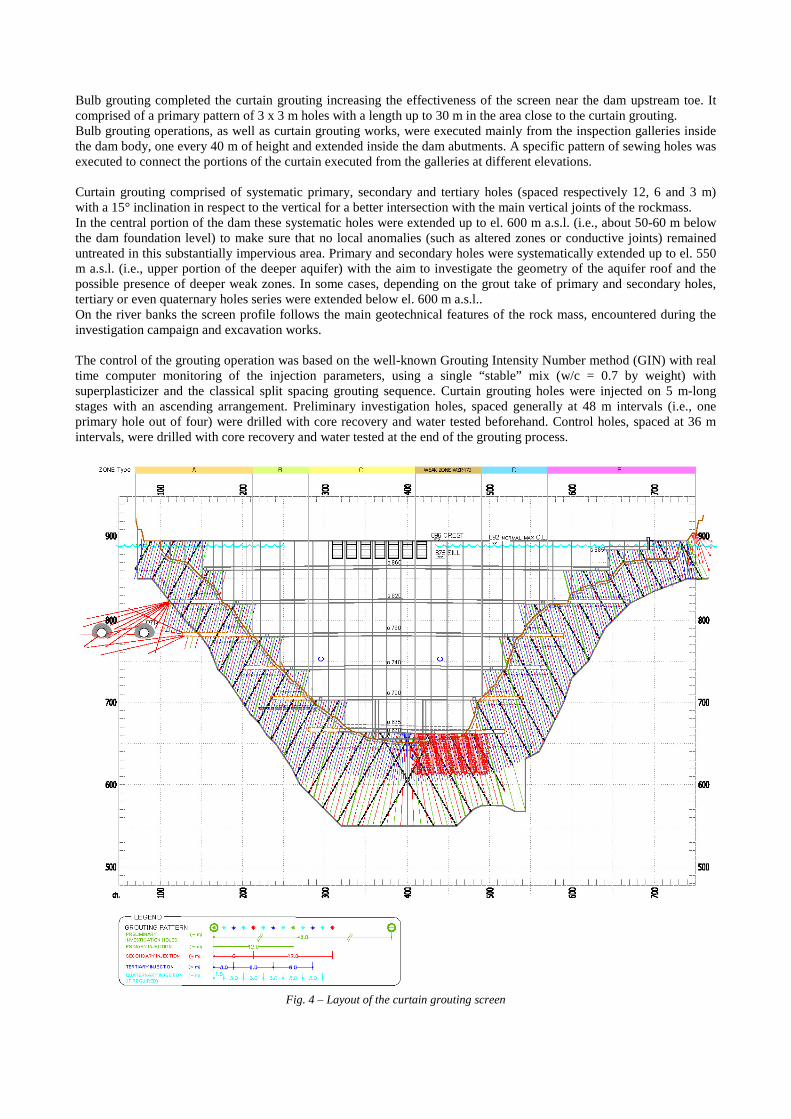
Bulb grouting completed the curtain grouting increasing the effectiveness of the screen near the dam upstream toe. It comprised of a primary pattern of 3 x 3 m holes with a length up to 30 m in the area close to the curtain grouting. Bulb grouting operations, as well as curtain grouting works, were executed mainly from the inspection galleries inside the dam body, one every 40 m of height and extended inside the dam abutments. A specific pattern of sewing holes was executed to connect the portions of the curtain executed from the galleries at different elevations. Curtain grouting comprised of systematic primary, secondary and tertiary holes (spaced respectively 12, 6 and 3 m) with a 15° inclination in respect to the vertical for a better intersection with the main vertical joints of the rockmass. In the central portion of the dam these systematic holes were extended up to el. 600 m a.s.l. (i.e., about 50-60 m below the dam foundation level) to make sure that no local anomalies (such as altered zones or conductive joints) remained untreated in this substantially impervious area. Primary and secondary holes were systematically extended up to el. 550 m a.s.l. (i.e., upper portion of the deeper aquifer) with the aim to investigate the geometry of the aquifer roof and the possible presence of deeper weak zones. In some cases, depending on the grout take of primary and secondary holes, tertiary or even quaternary holes series were extended below el. 600 m a.s.l.. On the river banks the screen profile follows the main geotechnical features of the rock mass, encountered during the investigation campaign and excavation works. The control of the grouting operation was based on the well-known Grouting Intensity Number method (GIN) with real time computer monitoring of the injection parameters, using a single “stable” mix (w/c = 0.7 by weight) with superplasticizer and the classical split spacing grouting sequence. Curtain grouting holes were injected on 5 m-long stages with an ascending arrangement. Preliminary investigation holes, spaced generally at 48 m intervals (i.e., one primary hole out of four) were drilled with core recovery and water tested beforehand. Control holes, spaced at 36 m intervals, were drilled with core recovery and water tested at the end of the grouting process.
Fig. 4 – Layout of the curtain grouting screen
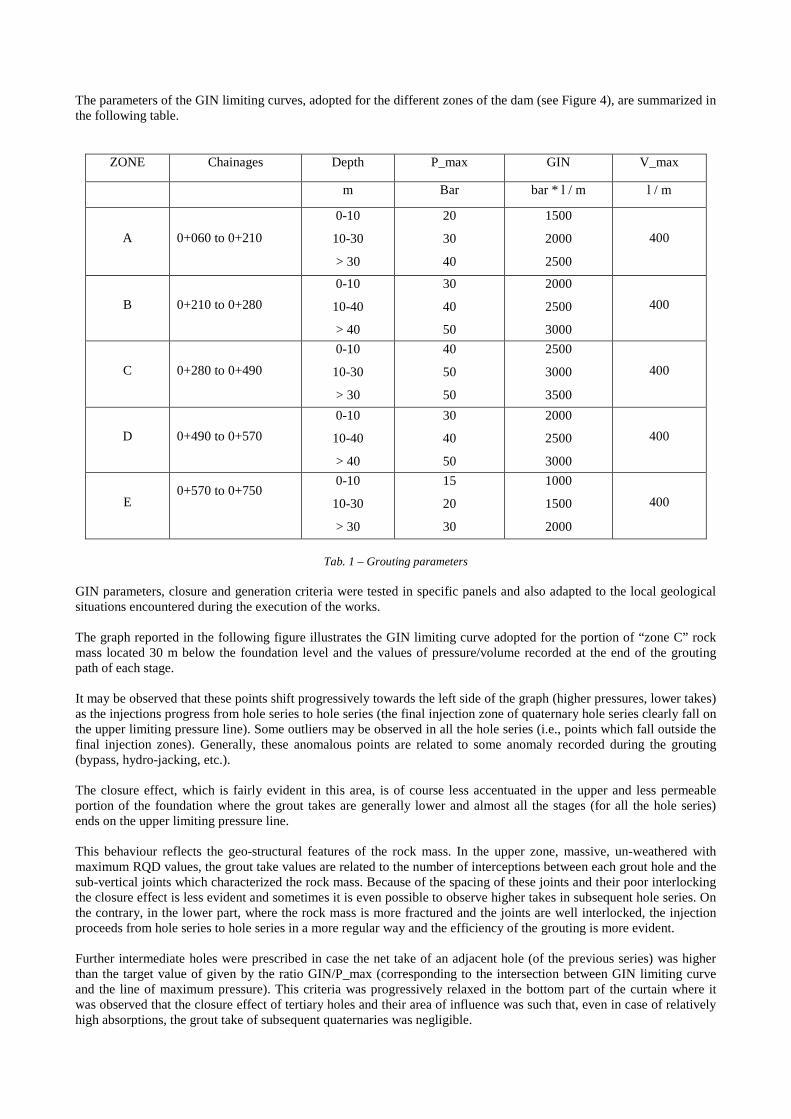
The parameters of the GIN limiting curves, adopted for the different zones of the dam (see Figure 4), are summarized in the following table.
ZONE Chainages Depth P_max GIN V_max
m Bar bar * l / m l / m
A 0+060 to 0+210
0-10
10-30
> 30
20
30
40
1500
2000
2500
400
B 0+210 to 0+280 0-10
10-40
> 40
30
40
50
2000
2500
3000
400
C 0+280 to 0+490 0-10
10-30
> 30
40
50
50
2500
3000
3500
400
D 0+490 to 0+570 0-10
10-40
> 40
30
40
50
2000
2500
3000
400
E 0+570 to 0+750
0-10
10-30
> 30
15
20
30
1000
1500
2000
400
Tab. 1 – Grouting parameters
GIN parameters, closure and generation criteria were tested in specific panels and also adapted to the local geological situations encountered during the execution of the works. The graph reported in the following figure illustrates the GIN limiting curve adopted for the portion of “zone C” rock mass located 30 m below the foundation level and the values of pressure/volume recorded at the end of the grouting path of each stage. It may be observed that these points shift progressively towards the left side of the graph (higher pressures, lower takes) as the injections progress from hole series to hole series (the final injection zone of quaternary hole series clearly fall on the upper limiting pressure line). Some outliers may be observed in all the hole series (i.e., points which fall outside the final injection zones). Generally, these anomalous points are related to some anomaly recorded during the grouting (bypass, hydro-jacking, etc.). The closure effect, which is fairly evident in this area, is of course less accentuated in the upper and less permeable portion of the foundation where the grout takes are generally lower and almost all the stages (for all the hole series) ends on the upper limiting pressure line. This behaviour reflects the geo-structural features of the rock mass. In the upper zone, massive, un-weathered with maximum RQD values, the grout take values are related to the number of interceptions between each grout hole and the sub-vertical joints which characterized the rock mass. Because of the spacing of these joints and their poor interlocking the closure effect is less evident and sometimes it is even possible to observe higher takes in subsequent hole series. On the contrary, in the lower part, where the rock mass is more fractured and the joints are well interlocked, the injection proceeds from hole series to hole series in a more regular way and the efficiency of the grouting is more evident. Further intermediate holes were prescribed in case the net take of an adjacent hole (of the previous series) was higher than the target value of given by the ratio GIN/P_max (corresponding to the intersection between GIN limiting curve and the line of maximum pressure). This criteria was progressively relaxed in the bottom part of the curtain where it was observed that the closure effect of tertiary holes and their area of influence was such that, even in case of relatively high absorptions, the grout take of subsequent quaternaries was negligible.
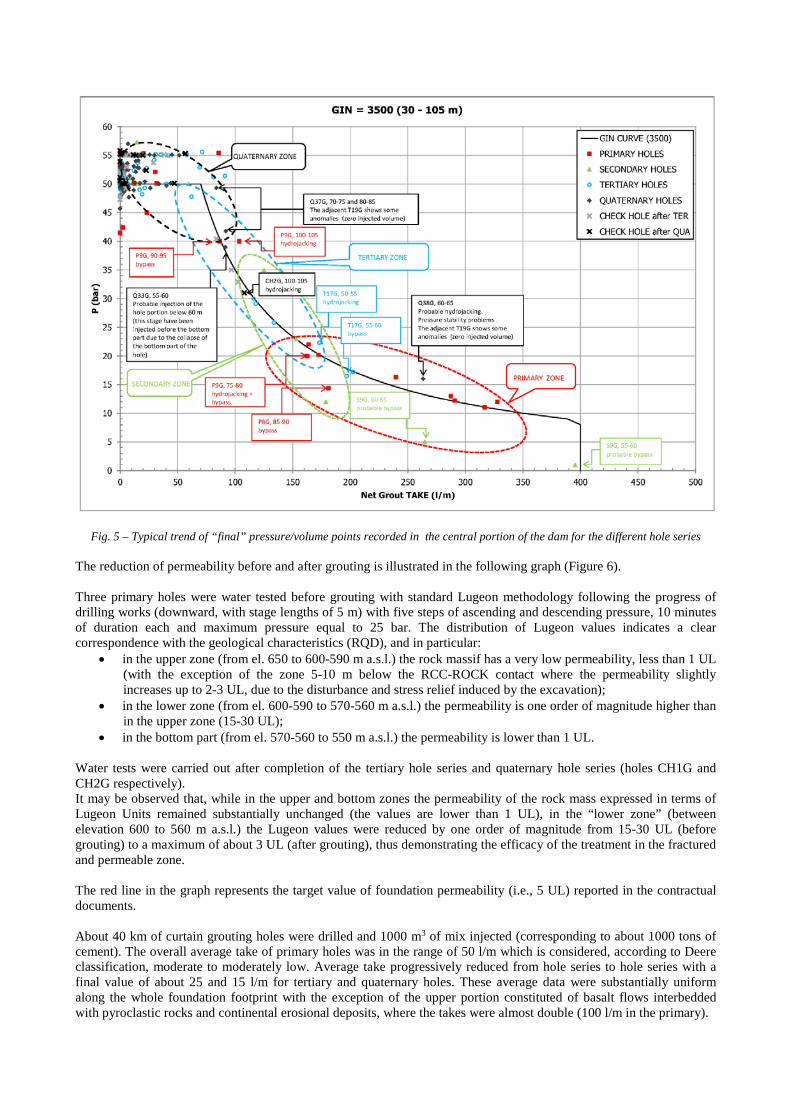
Fig. 5 – Typical trend of “final” pressure/volume points recorded in the central portion of the dam for the different hole series
The reduction of permeability before and after grouting is illustrated in the following graph (Figure 6). Three primary holes were water tested before grouting with standard Lugeon methodology following the progress of drilling works (downward, with stage lengths of 5 m) with five steps of ascending and descending pressure, 10 minutes of duration each and maximum pressure equal to 25 bar. The distribution of Lugeon values indicates a clear correspondence with the geological characteristics (RQD), and in particular:
• in the upper zone (from el. 650 to 600-590 m a.s.l.) the rock massif has a very low permeability, less than 1 UL (with the exception of the zone 5-10 m below the RCC-ROCK contact where the permeability slightly increases up to 2-3 UL, due to the disturbance and stress relief induced by the excavation);
• in the lower zone (from el. 600-590 to 570-560 m a.s.l.) the permeability is one order of magnitude higher than in the upper zone (15-30 UL);
• in the bottom part (from el. 570-560 to 550 m a.s.l.) the permeability is lower than 1 UL. Water tests were carried out after completion of the tertiary hole series and quaternary hole series (holes CH1G and CH2G respectively). It may be observed that, while in the upper and bottom zones the permeability of the rock mass expressed in terms of Lugeon Units remained substantially unchanged (the values are lower than 1 UL), in the “lower zone” (between elevation 600 to 560 m a.s.l.) the Lugeon values were reduced by one order of magnitude from 15-30 UL (before grouting) to a maximum of about 3 UL (after grouting), thus demonstrating the efficacy of the treatment in the fractured and permeable zone. The red line in the graph represents the target value of foundation permeability (i.e., 5 UL) reported in the contractual documents. About 40 km of curtain grouting holes were drilled and 1000 m3 of mix injected (corresponding to about 1000 tons of cement). The overall average take of primary holes was in the range of 50 l/m which is considered, according to Deere classification, moderate to moderately low. Average take progressively reduced from hole series to hole series with a final value of about 25 and 15 l/m for tertiary and quaternary holes. These average data were substantially uniform along the whole foundation footprint with the exception of the upper portion constituted of basalt flows interbedded with pyroclastic rocks and continental erosional deposits, where the takes were almost double (100 l/m in the primary).
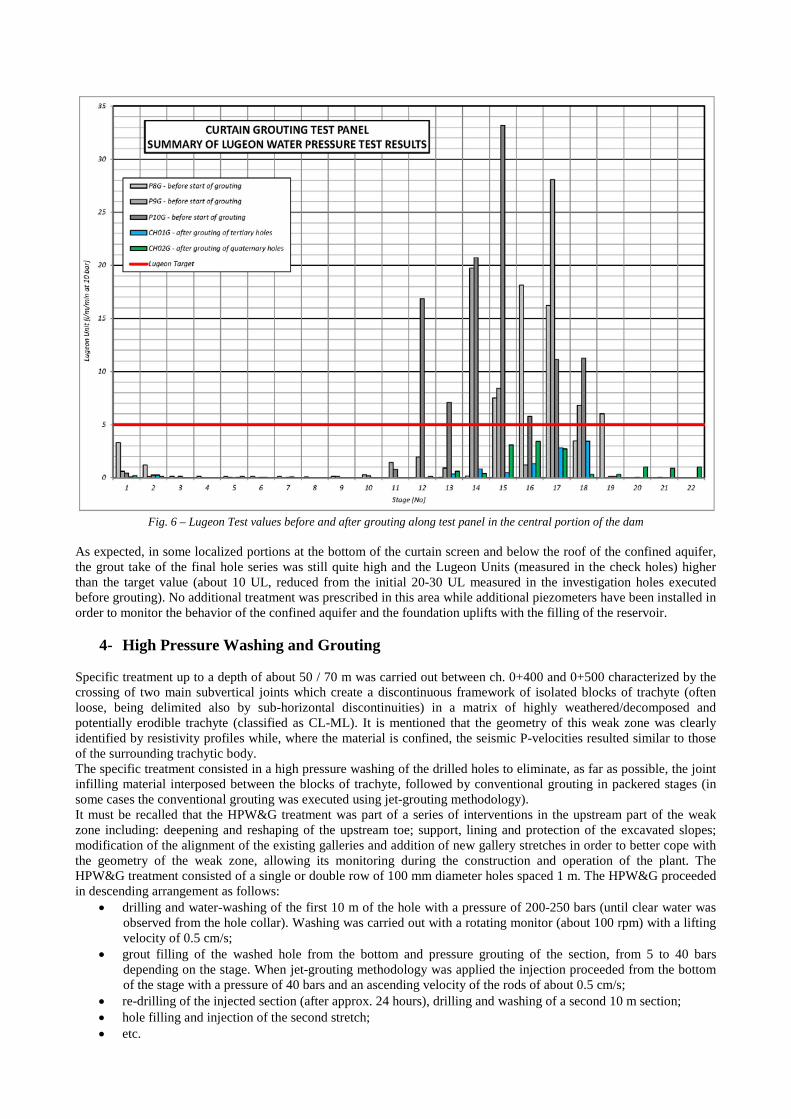
Fig. 6 – Lugeon Test values before and after grouting along test panel in the central portion of the dam
As expected, in some localized portions at the bottom of the curtain screen and below the roof of the confined aquifer, the grout take of the final hole series was still quite high and the Lugeon Units (measured in the check holes) higher than the target value (about 10 UL, reduced from the initial 20-30 UL measured in the investigation holes executed before grouting). No additional treatment was prescribed in this area while additional piezometers have been installed in order to monitor the behavior of the confined aquifer and the foundation uplifts with the filling of the reservoir.
4- High Pressure Washing and Grouting Specific treatment up to a depth of about 50 / 70 m was carried out between ch. 0+400 and 0+500 characterized by the crossing of two main subvertical joints which create a discontinuous framework of isolated blocks of trachyte (often loose, being delimited also by sub-horizontal discontinuities) in a matrix of highly weathered/decomposed and potentially erodible trachyte (classified as CL-ML). It is mentioned that the geometry of this weak zone was clearly identified by resistivity profiles while, where the material is confined, the seismic P-velocities resulted similar to those of the surrounding trachytic body. The specific treatment consisted in a high pressure washing of the drilled holes to eliminate, as far as possible, the joint infilling material interposed between the blocks of trachyte, followed by conventional grouting in packered stages (in some cases the conventional grouting was executed using jet-grouting methodology). It must be recalled that the HPW&G treatment was part of a series of interventions in the upstream part of the weak zone including: deepening and reshaping of the upstream toe; support, lining and protection of the excavated slopes; modification of the alignment of the existing galleries and addition of new gallery stretches in order to better cope with the geometry of the weak zone, allowing its monitoring during the construction and operation of the plant. The HPW&G treatment consisted of a single or double row of 100 mm diameter holes spaced 1 m. The HPW&G proceeded in descending arrangement as follows:
• drilling and water-washing of the first 10 m of the hole with a pressure of 200-250 bars (until clear water was observed from the hole collar). Washing was carried out with a rotating monitor (about 100 rpm) with a lifting velocity of 0.5 cm/s;
• grout filling of the washed hole from the bottom and pressure grouting of the section, from 5 to 40 bars depending on the stage. When jet-grouting methodology was applied the injection proceeded from the bottom of the stage with a pressure of 40 bars and an ascending velocity of the rods of about 0.5 cm/s;
• re-drilling of the injected section (after approx. 24 hours), drilling and washing of a second 10 m section; • hole filling and injection of the second stretch; • etc.
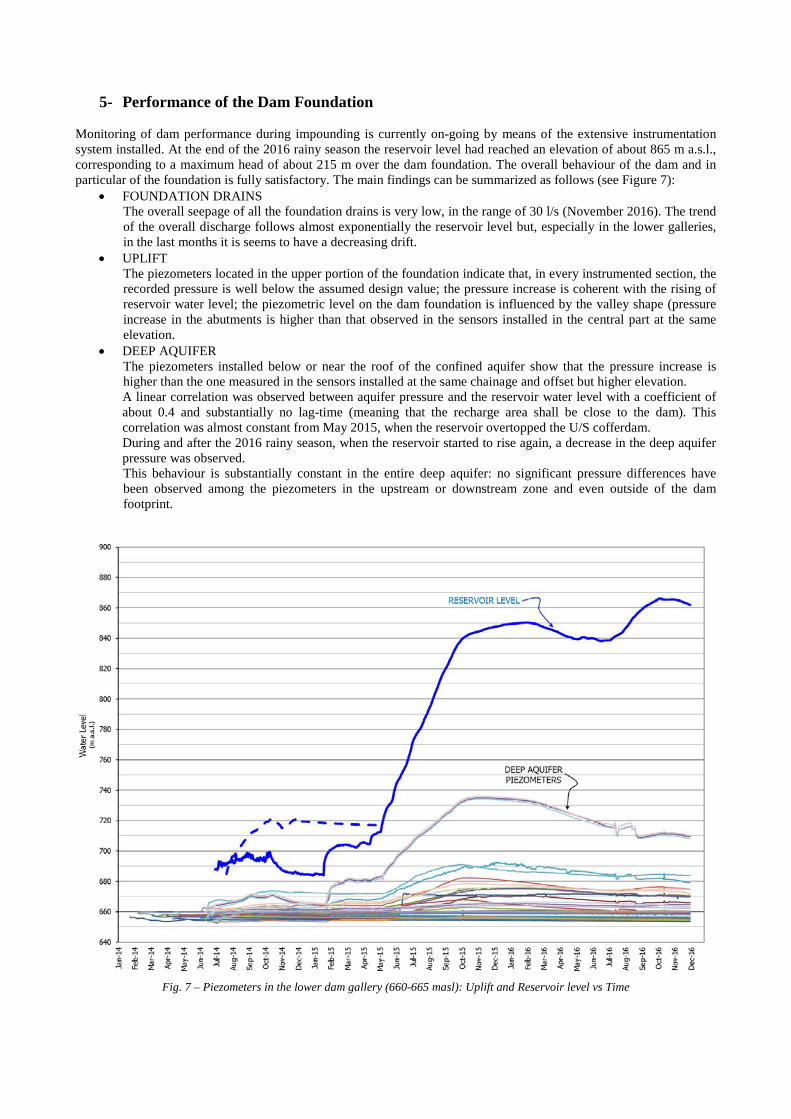
5- Performance of the Dam Foundation Monitoring of dam performance during impounding is currently on-going by means of the extensive instrumentation system installed. At the end of the 2016 rainy season the reservoir level had reached an elevation of about 865 m a.s.l., corresponding to a maximum head of about 215 m over the dam foundation. The overall behaviour of the dam and in particular of the foundation is fully satisfactory. The main findings can be summarized as follows (see Figure 7):
• FOUNDATION DRAINS The overall seepage of all the foundation drains is very low, in the range of 30 l/s (November 2016). The trend of the overall discharge follows almost exponentially the reservoir level but, especially in the lower galleries, in the last months it is seems to have a decreasing drift.
• UPLIFT The piezometers located in the upper portion of the foundation indicate that, in every instrumented section, the recorded pressure is well below the assumed design value; the pressure increase is coherent with the rising of reservoir water level; the piezometric level on the dam foundation is influenced by the valley shape (pressure increase in the abutments is higher than that observed in the sensors installed in the central part at the same elevation.
• DEEP AQUIFER The piezometers installed below or near the roof of the confined aquifer show that the pressure increase is higher than the one measured in the sensors installed at the same chainage and offset but higher elevation. A linear correlation was observed between aquifer pressure and the reservoir water level with a coefficient of about 0.4 and substantially no lag-time (meaning that the recharge area shall be close to the dam). This correlation was almost constant from May 2015, when the reservoir overtopped the U/S cofferdam. During and after the 2016 rainy season, when the reservoir started to rise again, a decrease in the deep aquifer pressure was observed. This behaviour is substantially constant in the entire deep aquifer: no significant pressure differences have been observed among the piezometers in the upstream or downstream zone and even outside of the dam footprint.
Fig. 7 – Piezometers in the lower dam gallery (660-665 masl): Uplift and Reservoir level vs Time
Acknowledgments The authors wish to express their thanks to: Ethiopian Electric Power (EEP); Eugenio Zoppis (Salini-Impregilo, Gibe III Site Manager); Paolo Bianciardi and Valerio Budano (Salini-Impregilo, Gibe III Laboratory Section), Marco Trusso (Salini-Impregilo, Gibe III Drilling Section), Stefano Silvi and Marco Pianigiani (Salini-Impregilo, Gibe III Technical Office). References [1] 2013, C. Rossini, E. Schrader, “Gibe III Dam: Project Summary, Mixes, Properties, Thermal Issues and Cores”,
Water Storage & Hydropower Development for Africa. [2] 2015, A. Asnake, A. Cagiano, B. Ferraro, E. Zoppis, “Managing Unprecedented RCC Challenges at Gibe III Dam”,
Water Storage & Hydropower Development for Africa. [3] 2016, G. Pietrangeli, A. Pietrangeli, A. Cagiano, G. Pittalis, “Design of the Highest RCC Dam (Gibe III, H = 250
m)”, Hydropower and Dams. [4] 2016, G. Pittalis, A. Cagiano, G. Pietrangeli, P. Bianciardi, “Upstream Face Permeability Monitoring at Gibe III
RCC Dam and Resin Injection Works”, Hydropower and Dams. [5] 1993, G. Lombardi, D. Deere, “Grouting design and control using the gin principle”, Water Power & Dam
Construction [6] 1999, G. Lombardi, “Iniezioni di masse rocciose con miscele cementizie. Il concetto GIN”, Rivista Italiana di
Geotecnica [7] 2008, G. Lombardi, “Misunderstanding of GIN confirmed”, The Grout Line, Geotechnical notes The Authors: Giuseppe Pittalis, obtained his degree in Civil Engineering from the University of Rome “La Sapienza”. He works for Studio Pietrangeli as senior dam & hydropower engineer gaining important experience in the feasibility, design and construction of dams, hydropower plants and large hydraulic works in many African countries and South America. His expertise ranges from hydraulics to geo-mechanics, instrumentation and site activities. Alessandro Cagiano, obtained his degree in civil hydraulic engineering from the University of Rome “La Sapienza”. He works for Studio Pietrangeli as senior project manager on important projects such as Gibe II, Gibe III, GERDp, Batoka and Namakhvani cascade. His expertise ranges from the phases of final design to supervision of construction and site activities of dams, hydropower plants and large hydraulic works, including project management, design coordination, budgeting and scheduling activities and cost assessment. Antonio Pietrangeli, obtained his degree in civil hydraulic engineering from the University of Rome “La Sapienza”. In recent years, as managing partner of Studio Pietrangeli, he has been directly responsible for the technical direction and overall management of many of the firm’s projects covering more than 30 large dams (up to 250 m high) and 16 large hydroelectric plants (totalling more than 10’000 MW) in Africa, Europe and South America. Binyam Tesfamariam, obtained his degree in Earth Science (Geology) from Addis Abeba University. He works for Studio Pietrangeli as senior geologist on Gibe III and GERDp sites. He has gained important experience in the feasibility, design and construction of dams, hydropower plants and large hydraulic works in Ethiopia. His expertise ranges from geological and geotechnical studies, site and laboratory investigations, supervision of underground activities.


![SERVIZIO NEWS 19.12...Gibe III dam, which is the first of its kind as a roller compacted concrete dam in the country, has a generation capacity of [Servizio News ] 19.12.2016] 5 1870](https://img.pdfslide.us/doc/110x75/5e39b258af0d5e74973583aa/servizio-news-1912-gibe-iii-dam-which-is-the-first-of-its-kind-as-a-roller.jpg)