Embed Size (px)
Citation preview

CHAPTER 5: DAM FAILURE
71
CHAPTER 5
Dam Failure
5.1 Identifying and Profiling Dam Failure Hazards 5.2 Assessment of Local Dam Failure Vulnerability and Potential Losses 5.3 Assessment of State Dam Failure Vulnerability and Potential Losses
5.4 Mitigation Efforts for Dam Failure Hazards

72
UTAH STATE HAZARD MITIGATION PLAN
5.1 Identifying and Profiling Dam Failure Hazards The purpose of a dam is to store water, or other liquid borne materials for any of several reasons, such as human water supply, irrigation, livestock water supply, energy generation, containment of mine tailings, recreation, pollution or flood control. Many dams fulfill a combination of the above functions.
TYPES OF DAMS
Manmade dams may be classified according to the type of construction material used, the methods used in construction, the slope or cross-section of the dam, the way the dam resists the forces of the water pressure behind it, the means used for controlling seepage, storage characteristics (on a watercourse, off-stream, above or below ground level), and occasionally, according to the purpose of the dam. The materials used for construction of dams include earth, rock, tailings from mining or milling, concrete, masonry, steel, timber, miscellaneous materials (such as plastic or rubber) and combinations of these materials.
Embankment dams are the most common type of dam in use today. Materials used for embankment dams include natural soil or rock or waste materials obtained from mining or milling operations. An embankment dam is termed an “earthfill” or “rockfill” dam depending on whether it is comprised of compacted earth or mostly compacted or dumped rock. The ability of an embankment dam to resist the reservoir water pressure is pri-marily a result of the mass weight, type and strength of the materials from which the dam is made.
Concrete dams maybe categorized into gravity and arch dams according to the designs used to resist the stress due to reservoir water pressure. The most common type of concrete dam is a concrete gravity dam. The mass weight of concrete and friction resist the reservoir water pressure. A buttress dam is a specific type of gravity dam in which the large mass of concrete is reduced, and the forces are diverted to the dam foundation.
OWNERSHIP
Dams are owned and operated by many different types of owners. Sometimes they only serve the interest of the owner—for instance in the case of a neighborhood association that wants its homes built around a lake—and sometimes they serve the interest of communities—for instance in the case of a water supply utility. Downstream development affects a dam’s risk. Dams that used to be out in the rural areas, affecting nothing but open fields, are now affecting neighborhoods and industrial areas. Due to increased development, dam failure consequences have become much higher.
Dams are unique components of the U.S. infrastructure in that most dams are privately owned. Dam owners are solely respon-sible for keeping their dams safe and financing maintenance, repairs and upgrades. Dam maintenance, repairs and upgrades can be expensive. Price tags for non-Federal dam rehabilitation projects commonly range from $100,000 to millions of dollars per dam. Such high price tags place a huge burden on dam owners, many of whom cannot afford to maintain their dams (Living with Dams: Know Your Risk, ASDSO/FEMA).

CHAPTER 5: DAM FAILURE
73
DAM SAFETY RULES
The following are Utah dam safety rules that are in effect as of February 1, 2018:
Rule R655-10. Dam Safety Classifications, Approval Proce-dures and Independent Reviews
Rule R655-11. Requirements for the Design, Construction and Abandonment of Dams
Rule R655-12. Requirements for Operational Dams
Details and full text are available at https://rules.utah.gov/publicat/code/r655/r655.htm.
PROFILING HAZARD EVENT
Dams can pose risks to those living downstream if they are not maintained and operated correctly. Some dams increase safety risks to an often unaware public when they age, deteriorate or malfunction, releasing sudden, dangerous flood flows. There are over 85,000 dams in the U.S. Most every state has at least several hundred dams. More than half of these dams are older than 50 years and many are in need of extensive rehabilitation. Many communities in the United States are impacted by at least one dam. In many cases large populations, vital elements of our infrastructure, jobs, and businesses are located downstream of dams. When dams fail or malfunction, they can adversely affect people, their livelihood and property. Dam failure floods are almost always more sudden and violent than normal stream, river or coastal floods. They often produce damage that looks like tornado damage. The number of dams that pose a risk to human life is steadily increasing. In the last decade, the number has increased by over 1,000 to a total of about almost 14,000. The cause of this increase is a combination of new dam construction and/or downstream development (Living with Dams: Know Your Risk, ASDSO/FEMA).
The State Dam Safety Section has developed a hazard rating system for all regulated dams in Utah. Downstream life and property, the size, height, volume, and incremental risk/damage assessments of dams are all variables used to assign dam hazard ratings in Dam Safety’s classification system. Using the hazard ratings system, dams are placed into one of three classifications: high, mod-erate, and low (damsafety.org, “Dam Safety, Performance Report for the State of Utah”).
High Hazard: is typically defined as a dam whose failure will cause loss of human life and significant property destruction.
Moderate/Significant Hazard: is typically defined as a dam whose failure or will cause significant property destruction.
Low Hazard: is typically defined as a dam whose failure will cause minimal property destruction.
The National Inventory of Dams (NID) contains a list of around 87,000 dams in the U.S. In addition to housing an inventory of the dams in Utah, they have also collected condition data on state regulated dams since 2009. The NID ranks dam conditions as the following:
Satisfactory – No existing or potential dam safety deficiencies are recognized.
Figure 1. Dam Ownership in the United States vs. Utah. Source: damsafety.org, Dam Safety Performance Report: Utah

74
UTAH STATE HAZARD MITIGATION PLAN
Figure 2. Condition Ratings of Utah’s Regulated High Hazard Dams
Fair – No existing dam safety deficiencies are recognized for normal loading conditions. Rare or extreme hydrologic and/or seis-mic events may result in a dam safety deficiency.
Poor – A dam safety deficiency is recognized for loading conditions which may realistically occur. Remedial action is necessary.
Unsatisfactory – A dam safety deficiency is recognized that requires immediate or emergency remedial action for problem resolution.
Not Rated – The dam has not been inspected or has been inspected but, for whatever reason, has not been rated.
Total NID Dams 833
Total NID High Hazard Dams 242
Total State Regulated Dams 698
Total State Regulated High Hazard Dams 209
Total State Regulated Significant Hazard Dams 197
Total State Regulated Low Hazard Dams 292
According to the 2017 Dam Safety State Program Statistics, Utah contains the following list of NID and state regulated dams:

Utah Dam Inventory
County
Sta
te In
spec
ted
(Gen
-er
al)
Sta
te In
spec
ted
(Flo
od
Con
trol
)
Sta
te In
spec
ted
(Ind
us-
tria
l)
Fede
rally
Insp
ecte
d
Insp
ecte
d by
Oth
er
Age
ncie
s
Uni
nspe
cted
Inac
tive
Pla
nned
Und
er C
onst
ruct
ion
Oth
er
Tota
l
Beaver 14 2 0 0 0 81 5 0 0 0 102
Box Elder 17 5 0 4 1 281 4 0 0 0 312
Cache 11 1 1 2 1 239 2 0 0 0 257
Carbon 7 2 3 1 0 443 4 1 0 1 462
Daggett 4 0 0 1 2 86 2 0 0 0 95
Davis 17 12 0 17 0 39 4 0 0 3 92
Duchesne 30 0 0 5 6 245 18 0 0 5 309
Emery 28 6 5 2 0 438 5 0 0 3 487
Garfield 18 0 2 0 9 145 3 0 0 2 179
Grand 3 3 5 0 1 127 2 0 0 1 142
Iron 13 7 0 0 1 160 8 0 0 3 192
Juab 6 2 1 0 0 18 1 0 0 1 29
Kane 17 2 0 0 2 120 4 0 0 3 148
Millard 6 1 9 0 0 36 0 1 0 2 55
Morgan 5 0 1 2 0 18 1 0 1 0 28
Piute 6 0 0 0 0 20 0 0 0 1 27
Rich 18 0 0 0 0 518 1 0 0 3 540
Salt Lake 19 22 4 1 0 210 23 0 0 3 282
San Juan 23 0 1 0 1 147 7 1 0 1 181
Sanpete 29 2 0 0 11 199 6 1 0 4 252
Sevier 20 7 0 0 9 76 3 0 0 1 116
Summit 28 0 0 6 17 262 4 0 0 3 320
Tooele 8 2 1 0 0 57 7 0 0 2 77
Uintah 34 4 4 5 6 294 2 0 0 3 352
Utah 26 14 0 1 3 200 12 1 0 4 261
Wasatch 21 1 0 5 0 142 9 0 0 0 178
Washington 18 16 2 0 1 179 1 3 0 1 221
Wayne 5 0 0 0 10 47 5 1 0 0 68
Weber 5 8 0 7 0 57 15 0 0 2 94
N/A 3 0 0 1 0 0 80 2 0 128 214
Total 459 119 39 60 81 4884 238 11 1 180 6072
Source: Data from Utah Division of Water Rights, https://www.waterrights.utah.gov/cgi-bin/damview.exe?Startup, 2018.
CHAPTER 5: DAM FAILURE
75
The Utah Division of Water Rights houses a large database of dams in Utah, which is much more inclusive than the database housed by the NID. They have categorized the dams by several inspection categories. These include uninspected dams, inspected dams (general), inspected dams (flood control), inspected dams (industrial), inactive dams, dams inspected by other agencies, fed-erally inspected dams, dams planned or being designed, dams under construction, and other. See Table 1. The database contains a list of 6072 dams, with 256 of those dams being ranked as high hazard. See Map 1 and Tables 2 - 6.
Table 1. Utah Dam Inventory

76
UTAH STATE HAZARD MITIGATION PLAN
Map 1. Utah High Hazard Dams
CHAPTER 5: DAM FAILURE
77
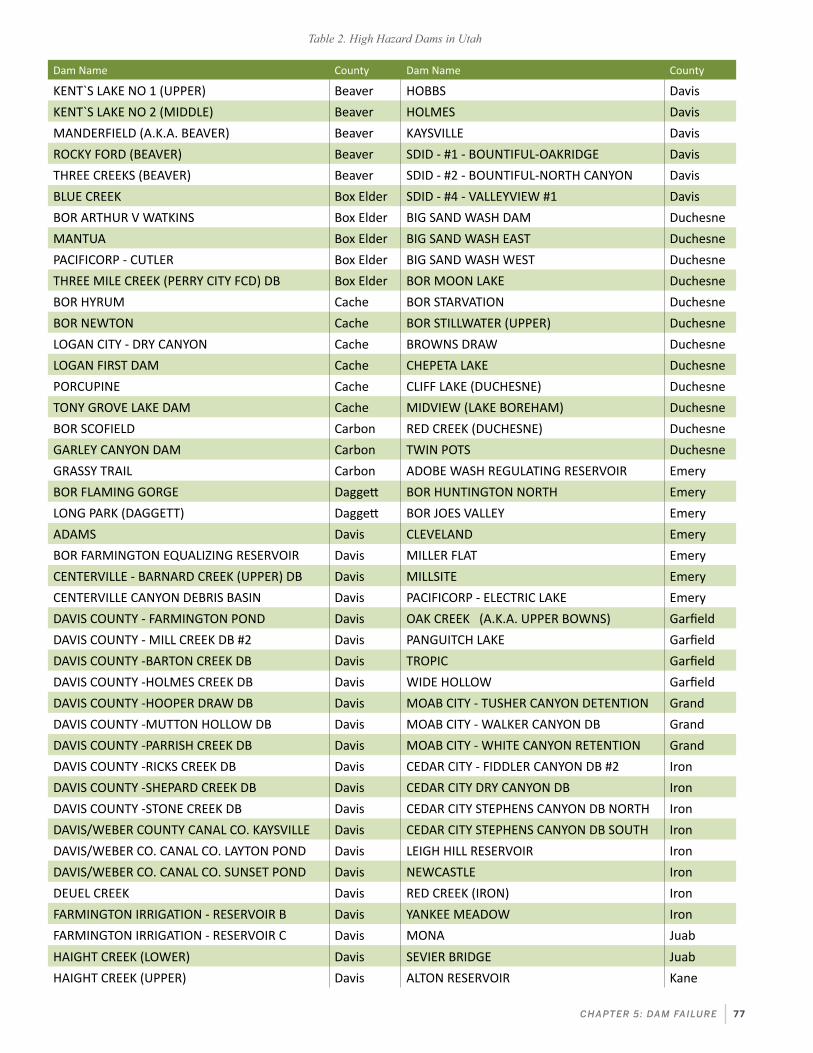
Table 2. High Hazard Dams in Utah
Dam Name County Dam Name County
KENT`S LAKE NO 1 (UPPER) Beaver HOBBS Davis
KENT`S LAKE NO 2 (MIDDLE) Beaver HOLMES Davis
MANDERFIELD (A.K.A. BEAVER) Beaver KAYSVILLE Davis
ROCKY FORD (BEAVER) Beaver SDID - #1 - BOUNTIFUL-OAKRIDGE Davis
THREE CREEKS (BEAVER) Beaver SDID - #2 - BOUNTIFUL-NORTH CANYON Davis
BLUE CREEK Box Elder SDID - #4 - VALLEYVIEW #1 Davis
BOR ARTHUR V WATKINS Box Elder BIG SAND WASH DAM Duchesne
MANTUA Box Elder BIG SAND WASH EAST Duchesne
PACIFICORP - CUTLER Box Elder BIG SAND WASH WEST Duchesne
THREE MILE CREEK (PERRY CITY FCD) DB Box Elder BOR MOON LAKE Duchesne
BOR HYRUM Cache BOR STARVATION Duchesne
BOR NEWTON Cache BOR STILLWATER (UPPER) Duchesne
LOGAN CITY - DRY CANYON Cache BROWNS DRAW Duchesne
LOGAN FIRST DAM Cache CHEPETA LAKE Duchesne
PORCUPINE Cache CLIFF LAKE (DUCHESNE) Duchesne
TONY GROVE LAKE DAM Cache MIDVIEW (LAKE BOREHAM) Duchesne
BOR SCOFIELD Carbon RED CREEK (DUCHESNE) Duchesne
GARLEY CANYON DAM Carbon TWIN POTS Duchesne
GRASSY TRAIL Carbon ADOBE WASH REGULATING RESERVOIR Emery
BOR FLAMING GORGE Daggett BOR HUNTINGTON NORTH Emery
LONG PARK (DAGGETT) Daggett BOR JOES VALLEY Emery
ADAMS Davis CLEVELAND Emery
BOR FARMINGTON EQUALIZING RESERVOIR Davis MILLER FLAT Emery
CENTERVILLE - BARNARD CREEK (UPPER) DB Davis MILLSITE Emery
CENTERVILLE CANYON DEBRIS BASIN Davis PACIFICORP - ELECTRIC LAKE Emery
DAVIS COUNTY - FARMINGTON POND Davis OAK CREEK (A.K.A. UPPER BOWNS) Garfield
DAVIS COUNTY - MILL CREEK DB #2 Davis PANGUITCH LAKE Garfield
DAVIS COUNTY -BARTON CREEK DB Davis TROPIC Garfield
DAVIS COUNTY -HOLMES CREEK DB Davis WIDE HOLLOW Garfield
DAVIS COUNTY -HOOPER DRAW DB Davis MOAB CITY - TUSHER CANYON DETENTION Grand
DAVIS COUNTY -MUTTON HOLLOW DB Davis MOAB CITY - WALKER CANYON DB Grand
DAVIS COUNTY -PARRISH CREEK DB Davis MOAB CITY - WHITE CANYON RETENTION Grand
DAVIS COUNTY -RICKS CREEK DB Davis CEDAR CITY - FIDDLER CANYON DB #2 Iron
DAVIS COUNTY -SHEPARD CREEK DB Davis CEDAR CITY DRY CANYON DB Iron
DAVIS COUNTY -STONE CREEK DB Davis CEDAR CITY STEPHENS CANYON DB NORTH Iron
DAVIS/WEBER COUNTY CANAL CO. KAYSVILLE Davis CEDAR CITY STEPHENS CANYON DB SOUTH Iron
DAVIS/WEBER CO. CANAL CO. LAYTON POND Davis LEIGH HILL RESERVOIR Iron
DAVIS/WEBER CO. CANAL CO. SUNSET POND Davis NEWCASTLE Iron
DEUEL CREEK Davis RED CREEK (IRON) Iron
FARMINGTON IRRIGATION - RESERVOIR B Davis YANKEE MEADOW Iron
FARMINGTON IRRIGATION - RESERVOIR C Davis MONA Juab
HAIGHT CREEK (LOWER) Davis SEVIER BRIDGE Juab
HAIGHT CREEK (UPPER) Davis ALTON RESERVOIR Kane

78
UTAH STATE HAZARD MITIGATION PLAN
Dam Name County Dam Name County
JACKSON FLAT RESERVOIR Kane SANDY CITY - EAST SANDY ELEMENTARY Salt Lake
KANAB CITY - TOM`S CANYON FLOOD CON-TROL Kane SANDY CITY - FLAT IRON MESA Salt Lake
CORN CREEK Millard SANDY CITY - STORM MOUNTAIN DB Salt Lake
DMAD Millard SOUTH JORDAN RDA DB Salt Lake
GUNNISON BEND Millard TWIN LAKES (SALT LAKE) Salt Lake
BOR EAST CANYON Morgan WHITE PINE Salt Lake
BOR LOST CREEK (MORGAN) Morgan BLANDING CITY NO. 3 San Juan
COBBLE CREEK DAM (MORGAN) Morgan BLANDING CITY NO. 4 San Juan
NORTHWEST Morgan KENS LAKE San Juan
SILVER LEAF Morgan LOYD`S LAKE(MONTICELLO) San Juan
BOX CREEK - LOWER (BEAVER CREEK) Piute RECAPTURE CREEK San Juan
BOX CREEK - UPPER (BEAVER CREEK) Piute STARVATION CANYON San Juan
OTTER CREEK Piute DAIRY DAM Sanpete
PIUTE Piute FAIRVIEW LAKE Sanpete
BIRCH CREEK NO. 2 Rich GUNNISON Sanpete
WOODRUFF CREEK Rich HUNTINGTON Sanpete
DRAPER PRESSURE IRRIGATION PROJECT Salt Lake NINEMILE Sanpete
ENSIGN DOWNS DB (AKA VICTORY ROAD DB) Salt Lake PALISADES LAKE Sanpete
JORDAN VALLEY WATER PURIFICATION UPPER Salt Lake ROLFSON Sanpete
KENNECOTT MINE BINGHAM CREEK Salt Lake COTTONWOOD WASH DETENTION BASIN Sevier
LAKE MARY-PHOEBE Salt Lake DAIRY CANYON DETENTION BASIN Sevier
LITTLE DELL Salt Lake FORSYTH Sevier
LITTLE VALLEY Salt Lake GLENWOOD DEBRIS Sevier
MOUNTAIN DELL Salt Lake JOHNSON Sevier
OQUIRRH LAKE DAM/KENNECOTT DAYBREAK Salt Lake KOOSHAREM Sevier
POINT OF THE MOUNTAIN RAW WATER RES Salt Lake SAND H DEBRIS Sevier
RED BUTTE DAM Salt Lake THREE CREEKS (SEVIER) Sevier
RED PINE Salt Lake BOR ECHO Summit
RIVERTON CITY - 3200 WEST POND Salt Lake BOR LOST LAKE Summit
RIVERTON CITY - 4200 WEST POND Salt Lake BOR STATELINE SUMMIT CO. Summit
RIVERTON CITY - BLACK RIDGE RESERVOIR Salt Lake BOR TRIAL LAKE Summit
SALT LAKE CO-CREEKSIDE PARK (BIG CTTN-WD) Salt Lake BOR WANSHIP Summit
SALT LAKE CO.-BIG COTTONWOOD (SPEN-CER`S) Salt Lake BOR WASHINGTON LAKE Summit
SALT LAKE COUNTY - SCOTT AVENUE Salt Lake BOYER LAKE Summit
SALT LAKE COUNTY - SUGARHOUSE Salt Lake DEER VALLEY SNOW MAKING RESERVOIR Summit
SALT LAKE COUNTY CHANDLER DRIVE (#13) Salt Lake SMITH AND MOREHOUSE Summit
SALT LAKE COUNTY FEDERAL HEIGHTS (#1A) Salt Lake WHITNEY Summit
SALT LAKE COUNTY SHRINERS (#12) Salt Lake GRANTSVILLE Tooele
SALT LAKE COUNTY-ROTARY GLEN PARK Salt Lake

CHAPTER 5: DAM FAILURE
79
Dam Name County Dam Name County
SETTLEMENT CANYON TooeleUTAH COUNTY - HOBBLE CREEK DEBRIS BASIN Utah
BOR RED FLEET Uintah UTAH COUNTY - SANTAQUIN DEBRIS Utah
BOR STEINAKER Uintah WINWARD (PETE) Utah
BOTTLE HOLLOW Uintah BOR CURRANT CREEK Wasatch
BROUGH Uintah BOR DEER CREEK Wasatch
BULLOCK DRAW Uintah BOR JORDANELLE Wasatch
COTTONWOOD Uintah BOR SOLDIER CREEK Wasatch
EAST PARK Uintah CENTER CREEK NO. 1 Wasatch
LAPOINT Uintah CENTER CREEK NO. 2 Wasatch
M&S DAM Uintah CENTER CREEK NO. 3 Wasatch
MONTES CREEK Uintah DEER VALLEY Wasatch
OAKS PARK UintahDUTCH CANYON DAM - MIDWAY IRRIGA-TION Wasatch
PARADISE PARK Uintah JONES Wasatch
RED WASH Uintah LINDSAY (BENNETT) LOWER Wasatch
WHITEROCKS LAKE Uintah MILL HOLLOW Wasatch
BIG EAST UtahWASATCH COUNTY LAKE CREEK DEBRIS BASIN Wasatch
BOX LAKE (PAYSON CITY) Utah WITT LAKE Wasatch
HIGHLAND CITY - NORTHWEST PRESSURE IRR. Utah ASH CREEK Washington
HIGHLAND CITY PRESSURE POND Utah BAKER Washington
LEHI CITY SANDPIT RESERVOIR Utah ENTERPRISE (LOWER) Washington
LINDON CITY DRY CANYON DEBRIS BASIN Utah ENTERPRISE (UPPER) Washington
LINDON CITY IRRIGATION PROJECT ZONE II Utah GUNLOCK Washington
LINDON CITY IRRIGATION PROJECT ZONE III Utah GYPSUM WASH Washington
MAPLE LAKE Utah HURRICANE CLIFFS Washington
NORTH UTAH COUNTY - BATTLE CREEK Utah IVINS BENCH Washington
NORTH UTAH COUNTY - DRY CREEK Utah KOLOB CREEK Washington
NORTH UTAH COUNTY - SILVER LAKE FLAT Utah QUAIL CREEK Washington
NORTH UTAH COUNTY - TIBBLE FORK Utah QUAIL CREEK SOUTH DAM Washington
NORTH UTAH COUNTY-GROVE CREEK DB Utah SAND HOLLOW NORTH DAM Washington
PAYSON RESERVOIR Utah SAND HOLLOW WEST DAM Washington
PROVO CITY - ROCK CANYON DB Utah SOUTH CREEK - WASHINGTON COUNTY Washington
PROVO CITY - SLATE CANYON DB NO. 2 Utah ST. GEORGE CITY - NAVAJO D.B. Washington
PROVO CITY - SLATE CANYON DB NO. 3 Utah ST. GEORGE CITY-CITY CREEK D.B. Washington
SANTAQUIN PRESSURE IRRIGATION RESER-VOIR Utah STUCKI DEBRIS Washington
SARATOGA SPRINGS - ISRAEL CANYON Utah TOQUER (ANDERSON JUNCTION) Washington
SARATOGA SPRINGS SECONDARY WATER POND 8 Utah
TUACAHN WASH LOWER DETENTION BASIN Washington
SPANISH FORK PRESSURE IRRIGATION POND Utah WARNER DRAW Washington

80
UTAH STATE HAZARD MITIGATION PLAN
Dam Name County Dam Name County
WARNER VALLEY WashingtonSOUTH OGDEN CITY BURCH CREEK DEBRIS Weber
MILL MEADOW Wayne TEN ACRE LAKE Weber
BOR CAUSEY Weber WEBER/BOX ELDER - A RESERVOIR Weber
BOR COMBE EQUALIZING RESERVOIR Weber NARROWWS RESERVOIR DAM n/a
BOR OGDEN RIVER EQUALIZING RESERVOIR P Weber NARROWS PROJECT (GOOSEBERRY) n/a
BOR PINEVIEW Weber WASHAKIE DAM n/a
NORTH OGDEN CITY ORTON PARK/2100 NORTH Weber
PARK CITY MTN RESORT SNOWMAKING POND n/a
OGDEN CITY - SULLIVAN HOLLOW Weber NEW WIDE HOLLOW n/a
SOUTH OGDEN CITY BURCH CREEK (GLAS-MANN) Weber
BARNEY`S CREEK(AIRPORT#2)DETEN-TION BASIN n/a
SIGNIFICANT DAM FAILURE EVENTS:
21 Mile Dam FailureThe 21 Mile Dam failed in Elko County, Nevada on February 8, 2017 due to heavy runoff and snowmelt. The water broke free from the earthen dam and flooded the community of Montello, Nevada, dam-aged Union Pacific property, and entered extreme northwestern Utah causing road damage.
Laub Detention Dam FailureLaub Detention Dam failed on September 11, 2012. A severe storm with heavy rainfall occurred prior to the failure. Numerous homes, businesses and roads were damaged. No lives were lost. A Presidential Disaster Declaration was declared for Washington County on Novem-ber 3, 2012. The Dam was rebuilt in 2013 and was renamed “Tuacahn Wash Lower Detention Basin.”
Quail CreekQuail Creek dam failed on New Year’s Day (January 1) 1988, due to extensive foundation seepage. Failure caused approximately $12 million in damage and cost approximately $8 million to rebuild. No lives were lost.
Trial Lake Dam FailureTrial Lake Dam failed in 1986 from piping of organics in the foundation contact. It was rebuilt in 1990 by the Central Utah Water Conservancy District with CH2M Hill as the project engineer. As part of the Central Utah Project, BOR assumed responsibility for the dam in 2005.
DMAD Dam FailureDMAD Dam failed in 1983 and a transient was killed trying to cross the flooding river on a suspended wire. The Gunnison Bend Dam was consequently breached proactively to keep it from overtopping.
Little Deer CreekLittle Deer Creek dam failed on its first filling on June 16, 1963, due to extensive foundation seepage. The catastrophic failure resulted in Utah’s first dam failure fatality killing Bradley Galen Brown, a four-year-old boy.
Laub Detention Dam Failure

CHAPTER 5: DAM FAILURE
81
Map 2. Utah Dam Failure Events

82
UTAH STATE HAZARD MITIGATION PLAN
5.2 Assessment of Local Dam Failure Vulnerability and Potential Losses Dam safety and dam construction, although improving, is still an imperfect and subjective discipline. Many dams can fail each year, however, the need to store water justifies the associated risks. To assess vulnerability by jurisdiction, the total number of dams classified as having a high hazard rating in each county were ranked (see Table 2B-2 and 2B-3). Thus, a county’s level of risk is purely a function of the number of high hazard dams in the county. However, one should keep in mind many factors can cause a dam to fail.
Table 3. Number of Dams by Hazard Rating Per County
Utah Dam Hazard Rankings
County Low County Moderate County High
Rich 529 Salt Lake 29 Salt Lake 29
Emery 445 Summit 28 Davis 28
Carbon 410 Weber 27 Utah 25
Uintah 289 Sanpete 26 Washington 21
Box Elder 272 Utah 26 Uintah 14
Summit 265 Sevier 23 Wasatch 14
Duchesne 258 Emery 20 Duchesne 12
Cache 236 Washington 19 Summit 10
Sanpete 206 Davis 17 Weber 10
Utah 195 Duchesne 17 Iron 8
Salt Lake 181 Uintah 12 Sevier 8
Washington 177 Beaver 10 Emery 7
Iron 161 Box Elder 10 Sanpete 7
San Juan 161 Iron 11 Cache 6
Garfield 150 Wasatch 10 San Juan 6
Wasatch 148 Garfield 7 N/A 6
Kane 139 San Juan 7 Beaver 5
Grand 116 Grand 6 Box Elder 5
Daggett 86 Juab 6 Morgan 5
Sevier 83 Millard 6 Garfield 4
Beaver 81 Morgan 5 Piute 4
Tooele 62 Rich 5 Carbon 3
Wayne 54 Tooele 5 Grand 3
Weber 50 N/A 5 Millard 3
Davis 42 Cache 4 Rich 3
Millard 41 Carbon 4 Tooele 3
N/A 26 Kane 4 Daggett 2
Piute 20 Daggett 3 Juab 2
Juab 19 Wayne 3 Kane 2
Morgan 16 Piute 2 Wayne 1
Total 4918 Total 357 Total 256
Source: Data from Utah Division of Water Rights, https://www.waterrights.utah.gov/cgi-bin/damview.exe?Startup, 2018.

CHAPTER 5: DAM FAILURE
83
Table 4. Utah Dam Hazard Rankings - 1
Utah Dam Hazard Rankings by Dam Type - 1State Inspected General
L M HState Inspected Flood Control
L M HState Inspected Industrial
L M H
Beaver 14 3 6 5 2 0 2 0 0 0 0 0
Box Elder 17 10 4 3 5 1 3 1 0 0 0 0
Cache 11 5 3 3 1 0 0 1 1 0 1 0
Carbon 7 5 1 1 2 0 2 0 3 3 0 0
Daggett 4 0 3 1 0 0 0 0 0 0 0 0
Davis 17 0 1 16 12 0 2 10 0 0 0 0
Duchesne 30 15 7 8 0 0 0 0 0 0 0 0
Emery 28 14 9 5 6 3 3 0 5 3 2 0
Garfield 18 9 5 4 0 0 0 0 2 2 0 0
Grand 3 2 1 0 3 0 0 3 5 4 1 0
Iron 13 5 4 4 7 0 3 4 0 0 0 0
Juab 6 3 1 2 2 0 2 0 1 0 1 0
Kane 17 15 1 1 2 1 0 1 0 0 0 0
Millard 6 1 3 2 1 0 0 1 9 7 2 0
Morgan 5 0 2 3 0 0 0 0 1 1 0 0
Piute 6 0 2 4 0 0 0 0 0 0 0 0
Rich 18 12 4 2 0 0 0 0 0 0 0 0
Salt Lake 19 3 2 14 22 2 8 12 4 1 2 1
San Juan 23 11 6 6 0 0 0 0 1 1 0 0
Sanpete 29 7 15 7 2 0 2 0 0 0 0 0
Sevier 20 3 13 4 7 1 2 4 0 0 0 0
Summit 28 6 18 4 0 0 0 0 0 0 0 0
Tooele 8 3 3 2 2 2 0 0 1 1 0 0
Uintah 34 16 7 11 4 4 0 0 4 3 1 0
Utah 26 5 7 14 14 2 3 9 0 0 0 0
Wasatch 21 7 5 9 1 0 0 1 0 0 0 0
Washing-ton
18 4 2 12 16 1 9 6 2 2 0 0
Wayne 5 1 3 1 0 0 0 0 0 0 0 0
Weber 5 1 2 2 8 1 3 4 0 0 0 0
N/A 3 1 2 0 0 0 0 0 0 0 0 0
Total 459 167 142 150 119 18 44 57 39 28 10 1

84
UTAH STATE HAZARD MITIGATION PLAN
Table 5. Utah Dam Hazard Rankings - 2
Utah Dam Hazard Rankings by Dam Type - 2
Federally Inspected
L M HInspected by Other Agencies
L M H Other L M H N/A
Beaver 0 0 0 0 0 0 0 0 0 0 0 0 0
Box Elder 4 2 1 1 1 1 0 0 0 0 0 0 0
Cache 2 0 0 2 1 1 0 0 0 0 0 0 0
Carbon 1 0 0 1 0 0 0 0 1 0 0 0 1
Daggett 1 0 0 1 2 2 0 0 0 0 0 0 0
Davis 17 3 13 1 0 0 0 0 3 2 0 0 1
Duchesne 5 1 0 4 6 6 0 0 5 0 0 0 5
Emery 2 0 0 2 0 0 0 0 3 1 0 0 2
Garfield 0 0 0 0 9 9 0 0 2 1 1 0 0
Grand 0 0 0 0 1 1 0 0 1 0 0 0 1
Iron 0 0 0 0 1 1 0 0 3 0 1 0 2
Juab 0 0 0 0 0 0 0 0 1 0 0 0 1
Kane 0 0 0 0 2 2 0 0 3 1 1 0 1
Millard 0 0 0 0 0 0 0 0 2 0 0 0 2
Morgan 2 0 0 2 0 0 0 0 0 0 0 0 0
Piute 0 0 0 0 0 0 0 0 1 0 0 0 1
Rich 0 0 0 0 0 0 0 0 3 0 0 1 2
Salt Lake 1 1 0 0 0 0 0 0 3 1 0 2 0
San Juan 0 0 0 0 1 1 0 0 1 1 0 0 0
Sanpete 0 0 0 0 11 11 0 0 4 1 1 0 2
Sevier 0 0 0 0 9 9 0 0 1 0 0 0 1
Summit 6 0 0 6 17 17 0 0 3 0 0 0 3
Tooele 0 0 0 0 0 0 0 0 2 1 0 0 1
Uintah 5 2 0 3 6 6 0 0 3 2 1 0 0
Utah 1 0 1 0 3 3 0 0 4 1 0 1 2
Wasatch 5 1 0 4 0 0 0 0 0 0 0 0 0
Washington 0 0 0 0 1 1 0 0 1 0 1 0 0
Wayne 0 0 0 0 10 10 0 0 0 0 0 0 0
Weber 7 1 2 4 0 0 0 0 2 0 0 0 2
N/A 1 0 0 0 128 7 1 6 114
Total 60 11 17 31 81 81 0 0 180 19 7 10 144

CHAPTER 5: DAM FAILURE
85
Table 6. Utah Dam Hazard Rankings - 3
Utah Dam Hazard Rankings by Dam Type - 3
Uni
nspe
cted
L M H N/A
Inac
tive
L M H
Plan
ned
L M H
Und
er C
onst
ruc-
tion
M
Beaver 81 74 1 0 6 5 4 1 0 0 0 0 0 0 0
Box Elder 281 255 1 0 25 4 3 1 0 0 0 0 0 0 0
Cache 239 228 0 0 11 2 2 0 0 0 0 0 0 0 0
Carbon 443 399 0 0 44 4 3 1 0 1 0 0 1 0 0
Daggett 86 82 0 0 4 2 2 0 0 0 0 0 0 0 0
Davis 39 35 0 0 4 4 2 1 1 0 0 0 0 0 0
Duchesne 245 225 3 0 17 18 11 7 0 0 0 0 0 0 0
Emery 438 420 5 0 13 5 4 1 0 0 0 0 0 0 0
Garfield 145 126 1 0 18 3 3 0 0 0 0 0 0 0 0
Grand 127 108 3 0 16 2 1 1 0 0 0 0 0 0 0
Iron 160 149 1 0 10 8 6 2 0 0 0 0 0 0 0
Juab 18 15 2 0 1 1 1 0 0 0 0 0 0 0 0
Kane 120 117 1 0 2 4 3 1 0 0 0 0 0 0 0
Millard 36 33 0 0 3 0 0 0 0 1 0 1 0 0 0
Morgan 18 14 2 0 2 1 1 0 0 0 0 0 0 1 1
Piute 20 20 0 0 0 0 0 0 0 0 0 0 0 0 0
Rich 518 516 1 0 1 1 1 0 0 0 0 0 0 0 0
Salt Lake 210 152 15 0 43 23 21 2 0 0 0 0 0 0 0
San Juan 147 140 0 0 17 7 6 1 0 1 1 0 0 0 0
Sanpete 199 182 6 0 10 6 5 1 0 1 0 1 0 0 0
Sevier 76 68 7 0 1 3 2 1 0 0 0 0 0 0 0
Summit 262 238 10 0 14 4 4 0 0 0 0 0 0 0 0
Tooele 57 49 2 0 6 7 6 0 1 0 0 0 0 0 0
Uintah 294 254 3 0 37 2 2 0 0 0 0 0 0 0 0
Utah 200 172 15 0 13 12 12 0 0 1 0 0 1 0 0
Wasatch 142 134 2 0 6 9 6 3 0 0 0 0 0 0 0
Washington 179 168 7 0 4 1 1 0 0 3 0 0 3 0 0
Wayne 47 37 0 0 10 5 5 0 0 1 1 0 0 0 0
Weber 57 35 17 0 5 15 12 3 0 0 0 0 0 0 0
N/A 0 0 0 0 0 80 17 1 0 2 1 1 0 0 0
Total 4884 4445 105 0 343 238 146 28 2 11 3 3 5 1 1

86
UTAH STATE HAZARD MITIGATION PLAN
Table 7 displays the number of high hazard dams and the population for each county. Salt Lake, Davis, Utah, and Washington counties have the highest number of high hazard dams and are also some of the highest populated counties. Wayne, Daggett, Kane, Juab, and Millard counties have the lowest number of high hazard dams and are also some of the least populated counties.
Table 7. Rankings by County of Population per High Hazard Dam
Ranking County Population per High Hazard Dam High Hazard Dams
1 Salt Lake 38,906 29
2 Weber 24,884 10
3 Utah 24,709 25
4 Tooele 22,378 3
5 Cache 21,082 6
6 Davis 12,456 28
7 Box Elder 10,994 5
8 Washington 7,886 21
9 Carbon 7,070 3
10 Iron 6,535 8
11 Juab 5,899 2
12 Millard 4,492 3
13 Sanpete 4,290 7
14 Summit 4,077 10
15 Kane 3,780 2
16 Grand 3,353 3
17 Wayne 2,738 1
18 San Juan 2,724 6
19 Sevier 2,721 8
20 Uintah 2,615 14
21 Morgan 2,345 5
22 Wasatch 2,230 14
23 Duchesne 1,736 12
24 Emery 1,525 7
25 Beaver 1,369 5
26 Garfield 1,310 4
27 Rich 790 3
28 Daggett 526 2
29 Piute 402 4
Source: Utah Division of Water Rights, https://www.waterrights.utah.gov/daminfo/; Ken C. Gardner Policy Institute, http://gardner.utah.edu/state-and-county-level-population-estimates/.

CHAPTER 5: DAM FAILURE
87
ESTIMATING POTENTIAL LOSSES BY JURISDICTION
Analyses of the total area per county that is susceptible to dam failure inundation were conducted. High hazard dams and dam in-undation area shape files were provided by the Utah Division of Water Rights and the Bureau of Reclamation (BOR). The BOR and state dam failure inundation areas were clipped from each county in order to calculate the total area of potential loss per county. The BOR data provides various dam failure scenarios, such as sudden failure and sunny day failure. The highest potential inundation area was used for each listed BOR dam as to prevent overlapping and multiple summations of BOR dam inundation areas. Areas of potential loss due to dam failure inundation for each county were calculated using the “calculate geometry” function in ArcGIS.
In addition, the percent total potential inundation areas per county were also calculated to demonstrate how much risk due to dam failure inundations exists in each county. This was calculated by dividing the total area of the county by the total potential dam failure inundation area of the county. Maps were then created that visualize this distribution of potential dam failure inundation risk areas per county. All of the LHMPs did not report the number of their structures in dam failure inundation areas, as well as any damage or loss estimates.
The total potential inundation area by county and percent potential inundation area is listed in the following table and displayed on the following map. Millard, Uintah, Weber, Iron, and Duchesne counties have the most total potential inundation areas with over 900 total square miles of dam inundation are and a population of around 370,000 people. Weber County is by far the most populated of those top five counties with over 250,000 people. Kane, Rich, Wayne, Carbon, and Grand have the least total poten-tial inundation areas with only a combined total of 38.51 square miles of dam inundation area. These counties are also some of the least populated counties in the state. Weber, Uintah, Salt Lake, Millard, and Utah counties have the highest percent potential in-undation area with Weber County having by far the most percent potential inundation area by county with 20.34%. This is almost 4 times as much as the next highest county. Kane, San Juan, Wayne, Grand, and Garfield counties have the least percent potential dam inundations areas in the state.
Table 8. Potential Dam Inundation Area in Utah
CountyTotal Area (sq.
miles)Total Potential
Inundation Area (sq. miles)Percent Potential Inun-
dation AreaTotal Population
(2017 Census Estimate)
Beaver 2,585.45 41.84 1.62% 6,386
Box Elder 6,729.22 57.39 0.85% 54,079
Cache 1,171.96 39.04 3.33% 124,438
Carbon 1,484.21 11.55 0.78% 20,295
Daggett 718.9 24.74 3.44% 1,029
Davis 634.81 21.06 3.32% 347,637
Duchesne 3,248.13 111.51 3.43% 20,026
Emery 4,468.82 67.77 1.52% 10,077
Garfield 5,205.38 21.17 0.41% 5,078
Grand 3,683.14 12.57 0.34% 9,674
Iron 3,301.35 118.34 3.58% 51,001
Juab 3,405.39 17.9 0.53% 11,250
Kane 4,104.87 0.55 0.01% 7,567
Millard 6,837.36 321.82 4.71% 12,863
Morgan 610.44 23.51 3.85% 11,873
Piute 765.63 17.5 2.29% 1,420
Rich 1,085.45 6.83 0.63% 2,391
Salt Lake 805.18 38.67 4.80% 1,135,649

88
UTAH STATE HAZARD MITIGATION PLAN
San Juan 7,929.93 18.74 0.24% 15,356
Sanpete 1,601.07 33.35 2.08% 30,035
Sevier 1,916.99 65.99 3.44% 21,316
Summit 1,880.34 28.56 1.52% 41,106
Tooele 7,286.50 67.44 0.93% 67,456
Uintah 4,502.71 233.28 5.18% 35,150
Utah 2,140.90 85.53 3.99% 606,425
Wasatch 1,208.45 13.48 1.12% 32,106
Washington 2,431.64 35.7 1.47% 165,662
Wayne 2,464.95 7.01 0.28% 2,719
Weber 659.43 134.16 20.34% 251,769
Map 3. Total Potential Dam Inundation Area by County

CHAPTER 5: DAM FAILURE
89
Table 9. Total Potential Dam Failure Inundation and Population Percentage
County
Percent Potential
Inundation Area
Percentage of
Utah’s Population (2017 data)
Beaver 1.62% 0.2%
Box Elder 0.85% 1.7%
Cache 3.33% 4.0%
Carbon 0.78% 0.7%
Daggett 3.44% 0.0%
Davis 3.32% 11.2%
Duchesne 3.43% 0.6%
Emery 1.52% 0.3%
Garfield 0.41% 0.2%
Grand 0.34% 0.3%
Iron 3.58% 1.6%
Juab 0.53% 0.4%
Kane 0.01% 0.2%
Millard 4.71% 0.4%
Morgan 3.85% 0.4%
Piute 2.29% 0.0%
Rich 0.63% 0.1%
Salt Lake 4.80% 36.6%
San Juan 0.24% 0.5%
Sanpete 2.08% 1.0%
Sevier 3.44% 0.7%
Summit 1.52% 1.3%
Tooele 0.93% 2.2%
Uintah 5.18% 1.1%
Utah 3.99% 19.6%
Wasatch 1.12% 1.0%
Washing-ton 1.47% 5.3%
Wayne 0.28% 0.1%
Weber 20.34% 8.1%
A map was also created that shows the hazard ranking of Dam Failure for each county as reported in the LHMPs (see Map 4). The hazard ranking is calculated from a com-bination of severity (categorized from 0-4) and frequency (categorized from 0-4). This allows for a ranking from 0-8 when combined.
Based on the reporting in LHMPs, the majority of the state has moderate ranking for dam failure. Carbon, Juab, Sanpete and Sevier counties are ranked low and the Five County AOG region did not provide sufficient data for a ranking to dam failure.
Map 4. Dam Failure Hazard Rankings from LHMPs

90
UTAH STATE HAZARD MITIGATION PLAN
VULNERABLE STRUCTURES AND DAM FAILURE
Vulnerable structures and loss estimates to dam failure were not reported in LHMPs. Therefore, the general building stock data in HAZUS was used to estimate potential building exposure to dam inundation. Two dam inundation data sets for this analysis were used: one is from the Utah Division of Water Rights and the other is from the Bureau of Reclamation (for official use only data). These updates occurred on the Census Tract level. Within the HAZUS database, the “hzBldgCountOccupT” and the “hzExpo-sureOccupT” tables in addition to the Census Tract vector data were used. This analysis assumes that all of the buildings in a Census Tract are evenly distributed through the Tract.
The results of the analysis are found in Table 10. The analysis was performed as follows. First, all of the buildings from the all HAZUS occupancy class were added together to derive the total number of buildings per Tract. Next, all of the exposure values were added to derive the total building value per Tract. These two values were used to determine the average value per structure in each Tract. The number of buildings exposed to the dam inundation hazard was estimated by dividing the area of each Tract in the hazard area by the total Tract area and then multiplying this percentage by the total number of buildings in the Tract. To determine the estimated building value exposure, the number of buildings was multiplied in each Tract in the hazard area by the estimated building value for that Tract. These results were aggregated to the county level using the Dissolve tool in ArcMap. Lastly, 2010 Census Population values (the most current in the HAZUS database) were used to determine a per capita exposure to dam inunda-tion based on the estimated building value exposure in each county.
Based on the above analysis, Utah, Salt Lake, Weber, Davis, and Washington counties have the highest estimated number of buildings in dam inundation areas. These are also the most populous counties in the state. Morgan, Sevier, Tooele, Utah, and Em-ery counties have the highest percent building value exposure to dam inundation with 50.02%, 42.50%, 38.50%, 33.62%, 32.36% respectively. Sevier, Morgan, Grand, Emery, and Tooele counties have the highest per capita loss to dam inundation with $39,423, $36,486, $31,616, $30,561, and $26,563 respectively.
Table 11 lists the estimated daytime and nighttime population in dam inundation areas. Utah, Salt Lake, Weber, Davis, and Tooele counties have the highest estimated daytime and nighttime population in dam inundations areas. The counties with the highest percent daytime population in dam inundation areas are Sevier, Duchesne, Morgan, Tooele, and Grand counties. Sevier, Duch-esne, Morgan, Tooele, and Grand counties have the highest percent daytime, population in dam inundation areas with 51.21%, 45.46%, 45.44%, 40.50%, and 38.45% respectively. Morgan, Sevier, Duchesne, Tooele, and Utah counties have the highest per-cent nighttime population in dam inundation areas with 46.66%, 45.29%, 38.63%, 34.95%, and 33.02% respectively.
Table 10. Utah HAZUS Building Stock Exposure to Dam Inundation
County
Total Popu-lation (2017
Census Estimate)
HAZUS Number of Buildings
HAZUS Total Build-ing Value
Estimated Buildings in Inundation
Areas
Estimated Building Value Exposure
Percent Building Val-
ue Hazard Exposure
Per Capita Hazard Expo-
sure
Beaver 6,386 2,850 $572,419,000 417 $99,918,443 14.63% $15,646
Box Elder 54,079 17,554 $4,211,895,000 845 $197,350,547 4.81% $3,649
Cache 124,438 33,221 $9,080,968,000 3,068 $727,261,265 9.24% $5,844
Carbon 20,295 9,369 $1,994,938,000 1,954 $378,317,973 20.86% $18,641
Daggett 1,029 1,182 $150,401,000 13 $1,722,639 1.10% $1,674
Davis 347,637 92,557 $27,013,422,000 12,048 $3,391,484,153 13.02% $9,756
Duchesne 20,026 9,500 $2,019,795,000 2,126 $479,324,087 22.38% $23,935
Emery 10,077 4,676 $906,997,000 1,513 $307,965,106 32.36% $30,561
Garfield 5,078 3,933 $789,683,000 185 $35,950,210 4.70% $7,080
Grand 9,674 4,827 $1,046,323,000 1,209 $305,854,408 25.05% $31,616
Iron 51,001 17,237 $3,826,638,000 3,971 $909,419,675 23.04% $17,831

CHAPTER 5: DAM FAILURE
91
Juab 11,250 3,660 $924,941,000 13 $3,084,034 0.36% $274
Kane 7,567 6,020 $1,052,599,000 5 $1,203,899 0.08% $159
Millard 12,863 5,327 $1,182,268,000 1,214 $266,410,756 22.79% $20,711
Morgan 11,873 3,197 $905,106,000 1,599 $433,192,637 50.02% $36,486
Piute 1,420 972 $167,635,000 138 $24,053,037 14.20% $16,939
Rich 2,391 2,515 $542,621,000 99 $21,535,080 3.94% $9,007
Salt Lake 1,135,649 310,571 $98,684,444,000 41,384 $13,353,268,953 13.33% $11,758
San Juan 15,356 5,875 $986,455,000 70 $11,187,921 1.19% $729
Sanpete 30,035 10,519 $2,502,214,000 451 $80,902,384 4.29% $2,694
Sevier 21,316 8,822 $1,922,617,000 3,749 $840,332,647 42.50% $39,423
Summit 41,106 20,484 $6,718,738,000 1,721 $474,665,591 8.40% $11,547
Tooele 67,456 19,102 $4,809,515,000 7,354 $1,791,834,932 38.50% $26,563
Uintah 35,150 11,856 $2,834,340,000 971 $206,236,871 8.19% $5,867
Utah 606,425 134,568 $38,755,008,000 45,244 $13,233,012,495 33.62% $21,821
Wasatch 32,106 10,598 $2,734,364,000 2,257 $616,759,879 21.30% $19,210
Washington 165,662 54,511 $12,241,252,000 7,114 $1,791,320,236 13.05% $10,813
Wayne 2,719 1,658 $337,652,000 43 $8,248,156 2.59% $3,034
Weber 251,769 78,697 $21,053,228,000 13,976 $3,932,797,438 17.76% $15,621
Source: Utah Automated Geographic Reference Center (county boundaries); U.S. Census Bureau (2017 population estimates)
Table 11. Estimated Daytime and Nightime Population in Inundation Areas
CountyEstimated Daytime Popu-lation in Inundation Areas
Percent Daytime Popula-tion in Inundation Areas
Estimated Nighttime Popula-tion in Inundation Areas
Percent Nighttime Popula-tion in Inundation Areas
Beaver 568 8.89% 911 14.27%
Box Elder 1,023 1.89% 2,009 3.71%
Cache 6,379 5.13% 11,092 8.91%
Carbon 3,606 17.77% 4,402 21.69%
Daggett 2 0.19% 1 0.10%
Davis 43,350 12.47% 42,209 12.14%
Duchesne 9,104 45.46% 7,736 38.63%
Emery 3,353 33.27% 3,048 30.25%
Garfield 220 4.33% 341 6.72%
Grand 3,720 38.45% 2,809 29.04%
Iron 12,687 24.88% 11,694 22.93%
Juab 0 0.00% 0 0.00%
Kane 22 0.29% 0 0.00%
Millard 811 6.30% 2,329 18.11%
Morgan 5,395 45.44% 5,540 46.66%
Piute 111 7.82% 159 11.20%
Rich 101 4.22% 272 11.38%
Salt Lake 170,786 15.04% 137,641 12.12%
San Juan 43 0.28% 92 0.60%
Sanpete 1,992 6.63% 1,070 3.56%
Sevier 10,915 51.21% 9,655 45.29%
Summit 1,786 4.34% 3,273 7.96%

92
UTAH STATE HAZARD MITIGATION PLAN
Tooele 27,323 40.50% 23,574 34.95%
Uintah 3,089 8.79% 1,818 5.17%
Utah 213,133 35.15% 200,251 33.02%
Wasatch 11,279 35.13% 7,529 23.45%
Washington 22,235 13.42% 20,127 12.15%
Wayne 13 0.48% 32 1.18%
Weber 67,570 26.84% 42,045 16.70%
A vulnerability analysis was conducted based on 17 criteria from the dam failure risk assessment. These 17 criteria come from tables 1, 3, 7, 8, 10, 11, and 12. Each of the criteria was ranked from 1 to 29 for each county. The ranking numbers were combined for each county and then the totals were ranked from 1 to 29 to determine a vulnerability ranking. The counties with the lowest to-tal ranking number would indicate the highest overall vulnerability to dam failure. Table 13 shows the results of this analysis. The most vulnerable areas to dam failure based on the analysis are along the Wasatch Front (Utah, Salt Lake, and Weber counties), along with Sevier and Iron Counties.
Table 12. Dam Failure Vulnerability Score of Utah Counties*
Rank County Vulnerability Score
1 Utah 66
2 Salt Lake 106
3 Weber 118
4 Sevier 121
5 Iron 132
6 Tooele 134
7 Duchesne 162
8 Davis 164
9 Washington 179
10 Emery 181
11 Morgan 182
12 Wasatch 196
13 Grand 218
14 Cache 219
15 Summit 230
16 Carbon 232
17 Uintah 235
18 Millard 244
19 Box Elder 293
20 Sanpete 295
21 Beaver 303
22 Piute 330
23 Garfield 348
24 Rich 358
25 Daggett 380
26 San Juan 383
27 Juab 403
28 Wayne 405
29 Kane 417
*Based on 7 criteria from dam failure risk assessment.

CHAPTER 5: DAM FAILURE
93
For the SHMP 2019 update, the SHMPC looked at the county LHMPS to gather data on the vulnerability and losses of people, residential units, commercial units, and critical facilities for each county that reported such data. Only 10 counties reported data related to dam failure in their LHMPs. The counties with the most people vulnerable to dam failure were Salt Lake (120,703), Weber (38,738), and Tooele (19,349) with a total of around 195,000 people vulnerable to dam failure. There were over 63,098 res-idential units, for a total value of over $11 billion dollars, and 7001 commercial units, for a total value of around $4.5 billion dol-lars that was reported to be vulnerable to dam failure. Almost 400 critical facilities were also listed as being at risk to dam failure.
Table 13. Dam Failure Vulnerability and Loss from LHMPs
Dam Failure
County PeopleResidential Units Commercial Units
Critical FacilitiesUnits Value Units Value
Box Elder 2570 821 $138,005,476 106 $90,428,808 25
Cache 9636 2974 $627,158,439 159 $158,458,997 61
Carbon 15
Emery 42
Grand 24
Morgan 4016 1323 $268,569,900 33 $8,272,812
Rich 502 154 $14,735,154 14 $1,198,151 18
Salt Lake 120,703 51,009 $9,665,508,700 6,052 $3,719,874,395 66
Tooele 19,349 5826 $874,487,874 388 $393,307,807 117
Weber 38,738 991 $144,091,400 249 $157,957,771 29
Total 195,514 63,098 $11,732,556,943 7001 $4,529,498,741 397
CLIMATE CHANGE IMPACTS
While dam failure is not a natural hazard, changes in climate will increase the risk of dam failure in Utah. For the last millennia, the climate of Utah has experienced periods of intense precipitation and drought.1 The risk to dam failure in Utah will be in-creased during prolonged periods of intense precipitation. Changes in weather patterns and incidence of extreme precipitation will increase the risk of dam failure in Utah. In 2017, there were two notable dam failure incidents in the West. One, Oroville Dam in northern California was severely compromised after a warm atmospheric river event dropped several inches of rain-on-snow and caused severe flooding and nearly dam failure. Two, a dam along the Humboldt River in central Nevada failed during the same February 2017 rain event. Local residents near both dams were forced to evacuate; fortunately, no lives were lost in either event. Incidents such as those in northern California and Nevada will be more likely in Utah due to the impacts of climate change.
DEVELOPMENT TREND IMPACTS
There are four high hazard dams and four moderate hazard dams in Utah being planned or designed as of 2018. The names of the high hazard dams are the Garley Canyon Dam, Hurricane Cliffs, Toquer (Anderson Junction), and Warner Valley. Three of these high hazard dams are in Washington County which is one of the most populous and fastest growing counties in Utah. The other high hazard dam being planned is in Carbon County. One moderate hazard dam is under construction as of 2018, the Northside Creek Reservoir dam in Morgan County.
In 2012, the Laub Detention Dam in Washington County failed and flooded several homes and businesses. Washington County is one of the fastest growing areas in the state. Many dams in Utah were built many decades ago and are constructed of earthen mate-rials. As communities continue to grow and encroach in dam failure inundation zones the threat will increase. The regular inspec-tion of dams in Utah will hopefully allow mitigation strategies to be implemented before a catastrophic dam failure in the future.
1 DeRose, R. J. et al. A millennium-length reconstruction of Bear River stream flow, Utah. J. Hydrol. (2015). doi:10.1016/j.jhydrol.2015.01.014

94
UTAH STATE HAZARD MITIGATION PLAN
5.3 Assessment of State Dam Failure Vulnerability and Potential Losses An updated state facilities data was provided by Utah Division of Risk Management for the 2019 update. This current state facility database is a different database than the last plan update. The updated state facilities shape file was overlaid on top of the Utah state dam failure inundation areas map as well as the federal dam failure inundation locations. Using ArcGIS, each dam inundation area was clipped from a county shape file for each county in Utah. The “select by location” option was then utilized in order to determine how many vulnerable structures exist per county. A total of 1018 state facilities were found to be in dam failure inundation areas, with Salt Lake, Utah, and Weber counties having the bulk of them. Seven counties were found to have no state facilities in dam failure inundation areas: Daggett, Juab, Kane, Piute, Rich, San Juan, and Wayne.
ESTIMATING POTENTIAL LOSSES BY STATE FACILITIES
Values estimating the potential losses by state-owned facilities were calculated by summing the current value of each state-owned facility per county that falls within the county’s dam inundation areas. Current values of state facilities per county were provided by Risk Management. It is important to note that the current values represent the total value of the facilities located within a dam inundation area. These values assume that in the event of a dam breach, the state facilities within the dam inundation area would be completely destroyed rather than sustaining a particular amount of damage. Therefore, the current values overestimate the damage to state facilities in the event of most dam failures. The state facilities per capita loss to dam failure was also calculated.
State facilities have the greatest to lose in Salt Lake, Utah and Weber Counties. More analysis is needed to understand what is at risk in dam inundation areas. Figure 2B-4 is a map of the state facility per capita loss for dam failure for every county based on the insured value of the state owned facilities residing in their boundaries. Sevier, Morgan, and Duchesne counties have the high-est state facility per capita loss for dam failure. All three of these counties have relatively low populations.
Table 14. Total Value of State Owned Facilities in Dam Failure Inundation Area
CountyFacilities in Dam Inundation Area
Insured Value of State Facilities Per Capita Potential Loss
Beaver 0 $0 $0
Box Elder 5 $1,171,739 $21
Cache 24 $43,497,969 $344
Carbon 8 $10,204,854 $481
Daggett 4 $649,100 $617
Davis 61 $430,282,638 $1,234
Duchesne 14 $13,833,709 $664
Emery 28 $11,097,048 $1,040
Garfield 3 $435,827 $83
Grand 26 $25,976,422 $2,582
Iron 41 $104,817,325 $2,005
Juab 5 $164,764 $14
Kane 0 $0 $0
Millard 6 $2,091,896 $155
Morgan 29 $22,891,582 $1,952
Piute 13 $763,882 $475
Rich 0 $0 $0
Salt Lake 299 $959,213,674 $850

CHAPTER 5: DAM FAILURE
95
San Juan 0 $0 $0
Sanpete 2 $5,313,400 $177
Sevier 49 $74,403,383 $3,418
Summit 10 $37,903,784 $930
Tooele 32 $130,093,980 $1,938
Uintah 18 $19,477,404 $532
Utah 184 $1,099,077,581 $1,779
Wasatch 27 $40,560,310 $1,299
Washington 31 $67,131,118 $405
Wayne 0 $0 $0
Weber 99 $158,079,145 $635
Total 1018 $3,259,132,534.00 $23,630.00
Map 5. State Facilities per Capita Loss for Dam Failure

96
UTAH STATE HAZARD MITIGATION PLAN
Table 15. Critical Infrastructure in Dam Inundation Areas
Critical Infrastructure within Dam Inundation Area
#
Airports 5
Electric Substations 110
Power plants 2
Healthcare Facilities 254
Schools 294
Police Stations 49
Fire Stations 61
Miles
Railroads 556
Local Roads 4832
Highways and Interstates 865
NPMS Pipelines 34
Transmission Lines 50
An analysis of critical infrastructure within dam inundation areas through-out the state shows that there are 775 critical structures and 6337 miles of critical lines within dam inundation areas. For a complete list of the critical infrastructure in dam inundation areas see the appendix.
5.4 Mitigation Efforts for Dam Failure HazardsThe Utah State Engineer has been charged with regulating non-federal dams in the State since 1919. Utah started its own Dam Safety Section in the 1970s within the State of Utah Engineers Office to administer all non-federal dams in response to the Federal Dam Safety Act. In 1990, the legislature directed the State Engineer to regulate all dams in the state, including federally owned dams, except those owned by the Bureau of Reclamation.
The frequency of dam inspection is designated based on hazard rating: The Utah Division of Water Rights inspects high-hazard dams annually, moderate hazard dams biannually, and low-hazard dams every five years.
Figure 3. Percentage of Inspection of State Regulated High Hazard Dams