Embed Size (px)
Citation preview

International Research Journal of Advanced Engineering and Science ISSN (Online): 2455-9024
355
Dedy Ardianto Fallo, Andre Primantyo, and Evi Nur Cahya, “Dam Body Safety Evaluation Pre and Post Impounding Use Instrumentation
Data on Raknamo Dam in East Nusa Tenggara Province,” International Research Journal of Advanced Engineering and Science, Volume 6,
Issue 3, pp. 355-362, 2021.
Dam Body Safety Evaluation Pre and Post
Impounding Use Instrumentation Data on Raknamo
Dam in East Nusa Tenggara Province
Dedy Ardianto Fallo1, Andre Primantyo
2, Evi Nur Cahya
3
1, 2, 3Faculty of Engineering, Universitas Brawijaya, Malang, Indonesia
Abstract— A complete water governance system is already a very
vital need for the community. Therefore, the availability of methods
in water management is one of the main factors to increase the
development and growth of a water management network system.
This study aimed to find out the pattern of pore water pressure,
settlement, and seepage on the body of the Raknamo dam after
construction. In addition, the purpose of this study is to find out the
dam is safe or not limited to seepage, settlement, and slope stability.
Based on the results of numeric analysis (SEEP / W) on the body of
the dam is 0.00176m3/s < 0.014 m3/s, then the barrier is still safe
against maximum discharge seepage. While based on the actual
reading results in the field (Instrument V-Notch) is 0.00427 m3/s <
0.014 m3/s, the dam is still safe against maximum seepage discharge.
Based on the results of numerical analysis (SIGMA / W) at the core
of the dam is 0.00334 < 0.02, the barrier is still safe because the
settlement does not exceed the allowable limit. Based on the results of
numerical analysis (SLOPE / W) for the stability of the slopes of the
Raknamo dam, with conditions without earthquakes, with static
earthquakes 100 years, and with dynamic earthquakes OBE and
MDE.
Keywords— Security Evaluation; Impounding; The body of the dam;
Numerical Analysis; Raknamo Dam.
I. INTRODUCTION
A complete water governance system is already a very vital
need for the community. Therefore, the availability of
methods in water management is one of the main factors to
increase the development and growth of a water management
network system. A dam is a construction built to hold the rate
of water into a reservoir or lake. Often dams are also used to
drain water to a hydroelectric power plant (PLTA). Urugan
dams are the most complex civil buildings that are very
dangerous when they fail or collapse. The collapse of a dam
will cause a major disaster for the downstream area in
property and fatalities. Dam safety plays a critical role.
Therefore the security of this type of dam needs to be checked,
checked, and recorded continuously about the performance
and behavior of the dam and its complementary buildings or
particular other objects by direct measurement, observation,
and reading, using equipment or instruments. Field
instrumentation is essential in geotechnical engineering
techniques for the design and construction of dams.
Instrumentation is the basis of dam evaluation and provides
evaluation data in the monitoring and monitoring program and
inspection of dam safety for future purposes. According to
Sari et al. (2017)[1], The higher the reservoir water level, the
greater the pore water pressure that will occur and will also
impact increasing seepage discharge and affect the settlement
of the dam body. Based on the results of reviews obtained
from several journals, no one has discussed the pattern of
reservoir operations more deeply. For that, the author will
discuss the safety of the dam until the time the reservoir
operating design was carried out using instrumentation data
and analyzed using numerical models. This study aimed to
find out the pattern of pore water pressure, settlement, and
seepage on the body of the Raknamo dam after construction.
In addition, the purpose of this study is to find out the dam is
safe or not limited to seepage, settlement, and slope stability.
II. REVIEW OF LITERATURE
In designing dam instrumentation and evaluating the
results of instrumentation observations, basic geotechnical
knowledge is needed. Therefore, the key to successfully
assessing the behavior of dams of the urugan type and levees
lies in the foresight of experts in evaluating the results of
instrument observations (Kep Men of Regional Infrastructure
Settlements, 2004). Aspects that need to be known are mainly
related to pore water pressure, seepage, soil tension,
foundation deformation characteristics, and heap materials. In
addition to a detailed explanation of the basics of geotechnical
knowledge, it is also necessary to reference procedures or
other engineering guidelines, reference books on geotechnical,
and information on design considerations, and the construction
of dams of the urugan type (Kep Men Settlement Of Regional
Infrastructure, 2004). The primary purpose of instrumentation
is to generate data that is useful in determining whether a dam
or foundation can function according to predetermined safety
aspects. Suppose the dam has a specific foundation condition
or design form. In that case, the instrumentation will help to
monitor whether the design concept during construction and
operation has met the criteria or not. A complete monitoring
program should be developed primarily for conditions and
specialized forms in the field. If the foundation's situation or
the shape of the dam design is not particular, the need for
instrumentation will be reduced. The installation of dam
instruments has significant meaning because it can be helpful
to as:
1. Analytical estimate of dam safety.
2. Long-term behavioral forecasts.
3. Legal evaluation (legal aspect)
4. Development and verification for the design to come.
Based on some previous references to the safety of dams
caused by pore water pressure, seepage, horizontal and

International Research Journal of Advanced Engineering and Science ISSN (Online): 2455-9024
356
Dedy Ardianto Fallo, Andre Primantyo, and Evi Nur Cahya, “Dam Body Safety Evaluation Pre and Post Impounding Use Instrumentation
Data on Raknamo Dam in East Nusa Tenggara Province,” International Research Journal of Advanced Engineering and Science, Volume 6,
Issue 3, pp. 355-362, 2021.
vertical movement of the dam body, relaxation on the
upstream slopes, and the effect of earthquakes on dam safety
include Xiaoping Chen, Jingwu Huang (2011)[3] with the
results of the study m to a reduction of strength used in
numerical analysis effectively in reducing progressive failure
caused by fluctuations in reservoir water level. The advanced
failure of the slope can be illustrated as follows: (i) decreased
resistance at the foot of the slope; (ii) grinding at the foot of
the slope; (iii) decrease in the strength of the soil near the
gerusan area; (iv) changes in slopes; and (v) further decrease
in the carrying capacity of the land. Sanjay Nimbalkar, V.S.
Ramakrishna Annapareddy, Anindya Pain, (2018)[4] with the
study results that is the difference in the safety value factor of
this method with that of the pseudo-static process to different
kh values. The trend of the results of this study is very similar
to that of pseudo-static methods. Variations in the safety
factors of the study with a rigid and flexible foundation for
different internal swipe angle values. Mohammad Rashidi, S.
Mohsen Haeri (2017)[5] with the research results, i.e., the
reduction of downstream random deposits obtained from
instruments and numerical modeling in the two periods
mentioned above. At the end of construction, these results are
close to each other. This trend continues to be constant in the
dam's foundation after the initial filling of the reservoir.
Comparison of pore water pressure in the first layer obtained
from instrumentation measurement and numerical modeling at
the end of construction.
A. Earthquake Analysis
Earthquake load is the load or force of inertia that arises
from earthquake shock at ground level. Maximum ground
acceleration, ag is an earthquake acceleration obtained from
earthquake risk analysis using an empirical formula from
Fukushima-Tanaka. Still, it has not been corrected on the
influence of local soil types. The earthquake load to design
new dams or the safety evaluation of existing buildings is
obtained from MDE, OBE, and sometimes RIE. Depending on
the conditions, a barrier can be evaluated against one or more
earthquake loads. The main requirement of earthquake-
resistant dam design is to protect public safety, life, or
property. Earthquake parameters can consist of one or more of
the characteristics of shaking at ground levels, such as
acceleration, speed or transfer, and the variety of speech or
history of earthquake acceleration times that provide their
characteristics for MDE, OBE, and RIE. The selection of
parameters can be made deterministically or probabilistically
earthquake disasters or a combination of both. For example,
the acceleration relationship of an earthquake with the repeat
period to determine the MDE and the OBE consists of a
maximum earthquake acceleration (peak ground acceleration,
PGA) and a specific form of earthquake welcome (spectrum).
Earthquake parameters that reflect the magnitude of MDE,
OBE, or RIE are often used as input data for numerical
analysis of dams. The results of such numerical analysis are
used to evaluate dam behavior and dam safety that produces
the magnitude of the shaking.
To prevent unsanctioned due to decreased shear strength,
due to increased pore pressure that can lead to liquefaction
processes, excessive deformation, and high wave influence, it
is necessary to note the following:
1. Compaction of urugan on the construction of urugan dam
must be adequately done by the specified specifications.
2. The slope for the dam is 1:2.5 to 1:3 (vertical: horizontal).
For rock-type dams with upright or sloping cores, the slope
of the hill can be made steeper.
3. The slope stability analysis's static load safety factor for
the critical avalanche field is 1.5 times greater than the
minimum safety factor required for earthquake loading
conditions.
4. The minimum guard height is adjusted to look at rsni T-
01-2002.
If the condition cannot be met, a deformation analysis
must be carried out using the Newmark or seed.
B. Minimum Safety Factor
The minimum safety factor value for each loading
condition indicates the criteria in the slope stability analysis.
The safety factor for slope stability analysis is defined as the
total allowed ground shear resistance to ground shear voltage.
Safety here is necessary to maintain balance along the field's
surface that has the potential for landslides or slips. The
minimum safety factor for slope stability design is determined
primarily based on consideration of supervisory factors against
pore water pressure and the strong assumption of material
shear. Safety factor criteria are considered against the
following:
1. Based on analysis from USBR using the way of the
balance of limits.
2. If the analysis method is different, then the safety factors
are other, even for the same dam with the same physical
properties of the material and loading conditions.
3. For loading conditions after construction, excessive pore
water pressure will increase within the watertight zone of
the dam or foundation. This is because the soil cannot be
fully consolidated during the construction period.
Therefore, the use of effective shear vital parameters
significantly affects safety factors.
III. RESEARCH METHODOLOGY
A. Research Location
Raknamo Dam is located in Raknamo Village Raknamo
Village Amabi Oefeto District Kupang East Nusa Tenggara
Province. Raknamo dam is part of the utilization of water
resources to overcome water shortages both for raw water and
irrigation water that people in Kupang Regency have
experienced.
B. Construction Activity Information
PT carried out the construction of the Raknamo Dam.
Waskita Karya (Persero) Tbk. on December 4, 2014, and can
be completed on December 28, 2017, the dam began initial
filling of the reservoir (impounding) on January 9, 2018.
International Research Journal of Advanced Engineering and Science ISSN (Online): 2455-9024
357
Dedy Ardianto Fallo, Andre Primantyo, and Evi Nur Cahya, “Dam Body Safety Evaluation Pre and Post Impounding Use Instrumentation
Data on Raknamo Dam in East Nusa Tenggara Province,” International Research Journal of Advanced Engineering and Science, Volume 6,
Issue 3, pp. 355-362, 2021.
C. Supporting Data
In this study, supporting data is needed to perform the
analysis process. The data required to complete the analysis on
the study are as follows:
1. Instrument Reading Data
a. Instrument Pisometerreading: The basic principle of
the workings of a picometer is that an element that is
porous from the picometer is inserted into the ground,
so that groundwater can enter it and collect in the
element unit. Measurements of the water surface or
water pressure inside the pisometer can calculate the
magnitude of the pore water pressure.
b. Automatic Double Fluid Settlement Device
(ADFSD): This system is planned to measure the
settlement continuously with a tubing mounted
around the geometry of the dam horizontally at a
specific elevation (horizontal loop).
c. Inclinometer readings: This inclinometer instrument
is installed to observe or monitor a horizontal
movement within a layer of soil or rock. Aluminum
or plastic pipes with four grooves angled between 90°
are installed in a borehole, or at the stage of ground
hoarding, or on the walls of a structure. Large dams
that use this instrument include the tarbela dam
(Pakistan) and Wadaslintang (CentralJava).
d. Reading of The Seepage Measuring Instrument: This
instrument is installed to observe; (a) Symptoms of
dissolution on rock foundations that may result in
decreased shear strength and increased foundation
permeability, (b) Symptoms of reed erosion (Piping)
on the body or dam foundation.
2. Instrument Reading Data
The data that will be used for the analysis process in this
study are:
a. Data Debit Inflow
b. Data Debit Outflow
c. Soil Mechanics Data (Heap and Foundation
Materials)
d. Dam Instrument Cross-section data and dam
instrument plan
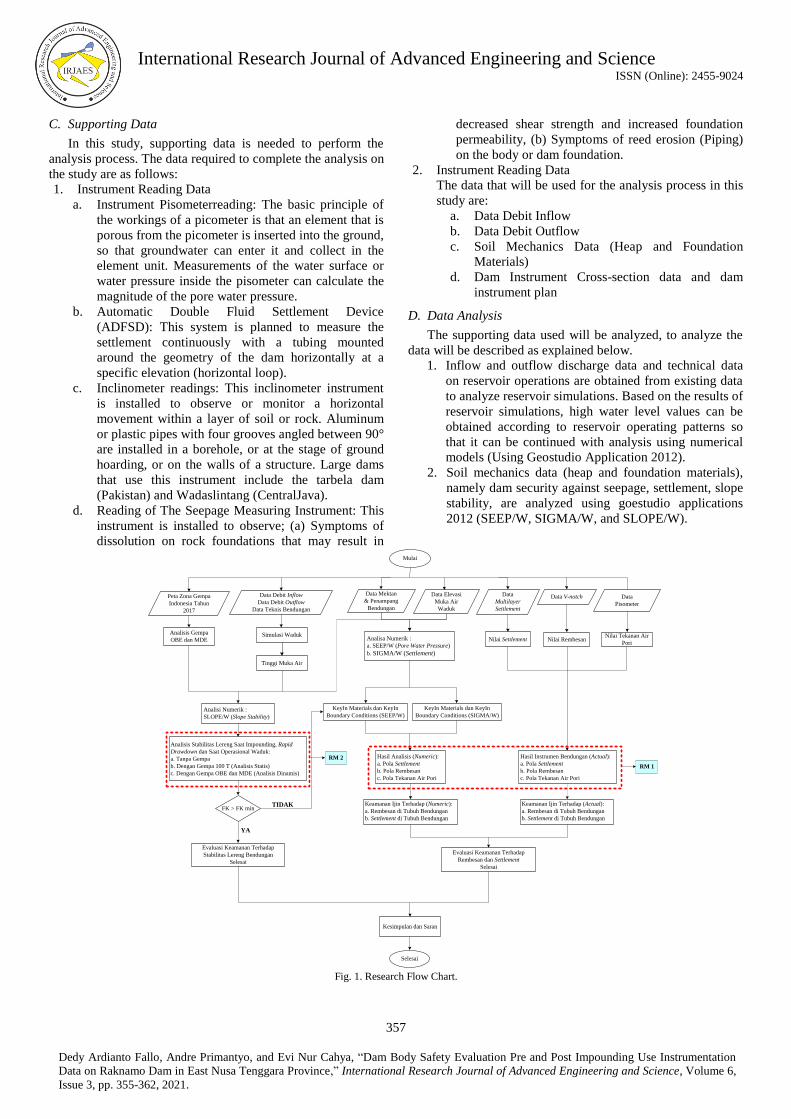
D. Data Analysis
The supporting data used will be analyzed, to analyze the
data will be described as explained below.
1. Inflow and outflow discharge data and technical data
on reservoir operations are obtained from existing data
to analyze reservoir simulations. Based on the results of
reservoir simulations, high water level values can be
obtained according to reservoir operating patterns so
that it can be continued with analysis using numerical
models (Using Geostudio Application 2012).
2. Soil mechanics data (heap and foundation materials),
namely dam security against seepage, settlement, slope
stability, are analyzed using goestudio applications
2012 (SEEP/W, SIGMA/W, and SLOPE/W).
Fig. 1. Research Flow Chart.
Mulai
Simulasi Waduk
Hasil Analisis (Numeric):
a. Pola Settlement
b. Pola Rembesan
c. Pola Tekanan Air Pori
Analisa Numerik :
a. SEEP/W (Pore Water Pressure)
b. SIGMA/W (Settlement)
Evaluasi Keamanan Terhadap
Rembesan dan Settlement
Selesai
Selesai
RM 1
Data V-notchData
Multilayer
Settlement
Data Elevasi
Muka Air
Waduk
Data Mektan
& Penampang
Bendungan
Data Debit Inflow
Data Debit Outflow
Data Teknis Bendungan
Tinggi Muka Air
Kesimpulan dan Saran
Data
Pisometer
Nilai Tekanan Air
PoriNilai Settlement Nilai Rembesan
Keamanan Ijin Terhadap (Numeric):
a. Rembesan di Tubuh Bendungan
b. Settlement di Tubuh Bendungan
Analisi Numerik :
SLOPE/W (Slope Stability)
Peta Zona Gempa
Indonesia Tahun
2017
Analisis Gempa
OBE dan MDE
Analisis Stabilitas Lereng Saat Impounding, Rapid
Drawdown dan Saat Operasional Waduk:
a. Tanpa Gempa
b. Dengan Gempa 100 T (Analisis Statis)
c. Dengan Gempa OBE dan MDE (Analisis Dinamis)
KeyIn Materials dan KeyIn
Boundary Conditions (SEEP/W)
KeyIn Materials dan KeyIn
Boundary Conditions (SIGMA/W)
Hasil Instrumen Bendungan (Actual):
a. Pola Settlement
b. Pola Rembesan
c. Pola Tekanan Air Pori
Keamanan Ijin Terhadap (Actual):
a. Rembesan di Tubuh Bendungan
b. Settlement di Tubuh Bendungan
Evaluasi Keamanan Terhadap
Stabilitas Lereng Bendungan
Selesai
FK > FK min
RM 2
TIDAK
YA

International Research Journal of Advanced Engineering and Science ISSN (Online): 2455-9024
358
Dedy Ardianto Fallo, Andre Primantyo, and Evi Nur Cahya, “Dam Body Safety Evaluation Pre and Post Impounding Use Instrumentation
Data on Raknamo Dam in East Nusa Tenggara Province,” International Research Journal of Advanced Engineering and Science, Volume 6,
Issue 3, pp. 355-362, 2021.
Fig. 2. Numerical Analysis Flow Chart.
3. Dam instrument cross-sectional data and dam
instrument floor plans are used to describe the cross-
section of the dam according to the current instrument
installation position so that it can be analyzed with
numerical models. At the same time, the dam
instrument floor plan data is needed to know the part of
the installation of instruments on the dam.
4. Pisometer data is used to compare the pore water
pressure value at the beginning of impounding with
instrument reading data until the end of 2020.
Pisometer data is also used to draw water level
elevation lines or phreatic lines that occur in the body
of the dam, as well as further analysis of the pore water
pressure that occurs in the body of the dam with
numerical models.
5. Multilayer settlement data is used to compare the steep
decline in the dam body at the beginning of
construction until after impounding with instrument
reading data until the end of 2020.
6. V-notch data is used to compare how much discharge
seepage value occurs at the beginning of impounding
with instrument reading data until the end of 2020.
E. Research Flow Chart
The process of collecting data arrives at the analysis of
data so that several conclusions based on the results of this
study can be seen in figure 1.
In figure 2 is a flow chart of numerical analysis.
IV. RESULT
Instrumentation data used as analysis is; Vibrating Weir
Piezometer, Multilayer Settlement, and V-Notch. The position
or installation plan for each instrument on the Raknamo Dam
can be seen in Figure 3. The installation of tools at the core of
the Raknamo Dam can be seen in Figure4.
Fig. 3. Raknamo Dam Instrument PlacementPlan.
Fig. 4. Elongated Pieces of Instruments on the U.S. Raknamo Dam.
A. Hoard Material Data
The heaped material used in the Raknamo Dam consists of
5 heap zones, namely; zone 1 (core), zone 2 (smooth filter),
zone 3 (rough filter), zone 4 (random), zone 5 (rip-rap),
Mulai
Selesai
Data Elevasi
Muka Air
Waduk
Penampang
Bendungan
Data Mektan
Zona
Timbunan
Drawing Region di
SEEP/W
KeyIn Materials:
· Material Model (Saturated / Unsaturated)
· Hydraulic Conductivity Functions
· Volume Water Content Functions
KeyIn Boundary Conditions:
· Hulu Seepage
· Hilir Seepage
· Zero Pressure
· Nilai Tekanan Air Pori
· Nilai Rembesan
Cek Data
Material
dan Boundary
Conditions
Results SEEP/W
· Vol. Water Content
· Koef Permeabilitas
· Coeff. of Vol.
Compressibility
· MD.10 (STA
0+300)
· MD.16 (STA
0+420)
· 31 Jan, 28 Feb, 30 Apr 2018
· 31 Jan, 30 Apr, 30 Sep, 31
Des 2019
· 29 Feb, 30 Apr, 30 Sep, 31
Des 2020
TIDAK TIDAK
YA

International Research Journal of Advanced Engineering and Science ISSN (Online): 2455-9024
359
Dedy Ardianto Fallo, Andre Primantyo, and Evi Nur Cahya, “Dam Body Safety Evaluation Pre and Post Impounding Use Instrumentation
Data on Raknamo Dam in East Nusa Tenggara Province,” International Research Journal of Advanced Engineering and Science, Volume 6,
Issue 3, pp. 355-362, 2021.
division of the heap zone MD-10, MD-11 and MD.16, MD-17
can be seen in Figure 5 and Figure 6 below. The heaped
material for each of these heap zones was obtained from the
results of testing in the laboratory by PT. Indra Karya. The
parameters for each heap zone can be seen in Table I.
TABLE I. Parameters of Material Stacking Of RaknamoDam.
Fig. 5. Material Heap Zone On MD-10, MD-11.
Fig. 6. Material Heap Zone on MD-16, MD-17.
B. Numerical Analysis
The numeric analysis conducted in this study uses the
application "Geostudio 2012", where this application can help
analyze pore water pressure and seepage that occurs using the
"SEEP / W" tool. As for analyzing settlements that occur in
the dam core pile can be used tools "SIGMA / W. To
investigate the pore water pressure and seepage in the dam
body, the process must first be inputted data. The analysis of
numeric pore water pressure MD.10 (STA 0+300) is
calculated based on changes in reservoir water level from
2018 to 2020 (can be seen in Table II). Changes in the water
level of this reservoir significantly affect the value of pore
water pressure that occurs in the dam. Based on the numerical
analysis results done with the last 2-year period (2018-2020),
the highest pore water pressure value for the MD.10 cross-
section (STA 0+300) occurred on April 30, 2019, can be seen
in figure 7.
Analysis of Numeric Pore Water Pressure MD.16 (STA
0+420) is calculated based on changes in reservoir water level
that occurred from 2018 to 2020 (can be seen in Table III).
Changes in the water level of this reservoir significantly affect
the value of pore water pressure that occurs in the dam. Based
on the numeric analysis results done with the last 2-year
period (2018-2020), the value of pore water pressure that
occurred in the MD.16 cross-section (STA 0 +420) occurred
on April 30, 2019 can be seen in figure 8.
Fig. 7. Pore Water Pressure MD.10 (April 30, 2019).
TABLE II. Results of Pore Water Pressure Analysis At SEEP/W - MD.10
(STA 0+300).
Fig. 8 Pore Water Pressure MD.16 (April 30, 2019).
TABLE III. Results of Pore Water Pressure Analysis At SEEP/W - MD.16
(STA 0+420).
Subsequent Analysis of Numeric Discharge Seepage (Flux)
MD.16 (STA 0+420). Pore water pressure that occurs in dams
based on the results of numeric SEEP / W analysis that has
been done with the last 2-year period (2018-2020), then from
the effects of pore water pressure that occurs will also be
known the value of seepage (flux) that happens at the location
ZONA 5 : RIP - RAP
ZONA 4 : MATERIAL RAMDOM
ZONA 3 : FILTER KASAR
ZONA 2 : FILTER HALUS
ZONA 1 : MATERIAL INTI
LEGENDA:
ZONA 5 : RIP - RAP
ZONA 4 : MATERIAL RAMDOM
ZONA 3 : FILTER KASAR
ZONA 2 : FILTER HALUS
ZONA 1 : MATERIAL INTI
LEGENDA:
Elv. Muka Air Date
(m) (day) VP.05 VP.06 VP.07 VP.08 VP.09 VP.10 VP.11
A 87,500 31-Jan-18 43,43 16,88 -23,95 -44,12 -97,63 -106,01 -170,33
B 93,650 28-Feb-18 105,48 41,39 44,60 -1,91 -20,43 -49,73 -102,93
C 94,950 30-Apr-18 116,23 45,12 56,27 4,26 -5,12 -39,78 -75,22
D 96,400 31-Jan-19 128,14 49,08 69,18 9,68 9,74 -28,99 -75,22
E 101,400 30-Apr-19 166,83 60,62 109,95 3,03 55,91 -30,53 -33,63
F 99,200 30-Sep-19 150,98 55,43 94,26 21,28 36,99 -4,30 -44,75
G 98,500 31-Dec-19 145,94 55,86 88,49 23,42 30,29 -9,87 -52,38
H 100,119 29-Feb-20 159,43 61,84 102,62 30,25 45,54 -6,72 -37,62
I 99,735 30-Apr-20 156,15 58,59 99,79 30,58 42,41 3,37 -38,30
J 98,834 30-Sep-20 147,70 54,05 90,66 16,69 33,30 -9,29 -49,48
K 98,690 31-Dec-20 146,02 53,00 88,74 9,91 31,62 -14,29 -52,72
CodePore Water Pressure (PWP) - SEEP/W (kPa)
Elv. Muka Air Date
(m) (day) VP.05 VP.06 VP.07 VP.08 VP.09 VP.10 VP.11 VP.12 VP.13 VP.14 VP.15
A 87,500 31-Jan-18 78,43 28,80 15,77 -21,61 -53,44 -76,41 -128,86 -136,35 -14,68 -64,15 -132,79
B 93,650 28-Feb-18 135,24 47,53 77,08 -0,82 20,35 -33,17 -53,57 -78,29 -12,98 -63,12 -131,77
C 94,950 30-Apr-18 150,38 61,42 93,47 37,12 35,82 -1,13 -32,46 -52,59 -13,32 -63,33 -131,97
D 96,400 31-Jan-19 157,31 59,69 99,62 4,95 44,71 -29,46 -19,30 -61,29 -12,10 -62,58 -131,22
E 101,400 30-Apr-19 205,88 92,97 151,99 85,53 96,84 40,82 36,98 2,04 -12,20 -62,64 -131,28
F 99,200 30-Sep-19 177,90 55,85 124,42 16,64 73,06 15,18 15,14 -21,04 -11,68 -62,33 -130,97
G 98,500 31-Dec-19 172,74 54,68 118,83 17,62 66,67 11,10 8,20 -27,69 -11,88 -62,45 -131,09
H 100,119 29-Feb-20 194,92 87,20 140,30 76,17 84,62 29,54 24,42 -8,41 -12,41 -62,77 -131,41
I 99,735 30-Apr-20 180,98 55,69 127,45 8,04 77,04 10,98 20,27 -19,45 -11,32 -62,11 -130,75
J 98,834 30-Sep-20 182,93 76,14 128,63 62,95 73,29 35,06 11,98 -12,95 -12,74 -62,97 -131,62
K 98,690 31-Dec-20 175,28 68,03 117,91 11,65 64,15 -40,97 9,25 -53,36 -11,13 -61,99 -130,63
CodePore Water Pressure (PWP) - SEEP/W (kPa)

International Research Journal of Advanced Engineering and Science ISSN (Online): 2455-9024
360
Dedy Ardianto Fallo, Andre Primantyo, and Evi Nur Cahya, “Dam Body Safety Evaluation Pre and Post Impounding Use Instrumentation
Data on Raknamo Dam in East Nusa Tenggara Province,” International Research Journal of Advanced Engineering and Science, Volume 6,
Issue 3, pp. 355-362, 2021.
of MD.16 (STA 0 + 420) can be seen in figure 9.
Fig. 9 Seepage (Flux) MD.16 (April 30, 2019).
In figure 9. The seepage value that occurs in the cross-
section of MD.16 when the water level is at an elevation of
101.40 m, the value of seepage can be known from the results
of flux analysis shown in figure 9. The seepage value in the
cross-section uses the effects of analysis flux located at the
downstream foot of the dam. The seepage value that occurs
over two years can be seen in Table IV below.
TABLE IV. Seep/W Analysis Results at SEEP/W - MD.16 (STA 0+420).
The Analysis of Numeric Settlement MD.11 (STA 0+320)
was conducted based on the dam body's pore water pressure
during the last 2-year period (2018-2020). The settlement that
occurs in the core pile of the dam's body is very dependent on
the pore water pressure that occurs. Payments that appear at
MD.11 (STA 0+320) can be seen in figure 10.
Fig. 10. Settlement MD.11 (December 31, 2020).
TABLE V. Seepage Analysis Results at SIGMA/W - MD.11 (STA 0+320).
C. Validation of Raknamo Dam Instrument Data
Existing weir piezometer, multilayer settlement, and V-
Notch vibrating instrument data are validated or compared
between instrument reading data in the field with numeric
analysis results at POSITION MD.10 and MD.16 for
piezometer instruments as well as MD.11 and MD.17 for
multilayer settlement instruments. Data from instrument
readings in the field (actual data) compared to the results of
numeric analysis (SEEP / W). This validation is based on
several dates in January 2018 - December 2020 to see more
clearly how the results of seep / W analysis and actual
piezometer data in the location of MD.16 (STA 0 +420) can
be seen more clearly be seen in Table VI.
TABLE VI. Seep/W Analysis Results and Actual Piezometer Data -
MD.16 (STA 0+420).
The numerical simulations on the MD.16 STA 0+420 cross-
section for instruments (VP.05, VP.07, VP.09, VP.11) showed
the same trend of pore water pressure (PWP) water level
fluctuations in reservoirs. In contrast (VP.06, VP.08, VP.10,
VP.12, VP.13, VP.14, VP.15) showed a trend of pore water
pressure (PWP) different from fluctuations in the water level
in the reservoir. This is because when the PWP value of the
instrument is minus, then the effect of water level fluctuations
is minimal. The actual readings in the field at the MD.16 STA
Tinggi
Muka Air
Debit
Numeric
Panjang
Pondasi
Debit
Numeric
(m) (m3/dtk/m) (m) (m
3/dtk)
(1) (2) (3) (4) (5) (6)=(4)*(5)
31-Jan-18 A 87,500 7,3256,E-07 540 0,00040
28-Feb-18 B 93,650 1,8831,E-06 540 0,00102
30-Apr-18 C 94,950 1,6628,E-06 540 0,00090
31-Jan-19 D 96,400 2,4878,E-06 540 0,00134
30-Apr-19 E 101,400 2,4077,E-06 540 0,00130
30-Sep-19 F 99,200 2,7896,E-06 540 0,00151
31-Dec-19 G 98,500 2,0830,E-06 540 0,00112
29-Feb-20 H 100,119 3,2635,E-06 540 0,00176
30-Apr-20 I 99,735 2,9143,E-06 540 0,00157
30-Sep-20 J 98,834 2,0715,E-06 540 0,00112
31-Dec-20 K 98,690 3,1369,E-06 540 0,00169
Tanggal Code
Elv. Muka Air Date
(m) (day) SP.01 PM.01 PM.02 PM.03 PM.04 PM.05
A 87,500 31-Jan-18 -0,0277 -0,2943 -0,5975 -0,6541 -0,5714 -0,4124
B 93,650 28-Feb-18 -0,0280 -0,2949 -0,5987 -0,6560 -0,5742 -0,4165
C 94,950 30-Apr-18 -0,0280 -0,2949 -0,5987 -0,6560 -0,5742 -0,4165
D 96,400 31-Jan-19 -0,0277 -0,2946 -0,5984 -0,6557 -0,5738 -0,4162
E 101,400 30-Apr-19 -0,0280 -0,2949 -0,5987 -0,6560 -0,5742 -0,4165
F 99,200 30-Sep-19 -0,0280 -0,2949 -0,5987 -0,6560 -0,5742 -0,4165
G 98,500 31-Dec-19 -0,0280 -0,2949 -0,5987 -0,6560 -0,5742 -0,4165
H 100,119 29-Feb-20 -0,0280 -0,2949 -0,5987 -0,6560 -0,5742 -0,4165
I 99,735 30-Apr-20 -0,0280 -0,2949 -0,5987 -0,6560 -0,5742 -0,4165
J 98,834 30-Sep-20 -0,0280 -0,2949 -0,5987 -0,6560 -0,5742 -0,4165
K 98,690 31-Dec-20 -0,0280 -0,2949 -0,5987 -0,6560 -0,5742 -0,4165
CodeSettlement - SIGMA/W (m)
Code A B C D E F G H I J K
TMA (m) 87.500 93.650 94.950 96.400 101.400 99.200 98.500 100.119 99.735 98.834 98.690
Date (day) 31-Jan-18 28-Feb-18 30-Apr-18 31-Jan-19 30-Apr-19 30-Sep-19 31-Dec-19 29-Feb-20 30-Apr-20 30-Sep-20 31-Dec-20
VP.05 84.498 90.291 91.833 92.541 97.493 94.640 94.114 96.376 94.954 95.153 94.373
VP.06 79.437 81.346 82.763 82.586 85.980 82.195 82.076 85.391 82.179 84.264 83.437
VP.07 85.108 91.359 93.031 93.658 98.998 96.187 95.617 97.806 96.496 96.617 95.523
VP.08 81.297 83.416 87.285 84.005 92.221 85.197 85.296 91.267 84.320 89.919 84.688
VP.09 85.050 92.575 94.152 95.059 100.375 97.950 97.298 99.128 98.356 97.973 97.041
VP.10 82.709 87.118 90.384 87.496 94.663 92.048 91.632 93.512 91.620 94.075 86.322
VP.11 84.361 92.037 94.190 95.532 101.271 99.044 98.336 99.990 99.567 98.722 98.443
VP.12 83.597 89.517 92.138 91.251 97.708 95.355 94.676 96.643 95.517 96.179 92.059
VP.13 73.853 74.026 73.992 74.117 74.106 74.160 74.138 74.085 74.196 74.051 74.215
VP.14 73.809 73.914 73.893 73.969 73.963 73.995 73.982 73.949 74.017 73.929 74.029
VP.15 73.809 73.914 73.893 73.969 73.963 73.996 73.983 73.950 74.018 73.929 74.030
VP.05 77.384 77.426 83.303 88.537 93.089 93.239 92.988 93.082 93.350 93.022 92.788
VP.06 75.054 75.038 74.896 72.618 72.251 71.781 83.038 93.211 98.626 101.539 101.382
VP.07 83.246 90.496 93.945 96.261 100.426 99.156 98.508 98.750 98.931 97.991 97.744
VP.08 83.281 83.278 83.272 83.103 84.130 85.694 85.471 85.318 85.311 85.126 84.983
VP.09 90.052 90.040 93.659 94.873 99.164 98.266 97.683 97.890 97.981 97.182 96.940
VP.10 90.073 90.063 90.038 89.825 89.789 91.398 91.513 91.274 91.318 91.161 91.026
VP.11 97.151 97.144 97.129 96.946 100.787 99.723 99.075 99.217 99.405 98.552 98.245
VP.12 97.319 97.366 97.180 97.208 97.141 97.248 97.213 97.236 97.287 97.175 97.068
VP.13 74.938 74.929 74.913 74.711 74.654 74.605 74.495 74.477 74.458 74.377 74.317
VP.14 79.962 79.956 79.946 79.781 79.738 79.696 79.617 79.536 79.545 79.470 79.402
VP.15 89.650 89.772 89.762 89.907 89.985 90.589 89.545 89.525 89.580 90.150 89.333
VP.05 78.434 135.244 150.375 157.312 205.875 177.901 172.745 194.920 180.980 182.931 175.276
VP.06 28.802 47.527 61.418 59.687 92.970 55.852 54.684 87.195 55.690 76.138 68.027
VP.07 15.766 77.078 93.471 99.620 151.990 124.422 118.835 140.304 127.449 128.635 117.913
VP.08 -21.606 -0.820 37.121 4.949 85.528 16.643 17.615 76.174 8.041 62.951 11.650
VP.09 -53.445 20.353 35.818 44.713 96.839 73.063 66.670 84.615 77.041 73.290 64.145
VP.10 -76.408 -33.171 -1.133 -29.462 40.825 15.182 11.102 29.539 10.985 35.061 -40.975
VP.11 -128.859 -53.574 -32.462 -19.296 36.980 15.139 8.202 24.421 20.271 11.983 9.247
VP.12 -136.350 -78.289 -52.590 -61.287 2.036 -21.039 -27.694 -8.406 -19.448 -12.951 -53.357
VP.13 -14.679 -12.983 -13.321 -12.095 -12.197 -11.675 -11.884 -12.408 -11.320 -12.739 -11.128
VP.14 -64.148 -63.122 -63.328 -62.583 -62.641 -62.326 -62.454 -62.771 -62.110 -62.973 -61.994
VP.15 -132.795 -131.765 -131.971 -131.224 -131.282 -130.966 -131.094 -131.412 -130.749 -131.615 -130.633
VP.05 8.652 9.060 66.566 117.783 162.323 163.783 161.332 162.249 164.873 161.660 159.378
VP.06 -1.446 -1.462 -1.604 -3.882 -4.249 -4.719 6.538 16.711 22.126 25.039 24.882
VP.07 -2.486 68.458 102.202 124.866 165.620 153.189 146.848 149.219 150.986 141.788 139.375
VP.08 -2.141 -2.172 -2.228 -3.882 6.164 21.464 19.286 17.786 17.719 15.915 14.508
VP.09 -4.384 -4.500 30.909 42.789 84.770 75.990 70.286 72.311 73.199 65.383 63.018
VP.10 -4.178 -4.273 -4.519 -6.607 -6.957 8.790 9.916 7.578 8.005 6.472 5.151
VP.11 -3.413 -3.484 -3.630 -5.423 32.160 21.747 15.412 16.800 18.637 10.292 7.287
VP.12 -1.768 -1.315 -3.128 -2.855 -3.516 -2.462 -2.805 -2.582 -2.086 -3.184 -4.224
VP.13 -4.029 -4.118 -4.280 -6.253 -6.811 -7.286 -8.369 -8.542 -8.728 -9.524 -10.111
VP.14 -3.797 -3.852 -3.950 -5.566 -5.988 -6.399 -7.177 -7.967 -7.879 -8.609 -9.274
VP.15 22.500 23.696 23.605 25.017 25.782 31.689 21.482 21.280 21.821 27.396 19.400
PW
P (
Act
ua
l)
(kP
a)
To
tal H
ea
d (
SEE
P/W
)
(m)
To
tal H
ea
d(A
ctu
al)
(m)
PW
P (
SEE
P/W
)
(kP
a)

International Research Journal of Advanced Engineering and Science ISSN (Online): 2455-9024
361
Dedy Ardianto Fallo, Andre Primantyo, and Evi Nur Cahya, “Dam Body Safety Evaluation Pre and Post Impounding Use Instrumentation
Data on Raknamo Dam in East Nusa Tenggara Province,” International Research Journal of Advanced Engineering and Science, Volume 6,
Issue 3, pp. 355-362, 2021.
0+420 display for devices (VP.05, VP.07, VP.09, VP.11)
showed the same trend of pore water pressure (PWP) water
level fluctuations in reservoirs. In contrast, instruments
(VP.06, VP.08, VP.10, VP.12, VP.13, VP.14, VP.15) showed
a pore water pressure (PWP) trend, which is very different
from fluctuations in the water face in the reservoir. According
to Mohamed N. Salem et al. (2019), who tested the test model
in the laboratory of Zagazig University in Egypt stated that
when there is a change or difference in permeability value (k)
in the core stock, then the value of PWP and also seepage that
occurs will be different from numeric results.
Data from instrument readings in the field (actual data)
compared to the analysis results of numeric discharge seepage
(SEEP / W). This validation is based on several dates in
January 2018 - December 2020 to see more clearly how the
results of seep/W discharge analysis and actual V-Notch data
in MD.10 (STA 0+300) locations.
TABLE VII. Analysis of Numeric Discharge and Actual Debit V-Notch -
MD.10 (STA 0+300).
Modeling results with sigma/W numeric analysis show
deviations or differences from the actual results of multilayer
settlement instrument readings. According to Mohammad
Rashidi et al. (2017), while researching settlements at the
gavosham dam in Iran, this is caused by the soil around the
instrument compacted with a lower density compared to other
parts of the dam core to prevent damage to the device. As a
result, the stiffness of the soil around the instrument is lower
than in other parts of the dam core.
D. Maximum Security Factor Limit
The actual amount of seepage can be calculated with V-
Notch Weir, while the quantity of numeric seepage can be
calculated by seep/W analysis. The amount of seepage
tolerable relates to the amount of seepage quantity allowed for
the safety of the Raknamo dam. According to Look, the 2007
seepage limit is associated with the dam's height, the length of
the main barrier, and the permeability of the dam's core heap.
The allowable amount of seepage can generally be seen in
Table in Chapter II than from the height of the Raknamo dam,
which is 37.0 m; the maximum seepage limit can be obtained
at 0.259 m3/min/ m. Based on the maximum seepage limit
received, it can be seen in Table VIII and Table IX that the
discharge of seepage that occurs in the body of the Raknamo
dam due to changes in water level elevation from 2018 - 2020,
for each dam cross-section (MD.10 and MD.16) as well as on
V-Notch instruments. Safety factors against seepage occurring
in the MD.10 cross-section and V-Notch readings are still
safe, as shown in Table VIII.
TABLE VIII. Safety Factors against Numeric Seepage (MD.10 – STA
0+300) and Actual (V-Notch Observation), Look, 2007.
While the safety factor against seepage that occurs in the
MD.16 cross-section and V-Notch readings is still in a safe
condition, as shown in Table IX.
TABLE IX. Safety Factors against Numeric Seepage (MD.16 – STA
0+420) and Actual (V-Notch Observation), Look, 2007.
The amount of seepage allowed on the dam is closely
related to the safety of the dam. According to Soedibyo, 2003
the allowable seepage limit on barriers is 2% - 5% of the
average inflow discharge that goes into the reservoir. Based on
the Final Report - Raknamo Dam Design Certification, 2014
had an average inflow discharge of 0.6994m3/s.
The allowable
seepage quantity used is 2% of the inflow discharge, which is
0.014m3
/s. In addition to being safe against seepage, the dam's
body must also be safe against the dangers of piping. With
piping in the body of the dam, the body of the dam is not
secure. This causes piping when the dam body's critical speed
(Vc) is smaller than the flow speed (Vs). To ensure the dam
body is safe against piping hazards, it is necessary to calculate
the critical speed value (Vc) of the equation 2-20.
The layer of soil on the core of the Raknamo dam that
experiences strain or decrease (settlement) is caused by two
consequences: the soil arrangement in the changes and pore
cavities in the soil of the core pils reduced. According to
Novak, the 2007 settlement limit at the dam's core is allowed
based on equations 2-23 where; Settlement Index (SI) ≤ 0.02 =
0.85 m. When the SI is smaller than the specified security
factor, the settlement is still categorized as safe. To be able to
find out the decrease (payment) in the cross-section of MD.11
and MD.17 from the results of numeric analysis (SIGMA / W)
and actual field (multilayer settlement) in safe conditions.
E. Stability Analysis of Raknamo Dam
The stability analysis of the Raknamo dam reviewed was on
the cross-section of Main Dam 10 (MD.10) STA 0+300.
Analysis of dam stability is also taken into account in the
Tinggi
Muka Air
Debit
Numeric
Panjang
PondasiV-Nocth A V-Nocth B
Rerata
V-Notch
Debit
NumericDeviasi
Kesalahan
Relatif
(m) (m3/dtk/m) (m) (m
3/dtk) (m
3/dtk) (m
3/dtk) (m
3/dtk) (m
3/dtk) %
(1) (2) (3) (4) (5) (6) (7) (8)={(0,5)*(6+7)} (9)=(4)*(5) (10)=(8)-(9) (11)=(10/8)*100
31-Jan-18 A 87,500 3,0758,E-07 540 0,002 0,0008 0,00124 0,00017 0,00108 86,6
28-Feb-18 B 93,650 1,0747,E-06 540 0,004 0,0018 0,00304 0,00058 0,00246 80,9
30-Apr-18 C 94,950 1,2562,E-06 540 0,004 0,0004 0,00221 0,00068 0,00153 69,2
31-Jan-19 D 96,400 1,4794,E-06 540 0,005 0,0006 0,00291 0,00080 0,00211 72,5
30-Apr-19 E 101,400 2,8442,E-06 540 0,006 0,0008 0,00346 0,00154 0,00193 55,6
30-Sep-19 F 99,200 1,9024,E-06 540 0,006 0,0008 0,00320 0,00103 0,00218 67,9
31-Dec-19 G 98,500 1,8643,E-06 540 0,005 0,0010 0,00325 0,00101 0,00224 69,0
29-Feb-20 H 100,119 2,0632,E-06 540 0,007 0,0016 0,00427 0,00111 0,00315 73,9
30-Apr-20 I 99,735 1,8921,E-06 540 0,005 0,0015 0,00317 0,00102 0,00215 67,8
30-Sep-20 J 98,834 1,8893,E-06 540 0,004 0,0008 0,00262 0,00102 0,00160 61,1
31-Dec-20 K 98,690 1,8902,E-06 540 0,006 0,0010 0,00329 0,00102 0,00227 68,9
CodeTanggal
Tinggi
Muka Air
Debit
Numeric
Panjang
Pondasi
Rerata
V-Nocth
Rerata
V-Nocth
Debit
Numeric
Rerata
V-NocthNilai Ambang
(m) (m3/dtk/m) (m) (m
3/dtk) (m
3/dtk/m) (m
3/mnt/m) (m
3/mnt/m) (m
3/mnt/m)
(1) (2) (3) (4) (5) (6) (7) =(6)/(5) (8)=(4)*(60) (9)=(7)*(60) (10) (11) (11)
31-Jan-18 A 87,500 3,0758,E-07 540 0,00124 0,000002 0,00002 0,00014 0,259 Aman Aman
28-Feb-18 B 93,650 1,0747,E-06 540 0,00304 0,000006 0,00006 0,00034 0,259 Aman Aman
30-Apr-18 C 94,950 1,2562,E-06 540 0,00221 0,000004 0,00008 0,00025 0,259 Aman Aman
31-Jan-19 D 96,400 1,4794,E-06 540 0,00291 0,000005 0,00009 0,00032 0,259 Aman Aman
30-Apr-19 E 101,400 2,8442,E-06 540 0,00346 0,000006 0,00017 0,00038 0,259 Aman Aman
30-Sep-19 F 99,200 1,9024,E-06 540 0,00320 0,000006 0,00011 0,00036 0,259 Aman Aman
31-Dec-19 G 98,500 1,8643,E-06 540 0,00325 0,000006 0,00011 0,00036 0,259 Aman Aman
29-Feb-20 H 100,119 2,0632,E-06 540 0,00427 0,000008 0,00012 0,00047 0,259 Aman Aman
30-Apr-20 I 99,735 1,8921,E-06 540 0,00317 0,000006 0,00011 0,00035 0,259 Aman Aman
30-Sep-20 J 98,834 1,8893,E-06 540 0,00262 0,000005 0,00011 0,00029 0,259 Aman Aman
31-Dec-20 K 98,690 1,8902,E-06 540 0,00329 0,000006 0,00011 0,00037 0,259 Aman Aman
Tanggal Code
Komentar
Debit
Numeric
Komentar
Debit
V-Notch
Tinggi
Muka Air
Debit
Numeric
Panjang
Pondasi
Rerata
V-Nocth
Rerata
V-Nocth
Debit
Numeric
Rerata
V-NocthNilai Ambang
(m) (m3/dtk/m) (m) (m
3/dtk) (m
3/dtk/m) (m
3/mnt/m) (m
3/mnt/m) (m
3/mnt/m)
(1) (2) (3) (4) (5) (6) (7) =(6)/(5) (8)=(4)*(60) (9)=(7)*(60) (10) (11) (11)
31-Jan-18 A 87,500 7,3256,E-07 540 0,00124 0,000002 0,00004 0,00014 0,259 Aman Aman
28-Feb-18 B 93,650 1,8831,E-06 540 0,00304 0,000006 0,00011 0,00034 0,259 Aman Aman
30-Apr-18 C 94,950 1,6628,E-06 540 0,00221 0,000004 0,00010 0,00025 0,259 Aman Aman
31-Jan-19 D 96,400 2,4878,E-06 540 0,00291 0,000005 0,00015 0,00032 0,259 Aman Aman
30-Apr-19 E 101,400 2,4077,E-06 540 0,00346 0,000006 0,00014 0,00038 0,259 Aman Aman
30-Sep-19 F 99,200 2,7896,E-06 540 0,00320 0,000006 0,00017 0,00036 0,259 Aman Aman
31-Dec-19 G 98,500 2,0830,E-06 540 0,00325 0,000006 0,00012 0,00036 0,259 Aman Aman
29-Feb-20 H 100,119 3,2635,E-06 540 0,00427 0,000008 0,00020 0,00047 0,259 Aman Aman
30-Apr-20 I 99,735 2,9143,E-06 540 0,00317 0,000006 0,00017 0,00035 0,259 Aman Aman
30-Sep-20 J 98,834 2,0715,E-06 540 0,00262 0,000005 0,00012 0,00029 0,259 Aman Aman
31-Dec-20 K 98,690 3,1369,E-06 540 0,00329 0,000006 0,00019 0,00037 0,259 Aman Aman
Tanggal Code
Komentar
Debit
Numeric
Komentar
Debit
V-Notch

International Research Journal of Advanced Engineering and Science ISSN (Online): 2455-9024
362
Dedy Ardianto Fallo, Andre Primantyo, and Evi Nur Cahya, “Dam Body Safety Evaluation Pre and Post Impounding Use Instrumentation
Data on Raknamo Dam in East Nusa Tenggara Province,” International Research Journal of Advanced Engineering and Science, Volume 6,
Issue 3, pp. 355-362, 2021.
event of an earthquake. The earthquake is taken into account
in the evaluation of dam safety, namely; Basic earthquake
operations (operating base earthquake, OBE) and maximum
design earthquake (MDE). For that, it is necessary to analyze
OBE and MDE earthquakes first. Analysis to determine the
magnitude of the earthquake coefficient in the dam depends
mainly on the classification of the building risk class and the
acceleration of the design of the Raknamo dam risk class.
Based on the analysis results, the type of building risk can
then be determined, then the category of building risk is in
class III (High). The earthquake coefficient used in the
analysis of the stability of the dam slope uses the coefficient of
modified earthquakes. Obe earthquake values use 100-year
repeat times, while for MDE earthquakes use 5000-year repeat
times, the determination of OBE and MDE earthquakes is
determined using earthquake load criteria for dam design.
Stability analysis of the upstream and downstream slopes of
the Raknamo dam is carried out at the time; without
earthquakes, with static tremors 100 years, with OBE
earthquakes, and with MDE earthquakes. This slope stability
analysis uses the numeric (SLOPE/W) model of the 2012
Geostudio application. Before using the numeric model
(SLOPE / W), first done research using the numeric model
(SEEP / W) then obtained the value of pore water pressure for
each case, then the analysis of the numeric model (SLOPE /
W) combined with the study of the numeric model (SEEP / W)
to be known the value of the security factor in 3 (three)
different conditions.
V. CONCLUSION
The pore water pressure pattern in the MD.10 STA 0+300
cross-section based on numeric and actual results for
instruments (VP.05 to VP.09) has a downward open parabola
shape. Also, it has a similar trend to changes in water level
elevation in reservoirs. At the same time, instruments (VP.10
and VP.11) have a downward open parabola shape and have a
different trend with changes in water level elevation that
occurred during 2018 - 2020 in reservoirs. While the pore
water pressure pattern in the CROSS-section of MD.16 STA 0
+420 is based on numeric and actual results for instruments
(VP.05, VP.07, VP.09, VP.11) has the same trend as changes
in water level elevation in reservoirs. In contrast, instruments
(VP.06, VP.08, VP.10, VP.12, VP.13, VP.14, VP.15) have a
different trend with changes in water level elevation that
occurred during 2018 - 2020 in reservoirs. The seepage pattern
in the body based on numeric results has a downward open
parabolic shape. Also, it has the same trend as changes in
water level elevation in the reservoir. In contrast, the actual
result has a slightly different movement with changes in water
level elevation in the pool. The pattern of decline (settlement)
that occurs in the cross-section of MD.11 STA 0 +320 based
on numeric and actual results for instruments (SP.01, PM.01,
PM.02) has a more linear form and also has a trend that tends
to be the same for two years (2018 - 2020), for instruments
(PM.03, PM.04, PM.05) has a trend that tends to differ for 1.3
years (January 2018 - April 2019). Based on the results of
numeric analysis (SEEP / W) on the body of the dam is
0.00176 m3/s < 0.014 m3/s, then the barrier is still safe against
maximum discharge seepage. While based on the actual
reading results in the field (Instrument V-Notch) is 0.00427
m3/s < 0.014 m3/s, the dam is still safe against the maximum
seepage discharge. Based on the results of numerical analysis
(SIGMA / W) at the core of the dam is 0.00334 < 0.02, the
barrier is still safe because the settlement does not exceed the
allowable limit. Based on the results of numerical analysis
(SLOPE / W) for the stability of the slopes of the Raknamo
dam, with conditions without earthquakes, with static
earthquakes 100 years, and with dynamic earthquakes OBE
and MDE.
REFERENCES
[1] Undayani, S., Sri, W., Suharyanto. & Windu, P. 2017. Displacement
analysis of dam based on material parametersusing numerical simulation and monitoring instrumentation. 258 (05013):1-6.
[2] Departemen Permukiman dan Prasarana Wilayah. 2004. Pedoman
Analisis Stabilitas Bendungan Tipe Urugan Akibat Beban Gempa. Jakarta: Balai Bendungan.
[3] Xiaoping, C. & Jingwu, H. 2011. Stability Analysis of Bank Slope
Under Conditions of Reservoir Impounding and Rapid Drawdown. 3 (Supp):429-437.
[4] Sanjay, R., Ramakrishna, A. & Anindya, P. 2018. A Simplified
Approach to Assess Seismic Stability of Tailings Dams. 10 (2018):1082-1090.
[5] Mohammad, R. & Mohsen, H. 2017. Evaluation of Behaviors of Earth
and Rockfill Dams During Construction and Initial Impounding Using Instrumentation Data and Numerical Modeling. 9 (2017):709-725.
[6] B. G. Look. 2007. Handbook of Geotechnical Investigation and Design
Tables. London: Taylor & Francis Group.
[7] Imran, A., Muhammed, B., Natasha Javed. 2017. Numerical Analysis of
Seepage and Slope Stability in an Earthen Dam by Using Geo-Slope Software. 2 (2017):13-20.
[8] Mohammad, H. Aminfar., A. Rastbud, H. Ahmadi., A. Naseri. 2016.
Comparing the geodetical and geotechnical Methods in investigating the deformation of Earthfill dams; a case study of mahabad earthfill Dam,
iran. 4 (2016):619-637.
[9] McMahon, T.A. & Mein, R.G. 1978. Reservoir Capacity and Yield. Amsterdam: Elsevier Scientific Publishing Company.
[10] Mohamed, N. Salem., Hasem, M. Eldeeb., Salma, A. Nofal. 2019.
Analysis of Seepage through Earth Dams with Internal Core. 8 (2019):768-777.
[11] Novak, P., Moffat, A.I.B., Nalluri, C., & Narayanan, R. 2007. Hydraulic
Structures. Edisi IV. London: Taylor & Francis Group. [12] Pandian, R.S., Nair, I.S., Lakshmanan, E. 2016. Finite Element
Modelling of a Heavily Exploited Coastal Aquifer for Assessing The
Response of Groundwater Level to The Changes in Pumping and Rainfall Variation Due to Climate Change. Hydrology Research, 47
(2016):42-60.
[13] Pusat Studi Gempa Nasional, Pusat litbang Perumahan dan Permukiman. 2017. Peta Sumber dan Bahaya Gempa Indonesia. Jakarta: Kementerian
PUPR.
[14] Soedibyo, 2003. Teknik Bendungan. Cetakan Kedua. Jakarta: Pradnya Paramita.
[15] Sosrodarsono, S. & Takeda, K. Bendungan Tipe Urugan. Cetakan
Keempat. Jakarta: Pradnya Paramita. [16] Shivakumar, A., Shivamanth, H. & Solanki, P. 2015. Seepage and
Stability Analyses of Earth Dam Using Finite Element Method. 4
(2015):876-883. [17] Undayani, S., Sri, W., Suharyanto. & Windu, P. 2017. Influence of Pore
Water Pressure to Seepage and Stability of Embankment Dam (Case
Study of Sermo Dam Yogyakarta, Indonesia). 101 (05007):1-5. [18] W. Zhou., S. Li., Z. Zhou, & X. Chang. Remote Sensing of
Deformation of a High Concrete-Faced Rockfill Dam Using InSAR: A
Study of the Shuibuya Dam, China. 8 (255):1-15. [19] K.L. Morton., M.C. Muresan. & F.R. Debswana. 2008. Importance of
Pore Pressure Monitoring in High Walls. 225-238.


![Original Research Water Body Detection Analysis Using NDWI … Body... · parallels (Fig. 1). Atikhisar Dam was built 1971-1975 as an earthfill body on Sarıçay Creek [24] at a height](https://img.pdfslide.us/doc/110x75/6133ad71dfd10f4dd73b3e50/original-research-water-body-detection-analysis-using-ndwi-body-parallels-fig.jpg)