Embed Size (px)
Citation preview
Dam 7 Modernization Alternatives Study Technical Memo
Prepared for:
Upper Brushy Creek Water Control and Improvement District
March 2013
Prepared by: FREESE AND NICHOLS, INC.
10814 Jollyville Road, Building 4, Suite 100 Austin, Texas 78759
512-617-3100

Dam 7 Modernization Alternatives Study Upper Brushy Creek WCID
i
TABLE OF CONTENTS Executive Summary ............................................................................................................................1 1.0 Project Overview ......................................................................................................................1
1.1 Introduction ................................................................................................................................ 1 1.2 Background ................................................................................................................................. 1 1.3 Purpose ....................................................................................................................................... 3
2.0 Existing Conditions ....................................................................................................................4 2.1 Site Evaluation ............................................................................................................................ 4
2.1.1 Downstream Seep ............................................................................................................... 5 2.2 Geology and Seismicity ............................................................................................................... 6 2.3 Geotechnical Records ................................................................................................................. 7
2.3.1 Summary of Existing Geotechnical Data ............................................................................. 7 2.3.2 Soil Strength Data ............................................................................................................... 8
3.0 Alternatives Analyses .............................................................................................................. 10 3.1 Description of Alternatives ....................................................................................................... 10
3.1.1 Project Examples ............................................................................................................... 10 3.2 Additional Principal Spillway Analysis ....................................................................................... 13
3.2.1 Hydrologic Modeling ......................................................................................................... 13 3.2.2 Frequency Analysis Results ............................................................................................... 13 3.2.3 PMF Analysis Results ......................................................................................................... 14
3.3 Alternative Hydrologic and Hydraulic Analysis ......................................................................... 16 3.3.1 Hydrologic Modeling ......................................................................................................... 16 3.3.2 Frequency Analysis Results ............................................................................................... 16 3.3.3 Maintenance Road Access ................................................................................................ 17 3.3.4 PMF Analysis Results ......................................................................................................... 18 3.3.5 Hydraulic Capacity of Alternatives .................................................................................... 19 3.3.6 Downstream Conveyance ................................................................................................. 20
3.4 Stability Analysis ....................................................................................................................... 21 3.4.1 Structural Design ............................................................................................................... 21 3.4.2 Structural Stability ............................................................................................................ 22 3.4.3 Slope Stability ................................................................................................................... 24
4.0 Preliminary Environmental Assessment ................................................................................... 27 4.1 Site Evaluation .......................................................................................................................... 27
4.1.1 Threatened or Endangered Species .................................................................................. 27 4.1.2 Archaeology ...................................................................................................................... 29 4.1.3 Karst .................................................................................................................................. 29
4.2 Permitting ................................................................................................................................. 29 4.2.1 Nationwide Permit 3 ......................................................................................................... 29 4.2.2 City of Austin ..................................................................................................................... 31 4.2.3 Stormwater and Water Quality ........................................................................................ 31

Dam 7 Modernization Alternatives Study Upper Brushy Creek WCID
ii
5.0 Study Findings ........................................................................................................................ 33 5.1 Preliminary Design of Alternatives ........................................................................................... 33
5.1.1 Hydraulic Performance ..................................................................................................... 33 5.1.2 Stability Considerations .................................................................................................... 40 5.1.3 Regional Trail and Park Features ...................................................................................... 40 5.1.4 Upstream Access and Maintenance ................................................................................. 42 5.1.5 Permitting ......................................................................................................................... 42 5.1.6 Total Project Cost and Overall Project Schedule .............................................................. 43
5.2 Final Design Consideration ....................................................................................................... 44 5.2.1 Survey ............................................................................................................................... 44 5.2.2 Hydraulic Modeling ........................................................................................................... 44 5.2.3 Geotechnical Analysis ....................................................................................................... 45 5.2.4 Aesthetics and Miscellaneous Improvements .................................................................. 45
6.0 Recommendation ................................................................................................................... 48 7.0 References .............................................................................................................................. 49 Appendix A – Hydrology and Hydraulics
Appendix B – Slope Stability
Appendix C – Opinions of Probable Construction Costs

Dam 7 Modernization Alternatives Study Upper Brushy Creek WCID
ES-1
EXECUTIVE SUMMARY
The Upper Brushy Creek Water Control and Improvement District (District) operates and maintains 23 flood control structures within the Upper Brushy Creek watershed. The District has already modernized nineteen of their dams to meet current state dam safety requirements as directed by the Texas Commission on Environmental Quality (TCEQ) and to even exceed these requirements. Dam 7 is one of the last dams to be modernized as part of the District’s modernization program. Dam 7 is one of the largest of the District’s dams and most visible due to its proximity to Brushy Creek Park and the Brushy Creek Regional Trail. The intermediate-size, high-hazard dam is required to safely pass 75% of the Probable Maximum Flood (PMF), which is the largest flood that can be expected for a given watershed. The District has modernized its dams to safely pass 100% of the PMF. Currently Dam 7 can only pass 47% of the PMF through its principal and auxiliary spillways before the dam is overtopped.
The District engaged Freese and Nichols, Inc. (FNI) to perform an evaluation of three auxiliary spillway alternatives for modernizing Dam 7 to pass 100% of the PMF. FNI determined the hydraulic capacity of each alternative and used hydrologic modeling to establish the water surface elevations for the PMF event. These values were used to evaluate the stability of the embankment and spillway alternatives and preliminarily size the structural components. Each spillway alternative requires energy dissipation structures at their terminus, and a stepped apron concept was developed to serve this function. These analyses enabled FNI to develop preliminary opinions of probable construction cost. Considerations for final design were also evaluated, and a preliminary environmental assessment was conducted to outline permitting requirements. As part of the alternatives study, FNI also evaluated maintenance access requirements and incorporation of the Regional Trail into each alternative.
Alternative 1 is a 300-foot wide labyrinth weir which would be constructed within the limits of the present auxiliary spillway. Alternative 2 is a broad-crested weir which would be constructed in the present auxiliary spillway and extend into the embankment approximately 200 feet to provide a total crest width of 450 feet. Alternative 3 is a 200-foot wide labyrinth weir constructed in the embankment immediately adjacent to the north side of the existing auxiliary spillway along with the present 250-foot wide broad-crested weir for a total width of 450 feet. All alternative spillway crest elevations are set to the original as-built elevation of the auxiliary spillway.
Alternative 1 requires significant excavation of the auxiliary spillway and approach channel, but it does not require excavation of the embankment or expose it during construction. The location of the labyrinth weir within the auxiliary spillway makes it the least visible alternative to adjacent properties. The 300-foot weir has the smallest stepped apron which allows for the best incorporation of the Regional Trail and aesthetic enhancements. The labyrinth is the most hydraulically efficient, meaning it can pass 100% of the PMF while maintaining a lower maximum water surface elevation than the other alternatives. The total project cost for Alternative 1 is estimated at $12.3 million, which is 10% higher than the least expensive alternative.
Alternative 2 requires a parapet wall along the full length of the embankment and the addition of a downstream toe berm for stability. It is the most visible option to adjacent properties and trail and park

Dam 7 Modernization Alternatives Study Upper Brushy Creek WCID
ES-2
users. This alternative has the least amount of excavation, although some excavation of the embankment is required thereby exposing the embankment during construction. The 450-foot wide weir requires a large footprint for the stepped apron. The presence of the parapet wall requires the Regional Trail to traverse the concrete stepped spillway which limits the visual interest and natural feel of the trail. Alternative 2 is the least expensive alternative with an estimated total project cost of $11.4 million.
Alternative 3 requires significant excavation of the embankment, thereby exposing the embankment during construction. Due to the location of the labyrinth, it will likely be visible to adjacent properties and park users. The 450-foot wide spillway requires a large footprint for the stepped apron; however the Regional Trail can be incorporated with the ramp on the embankment. The total project cost for Alternative 3 is estimated at $12.6 million, which is 12% higher than the least expensive alternative.
The difference in cost between the two labyrinth weir options (Alternative 1 and Alternative 3) is 1%. At this level of analysis, there is essentially no difference in cost. Alternative 1 offers far more positive attributes than Alternative 3 and is considered the labyrinth option of choice. Alternative 2 is less expensive than Alternative 1; however, the negative attributes associated with Alternative 2 are rather extensive and produce what we believe to be a less desirable option despite the potential cost savings of $1 million. Alternative 1 provides the most advantages and opportunity to meet and exceed the District’s project goals.

Dam 7 Modernization Alternatives Study Upper Brushy Creek WCID
1
1.0 PROJECT OVERVIEW
1.1 INTRODUCTION The Upper Brushy Creek Water Control and Improvement District (District) operates and maintains 23 flood control structures within the Upper Brushy Creek watershed of the Brazos River Basin in Williamson County, Texas. As of February 2013, nineteen of the 21 high-hazard dams have been modernized to meet Texas Commission on Environmental Quality (TCEQ) Dam Safety requirements for high-hazard dams and safely pass 100% of the Probable Maximum Flood (PMF). The TCEQ requirements are intended to ensure dams are safely designed, maintained, and rehabilitated to reduce the potential for a dam breach and uncontrolled release of the reservoir. Dam failure can result in loss of life and significant property damage and economic loss. The requirements are based on the PMF storm which is the largest flood that can be realistically expected for a given watershed. The size and hazard classification of a dam determines the percent PMF that it must safely pass to meet requirements.
Dam 7 (National ID TX01365) is one of the largest of the District’s dams and most visible due to the proximity to Brushy Creek Park and Regional Trail. It is one of the District’s last dams to be modernized. Dam 7 has been determined hydraulically inadequate with the capacity to safely pass only 47% of the PMF. Therefore, improvements are required to meet TCEQ Dam Safety requirements and the District’s requirement to pass 100% of the PMF.
The District contracted with Freese and Nichols, Inc. (FNI) on January 4, 2013 to assist in a study on modernizing Dam 7. FNI was tasked to develop design alternatives to increase spillway capacity which included labyrinth weirs, a broad-crested weir, and raising the dam. The detailed evaluation of the three alternatives focused on modifications to the auxiliary spillway and top of dam. The evaluation included associated permitting requirements, opinions of probable engineering and construction cost estimates (total project costs), and estimated project schedules for each alternative evaluated.
1.2 BACKGROUND Dam 7 is located in Williamson County on the northwest border of the City of Austin, Texas. The dam is located near the intersection of West Parmer Lane and Brushy Creek Road and is adjacent to the Avery Ranch subdivision. The west end of the dam borders Brushy Creek Park and the Brushy Creek Regional Trail extends from the park across the dam and continues to the east. The Avery Ranch Golf Club is located upstream of the auxiliary spillway. The property downstream of the dam is private ranchland owned by the Wilson Family. The project location map is presented as Figure 1-1.
Construction of Dam 7 was completed in 1965 by the Soil Conservation Service. The dam consists of a 58-foot tall and 2,375-foot long earthen embankment. The embankment crest elevation is approximately 836 ft-msl. Figure 1-2 shows a cross section of the embankment at the maximum section. The upstream and downstream slopes are 2.5H to 1V and the downstream slope includes a berm at the toe. The crest of the embankment is approximately 20 feet wide. A cutoff trench was constructed to limit seepage through the clayey gravel foundation. Construction also included a 250-foot wide emergency spillway on the southern end with the crest at 828.2 feet above mean sea level (ft-msl). The original construction drawings refer to this as the emergency spillway; however, this is now referred to

Aver
y R
anch
Gol
f Clu
b
Aux
iliar
ySp
illw
ay
Dam
7
SouthBru
shy
Cre
ek
Brus
hyC
reek
Rd
UV734
Ave
ryR
anch
Sunningdale
Royal New Kent
Breakaway
Brodick
Bandon
Loxley
Fossm
oo
r
Bu
ndoran
Roy
But
ler
Banbridge
Farm-To-MarketRoad
734
Kodiak
SILV
ERA
DO
SPR
ING
S PA
RK
SO
UTH
BR
USH
YC
REE
KG
REE
NB
ELT
BR
USH
Y C
REE
KR
ECR
EATI
ON
PAR
K
BR
USH
YC
REE
KLA
KE
PAR
K
CH
AM
PIO
NPA
RK
CH
AM
PIO
NC
EMET
ERY
FIGURE1
080
01,
600 Fe
et
Pat
h: H
:\WR
_DE
SIG
N\W
OR
KIN
G\B
KW
_Pro
jLoc
_8x1
1_20
1303
19.m
xdD
ate
Sav
ed: 3
/19/
2013
10:
11:5
1 A
M
BKW13125
NAD83 State Plane (feet) Texas Central
Date: 3/19/2013
BCK
Name: BKW_ProjLoc_8x11_20130319
UPPER BRUSHY CREEK W.C.I.D.Project LocationBrushy Creek Dam 7FREESE AND NICHOLS, INC.10814 JOLLYVILLE ROADBUILDING 4, SUITE 100AUSTIN, TX 78759PHONE: 512.617.3100
Trav
isLe
e
Bas
trop
Bel
l
Mila
m
Bur
net
Will
iam
son
§̈ ¦35
Dam
7W
illia
mso
n C
ount
y, T
exas
PREPARED BY
FN PROJECT NO.
DATUM & COORDINATE SYSTEM
DATE CREATED
FILE NAME
Lege
nd Bru
shy
Cre
ekR
egio
nal T
rail
City
of A
ustin
City
of C
edar
Par
k
Park
Stre
am R
iver
NH
DW
ater
body
±
City
of C
edar
Par
k
City
of A
ustin
ETJ C
ity o
f Aus
tin
1-1

Dam 7 Modernization Alternatives Study Upper Brushy Creek WCID
3
as the auxiliary spillway. The principal spillway of the dam is a drop inlet spillway structure near the middle of the embankment constructed with a crest elevation of 804.6 ft-msl. The drop inlet connects to a 30” pipe which extends to the downstream toe and outlets into the plunge pool.
A topographic survey of the site was performed in March 2011 by Baker-Aicklen & Associates. This survey is used in this analysis.
Figure 1-2: Embankment Cross Section
1.3 PURPOSE This study presents three alternatives identified by FNI and the District during the scoping phase of the project. The three alternatives in the study include labyrinth weirs and broad-crested weirs. The purpose of this technical memorandum is to provide a summary of the studied alternatives and highlight the attributes and final design considerations of each alternative. The memorandum includes an existing conditions assessment, a preliminary environmental assessment, hydrologic and hydraulic analyses, preliminary stability analyses, and preliminary opinions of total project cost. For the purposes of this study per discussions with the District, an additional principal spillway at Dam 7 and at Dam 6 was added to the existing dam for comparison to alternatives. Dam 6 is included since it is directly upstream and acts in series with Dam 7. An evaluation of the potential principal spillways will be conducted during final design.
The alternate designs are preliminary and intended to provide information for the District to decide how to proceed with development of final design for the dam to meet TCEQ Dam Safety requirements. The final design phase will require additional analysis and detailed engineering for the alternative selected by the District. An addition of a principal spillway would also require detailed engineering design. As outlined in TCEQ’s “Design and Construction Guidelines for Dams in Texas,” the modifications will require coordination with TCEQ Dam Safety and submittal of final construction plans, specifications, and a design report documenting the final analyses.
The key FNI staff that led the study are the following:
Victor Vasquez, P.E. – Project Manager Tina Stanard, P.E. – Assistant Project Manager and Lead Design Engineer Jill Trevino, P.E. – Lead Hydrology and Hydraulics Engineer Marc Miller, P.E. – Lead Geotechnical Engineer Mathew Moses, P.E. – Lead Structural Engineer

Dam 7 Modernization Alternatives Study Upper Brushy Creek WCID
4
2.0 EXISTING CONDITIONS
2.1 SITE EVALUATION FNI performed site visits on January 16 and February 5, 2013, to make site observations, assess current conditions of the dam and spillway, and perform an environmental assessment. The dam was found in overall good condition as shown in Figure 2-1 to Figure 2-4. The crest of the dam was recently resurfaced with flexible base. Some trees and brush are scattered along the riprap on the upstream slope. The downstream slope has suitable grass cover with some trees near the toe. The principal spillway appears in good condition. Areas downstream of the auxiliary spillway crest show sign of erosion caused by flooding in 2010 as shown in Figure 2-5. An active seep was noted immediately below a stone retaining wall downstream of the trail near the auxiliary spillway as shown in Figure 2-6.
Figure 2-1: Upstream Slope of Dam viewed from Brushy Creek Park
Figure 2-2: Auxiliary Spillway Approach Channel viewed from Crest of Dam
Figure 2-3: Downstream Slope of Dam (facing east)

Dam 7 Modernization Alternatives Study Upper Brushy Creek WCID
5
Figure 2-4: Downstream Slope of Dam (facing west)
Figure 2-5: Eroded Slope Downstream of Auxiliary Spillway
2.1.1 Downstream Seep A seep is present near the downstream toe of the dam close to the right abutment as shown in Figure 2-6. During a site visit on January 16, 2013, it was observed that the seep is producing a clear discharge (no obvious sediment transport) at approximately 2 to 3 gallons per minute. The lake water surface elevation at the time of the visit was 805 ft-msl, and the exit point of the seep is approximately at elevation 798 ft-msl. The seep is approximately 370 feet from the upstream impoundment and about 40 feet downstream of the embankment toe.
The source of the seep is not evident since it is not located immediately downstream of the lake. Based on information in the Soil Conservation Service (SCS) Investigation (1964), the location of the seep is in close proximity to a limestone overhang that required shaping during construction of the dam. Small seeps along the bedrock were also noted during the investigations prior to dam construction. Since completion of the dam, there is no mention of the seep in historical records until the 2010 storm event; however, due to the fact that it is about 40-feet downstream of the toe of the embankment, it is

Dam 7 Modernization Alternatives Study Upper Brushy Creek WCID
6
possible that visual inspections performed by TCEQ, NRCS, and others simply did not extend far enough to note the seep. There is an existing 15” wastewater line near the seep which was installed in 2001. The pipe trench or joints through the limestone could be providing the flow path to the seep, but the possibility of a preferential flow path through the embankment does exist. Although it is not unusual for a dam to have seepage, seeps through an earthen dam can be an indicator of a developing problem and should be monitored. At Dam 7, the seepage area warrants further investigation to identify the source of the seep.
Figure 2-6: Approximate location of seep
2.2 GEOLOGY AND SEISMICITY Dam 7 is located in the Blackland Prairie Physiographic Province, an area with several Cretaceous-age outcroppings. As shown in Figure 2-7, these outcroppings include the Edwards (Ked), Comanche Peak (Kc), and Keys Valley/Walnut (Kwkv) geological formations. These formations are overlain with Quaternary-age alluvial (Qal) and terrace (Qt) deposits in the low-lying areas of the river channel. Surface soil in this region is residual clay that is derived from weathering of the parent rock formations.
The Cretaceous formations in this region are calcareous in nature and include various quantities of limestone, dolomite, chert, marl and clay. In the Austin area these formations often contain vugs and small solution features, but some specific formations (specifically the Edwards formation) can form large voids/karstic features and even caverns. Based on the available data, the Edwards formation is not present below the foundation level and large karstic features are not expected below the embankment.

Dam 7 Modernization Alternatives Study Upper Brushy Creek WCID
7
The downstream end of the auxiliary spillway has a rock outcropping of what appears to be the Comanche Peak Formation. The outcropping is primarily limestone that is weathered and fractured, but is relatively massive and resistant. The underlying Key Valley member appears to be located within the dam foundation and contains both limestone and marl.
Figure 2-7: Geological Map of Dam 7 Site Area
Dam 7 is not located within a seismic impact zone, as defined by TCEQ regulation Texas Administrative Code (TAC) §330.304. No mapped faults intersect the site, but this area is located along the western fringes of Balcones Fault Zone (BFZ). The BFZ consists of a sub-parallel series of normal gravity faults generally trending east of north with downward displacement to the southeast. The BFZ was most recently active about 15 million years ago. Mapped faulting activity is believed to be as recent as Pliocene time with most movement having occurred during early Miocene (Weeks, 1945). Based on this data the project site is considered generally aseismic and seismic accelerations are not required for this initial analysis.
2.3 GEOTECHNICAL RECORDS
2.3.1 Summary of Existing Geotechnical Data A list of existing records and information related to the dam is presented below.
SCS Construction Plans (1964), as-built dated June 19, 1965 SCS Foundation Memorandum, dated June 22, 1964 SCS Detailed Geologic Investigation of Dam Sites Report, dated March 24, 1964 SCS Watershed Protection Memo, dated July 7, 1964, with revised Recommended Use of Excavated Materials
Site 7

Dam 7 Modernization Alternatives Study Upper Brushy Creek WCID
8
SCS Supplemental Engineering Report, dated July 21, 1964, with additional shear test data and revised stability analysis results and recommendations for revised geometry Phase I Inspection Report by Texas Department of Water Resources dated September 15, 1980 SCS Inspection Reports, dated January 14, 1986 and December 19, 1990 NRCS Inspection Report, dated March 12, 2003 Kleinfelder Geotechnical Study 51488.2, dated May 6, 2005, for the Early Warning System Kleinfelder Geotechnical Study 51488, dated October 27, 2005, for a limited slope stability analysis between Stations 12+00 and 16+00 Draft Logs of Borings B07-014 through 016, by Kleinfelder, Project Number 108011, transmitted via email communication Draft geotechnical data collected and analyzed by Freese and Nichols in 2011 for Project BKW10423 prior to project being put on hold by the District
The existing project data includes a variety of boring logs, test pits, index test data, shear strength data, and visual observations. This existing data was considered adequate for use in the preliminary analysis of the proposed modification alternatives.
The construction drawings indicate that a zoned embankment was constructed with the more plastic soils placed in a central core zone and upstream shell, and the less plastic soils placed in the downstream shell. Laboratory data from 2005 indicate that the materials are similar to that indicated by the original SCS investigation, but that they contain some gravel (SCS, 1964). Although these materials contain gravel, the fines content is significant and considered suitable for the reduction of seepage. The engineering behavior of the material is likely more similar to clay due to the fines content.
The foundation material can be characterized as a relatively thin mantle of alluvial and colluvium soil over weathered marl and limestone. The thickness of the soil mantle appears to increase as the alignment progresses toward the original South Brushy Creek channel. Relatively sound limestone bedrock occurs at shallow depths at the auxiliary spillway. The limestone is relatively hard at the surface (below a thin mantle of residual soil), but the boring data suggests that it becomes marly with increasing depth.
2.3.2 Soil Strength Data The initial analysis of the embankment stability included an evaluation of shear strength for the various loading conditions (normal pool/flood stage) and stress conditions (drained/undrained). Analysis parameters were selected based on an evaluation of the available shear strength test data and the use of published correlations. Consideration was also given to historical data provided by NRCS from the Blackland Prairie Physiographic Province. The parameters selected for the analysis are presented in Table 2-1.

Dam 7 Modernization Alternatives Study Upper Brushy Creek WCID
9
Table 2-1: Selected Shear Strength Parameters for Alternatives Study
Material Type Embankment Zone Consolidated Unconsolidated
φ’ (°) c’ (psf) φ (°) c (psf) φ (°) c (psf)
Fat Clay Core 23 200 12 300 0 1,100
Lean Clay Shells 26 150 14 250 0 800
Clayey Gravel/Gravelly Clay Alluvial Foundation 28 100 16 300 0 450
Rock Rip Rap Upstream Shell/DS Berm 33 0 --- --- --- ---
Marl Foundation 28 1,000 --- --- --- ---
Bedrock Bedrock Foundation Impenetrable
Based on the available as-built data, the embankment shell material contains some gravel. Although the presence of gravel would improve shear strength characteristics, the shell material was not directly sampled and the percentage of gravel was not directly confirmed. Since the clayey portions of the embankment will govern stability, the analysis assumes that the shells are composed only of lean clay.
The above information was used to evaluate the stability of the existing embankment and the proposed alternatives. This analysis is discussed in Section 3.4.

Dam 7 Modernization Alternatives Study Upper Brushy Creek WCID
10
3.0 ALTERNATIVES ANALYSES
3.1 DESCRIPTION OF ALTERNATIVES This study presents three alternatives identified by FNI and the District during the scoping phase of the project. Key objectives considered in the development of the alternatives and for modernizing Dam 7 are:
Meet TCEQ Dam Safety Requirements and District guidelines for dam rehabilitation Limit disturbance to existing dam and the surrounding areas Incorporate the Regional Trail and provide an aesthetically pleasing design Maintain maintenance access to the upstream side of the spillway Limit risk during construction
The three alternatives evaluated in the study are described as follows:
Alternative No. 1: Labyrinth Weir in the Auxiliary Spillway
Alternative 1 consists of a 300-foot wide labyrinth weir as a replacement to the existing auxiliary spillway. Built within the footprint of the existing auxiliary spillway, the crest of the labyrinth weir matches the as-built crest elevation of 828.2 ft-msl, and there is no increase in embankment height.
Alternative No. 2: Broad-Crested Weir in Embankment
Alternative 2 consists of widening the existing auxiliary spillway by 200 feet and raising the embankment with a parapet wall to prevent overtopping. The expanded auxiliary spillway is a broad-crested weir with a 450-foot bottom width. The crest elevation of 828.2 ft-msl is maintained to match the as-built conditions.
Alternative 3: Labyrinth Weir in the Embankment
Alternative 3 consists of a 200-foot wide labyrinth weir located in the embankment immediately west of the existing auxiliary spillway along with a 250-foot wide broad-crested weir in the existing auxiliary spillway. The crest of the labyrinth and broad-crested weirs is set to 828.2 ft-msl to match the as-built conditions of the auxiliary spillway. There is no embankment height increase in this alterative.
3.1.1 Project Examples
Labyrinth Weirs
Labyrinth weirs are linear weirs that appear folded in plan-view to increase the crest length for a given width. A plan view of a typical labyrinth weir section is shown as Figure 3-1. A labyrinth weir is able to pass large discharges at relatively low heads compared to traditional weirs of equal width. As a result of their hydraulic performance and geometric versatility, labyrinth weirs have been placed in streams, canals, rivers, ponds, and reservoirs as headwater control structures, energy dissipaters, flow aerators, and spillways. Labyrinth weirs are well suited for spillway rehabilitation where aging infrastructure, dam safety concerns, freeboard limitations, and a revised and larger probable maximum flow have required increased spillway capacity. Two examples are presented in the following paragraphs.

Dam 7 Modernization Alternatives Study Upper Brushy Creek WCID
11
Figure 3-1: Plan View of Typical Labyrinth Weir
Lake Brazos Dam labyrinth weir, shown in Figure 3-2, was designed by FNI as a replacement of a gated spillway on Lake Brazos. The innovative labyrinth weir design combined reuse of the existing dam site with an unconventional spillway configuration and yielded substantial reduction in construction cost and time. Following construction, the project received numerous awards for its innovative design approach and successful construction (Vasquez et al., 2007).
Figure 3-2: Lake Brazos Dam shortly after construction

Dam 7 Modernization Alternatives Study Upper Brushy Creek WCID
12
Lake Townsend Dam impounds the primary water supply for the City of Greensboro, North Carolina. A 300-foot wide labyrinth weir was chosen to replace the existing, deteriorating concrete gated spillway to provide additional spillway capacity and a low maintenance structure for the City (Schnabel, 2013). This project was also an award-winning rehabilitation project.
Figure 3-3: Lake Townsend Labyrinth Weir under Construction (Schnabel, 2013)
Broad-Crested Weirs
A broad-crested weir is a linear weir with a relatively wide, flat crest. Broad-crested weirs are common and serve as spillways on many different types of dams. One of example of a broad-crested weir is the Great Northern Dam which is a small high-hazard dam in Austin, Texas. The City of Austin recently rehabilitated the dam and FNI designed the broad-crested weir shown in Figure 3-4.
Figure 3-4: Great Northern Dam Broad-Crested Weir shortly after Construction in 2010

Dam 7 Modernization Alternatives Study Upper Brushy Creek WCID
13
3.2 ADDITIONAL PRINCIPAL SPILLWAY ANALYSIS The District requested that this alternatives study include the assumption that an additional principal spillway is added at Dam 6 and Dam 7 to reduce the drawdown time of the reservoir following a flood event. The possibility of adding additional principal spillways will be evaluated in detail during the final design stage. The study includes reasonably sized principal spillways based on work at other dams for the purpose of alternatives comparison. The model with the additional principal spillways added serves as base conditions for comparing the impact of the auxiliary spillway modification alternatives. A summary of the modeling and results is presented below, and additional information is included in Appendix A.
3.2.1 Hydrologic Modeling FNI obtained the most recent Dam 7 hydrology and hydraulics model developed in the Watershed Study from URS (existing and ultimate land use conditions) which were used as the basis for the models developed in this study. Ultimate land use conditions consider the future build-out of the watershed as opposed to the current land use of the watershed. Often, ultimate land use yields higher impervious cover throughout the watershed and increased peak discharges.
The Dam 7 models include Dam 6 and Twin Lakes Dam and were developed for flood frequency events ranging from the 2-year to 500-year events. For the purpose of this report, the URS hydrologic models are referred to as the effective model.
FNI revised the effective model to include the additional principal spillways, extended the duration of the model run to determine impacts on drawdown times, and developed an updated PMF model for use in the alternatives analyses discussed in Section 3.3. This model is referred to as the revised effective model.
Stage-discharge rating curves were developed to include the additional principal spillways (36-inch diameter at Dam 6 and 60-inch at Dam 7), and incorporated into the revised effective model. For the purpose of the study, the upstream inverts of the additional spillways were assumed to be set at normal pool and the downstream inverts were assumed to match the existing outfall elevation at each dam. The feasibility and sizing of any additional principal spillways will be evaluated during final design.
3.2.2 Frequency Analysis Results The additional principal spillways impact the peak water surface elevations, peak inflow, peak outflow and drawdown times for the frequency events. A comparison of the hydrologic results for the effective and revised effective models are presented in Table 3-1 for existing land use and Table 3-2 for ultimate land use.

Dam 7 Modernization Alternatives Study Upper Brushy Creek WCID
14
Table 3-1: Effective vs. Revised Effective Frequency Event Results for Existing Land Use
Storm Event (year)
Peak Water Surface Elevation (ft-msl)
Peak Inflow (cfs)
Peak Outflow (cfs)
Eff. Rev. Eff. Diff. (ft) Eff. Rev. Eff. Diff. (%) Eff. Rev. Eff. Diff. (%)
2 813.49 812.22 -1.27 2,074 2,082 0% 108 328 205%
10 819.48 817.70 -1.78 4,669 4,683 0% 118 488 313%
25 822.73 821.00 -1.73 6,567 6,588 0% 123 558 352%
50 825.23 823.42 -1.81 8,234 8,260 0% 127 604 374%
100 827.66 825.76 -1.91 9,980 10,030 0% 131 645 392%
500 831.45 830.89 -0.55 15,688 15,904 1% 2,018 1,966 -3%
Table 3-2: Effective vs. Revised Effective Frequency Event Results for Ultimate Land Use
Storm Event (year)
Peak Water Surface Elevation (ft-msl)
Peak Inflow (cfs)
Peak Outflow (cfs)
Eff. Rev. Eff. Diff. (ft) Eff. Rev. Eff. Diff. (%) Eff. Rev. Eff. Diff. (%)
2 815.06 813.57 -1.50 2,566 2,575 0% 110 378 242%
10 820.98 819.11 -1.88 5,322 5,343 0% 121 519 331%
25 824.06 822.25 -1.81 7,257 7,285 0% 125 582 364%
50 826.51 824.69 -1.82 8,989 9,038 1% 129 626 384%
100 829.08 826.98 -2.10 10,832 10,918 1% 160 665 315%
500 831.81 831.28 -0.53 17,014 17,206 1% 2,446 2,427 -1%
As shown above, the addition of a second principal spillway will reduce the peak water surface elevation in the reservoir and will increase the peak discharges for events up to the 100-year return frequency for both the existing and ultimate land use assumptions. The drawdown time after flood events will also decrease and will be evaluated in final design as part of the principal spillways assessment. The hydraulic model downstream of Dam 7 will also be refined during final design to assess the impact of the increased flows on the velocities and water surface elevations in South Brushy Creek.
3.2.3 PMF Analysis Results FNI evaluated the impact of the additional principal spillways for larger events in addition to the frequency events described above. Dam 7 is an intermediate size, high-hazard dam and is required by TCEQ to safely pass a minimum of 75% of the PMF. The 75% and 100% PMF events for effective and revised effective conditions were analyzed as part of the existing conditions assessment.
Table 3-3 provides a comparison of the effective and revised effective existing land use water surface elevations as well as peak inflow and outflow of Dam 7 and Table 3-4 presents results for the ultimate land use conditions.

Dam 7 Modernization Alternatives Study Upper Brushy Creek WCID
15
Table 3-3: Effective vs. Revised Effective Water Surface Elevations and Peak Discharges for Existing Land Use
TCEQ Dist. (hour)
Peak Water Surface Elevation (ft-msl)
Peak Inflow (cfs)
Peak Outflow (cfs)
Eff. Rev. Eff. Diff. (ft) Eff. Rev. Eff. Diff. (%) Eff. Rev. Eff. Diff. (%)
1 836.64 836.57 -0.06 53,869 53,889 0% 16,556 16,075 -3%
2 837.83 837.79 -0.04 51,692 51,928 0% 38,036 37,938 0%
3 838.27 838.23 -0.04 48,119 48,162 0% 45,930 45,924 0%
6 837.92 837.88 -0.04 49,415 49,659 0% 39,587 39,565 0%
12 838.64 838.60 -0.04 54,164 54,166 0% 52,564 52,549 0%
24 838.04 838.00 -0.04 41,881 41,868 0% 41,763 41,751 0%
48 837.14 837.11 -0.04 25,663 25,663 0% 25,659 25,659 0%
72 836.74 836.70 -0.04 18,349 18,349 0% 18,348 18,348 0%
75% PMF 837.65 837.60 -0.05 37,590 37,582 0% 34,788 34,620 0%
Table 3-4: Effective vs. Revised Effective Water Surface Elevations and Peak Discharges for Ultimate Land Use
TCEQ Dist.
(hour)
Peak Water Surface Elevation (ft-msl)
Peak Inflow (cfs)
Peak Outflow (cfs)
Eff. Rev. Eff. Diff. (ft) Eff. Rev. Eff. Diff. (%) Eff. Rev. Eff. Diff. (%)
1 836.71 836.66 -0.06 54,928 54,951 0% 17,965 17,619 -2%
2 837.90 837.85 -0.04 52,366 52,599 0% 39,250 39,144 0%
3 838.29 838.26 -0.04 48,465 48,507 0% 46,409 46,407 0%
6 837.95 837.91 -0.04 50,064 50,308 0% 40,246 40,221 0%
12 838.65 838.62 -0.04 54,421 54,421 0% 52,872 52,857 0%
24 838.04 838.00 -0.04 41,927 41,914 0% 41,813 41,801 0%
48 837.14 837.11 -0.04 25,674 25,674 0% 25,671 25,671 0%
72 836.74 836.70 -0.04 18,356 18,356 0% 18,355 18,355 0%
75% PMF 837.67 837.63 -0.04 37,812 37,815 0% 35,203 35,055 0%
As shown above the controlling distribution is the 12-hour distribution as it results in the highest water surface elevation thereby making it the PMF event. For the PMF events, the peak water surface elevation at Dam 7 decreases slightly in the revised effective models compared to the effective models. The existing minimum crest elevation of the dam embankment is 835.35 ft-msl and the peak water surface elevation is over three feet higher than the existing top of dam for both effective and revised effective conditions. Dam 7 can only safely pass 47% of the PMF for effective conditions and 48% of the PMF for revised effective conditions assuming ultimate land use conditions.
The additional principal spillways do not adversely impact the outflow during the PMF event; therefore, the additions will not cause an adverse impact downstream compared to effective conditions for the PMF event.

Dam 7 Modernization Alternatives Study Upper Brushy Creek WCID
16
3.3 ALTERNATIVE HYDROLOGIC AND HYDRAULIC ANALYSIS The second hydrologic analysis was conducted to compare the three proposed auxiliary spillway alternatives described in Section 3.1. A summary of the modeling and results is presented below and additional information is included in Appendix A.
3.3.1 Hydrologic Modeling The results of the revised effective analysis served as base conditions for comparing the effects of the proposed auxiliary spillway alternatives for the frequency and PMF events. The stage-discharge rating curves for each of the three proposed configurations were incorporated in the hydrologic models.
3.3.2 Frequency Analysis Results The three alternatives were compared to the revised effective configuration (existing dam plus the additional principal spillway) to evaluate hydrologic impacts such as peak water surface elevations, peak inflow, peak outflow and drawdown times for the frequency events. Since the auxiliary spillway does not engage until an event larger than the 100-year storm, the frequency event results for the three alternatives are the same as the revised effective model through the 100-year event. Table 3-5 and Table 3-6 provide a comparison of the peak water surface elevation in the effective, revised effective, and three alternative models for existing and ultimate land use conditions.
Table 3-5: Frequency Events Comparison of Peak Water Surface Elevations for Existing Land Use
Storm Event (year)
Effective (ft-msl)
Revised Effective (ft-msl)
Alt.1 (ft-msl)
Alt.2 (ft-msl)
Alt.3 (ft-msl)
2 813.49 812.22
10 819.48 817.70
25 822.73 821.00
50 825.23 823.42
100 827.66 825.76
500 831.45 830.89 828.22 829.73 828.55
Table 3-6: Frequency Events Comparison of Peak Water Surface Elevations for Ultimate Land Use
Storm Event (year)
Effective (ft-msl)
Revised Effective (ft-msl)
Alt.1 (ft-msl)
Alt.2 (ft-msl)
Alt.3 (ft-msl)
2 815.06 813.57
10 820.98 819.11
25 824.06 822.25
50 826.51 824.69
100 829.08 826.98
500 831.81 831.28 828.54 830.02 828.94

Dam 7 Modernization Alternatives Study Upper Brushy Creek WCID
17
The tables show that the existing and ultimate land use peak water surface elevation at Dam 7 varies by up to 1.5 feet for the three alternatives. Alternative 2 yields the highest water surface elevation for the 500-year event, while Alternative 1 yields the lowest water surface elevation. The three alternatives do not affect the peak water surface elevation compared to revised effective conditions up to and including the 100-year storm event. The alternatives all yield lower water surface elevations for the 500-year event compared to existing and existing with the additional principal spillways.
3.3.3 Maintenance Road Access The maintenance road provides access to the auxiliary spillway to clean debris after flood events and perform dam safety inspections. The maintenance road in the auxiliary spillway is currently at 829.0 ft-msl, and the effective model shows the road is not inundated by events up to the 100-year storm event. The three alternatives require modifications to the auxiliary spillway and maintenance road. Alternatives 1 and 3 significantly lower portions of the maintenance road. Alternative 2 is not affected since the road elevation is above the 100-year storm event. Table 3-7 and Table 3-8 show the auxiliary spillway access road elevations and the frequency event that causes the road to be inundated for existing and ultimate land use conditions, respectively. The auxiliary spillway will be accessible much less frequently with Alternatives 1 and 3 than it has historically been.
Table 3-7: Access Road Inundation Frequency with Existing Land Use Conditions
Alternative Road
Elevation (ft-msl)
Frequency Event that Inundates Road
100-Year Event Water Depth
over Road (ft)
Duration of Inundation
(Days) Effective 829.0 > 100-year 0.0 N/A
Revised Effective 829.0 > 100-year 0.0 N/A
Alternative 1 819.0 10- to 25-year 6.8 2.2
Alternative 2 828.2 > 100-year 0.0 N/A
Alternative 3 819.0 10- to 25-year 6.8 2.2
Table 3-8: Access Road Inundation Frequency with Ultimate Land Use Conditions
Alternative Road
Elevation (ft-msl)
Frequency Event that Inundates Road
100-Year Event Water Depth
over Road (ft)
Duration of Inundation
(Days) Effective 829.0 ~ 100-year 0.1 0.5
Revised Effective 829.0 > 100-year 0.0 N/A
Alternative 1 819.0 2- to 10-year 8.0 2.5
Alternative 2 828.2 > 100-year 0.0 N/A
Alternative 3 819.0 2- to 10-year 8.0 2.5

Dam 7 Modernization Alternatives Study Upper Brushy Creek WCID
18
3.3.4 PMF Analysis Results The 75% and 100% PMF events were analyzed for the three alternatives to provide the basis for top of dam embankment modifications and parapet wall height to meet TCEQ Dam Safety Requirements. Table 3-9 provides a comparison of the three alternatives existing land use water surface elevations as well as peak inflow and outflow of Dam 7. Table 3-10 presents results for the ultimate land use conditions.
Table 3-9: Comparison of Water Surface Elevations and Peak Discharges for Existing Land Use
TCEQ Distribution
(hour)
Peak Inflow (cfs)
Peak Water Surface Elevation (ft-msl)
Peak Outflow (cfs)
All Alts. Alt.1 Alt.2 Alt.3 Alt.1 Alt.2 Alt.3
1 53,889 832.16 834.52 832.65 28,707 21,126 27,028
2 51,928 834.08 836.92 834.58 41,455 34,863 40,855
3 48,162 834.48 837.85 835.04 44,441 41,107 44,456
6 49,659 833.95 837.23 834.49 40,518 36,921 40,204
12 54,166 835.26 838.80 835.80 50,193 47,555 50,368
24 41,868 834.09 837.88 834.67 41,520 41,296 41,550
48 25,663 831.68 835.34 832.44 25,655 25,649 25,653
72 18,349 830.61 834.01 831.28 18,347 18,346 18,347
75% PMF 37,582 833.05 836.43 833.73 34,382 31,621 34,229
Table 3-10: Comparison of Water Surface Elevations and Peak Discharges for Ultimate Land Use
TCEQ Distribution
(hour)
Peak Inflow (cfs)
Peak Water Surface Elevation (ft-msl)
Peak Outflow (cfs)
All Alts. Alt. 1 Alt. 2 Alt. 3 Alt. 1 Alt. 2 Alt. 3
1 54,951 832.30 834.68 832.81 29,647 22,007 28,005
2 52,599 834.19 837.04 834.69 42,270 35,682 41,706
3 48,507 834.54 837.92 835.10 44,892 41,625 44,914
6 50,308 834.04 837.31 834.57 41,152 37,447 40,838
12 54,421 835.31 838.86 835.84 50,507 47,929 50,684
24 41,914 834.09 837.88 834.67 41,577 41,361 41,606
48 25,674 831.69 835.35 832.44 25,667 25,662 25,666
72 18,356 830.61 834.01 831.28 18,354 18,353 18,354
75% PMF 37,815 833.10 836.49 833.76 34,649 31,954 34,529
As shown above the controlling distribution is the 12-hour distribution for all three alternatives. The table also shows that the peak water surface elevation for the PMF event at Dam 7 varies by approximately 3.5 feet for the different alternatives. Alternative 2 yields the highest water surface elevation for the PMF event, while Alternative 1 yields the lowest water surface elevation. The average existing crest elevation of Dam 7 is approximately 836.0 ft-msl and is considered the top of embankment once several low spots are filled in as part of the proposed improvements. Alternatives 1 and 3 can safely pass 100% of the PMF for existing and ultimate land use conditions based on a top of dam

Dam 7 Modernization Alternatives Study Upper Brushy Creek WCID
19
embankment elevation of 836.0 ft-msl; however, Alternative 2 requires raising the top of the dam to safely pass the PMF. Alternative 2 requires a 3.5-foot parapet wall to contain the peak water surface elevation of 838.86 ft-msl and include appropriate freeboard.
The peak discharges released from Dam 7 are decreased for the PMF event for both land use conditions of all three alternatives compared to effective and revised effective conditions, and therefore do not cause an adverse impact downstream. Table 3-11 and Table 3-12 provide a comparison of the 100% PMF peak water surface elevation in the effective, revised effective, and three alternative models for existing and ultimate land use conditions.
Table 3-11: Comparison of Peak Water Surface Elevations for Existing Land Use
Effective (ft-msl)
Revised Effective (ft-msl)
Alt.1 (ft-msl)
Alt.2 (ft-msl)
Alt.3 (ft-msl)
838.64 838.60 835.26 838.80 835.80
Table 3-12: Comparison of Peak Water Surface Elevations for Ultimate Land Use
Effective (ft-msl)
Revised Effective (ft-msl)
Alt.1 (ft-msl)
Alt.2 (ft-msl)
Alt.3 (ft-msl)
838.65 838.62 835.31 838.86 835.84
As shown above, Alternative 2 yields the highest water surface elevation for the PMF event, while Alternative 1 yields the lowest water surface elevation. Alternative 2 has a higher water surface elevation than effective and revised effective conditions because overtopping of the embankment does not occur as it does in the effective and revised effective conditions.
3.3.5 Hydraulic Capacity of Alternatives Dam 7 currently has the capacity to safely pass only 47% of the PMF. The existing minimum crest elevation of the dam embankment is 835.35 ft-msl. The capacity of the auxiliary spillway at the top of dam at elevation 835.35 ft-msl is approximately 9,575 cfs. Including the additional principal spillway at Dam 7 in revised effective conditions gives Dam 7 the capacity to safely pass 48%.
The three proposed alternatives can safely pass 100% of the PMF, as described in the previous section. The Alternative 1 auxiliary spillway is a 300-foot wide labyrinth weir with a crest elevation of 828.2 ft-msl. The 100% PMF elevation in the auxiliary spillway is 835.31 ft-msl just upstream of the labyrinth weir. The corresponding capacity of the auxiliary spillway at the 100% PMF elevation is 49,002 cfs and the depth of water above the weir crest of 7.11 ft.
The Alternative 2 auxiliary spillway is a 450-foot wide broad-crested weir with a crest elevation of 828.2 ft-msl. The 100% PMF elevation in the auxiliary spillway is 838.86 ft-msl just upstream of the broad-crested weir. The corresponding discharge capacity of the auxiliary spillway at the 100% PMF elevation is 46,993 cfs and the depth of water above the weir crest is 10.7 ft.

Dam 7 Modernization Alternatives Study Upper Brushy Creek WCID
20
The Alternative 3 auxiliary spillway is 450 feet wide, including a 200-foot wide labyrinth weir and 250-foot wide broad-crested weir with a crest elevation of 828.2 ft-msl. The 100% PMF elevation in the auxiliary spillway is 835.84 ft-msl just upstream of the structures. The corresponding individual discharge capacity of the labyrinth and broad-crested sections of the auxiliary spillway are 34,274 cfs and 15,007 cfs, respectively. The total discharge capacity of the auxiliary spillway at the 100% PMF elevation is 49,281 cfs and the depth of water above the weir crests is 7.6 ft.
3.3.6 Downstream Conveyance Dam 7’s auxiliary spillway is different than the District’s other dams since the spillway has a steep drop rather than a gradual slope. Previous floods have caused damage on the face of the hillside downstream of Dam 7’s auxiliary spillway crest. Spillways like Dam 7’s with large change in elevation or steep slopes typically include energy dissipation structures to minimize damage to the dam and discharge channel or receiving stream. Two types of downstream protection for the proposed auxiliary spillways were evaluated as part of this study.
A baffled apron was evaluated using United States Bureau of Reclamation (USBR) design criteria (Peterka, 1984). The baffled apron was sized for the half and full unit discharge and found to require approximately 4- to 8-foot tall baffles and up to 24-foot tall training walls. A typical section is shown in Figure 3-5.
Figure 3-5: Typical Baffled Apron
As an alternate to the baffle apron option, a stepped apron shown in Figure 3-6 was developed to provide a similar level of protection and an opportunity for a more natural look and space for the Regional Trail. The stepped apron includes a stilling basin based on USBR (George, 1978) design guidelines. Due to the natural feel of the trail area and presence of ledges and vertical drops, the stepped apron configuration is preferable as the downstream protection. The stilling basin is in
Training Wall
Baffle Blocks
Backfill for Trail

Dam 7 Modernization Alternatives Study Upper Brushy Creek WCID
21
alignment with the Regional Trail and provides an area for sacrificial vegetation and a gravel trail surface.
Figure 3-6: Stepped Apron
3.4 STABILITY ANALYSIS Stability analyses were conducted for the embankment, spillway structures and parapet wall (when present), for each alternative. The purpose of the preliminary stability analysis is to evaluate overall feasibility, approximate size, and preliminary factor of safety for each alternative.
3.4.1 Structural Design In Alternative 1, the labyrinth weir would be constructed on the limestone foundation within the existing auxiliary spillway. The labyrinth weir consists of a 2.5-foot thick reinforced concrete base slab with a shear key for additional sliding resistance. The labyrinth weir walls are 1,819 feet long, 9.2 feet high, and 1.5 feet thick. A unit width of the labyrinth weir, measured from centerline to centerline of one complete cycle, was evaluated for stability. Training walls are required on both sides of the labyrinth and stepped apron.
In Alternative 2, half of the broad-crested weir would be constructed into the existing embankment. The weir was determined to be a 2-foot thick slab within the embankment portion of the dam and a 1-foot thick slab within the auxiliary spillway. Training walls are required on both sides of the weir and stepped apron. A 3.5 feet tall parapet wall is required on the remaining embankment to prevent overtopping.
In Alternative 3, the labyrinth weir would be constructed in the embankment to the left of the existing auxiliary spillway, partially on rock and partially on clayey gravel. The labyrinth weir consists of a 2.5-foot thick reinforced concrete base slab and 1,167 feet long, 9.2 feet high by 1.67 feet thick crest walls. During preliminary stability it was determined that the existing embankment would not be suitable as a foundation. Therefore, Alternative 3 requires a drilled pier foundation supported by the rock foundation below. A unit width of the labyrinth weir, measured from centerline to centerline of one complete cycle,
Stilling Basin Backfill for Trail
Steps

Dam 7 Modernization Alternatives Study Upper Brushy Creek WCID
22
was evaluated for stability. Training walls are required between both structures and on the far ends of the spillway and aprons.
The required parapet wall and training and retaining wall heights were determined based on loading conditions during the PMF, which is considered an extreme event. For design, the walls were analyzed as a cantilever on a per foot basis. The loads were calculated using the hydrostatic pressure and appropriate soil loading. The thickness of the walls and reinforcement requirements were determined by maximum moment and shear demand.
3.4.2 Structural Stability Basic stability requirements for a gravity dam or other hydraulic structure dictate that that the structure must be stable against overturning and sliding while maintaining bearing pressures within allowable limits at the foundation.
At Dam 7, the proposed structures are typically dry and are only loaded during flood events. The structures were evaluated for the following loads: concrete self-weight, 100-year and PMF reservoir hydrostatic loading, uplift pressure along the base, and soil pressure. TCEQ provides guidelines for required safety factors for gravity dams and other hydraulic structures as shown in Table 3-13. The TCEQ guidelines are very similar to the United States Army Corps of Engineers (USACE) guidelines under EM-1110-2-2200. The TCEQ values were considered the governing rules for the preliminary design.
Table 3-13: TCEQ Stability Criteria (TCEQ, 2009)
Load Condition
Resultant Location at Base
Minimum Sliding Factor
of Safety
Foundation Bearing Pressure
Usual Between 1/3 and 2/3 of base length 2.0 Allowable
Unusual Between 1/4 and 3/4 of base length 1.7 Allowable
Extreme Within Base 1.3 1.33 x Allowable
Note: “Usual”, “Unusual”, and “Extreme” are TCEQ terminology for hydrostatic design load conditions.
Overturning Stability Analysis
The overturning stability calculations using the USACE gravity method are based on the idea that the structure acts as a rigid body assuming a uniform stress distribution on a potential sliding plane. An overturning analysis uses overturning and resisting moments from vertical and lateral forces summed about the downstream toe of the structure to determine the structure stability and stresses. Stability against overturning relies on the following:
The resisting moment being greater than the overturning moment (ratio of moments) The location of the resultant force being within the region of the base (location of resultant forces)

Dam 7 Modernization Alternatives Study Upper Brushy Creek WCID
23
The stresses imposed on the base of the concrete structure not exceeding specific values (allowable bearing pressures)
The ratio of moments compares the total resisting moment forces and the total overturning moment forces taken about the downstream toe of the structure. The term ratio of moments is used rather than the term factor of safety since most regulatory agencies do not specify a factor of safety for overturning, but instead focus on the location of the resultant within the base and bearing pressures. Once the foundation base bearing pressures are calculated, they are compared against acceptable values. When the base is not completely in compression, a cracked base (non-compression zone) assessment as denoted by the USACE is required to determine the length of the non-compressive zones and the resulting final uplift forces. Alternatives 1 and 3, as concrete structures, require an overturning analysis. The results of the analyses are shown below in Table 3-14. Alternative 2 does not require this type of evaluation.
Table 3-14: Overturning Analysis
Flood Event Option Sliding Plane
Crack Length
(ft)
Ratio of Moments
Resultant Location
100 Year Alternative 1 Base of Structure 0.0 1.9 Middle 1/3
PMF Alternative 1 Base of Structure 0.0 1.5 Middle 1/3
100 Year Alternative 3 Base of Structure 0.0 2.0 Middle 1/3
PMF Alternative 3 Base of Structure 0.0 1.6 Middle 1/3
Table 3-15: Bearing Pressure Analysis
Flood Event Option Foundation
Bearing Pressure
(ksf)
Allowable Bearing (Limestone)
(ksf) 100 Year Alternative 1 Base of Structure 0.3 40
PMF Alternative 1 Base of Structure 0.4 40
100 Year Alternative 3 Piers 20 40
PMF Alternative 3 Piers 24 40
Sliding Stability Analysis
The TCEQ criteria require a minimum sliding resistance for specific loading conditions. Sliding stability calculations using the limit equilibrium method are the basis for the analyses. For limit equilibrium, the shear force necessary to develop sliding equilibrium is determined for an assumed failure surface, and sliding will occur when the applied shear stress exceeds the available shear strength. The factor of safety (FS) is the ratio of the shear strength to the actual applied shear stress. The contact between the foundation and base of the structure was analyzed as the failure plane of the structure. The different assumed foundation parameters are shown in Table 3-16. Alternatives 1 and 3, as concrete structures, require sliding analyses. The results of the sliding stability analyses are shown in Table 3-17.

Dam 7 Modernization Alternatives Study Upper Brushy Creek WCID
24
Table 3-16: Foundation Parameters
Contact Zone Cohesion (psi) Friction Angle or
Coefficient of Internal Friction (degrees)
Concrete to Clayey Gravel 0 17
Concrete to Concrete (Pier) 60.3 0
Concrete to Sound Rock 0 32
Table 3-17: Sliding Stability
Flood Condition Option Sliding
Plane
Analysis Values Factor
of Safety Normal Force (kips)
Compressive Length (ft)
Net Driving Force (kips)
100 Year Alternative 1 Base of Structure 692 93 159 7.7
PMF Alternative 1 Base of Structure 708 93 386 3.2
100 Year Alternative 3 Base of Structure 1,029 83 102 5.0
PMF Alternative 3 Base of Structure 1,003 83 280 1.8
Stability Analysis Summary
Alternative 1 and Alternative 3 meet the design requirements for overturning and sliding during all operating conditions. Stability analysis calculations sheets are provided in Appendix B.
3.4.3 Slope Stability The stability of the existing, unmodified embankment slopes were evaluated using the parameters discussed above and a representative cross section. The analysis was performed for use in evaluating potential impacts associated with the proposed dam modification alternatives. A representative cross section was selected to correspond to the tallest portion of the embankment (approximately Station 14+00 to 23+00). Several loading conditions were analyzed, including:
Steady-state seepage at the principal spillway elevation of 805.0 ft-msl (represents the existing condition and all proposed alternatives at normal pool).
Steady-state seepage at the PMF elevation of 836.0 ft-msl (represents the existing condition and Alternatives 1 and 3).
Rapid drawdown from the PMF elevation of 836.0 to the auxiliary spillway elevation of 828.2 ft-msl (represents the existing condition and Alternatives 1 and 3).
Steady-state seepage at the PMF elevation of 839.0 ft-msl (represents the existing condition and Alternative 2).
Rapid drawdown from the PMF elevation of 839.0 to the auxiliary spillway elevation of 828.2 ft-msl (represents the existing condition and Alternative 2).

Dam 7 Modernization Alternatives Study Upper Brushy Creek WCID
25
The analysis of steady-state conditions used drained/effective shear strength parameters, while the analysis of rapid drawdown conditions used undrained/total shear strength parameters. Additional stress and loading conditions should be performed once the desired alternative is selected.
The phreatic water surface through the embankment will be curvilinear for steady-state conditions, such as for the normal pool level and possibly the auxiliary spillway level. However, flood stages above the auxiliary spillway will have a short duration (one to two days) and steady-state seepage conditions will not have enough time to develop. For this analysis the phreatic water surface through the embankment was evaluated using a simplified straight line from the pool level to the downstream embankment toe. In the case of the PMF, the line was extended downward from the top of the PMF elevation along a projected 1:1 line until it met the steady-state phreatic surface. Drawdown was from the PMF elevation to the elevation of the auxiliary spillway since the geometry of the dam will not allow rapid drawdown below that level.
The 2011 survey shows some variability in the slope angles at Dam 7. The downstream slope matches as-built drawings fairly well. The upstream slope has changed from original conditions due to the trail construction. The upstream slope is typically 2.5H:1V along the length of the dam, except for the portion just below the trail system which has a slope angle of 1.9H:1V. The slope stability model was built to account for the trail on the upstream slope, and matches the as-built drawings along the downstream slope. The computed slope stability safety factors for various PMF and normal pool loading conditions are presented in Table 3-18. Plates showing the slope profile and theoretical failure surface for each of the loading conditions are presented in Appendix B. The referenced minimum safety factors are based on those presented by USACE in their Slope Stability Engineering Manual (EM 1110-2-1901) and TCEQ in their Design and Construction Guidelines for Dams in Texas (RG-473).
Table 3-18: Calculated Factor of Safety for Slope Stability
Case Location and Pool/Loading Condition Computed Factor of
Safety
Minimum Factor of
Safety
Existing, Alt. 1 and
Alt. 3
Downstream Slope: Steady-state with Normal Pool at Principal Spillway, 805 ft-msl 1.8 ≥1.5
Downstream Slope: Steady-state with PMF at 836.0 1.4 ≥1.4
Upstream Slope: Rapid Drawdown from PMF to Auxiliary Spillway at 828.2 1.6 ≥1.2
Alt. 2
Downstream Slope: Steady-state with PMF at 839.0 1.3* ≥1.4
Upstream Slope: Rapid Drawdown from PMF to Auxiliary Spillway at 828.2 1.6 ≥1.2
* Below recommended minimum factor of safety
The results indicate that the existing embankment has an acceptable factor of safety for flood pools up to the crest of the existing embankment (El. 836.0 ft-msl). However, the computed factor of safety is

Dam 7 Modernization Alternatives Study Upper Brushy Creek WCID
26
below or just equals the minimum required factor of safety for PMF loading. This condition is relevant to Alternative 2 in which a parapet wall is required to prevent overtopping during a PMF event. Additional fill on the downstream toe equivalent to 2 feet of gravelly material is required to bring the embankment to acceptable safety factors. The material is required on the existing berm along the length of the downstream toe of the embankment.

Dam 7 Modernization Alternatives Study Upper Brushy Creek WCID
27
4.0 PRELIMINARY ENVIRONMENTAL ASSESSMENT
4.1 SITE EVALUATION
4.1.1 Threatened or Endangered Species According to the U.S. Fish and Wildlife Service (USFWS), eight species are listed as threatened or endangered (T/E) in Williamson County and are shown in Table 4-1.
Table 4-1: Federally Listed T/E Species for Williamson County (USFWS, 2013)
Common Name Scientific Name Federal Status
Georgetown salamander Eurycea naufragia Proposed Endangered
Jollyville Plateau salamander Eurycea tonkawae Proposed Endangered
Bone Cave harvestman Texella reyesi Endangered
Black-capped vireo Vireo atricapilla Endangered
Golden-cheeked warbler Dendroica chrysoparia Endangered
Whooping crane Grus americana Endangered
Coffin Cave mold beetle Batrisodes texanus Endangered
Tooth Cave ground beetle Rhadine persephone Endangered
Jollyville Plateau salamanders are entirely aquatic and inhabit aquatic habitats, such as springs and spring runs in the Edwards Aquifer. The salamander is proposed endangered and has proposed critical habitat areas throughout Williamson County designated by USFWS including a site near Dam 7 as shown in Figure 4-1. The salamanders have not been recorded to travel more than 164 feet from a spring opening on the surface and no more than 984 feet underground. From the project site, the nearest designated critical habitat boundary for the Jollyville Plateau Salamander is separated by approximately 1,770 feet on the surface and 786 feet below ground. In addition, the water sources at Dam 7 are not suitable for salamander survival. The water quality for their survival must be similar to natural aquifer conditions, with temperatures between 65.3 and 67.3 °F and dissolved oxygen concentrations between 5.6 and 7.1 mg L⁻¹. The lake, plunge pool, and downstream creek at Dam 7 have similar water quality as nearby Bull Creek. Water temperatures of Bull Creek fluctuate greatly between 42 and 91°F and have dissolved oxygen concentrations that range from 5.6 to 14.8 mg L⁻¹.
Therefore, the project is not anticipated to affect the salamander habitat. The project site is also downstream from the critical habitat; thus, any potential effect on the water quality of the Edwards Aquifer from the project would not be detrimental to the salamanders.

Dam 7 Modernization Alternatives Study Upper Brushy Creek WCID
28
Figure 4-1: Critical Habitat for the Jollyville Salamander
Endangered whooping cranes migrate through Texas and winter along the coast. Their preferred habitat includes coastal marshes, estuaries, inland marshes, lakes, and ponds. For feeding, they forage in brackish bays, marshes, and salt flats. It is possible that they would use the water sources around Dam 7 as a “rest stop” during their migration, but the dam modernization project is not likely to affect them.
The golden-cheeked warbler is listed as endangered and resides in habitats consisting mainly of dense, mature Ashe juniper mixed with various oak species. This woodland habitat grows on limestone hills, canyons, and adjacent canyons. Habitat suitable for the golden-cheeked warbler has not been observed within the project site.
Black-capped vireos are also listed as endangered. Their habitat preferences are young, semi-open stands of small trees and shrubs separated by open grasslands. This type of habitat has not been observed within the project site.
The Bone Cave harvestman is an eyeless spider that lives under large rocks in moist below-ground caves (karst features). Bee Creek Cave harvestman spiders and Coffin Cave mold beetles are both found in limestone caves with high humidity. Tooth Cave spiders thrive on the walls and ceilings of caves. The Tooth Cave ground beetle prefers deep un-compacted silt in caves. Tooth Cave pseudoscorpions,

Dam 7 Modernization Alternatives Study Upper Brushy Creek WCID
29
Warton Cave meshweavers, and Krestschmarr Cave mold beetles are also all karst dwelling species. No karst features have been identified in the project area.
4.1.2 Archaeology The proposed modifications to Dam 7 are within the existing footprint of previously disturbed area from the 1965 construction and as determined during the assessment for the 2005 flood monitoring installation. The Texas Historical Commission (THC) granted permission of the prior project for dam upgrades without a cultural resources survey. Therefore, the proposed improvements are not expected to affect cultural resources.
4.1.3 Karst A karst survey was performed by PBS&J in 2005 for Dam 7 covering the area within a 100-foot buffer adjacent to the toe dam and the auxiliary spillway. The survey was performed to detect karst features of potentially suitable habitat for threatened or endangered species. There were no karst features identified in the project area. This data is still relevant and additional karst surveys are not necessary.
4.2 PERMITTING
4.2.1 Nationwide Permit 3 The purpose of the Nationwide Permit Program is to streamline the USACE Section 404 permit evaluation and approval process for certain types of activities that have minimal impacts to the aquatic environment. Nationwide Permit (NWP) 3 - Maintenance authorizes the repair, rehabilitation, or replacement of any previously authorized, currently serviceable structure provided that the structure or fill is not to be put to uses differing from those specified in the most recently authorized modification. Minor deviations in the structure’s configuration of filled area due to current construction codes or safety standards that are necessary to make the repair, rehabilitation, or replacement are also authorized. A pre-construction notice (PCN) to the USACE is not necessary for the proposed Dam 7 modifications, as they are authorized by NWP 3. The TCEQ 401 Water Quality Certification Conditions for Nationwide Permits best management practices (BMPs) for erosion and sedimentation control must be followed in order to use NWP 3.
The alternatives analysis assumes an additional principal spillway is included at the dam. The spillway outfall will be designed during the final design phase, and any minor modification of the plunge pool is within the scope of NWP 3. Shown in Figure 4-2, the ordinary high water mark (OHWM) for the reservoir is displayed at 806 feet, with the topographic line highlighted in red. The plunge pool ordinary high water mark is 780 feet. The auxiliary spillway is above the OHWM.

Dam 7 Modernization Alternatives Study Upper Brushy Creek WCID
30
Figure 4-2: Topography of Dam 7 with the OHWM highlighted in red
Downslope of the proposed location of the dam modification is a seep coming from an unknown source. The seep is producing a small stream, which is creating a wetland as shown in Figure 4-3. If the seep is determined to be caused by a leak in the dam or the nearby sewer line, then the wetland is not considered jurisdictional. However, if the seep is determined to be a spring connecting to the Edwards Aquifer, the modernization project may require an additional 404 permit. Jurisdiction of the wetland can be determined by wetland delineation.
Figure 4-3: Wetlands area created by seep downstream of the auxiliary spillway

Dam 7 Modernization Alternatives Study Upper Brushy Creek WCID
31
4.2.2 City of Austin The site is located in the City of Austin Extraterritorial Jurisdiction (ETJ) which is unincorporated land within 5 miles of the City limits and regulated by the City. The City of Austin Environmental Criteria Manual, Section 1.3.0 Environmental Assessment, outlines and describes development requirements and critical environment features (CEFs) to be identified and possibly protected as part of water quality management. Springs are mentioned as a CEF. During the final design phase, if the seep is determined to be a spring, the area downslope of the final design auxiliary spillway can be evaluated for any feature that might require an environmental assessment and CEF worksheet. Coordination with the City of Austin would be beneficial to meet their specific regulations.
The proposed excavation and concrete fill for all proposed auxiliary spillway alternatives would involve the removal of trees in the auxiliary spillway area. According to the City of Austin tree ordinance, a tree is protected once the trunk reaches 8 inches in diameter measured 4.5 feet above ground. A tree with a diameter of at least 24 inches is classified as a heritage tree. In the case that protected or heritage trees exist in the project area and need removal, a tree removal permit will be required. Following the permit, mitigation measures will need to be negotiated. Baker-Aicklen performed a tree survey for the area of concern in March 2011; trees found with a diameter larger than 8 inches within the project work zone are listed in Table 4-2.
Table 4-2: Protected trees within the proposed work zone
Common Name Scientific Name Diameter (inches)
Sugarberry Celtis laevigata 8
Sugarberry Celtis laevigata 11
Sugarberry Celtis laevigata 12
Sugarberry Celtis laevigata 12
Sugarberry Celtis laevigata 11
Sugarberry Celtis laevigata 10
Sugarberry Celtis laevigata 9
Sugarberry Celtis laevigata 9
4.2.3 Stormwater and Water Quality
Edwards Aquifer Protection
Dam 7 is located within the Edwards Aquifer Contributing Zone, the area where runoff from precipitation flows to the recharge zone of the Edwards Aquifer. Projects that disturb more than 5 acres within the Edwards Aquifer Contributing Zone must have an approved Contributing Zone Plan (CZP) or a Contributing Zone Exception from TCEQ. Alternative 1 will disturb approximately 6.7 acres. It is in the opinion of FNI staff that we apply for a TCEQ Contributing Zone Exception, since the proposed activities should not adversely impact the groundwater recharge. Alternatives No. 2 and No. 3 will disturb approximately 2.8 acres and 4.9 acres, respectively, therefore not requiring a CZP or exception.

Dam 7 Modernization Alternatives Study Upper Brushy Creek WCID
32
Construction General Permit
A Texas Pollutant Discharge Elimination System (TPDES) General Permit for Construction Activity (Permit No. TXR150000) is required for projects or activities that disturb equal to or greater than one acre.
For projects with disturbances equal to or greater than one acre, but less than five acres, it is necessary to have a Storm Water Pollution Prevention Plan (SW3P) in place at least 48 hours prior to and during construction of the proposed project. Submitting a Notice of Intent (NOI) to TCEQ is not required. A copy of the Construction Site Notice must be submitted by the construction site operator to the operator (City, County, etc.) of the storm sewer system that receives storm water runoff form the construction site. This will be necessary for Alternatives No. 2 and No. 3 that will both disturb more than one acre, but less than five acres.
For projects with disturbances equal to or greater than five acres it is necessary to have a SW3P in place at least 48 hours prior to and during construction of the proposed project and filing a Notice of Intent with the TCEQ is required. Alternative No. 1 will be disturbing more than five acres. A Notice of Termination (NOT) must be filed once the site has reached final stabilization. A copy of the Notice of Intent must be submitted by the construction site operator to the operator (City, County, etc.) of the storm sewer system that receives storm water runoff form the construction site.
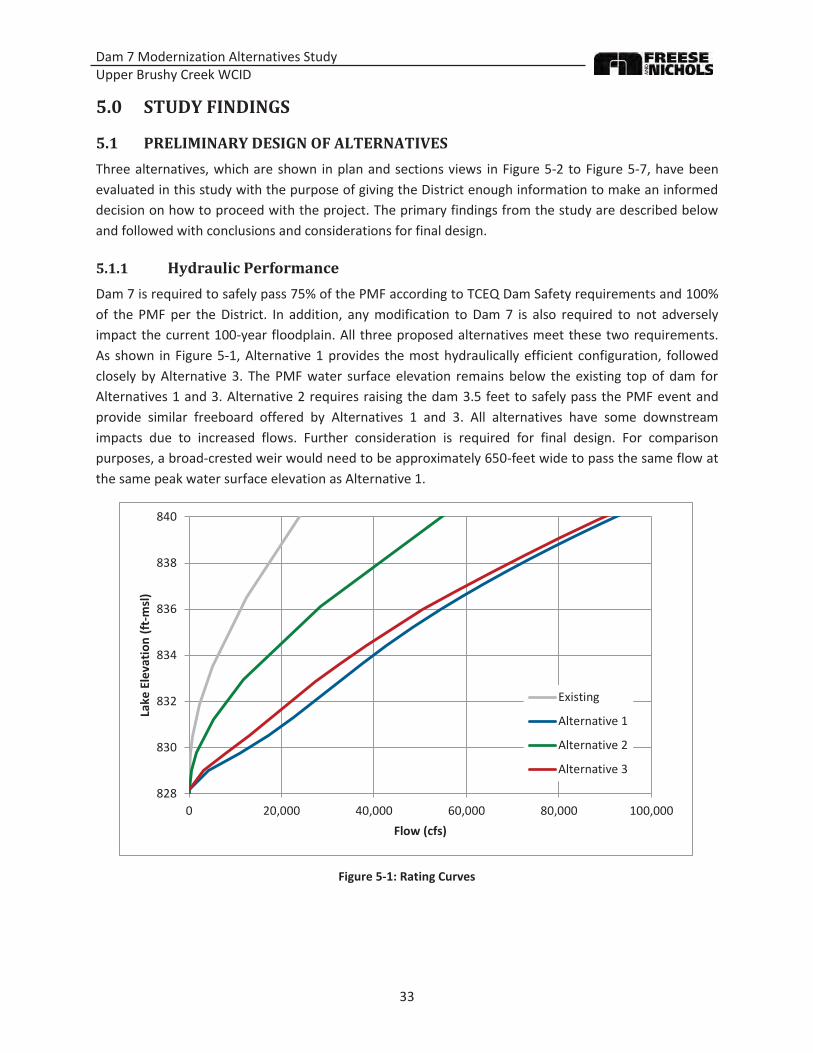
Dam 7 Modernization Alternatives Study Upper Brushy Creek WCID
33
5.0 STUDY FINDINGS
5.1 PRELIMINARY DESIGN OF ALTERNATIVES Three alternatives, which are shown in plan and sections views in Figure 5-2 to Figure 5-7, have been evaluated in this study with the purpose of giving the District enough information to make an informed decision on how to proceed with the project. The primary findings from the study are described below and followed with conclusions and considerations for final design.
5.1.1 Hydraulic Performance Dam 7 is required to safely pass 75% of the PMF according to TCEQ Dam Safety requirements and 100% of the PMF per the District. In addition, any modification to Dam 7 is also required to not adversely impact the current 100-year floodplain. All three proposed alternatives meet these two requirements. As shown in Figure 5-1, Alternative 1 provides the most hydraulically efficient configuration, followed closely by Alternative 3. The PMF water surface elevation remains below the existing top of dam for Alternatives 1 and 3. Alternative 2 requires raising the dam 3.5 feet to safely pass the PMF event and provide similar freeboard offered by Alternatives 1 and 3. All alternatives have some downstream impacts due to increased flows. Further consideration is required for final design. For comparison purposes, a broad-crested weir would need to be approximately 650-feet wide to pass the same flow at the same peak water surface elevation as Alternative 1.
Figure 5-1: Rating Curves
828
830
832
834
836
838
840
0 20,000 40,000 60,000 80,000 100,000
Lake
Ele
vatio
n (ft
-msl
)
Flow (cfs)
Existing
Alternative 1
Alternative 2
Alternative 3


Dam 7 Modernization Alternatives Study Upper Brushy Creek WCID
40
Energy dissipation is required for all alternatives to adequately convey flood water from the spillway crest to the downstream channel. A stepped apron configuration was considered hydraulically feasible for all alternatives. The stepped apron fits within a reasonable footprint and provides protection from flood flows when the auxiliary spillway is engaged. Alternative 1 presents the smallest footprint for the stepped spillway at 300 feet wide while Alternative 2 and 3 provide a similar level of hydraulic protection but require a wider area at 450 feet. Alternative 1 also has the smallest drop in elevation from the weir slab to the downstream apron, thus facilitating downstream conveyance. Alternative 2 presents the largest drop and likely the highest downstream velocities while Alternative 3 presents a combination in hydraulic configurations.
5.1.2 Stability Considerations Alternatives 1 and 3 add a labyrinth weir to the dam. A labyrinth weir is a significant concrete structure subject to loads such as headwater pressure, uplift forces, impact loading, and tailwater pressure. Therefore, consideration must be given to the interaction of the weir and its foundation. Alternative 1 keeps the weir within the footprint of the existing spillway and on relatively sound rock. Therefore, no significant foundation improvement is expected to achieve required safety factors. Alternative 3, however, is built on embankment soils, thus requiring significant improvements consisting of piers and sheetpiling to meet required safety factors. Alternative 2 does not experience the same loads, so its design is less sensitive to foundation conditions and no special foundation improvements are required when bearing on embankment soils.
The existing embankment meets appropriate stability safety factors if headwater levels remain below the crest of the dam. Therefore, no stability improvements to the embankment are required for Alternatives 1 and 3. Alternative 2, however, requires a 3.5-foot tall parapet wall on the embankment crest to retain PMF flood levels. The loading associated with this configuration brings the safety factors below acceptable levels. Therefore, additional gravely fill material is required on the existing berm along the toe of the downstream slope to improve safety factors.
The work to construct Alternative 1 occurs on the existing auxiliary spillway with limited impact to the embankment. In the event of a flood during construction, flood water will likely impact the construction effort but not the stability of the dam. Alternative 2 and 3, because of their configuration over the embankment, provide significant risk during construction in the event of a flood.
5.1.3 Regional Trail and Park Features All three alternatives significantly impact the appearance of the dam. Alternative 1 alters the dam embankment and downstream areas the least, but significantly changes upstream approach conditions of the auxiliary spillway. Alternative 1 has the least visible impact to adjacent properties due to its location. Alternatives 2 and 3 have a significant effect on the appearance of the dam embankment and are more visible due to their extent and placement on the dam. Alternative 2 has the added effect of having a parapet wall on the crest of the dam and a stability berm along the downstream slope toe.
All three proposed alternatives provide for reconstruction of the existing regional trail to accommodate spillway improvements. Trail length after reconstruction is similar for all three alternatives, providing a

Dam 7 Modernization Alternatives Study Upper Brushy Creek WCID
41
maximum trail grade of 5% to meet ADA requirements. Due to the difference in elevation between bottom-of-spillway trail to near-top-of-dam trail and land area limitationa, all three alternatives utilize switchbacks in the trail layout. Proposed trail surface material is either gravel or concrete depending on location. Since gravel is the trail surface preferred by most trail users, it will be used as much as possible on level ground and on slopes under 4%.
The portion of the trail in the stilling basin would be similar for all three alternatives and is shown in Figure 5-8. The portion of the trail in the stilling basin would be 10- to 15-foot wide gravel layer over soil backfill. The trail would be placed along the downstream edge of the stilling basin. Plantings of native and adapted small trees and understory plants would be placed between the trail and the upstream edge of the stilling basin. These plantings would yield a more natural look and feel through the spillway area and provide some continuity with the existing trailside vegetation to the east of the spillway. The gravel trail surface, soil backfill, and plantings within the stilling basin would be considered ‘sacrificial’ in the event of flood conditions and require repair or replacement.
Figure 5-8: Downstream Basin and Trail Rendering
The proposed trail for Alternatives 1 and 3, shown in Figures 5-2 and 5-6, is located just to the west of the proposed labyrinth weir left training wall and in the stilling basin at the base of the spillway chute. Since the labyrinth weir is positioned further to the west in Alternative 3, the proposed trail configuration is also further to the west. The portion of the trail outside of the left training wall would be a 10-foot-width concrete surface with grassy slopes beside the trail. Side slope grades would be the same as the dam, 2.5H:1V (or less pending final design and achievable land area). This trail segment would climb from below-spillway trail elevation 798 ft-msl to top-of-dam elevation 836 ft-msl, cross the dam access road, and then descend to the existing trail elevation of 828 along the face of dam.
The proposed trail in Alternative 2, shown in Figures 5-4, utilizes the area within the spillway chute to make the climb from the below-spillway trail elevation of 798 ft-msl to the existing trail elevation of 828 ft-msl along the downstream face of dam. It was not cost effective to utilize a similar trail layout as the other alternatives due to having to cross the top of the parapet wall and training walls. Since the trail is within the spillway, the trail surface would be concrete and part of the concrete spillway slab. Two switchbacks occur with this layout, one mid-way down the spillway and one at the transition to the stilling basin. A breakaway safety rail along all of the downhill edges and some of the uphill edges of the

Dam 7 Modernization Alternatives Study Upper Brushy Creek WCID
42
trail would be recommended due to the hard adjacent surfaces and vertical drops. This portion of the trail would have a more ‘engineered’ and ‘utilitarian’ look and feel while likely increasing spillway and trail construction costs and liability issues.
Figure 5-9: Sketch of Alternative 2 Ramp with Vertical Sides
5.1.4 Upstream Access and Maintenance The access road in the auxiliary spillway is currently at 829.0 ft-msl and is impacted by 100-yr flood events or greater. Alternative 2 restores the crest elevation to the as-built elevation of 828.2 ft-msl and keeps the frequency of inundation to events around the 100-yr event. The frequency of inundation is increased to 10- to 25-yr flood events for Alternatives 1 and 3 because of the required upstream excavation with a final grade of 819 ft-msl. Therefore, the auxiliary spillway will be accessible much less frequently with Alternatives 1 and 3 than it has historically been.
5.1.5 Permitting Construction for the three alternatives is located above the ordinary high water mark and within the footprint of previously disturbed areas. The work is for a previously authorized and currently serviceable structure, so Nationwide Permit (NWP) 3 without a pre-construction notification is an appropriate permitting strategy for the improvements to Dam 7. This determination assumes that the additional principal spillway is included within the project scope. This strategy could change if the seep near the right abutment is determined to be a spring and not a leak in the dam. Considering the seep location, Alternative 1 is the least disturbing and least environmentally sensitive since it does not extend the downstream protection to the seep. Alternatives 2 and 3 are a bigger challenge due to the extent of the work area and excavation around the seep location.

Dam 7 Modernization Alternatives Study Upper Brushy Creek WCID
43
5.1.6 Total Project Cost and Overall Project Schedule Opinions of probable construction cost were developed for all three alternatives and are summarized in Table 5-1 and included in Appendix C. The cost opinions are based on a conceptual design level and take into consideration the main work items. Alternative 2 is the least expensive alternative identified as part of this study at $10,020,000. Alternative 3 is the most expensive at $10,870,000, and Alternative 3 is slightly less at an estimated cost of $10,690,000.
Table 5-1: Opinion of Probable Construction Costs
Item Description ALT. 1 ALT. 2 ALT. 3
Mobilization and Demobilization $ 500,000 $ 500,000 $ 500,000
Temp. Erosion and Sediment Control $ 80,000 $ 60,000 $ 60,000
Site Preparation and Restoration $ 120,000 $ 100,000 $ 100,000
Care of Water $ 200,000 $ 500,000 $ 600,000
Labyrinth Weir $ 4,617,000 - $ 2,785,000
Broad-Crested Weir - $ 1,086,000 $ 220,000
Parapet Wall - $ 1,177,000 -
Downstream Spillway $ 2,656,000 $ 4,110,000 $ 4,015,000
Trail Relocation $ 197,000 $ 273,000 $ 226,000
Maintenance Road Access Ramp $ 8,000 $ 10,000 $ 18,000
Regrade Top of Dam and Repair Flex Base $ 34,000 $ 32,000 $ 32,000
Additional Principal Spillway $ 500,000 $ 500,000 $ 500,000
Subtotal $ 8,912,000 $ 8,348,000 $ 9,056,000
Total with 20% contingency $ 10,690,000 $ 10,020,000 $ 10,870,000
The engineering effort for the design and construction oversight for all the alternatives to improve Dam 7 is significant. Engineering cost of 15% of total construction cost was considered as a reasonable baseline for this type of dam rehabilitation work and the value was adjusted for each alternative based on the following considerations:
Complexity of the design Modeling requirements Site location Anticipated project duration (discussed in the following section)
The engineering effort and total project costs are presented in Table 5-2.
Table 5-2: Total Project Costs
Description ALT. 1 ALT. 2 ALT. 3
Construction Cost $ 10,690,000 $ 10,020,000 $ 10,870,000
Engineering (Design and Construction Oversight) $ 1,650,000 $ 1,400,000 $ 1,750,000
Total Project Cost $ 12,340,000 $ 11,420,000 $ 12,620,000
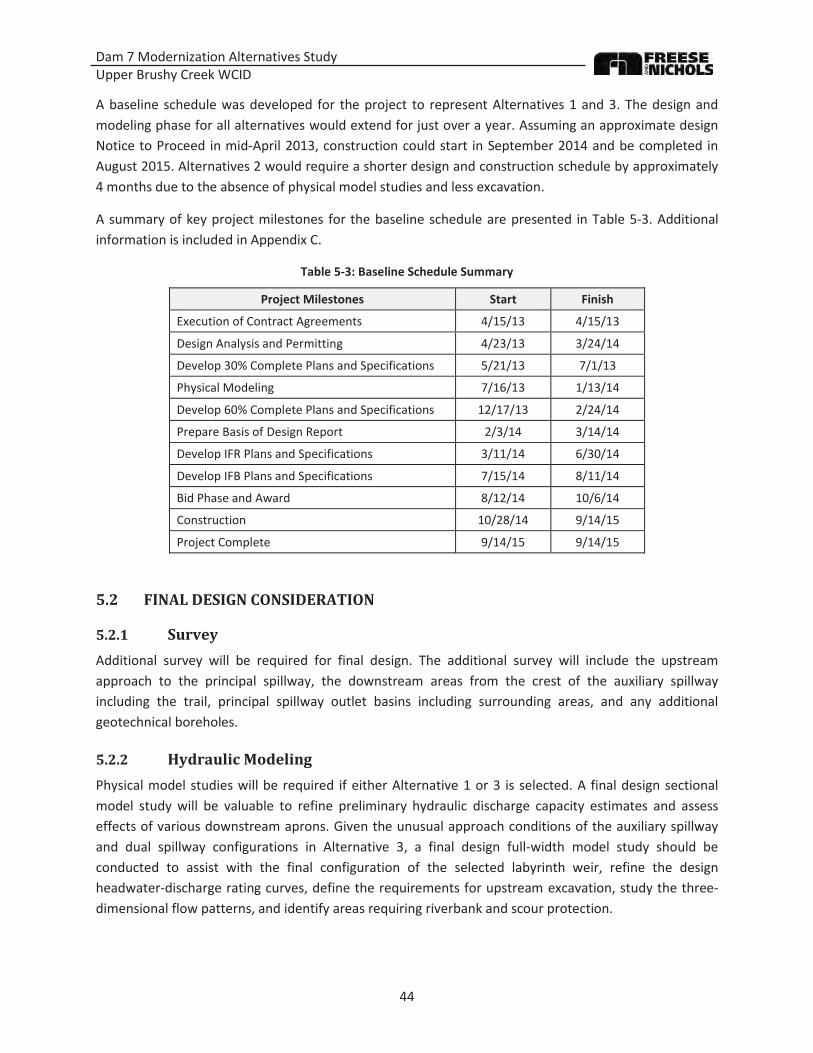
Dam 7 Modernization Alternatives Study Upper Brushy Creek WCID
44
A baseline schedule was developed for the project to represent Alternatives 1 and 3. The design and modeling phase for all alternatives would extend for just over a year. Assuming an approximate design Notice to Proceed in mid-April 2013, construction could start in September 2014 and be completed in August 2015. Alternatives 2 would require a shorter design and construction schedule by approximately 4 months due to the absence of physical model studies and less excavation.
A summary of key project milestones for the baseline schedule are presented in Table 5-3. Additional information is included in Appendix C.
Table 5-3: Baseline Schedule Summary
Project Milestones Start Finish
Execution of Contract Agreements 4/15/13 4/15/13
Design Analysis and Permitting 4/23/13 3/24/14
Develop 30% Complete Plans and Specifications 5/21/13 7/1/13
Physical Modeling 7/16/13 1/13/14
Develop 60% Complete Plans and Specifications 12/17/13 2/24/14
Prepare Basis of Design Report 2/3/14 3/14/14
Develop IFR Plans and Specifications 3/11/14 6/30/14
Develop IFB Plans and Specifications 7/15/14 8/11/14
Bid Phase and Award 8/12/14 10/6/14
Construction 10/28/14 9/14/15
Project Complete 9/14/15 9/14/15
5.2 FINAL DESIGN CONSIDERATION
5.2.1 Survey Additional survey will be required for final design. The additional survey will include the upstream approach to the principal spillway, the downstream areas from the crest of the auxiliary spillway including the trail, principal spillway outlet basins including surrounding areas, and any additional geotechnical boreholes.
5.2.2 Hydraulic Modeling Physical model studies will be required if either Alternative 1 or 3 is selected. A final design sectional model study will be valuable to refine preliminary hydraulic discharge capacity estimates and assess effects of various downstream aprons. Given the unusual approach conditions of the auxiliary spillway and dual spillway configurations in Alternative 3, a final design full-width model study should be conducted to assist with the final configuration of the selected labyrinth weir, refine the design headwater-discharge rating curves, define the requirements for upstream excavation, study the three-dimensional flow patterns, and identify areas requiring riverbank and scour protection.

Dam 7 Modernization Alternatives Study Upper Brushy Creek WCID
45
Computational fluid dynamic (CFD) models (two-dimensional and three-dimensional) will be required to properly assess the hydraulic performance of the broad-crested weir and downstream aprons. These models should provide reasonable results in a cost effective manner. These models will help refine the design headwater-discharge rating curves, assess the three-dimensional flow patterns, and identify areas requiring riverbank and scour protection.
5.2.3 Geotechnical Analysis The analysis results presented in this report are generalized in nature to allow for a comparison of the various alternatives. Additional geotechnical analysis is recommended once the final design alternative is selected. In particular, the 2010/2011 geotechnical evaluation of the existing dam should be completed, and some additional field and laboratory work will be required. The scope of the additional field and lab work will depend on which alternative is selected.
It should also be noted that shallow slides are a common occurrence on embankments in Texas due to the presence of fat clays. These slides are associated with weathering of the clays from cycles of desiccation and heavy rainfalls. When these types of slides occur they generally do not represent a dam safety issue if they are identified and repaired in a timely manner. Shallow slides were not analyzed for this initial analysis, but shallow surface failures are possible at this dam site and should be evaluated in final design.
Additional borings will be required in the upstream areas of the auxiliary spillway and embankment if Alternative 1 or 3 is selected to provide adequate coverage for the foundation of the spillway. Borings should be located to sample the limestone in this area and to determine the approximate location of the original river channel scarp. Additional borings are also required for all alternatives to assess the support characteristics for the downstream apron.
Additional fieldwork is also recommended to study the potential source of the seep that is present at the downstream toe of the right end of the dam. Investigations should including soil borings in combination with test pits in the immediate area of the seep to better understand the subsurface conditions, along with installing a monitoring weir to quantify the seepage rate and identify changes in the seepage rate and collecting material in the flow (if present). More sophisticated methods may be employed, such as geophysical surveying, to increase the confidence in accurately identifying the source of the seep. Based on the results of the investigations, safety measures will be developed to address the seep. Any treatment of the seep will require close coordination with environmental scientists to better understand the significance of the seep with respect to permitting requirements.
5.2.4 Aesthetics and Miscellaneous Improvements Several aesthetic improvements are summarized for possible inclusion to the proposed improvements to Dam 7. The enhancements apply to all three alternatives and can be adjusted for applicable quantity and location. Each of these potential enhancements has a positive impact on the visual character of the project. The aesthetic treatments are presented for review and consideration. Further analysis of applicability, extent, and cost of each potential aesthetic improvement should be evaluated and determined in final design of the selected alternative.

Dam 7 Modernization Alternatives Study Upper Brushy Creek WCID
46
Auxiliary Spillway Stepped Apron
Concrete Wall Finish Formliner texture of visible concrete surfaces of weir and spillway walls; recommended for vertical/near vertical surfaces; less expensive than acid wash or blast-finish treatment.
Concrete Slab Finish Salted texture of visible surfaces of spillway slabs; recommended for
horizontal/near horizontal surfaces Concrete Color Finish Surface color stain of visible surfaces of weir and spillway walls and
spillway slabs or integral color throughout visible concrete structures; provides enhancement of the 'engineered' look and feel' of natural gray concrete; surface color usually less expensive than integral color
Concrete Surface Shape Broken plane surfaces of training walls; applies a slight and irregular
‘zig-zag’ to horizontal alignment of walls to add visual interest and reduce the 'engineered look and feel’ of continuous lines, shapes, and dimensions; recommended for vertical surfaces of spillway walls, training walls, and weir walls to extent allowed by hydraulics and cost (shown in Figure 5-10)
Figure 5-10: Sketch of 7-foot Vertical Wall with Broken Plane Surfaces
Auxiliary Spillway Stilling Basin
Backfill / Trail / Plantings Placement of soil, gravel trail, and small tree/understory plantings within stilling basin at base of spillway; provides visual interest and continuity of ‘natural feel and look’ trail through the spillway area; repair/replace 'sacrificial' soil, gravel, and plants after major flood event

Dam 7 Modernization Alternatives Study Upper Brushy Creek WCID
47
Trail Ramp
Trail Layout Gently curving alignment of relocated trail and switchbacks; provides visual interest and more ‘natural feel and look’ of trail as it traverses the vertical elevation difference between bottom of spillway and top of dam; eliminates the more 'engineered look' and monotony of straight alignments
Concrete Trail Finish Salted texture of concrete trail paving; applies texture and visual
interest to concrete surface; recommended for all concrete trail segments
Concrete Color Finish Surface color stain of concrete trail paving; applies color and visual
interest to concrete surface

Dam 7 Modernization Alternatives Study Upper Brushy Creek WCID
48
6.0 RECOMMENDATION This study evaluated many facets of the alternative designs. All three alternatives meet the design goal of safely passing 100% of the PMF. We developed factors to evaluate the alternatives based on our understanding of the District’s other project goals. A summary of the factors used to make our recommendation and attributes of each alternative is presented in Table 6-1. The factors are listed in our opinion of the order of importance for the project.
Table 6-1: Attributes of Alternatives
Factors Alternatives
1 2 3 Risk to Dam During Construction > 500-Year protection ≈ 100-Year protection 10 to 25-Year protection
Total Project Cost $ 12,320,000 $ 11,340,000 $ 12,630,000
Visual Impact to Adjacent Properties
Labyrinth visible to some park users 3.5-foot wall visible to all Labyrinth visible to many
Trail Experience Curvy ramp with natural vegetation
One long switchback on concrete
Curvy ramp with natural vegetation
Public Access to Structure Minimal public access Public access to entire stepped apron
Public access to top of stepped apron
Hydraulic Capacity PMF water surface elevation is 835.3 ft-msl
PMF water surface elevation is 838.9 ft-msl
PMF water surface elevation is 835.8 ft-msl
Downstream Maintenance 300-foot repair area required
450-foot wide repair area required
450-foot wide repair area required
Alternative 1 provides a balanced combination of attributes and the most advantages for the factors considered. Alternative 1 provides the following advantages:
Less risk during construction due to minimal exposure of the embankment during and after excavation. Most hydraulically efficient and therefore the lowest water surface elevation at PMF. Less visible than the other options due to the location in the existing auxiliary spillway. Best trail user experience due to the shorter extent of the downstream improvements and the trail ramp being located outside of the concrete structure. Least public access to the structure due to the 7-foot wall in the stepped spillway and the training walls. Smallest downstream area that will require maintenance after the spillway engages
Based on the information presented above, it is our opinion that Alternative 1 is the preferred design option even though it is not the least expensive alternative. We hope this study provides the District with sufficient information to make an informed decision for a design that best supports the District’s vision.

Dam 7 Modernization Alternatives Study Upper Brushy Creek WCID
49
7.0 REFERENCES City of Austin, Texas (2012). Environmental Criteria Manual. Section 1.3.0 Environmental Assessment.
George, R. L., (1978). Low Froude Number Stilling Basin Design, Bureau of Reclamation, Hydraulics Laboratory Report, REC-ERC-78-8.
McCook, Danny, Personal correspondence to Marc Miller.
Peterka, A.J., 1984, Engineering Monography 25 - Hydraulic Design of Stilling Basins and Energy Dissipators, Bureau of Reclamation.
SCS (1964). Supplemental Engineering Report, dated July 21, 1964.
Schnabel (2013). Lake Townsend Dam - Dams and Levees Portfolio. www.schnabel-eng.com. Accessed March 4, 2013.
TCEQ (2009). Design and Construction Guidelines for Dams in Texas (RG-473).
Tullis, B. and Crookston, B.M. (2008). Lake Townsend Dam Spillway Hydraulic Model Study Report. Utah Water Research Laboratory, Logan, Utah.
USACE (2003). Engineering and Design - Slope Stability (EM 1110-2-1902).
USFWS (2012). Endangered and Threatened Wildlife and Plants; Endangered Status for Four Central Texas Salamanders and Designation of Critical Habitat. Federal Register: Proposed Rules. Vol. 77, No. 163, 50809.
USFWS (2013). Federally listed threatened and endangered species of Williamson County, Texas. www.fws.gov/southwest/es/ES_ListSpecies.cfm. Accessed February 12, 2013.
Vasquez, V., Boyd, M., Wolfhope, J., and Garret, R. (2007). “A labyrinth rises in the heart of Texas.” Proceedings of the 28th Annual USSD Conference. 813-826.
Weeks, A.W. (1945). Balcones, Luling, and Mexia Fault Zones in Texas. American Association of Petroleum Geologists Bulletin, 29: 1733-1737.