Embed Size (px)
DESCRIPTION
Dalhousie University Campus Master Plan Appendix
Citation preview


TABLE OF CONTENT
A. CAMPUS SYSTEMS
A.1 TRANSPORTATION DEMAND MANAGEMENT (TDM)
A.2 CAMPUS DEVELOPMENT CAPACITY
A.3 UTILITIES & SERVICES
A.4 ENERGY
A.5 SOLAR INVENTORY
B. FACILITIES & SPACE
B.1 LEARNING COMMONS HUBS
B.2 ATHLETICS & RECREATION PROGRAM
B.3 ACCESSIBILITY
B.4 SPACE FORECAST ANALYSIS
DA
LHO
US
IE C
AM
PU
S M
AS
TER
PLA
N
FRA
ME
WO
RK
PLA
N


APPENDIX A.1
TRANSPORTATION DEMAND MANAGEMENT (TDM)A.1
DA
LHO
US
IE C
AM
PU
S M
AS
TER
PLA
N
FRA
ME
WO
RK
PLA
N


A.1.1 JULY 2010
3-PART PHASE TDM STRATEGYTDM is achieved in stages gradually over time as travel needs and habits shift due to a variety of factors such as changes in travel options and habits, costs and public policy. The 3-part Dalhousie strategy focuses on
1. Promoting Improved Transit and Alternative Transportation travel modes, aimed at shifting the commuting modal split away from dependency on the private automobile and reducing demand for campus parking;
2. Increasing Student and Staff Housing choices, both on campus and within surrounding neighbourhoods, within walking and convenient transit travel, similarly aimed at reducing automobile trips;
3. Rationalizing Campus Parking facilities, aimed at concentrating and rationalizing campus parking locations to reduce needless searching, adjusting supply to meet changes in both Dalhousie and public demand over time, and adjusting parking rates over time to more accurately match costs.
SUCCESS FACTORSTypically, universities successful at achieving TDM programs tend to rely on certain key factors such as:
• effective program administration reporting to the executive that is then fully supported by that executive,
• the University’s public commitment to the program’s principles and phased targets,
• collaboration and support of municipal agencies and politicians, • effective communications with the communities affected by the programs and
changes (staff, students, public, neighbours and the general public) to ensure their support,
• public pride in the program’s achievements at each step over time.
PROGRAM ADMINISTRATION• Establish a Dalhousie University organization typically called a “Transportation
Management Association (TMA)” to promote TDM initiatives, similar for example, to the McMaster University All-modes Commuting & Transportation (ACT) program created in 2002;
• Assign the administrative responsibility for undertaking the TDM program to the Director of its Sustainability Of!ce;
• Attempt to de!ne a TDM mandate and target area broader than the limits of the University, to affect the surrounding community and include participation of neighbouring institutions and private sector organizations such as the hospitals, St. Mary’s University, school and neighbourhood organizations and the business associations, offering the University as a central resource for program planning and development; uniform TDM policies and goals should be established across the organizations;
• A key initiative critical to success will be to establish a TDM Program Steering Committee chaired by the Program Director to assist in establishing and meeting practical phased targets over time and report to the University Executive. Essential to the University, this Committee should include board members and executives responsible for university !nance, facilities management, student services and human resource affairs, as well as appropriate HRM and Metro Transit of!cials and HRM councillors, and also to include representatives of other participating organizations;
• Dedicate a portion of parking revenues to help off-set the costs of implementing the above programs.
GUIDELINES FOR IMPLEMENTINGTHE MULTI-YEAR TDM PROGRAM
DALHOUSIE UNIVERSITY FRAMEWORK PLANAPPENDIX A.1 TRANSPORTATION DEMAND MANAGEMENT (TDM)

A.1.2IBI GROUP |
APPENDIX A.1 TRANSPORTATION DEMAND MANAGEMENT (TDM)
DA
LHO
US
IE C
AM
PU
S M
AS
TER
PLA
N
FRA
ME
WO
RK
PLA
N
PROGRAM INITIATIVES AND MILESTONE TARGETS 1. Transit and Alternative Transportation
• Actively lobby for enhanced bus service and extended hours in collaboration with the community (revised plans are already underway to increase bus service on Spring Garden/Coburg, Robbie and Summer streets); focus on destinations which serve particularly high volumes of staff and students and the visiting public, such as Dalplex, Learning Commons Hubs, Arts Centre and other assembly spaces, Dental School public clinics, and the proposed conference centre at Sexton;
• Until adequate public bus service is provided along the University Avenue/Morris corridor connecting the campuses, Dalhousie should operate a local shuttle bus, jointly with the hospitals and perhaps other institutions in the area if possible;
• Improve the SE corner of LeMarchant and University Ave as a Transit Terminus (e.g. widened bus lay-by, landscaping, SUB entrance and waiting lobby with good visibility and access to transit information;
• Adopt a shared-bicycle program that encourages students and staff to use Dalhousie-provided bikes to move within the campus; there is extensive evidence of increased urban bike use even in cold and inclement weather conditions where bikes are conveniently and inexpensively accessible;
• Work with CarShare HFX to increase the coverage and availability of car share vehicles on the campuses and nearby student housing areas;
• Reschedule the standard class day to reduce impact on peak hour traf!c volume, for example, by scheduling classes between 9:30 am and 7pm;
• Employ a full summer course term that would increase seasonal alternative transportation modes including transit, bicycles and walking;
• Extend UPass privileges to staff and faculty, taking advantage of Metro’s policy of awarding discounted fare packages to large employers;
• Partner with Metro and neighbouring institutions (e.g. CDHA, SMU) to provide remote park-and-ride facilities (that would also contribute to Dalhousie’s parking requirements at lower land costs);
• Provide education and awareness programs for students and staff to promote inform on the available transportation options.
2. University Housing
• Increase undergraduate and graduate units on campus, in collaboration with the private sector: the planned strategy of intensifying campus development with mixed-use buildings that include student and staff housing choices is not only aimed at achieving TDM goals but also bene!ts the University in attracting a diverse – including international – population using its available land resource. Dalhousie can also increase the rental inventory by gradually converting its residential properties for student and staff rental occupancy. The challenge will be to achieve these initiatives using creative !nancing models including public/private partnerships. The target is to gradually reduce the number of students and staff who commute daily to the university by private automobile, impacting the community environment and requiring costly campus parking facilities;
• Also adopt initiatives to encourage the private sector to increase the supply of rental units within walking distance of the campus, and to ensure that these units are managed in mutually responsible manner; this requires an active operating relationship between the University Housing Service, the private landlords and the tenants; for example, a university housing referral service could be established to encourage neighbourhood property owners to list and maintain adequate rental units and assist students and staff to access housing choices within walking distance of the campus;
• Engage community representatives in an on-going consultative process to monitor the progress of these initiatives.
3. Campus Parking
• Adopt long range objectives of (1) reducing the demand for parking by increasing the bene!ts of choosing alternative means of travel to the campus and (2) reclaiming small dispersed parking spaces to enhance campus open space and support new building projects;
• Promote a ride share/car pool program with incentives, to reduce parking demand;
• Further encourage reduction in campus parking demand by providing remote transit commuter park-and-ride lots, as discussed above, that would result in reduced commuter travel and parking costs;
• Concentrate campus parking facilities (both surface and structured) and adopt a system of assignment and information to reduce existing patterns of having to search for a vacant parking space, creating inef!ciencies and unnecessary traf!c;
• Rationalize on-campus parking fees and gradually align fees with costs to provide, maintain and operate them, as other parking initiatives achieve positive results.


APPENDIX A.2
CAMPUS DEVELOPMENT CAPACITYA.2
DA
LHO
US
IE C
AM
PU
S M
AS
TER
PLA
N
FRA
ME
WO
RK
PLA
N

JULY 2010A.2.1
DALHOUSIE UNIVERSITY FRAMEWORK PLANAPPENDIX A.2 CAMPUS DEVELOPMENT CAPACITY
CAMPUS DEVELOPMENT CAPACITY ANALYSISThe University Framework Plan mapped on page 17 indicates proposed Future Development Sites throughout the campus. By assuming reasonable, but not necessarily maximum building heights on these future sites, a potential gross "oor area (gsf) can be calculated and totalled as an indication of the potential capacity of the existing university to accommodate further development. The following map and table describe this analysis, indicating that a total of approximately 3.28M gsf could be added to the campus in the future, compared with a total existing space inventory of some 4.14M gsf, or a signi!cant increase in the order of 79 %.
This analysis suggests that without expanding its present land holding, the University can expand its space inventory (and its enrolment at current space standards) far beyond its growth expectation. This !nding supports the principle in the Plan of intensifying campus development to enhance campus interaction and vitality, ef!ciency and sustainability.

IBI GROUP |A.2.2
APPENDIX A.2 CAMPUS DEVELOPMENT CAPACITY
DA
LHO
US
IE C
AM
PU
S M
AS
TER
PLA
N
FRA
ME
WO
RK
PLA
N
SOUTH ST.
UNIVERSITY AVE.
ROBI
E ST
.
SOU
TH P
ARK
ST.
LEM
ARCH
ANT
ST.
OXF
ORD
ST.
COBURG ST.
SPRING GARDEN RD.
QU
EEN
ST.
BARR
ING
TON
ST.
MORRIS ST.
SUM
MER
ST.
SOUTH ST.
UNIVERSITY AVE.
ROBI
E ST
.
SOU
TH P
ARK
ST.
LEM
ARCH
ANT
ST.
OXF
ORD
ST.
COBURG ST.
SPRING GARDEN RD.
QU
EEN
ST.
BARR
ING
TON
ST.
MORRIS ST.
SUM
MER
ST.


APPENDIX A.3
UTILITIES & SERVICESA.3
DA
LHO
US
IE C
AM
PU
S M
AS
TER
PLA
N
FRA
ME
WO
RK
PLA
N

Dalhousie UniversityUtil i ty Infrastructure Assessment


Introduc on
As part of the overall campus master planning exercise, the exis ng campus u lity infrastructure has been the subject of an overview assessment. The purpose of this assessment is to assess the current status of the exis ng u lity systems and their ability to accommodate current u lity demands, and determine what impact the future developments outlined in the Campus Master Plan would have on this exis ng infrastructure.
The u lity infrastructure systems included in this assessment include:
Water supply and distribu on
Storm and sanitary drainage
Electrical supply and distribu on
Steam supply and distribu on
The ndings of the assessment are contained in the following paragraphs.
Execu ve Summary
The key ndings of the u lity infrastructure assessment are as follows:
Water
Exis ng water supply and distribu on systems are adequate for current and future domes c needs. Depending on the nature and size of each proposed development, booster pumps may well be required, to meet re safety requirements and domes c use.
Storm and Sanitary
The storm and sanitary drainage systems serving the Dalhousie campus sites are connected to a combined storm and sanitary municipal system. Por ons of this municipal system are undersized and do not meet current HRM design standards.
Assuming the proposed developments comply with HRM Design Guidelines that limit the post development ows to 40% of the corresponding uncontrolled ow levels, the peak ows experienced in the combined sewer systems will be reduced. This will have a bene cial impact on the frequency of over ows, since all peak ows will be reduced compared to exis ng condi ons.
Electrical Supply and Distribution
The exis ng 23 kV system servicing the Studley and Carleton campuses is essen ally opera ng at its capacity; it will be essen al to upgrade the present system either by increasing the capacity or by crea ng new campus distribu on systems.
To accommodate the addi onal loads that would be imposed by the future developments of the Master Plan, considera on should be given to adding a new main 25 kV feed to the west side of the Studley Campus to service both exis ng and new buildings on the western side of the campus.
While signi cant opportuni es exist for overall improvement in campus-wide electrical energy consump on, it is unlikely these improvements could be realised quickly enough to avoid the need for the second main feed to the Studley and Carleton campuses.
•
•
•
•
•
•
•
•
•
•
1
Dalhousie University - Campus Master PlanU lity Infrastructure Assessment
A.3.

Steam Supply and Distribution
The central hea ng plant is at maximum capacity and will not be able to support any signi cant new loads.
Central hea ng plant boilers are 37 years old and are near the end of their useful life.
The “backbone” of the system is steam piping installed in a tunnel network, as well as direct buried pipe.
The piping system in the tunnel is in excellent condi on, and with some small excep ons, capable of handling all proposed addi onal load.
Piping that is direct buried from Tupper Building to Sexton campus is problema c and has had ongoing maintenance issues, par cularly around Chamber 5 located at Morris St/Brenton St.
Water Supply
Description of Water System
The Dalhousie campus falls within two separate pressure zones in the Halifax Water distribu on system. The Sexton and Carleton campuses fall in the “Peninsula Intermediate” zone, which is bounded to the south along Oakland Road and University Avenue (refer to Figure X). The average water pressures in those por ons of the campus that fall within this zone range from approximately 47 psi (at Coburg Road/LeMarchant Street Intersec on) to 70 psi (near the Tupper Building to the east and along Oxford Street to the west). The Sexton campus falls with the “Peninsula Low” zone, bounded the west by South Park Street and to the north by Spring Garden Road. In this zone, the average domes c water pressures in the Sexton campus range from 55psi (along Queen Street) to 70 psi (along Barrington Street).
Commentary
Generally, the minimum preferred domes c water pressure for any building is 40 psi. If water pressures within a building are expected to be below 40 psi, then water pressure boos ng within the building is generally required through the installa on and opera on of water booster pumps in the buildings plumbing system. Typically, for every ten feet of building height, water pressure reduces by roughly 4.5 psi.
The supply and distribu on systems within each Halifax Water zone seem to be capable of mee ng current and future campus domes c use requirements. With respect to availability of su cient re ows in the study area, it is very di cult to make such calcula ons without a detailed knowledge of each exis ng or proposed building’s occupancy, size, and method of construc on.
It is very likely that most large buildings constructed on campus in the future would require the installa on of individual building re pumps, to boost pressures and ows to those levels required for re safety.
Storm and Sanitary Drainage
Pipes in the Dalhousie sewage system are separated between sanitary and stormwater drainage. The por on of the system that drains westward towards the Northwest Arm is separated un l it reaches the edge of the Arm. The other por on, which drains eastward towards the Halifax downtown area, becomes combined when connected to the municipal system. As such, stormwater over ows are mixed with sanitary sewage.
•
•
•
•
•
2
Dalhousie University - Campus Master PlanU lity Infrastructure Assessment
Figure X - Halifax Water Pressure Zones
A.3.

For the purposes of this assessment, it is assumed that each Master Plan development will follow the HRM Municipal Service System Design Guidelines, which limit post-development peak ows to less than 40% of the corresponding post-development uncontrolled 1 in 100 year ow levels.
Since the municipal drainage system is supposed to be designed to drain 1 in 5 year ows, it is assumed that the 40% ow control requirement is extended to the 1 in 5 year event. The analysis of the impacts of the Master Plan developments on the drainage system are made with respect to the 1 in 5 year event.
This assessment has used stormwater drainage data available from HRM. It is noted that this data is, in some instances, incomplete and uncon rmed.
Areas have been assembled in groups (sewersheds) based on their drainage outlets. These areas are shown on Figure Y for the Studley campus.
3
Dalhousie University - Campus Master PlanU lity Infrastructure Assessment
Sewershed ST-B
Sewershed ST-A
Sewershed ST-C
Sewershed ST-D
Figure Y - Sudvision of Areas by Sewershed - Studley CampusHalifax peninsular typical manhole cover and interior
A.3.

Sewershed draining towards the Northwest Arm (Studley Campus):
This area drains to a separated system (sanitary and stormwater). Since the expected increase in popula on from this development is not known, no assessment of increased ows in the sanitary system can be made.
ST - A: South Side (Sites ST6, ST8, ST9 and ST11):
Concerning the stormwater system, the peak ow is es mated at approximately 0.95 m³/s. This is calculated using the ra onal method, with the following parameters:
Surface area: 6.17ha
Maximum overland ow length: 340m
Runo coe cient: 0.6
Surface slope: 10 %
Design event: 1 in 5 year storm
The stormwater system is composed of three pipes, two of them 200mm in diameter, and the third 550mm in diameter. Their slope is unknown, but the land grading is at an average of approximately 10%. This gives a total pipe capacity of approximately 1.6 m³/s.
This result indicates that it is likely that there is capacity in the system during the 1 in 5 year storm.
With the proposed development on this sewershed, the drained stormwater ows will increase, due to the construc on of structures with impervious surfaces, which do not allow percola on of rainfall into the ground. It is es mated that the areas slated for development form a total surface area of approximately 4.1 ha. Without any ow control, this has the poten al of increasing the peak ows to 1.36 m³/s. With ow control, however, the peak ow from the en re site will be reduced to 0.73 m³/s (lower than exis ng peak ows). The ow control will therefore have no nega ve impact on the system.
ST - B: North Side (Sites 10 and 13):
Using a similar method, the peak ow is es mated at 0.67 m³/s:
This is calculated using the ra onal method, with the following parameters:
Surface area: 4.2ha
Maximum overland ow length: 375m
Runo coe cient: 0.7
Surface slope: 3.6 %
Design event: 1 in 5 year storm
The stormwater system includes a pipe with a diameter of 375 mm. No slope informa on is available, but using the slope of the ground surface, the capacity is approximately 0.3 m³/s. The HRM pipe that runs along Coburg Road has a diameter of 300 mm, with an es mated capacity of 0.2 m³/s, which is shared with other areas. It would therefore seem that there are capacity limita ons in this area during the 1 in 5 year storm. This is not uncommon on the Halifax peninsula.
•
•
•
•
•
•
•
•
•
•
The proposed development includes two buildings in this sewershed (sites 10 and 13), with a total surface area of approximately 4.2 ha (full development of the watershed surface). The peak ows would increase to 0.95 m³/s with this development. With the implementa on of ow control, the peak ows can be expected to be reduced to approximately 0.38 m³/s (a reduc on of 33% compared to exis ng peak ows). This is clearly bene cial, especially in an area which is experiencing drainage capacity issues.
ST - C: Sites 7 and 22
These sites drain in a di erent direc on, towards the south and therefore has been considered on its own. The peak ow expected from the areas covered is approximately 0.41 m³/s.With development but no ow control, this ow would increase to approximately 0.54 m³/s. With ow control, this drops to 0.22 m³/s (reduc on of 46% compared to exis ng ows).
The piped system just downstream consists of a 375mm pipe at 3.7%, with a capacity of 0.31 m³/s. Since this capacity is shared with the adjacent proper es, it may be bene cial to connect a por on of the development to Dalhousie St, and the remainder to Oakland Rd.
ST - D: Draining towards the Downtown Halifax Area (Studley Campus)
Upstream Block (Sites ST- 1,2,3,4,5,14,15,16,17,18,19,20,21,23 and 24 - Upstream of Robie Street)
The peak ow for this sewershed is es mated at 1.95 m³/s:
This is calculated using the following parameters:
Surface area: 21.1ha
Maximum overland ow length: 740m
Runo coe cient: 0.7
Surface slope: 2 %
Design event: 1 in 5 year storm
The stormwater system at the corner of South and Robie St consists of a 400x600 mm pipe with a capacity of approximately 0.35 m³/s.This pipe is therefore currently undersized according to the HRM design standards.
The proposed development covers a total surface of approximately 6.13 ha. With no ow control, this would increase peak ows to approximately 2.2 m³/s. With ow control, this will be reduced to approximately 1.7 m³/s, thus allevia ng peak ows to a small extent.
Middle Block (Sites CR1-CR4 - Between Robie St and Summer St) - Carleton Campus
The peak ow for the block containing areas 10 and 11 is es mated at 0.43 m³/s:
This is calculated using the following parameters:
Surface area: 3.0ha
Maximum overland ow length: 355m
Runo coe cient: 0.7
•
•
•
•
•
•
•
•
4
Dalhousie University - Campus Master PlanU lity Infrastructure Assessment
A.3.

Surface slope: 2.1 %
Design event: 1 in 5 year storm
The stormwater system at the corner of University and Summer St, consists of a 300mm diameter pipe, with an es mated capacity of approximately 0.21 m³/s, which means it does not conform to current HRM design standards.
The proposed development covers a combined area of approximately 1.5 ha. With no ow control, this would increase the peak 1 in 5 year ows to approximately 0.51 m³/s. With the ow control, this would then be reduced to approximately 0.33 m³/s (reduc on of 23%).
Downstream Block by Barrington St - Sexton Campus
The peak ow for the Sexton campus is es mated at 0.81 m³/s:
This is calculated using the following parameters:
Surface area: 6.7ha
Maximum overland ow length: 565m
Runo coe cient: 0.7
Surface slope: 3.1 %
Design event: 1 in 5 year storm
The stormwater system at the corner of Barrington and Morris St, consists of a 450mm diameter storm sewer pipe, and a 900mm combined sewer pipe, with an es mated combined capacity of approximately 3.1 m³/s, which is shared with other sites along Morris Street. Since the surface area of site 12 covers more than 50% of the total drainage area to that point, it is expected this system meets the HRM design requirements at this loca on.
With no ow control, this development (5.4ha) would increase the peak 1 in 5 year ows to approximately 1.09 m³/s. With the ow control, this would then be reduced to approximately 0.53 m³/s (reduc on of 35% compared to exis ng ows).
•
•
•
•
•
•
•
Increases in Sanitary Flow
This assessment has focused primarily on stormwater drainage ows. Sanitary ows, by comparison, would only represent a small frac on of the stormwater drainage ows. In this sewershed, the sanitary ows are currently es mated to be approximately 0.5% of the peak stormwater ows. It is assumed therefore, that the increase in sanitary ows that would result for the developments of the Master Plan would have only a marginal impact on the combined sanitary and stormwater sewer system serving the campus sites.
Electrical Distribu on System Summary
The assessment of the Dalhousie campus electrical supply and distribu on infrastructure addressed the following key areas aspects:
Exis ng system capacity
Exis ng system loading
Addi on of second campus distribu on system
Allowance for connec on to campus system in new buildings
Energy targets
Energy reduc on technologies and strategies
On-site renewable technologies
Description of Supply and Distribution Systems
The Dalhousie Studley and Carleton campuses are supplied primarily from the campus-wide 23 kV distribu on system, emana ng from the Weldon Law Building, and distributed throughout the campus via a walk-through tunnel system. The 23 kV system is supplied by a NSPI 25 kV feeder from the Armdale substa on and is stepped down to 23 kV to match the campus system. While most of the main buildings of the campus are supplied from the campus 23 kV distribu on system, there are several buildings supplied directly from the Nova Sco a Power Inc. 25 kV distribu on system.
Figures U, V and W (on the following pages) indicate the loca on and extent of the tunnel used for electrical and steam distribu on.
The Sexton campus, including Gerrard Hall, is supplied directly from the NSPI system from a 25 kV feeder emana ng from the NSPI Water Street substa on.
The rate code at which electricity is charged to Dalhousie for the campus-wide 23 kV distribu on is Rate Code 12 or Large General Tari . The rate code for the individually fed buildings is Rate Code 11 or General Tari . Both rates charge on the basis of maximum demand and energy consump on. For this reason, it is not obvious, without detailed evalua on, what rate code yields the lowest cost of electricity. Addi onally, the capital cost of new infrastructure required for either op on would be di erent and this would have to be taken into considera on.
•
•
•
•
•
•
•
5
Dalhousie University - Campus Master PlanU lity Infrastructure Assessment
Typical manhole condition Flow control devices
A.3.

6
Dalhousie University - Campus Master PlanU lity Infrastructure Assessment
A.3.

7
Dalhousie University - Campus Master PlanU lity Infrastructure Assessment
A.3.

8
Dalhousie University - Campus Master PlanU lity Infrastructure Assessment
A.3.

Existing Electrical Loads
The following electrical load informa on has been collected from the Facili es group and represents loads recorded over the last twelve months.
The exis ng infrastructure is designed for a maximum load of 12,000 kVA; the maximum load recorded on the 23 kV system in the last twelve months is 10,538 kVA. Therefore, the system is essen ally up to its capacity, and it will be essen al for the University to look at this and make decisions vis-à-vis upgrading the present system, either by increasing the capacity, or by crea ng new campus distribu on systems.
Building Area (sq. .) SystemMax.
Load(kVA)Min.
Load(kVA)Avg.
Load(kVA)
Arena 71,193 Campus 23kV 325 150 258
Arts 175,308 Campus 23kV 358 290 336
Chase 28,801 Campus 23kV 93 77 85
Chemistry 94,991 Campus 23kV 615 491 567
Computer Science 70,640 Campus 23kV 315 260 278
Central Services Bldg. 80,463 Campus 23kV 1,882 515 1,194
Dalplex 178,769 Campus 23kV 620 455 546
Den stry 206,879 Campus 23kV 1,305 1,106 1,173
Dunn 89,991 Campus 23kV 510 438 476
Eliza Ritchie 23,997 Campus 23kV 135 20 80
Henry Hicks 106,614 Campus 23kV 164 140 153
Howe Hall 223,727 Campus 23kV 294 212 265
Kenneth Rowe 122,054 Campus 23kV 527 429 474
Life Sciences Centre 450,052 Campus 23kV 1,732 1,607 1,677
McCain 153,843 Campus 23kV 497 415 451
Risley Hall 177,100 Campus 23kV 386 186 326
Sherri Hall 171,776 Campus 23kV 297 132 239
Tupper 379,218 Campus 23kV 1,661 1,544 1,610
Weldon Law 99,991 Campus 23kV 550 290 358
Student Union Bldg. 124,378 Campus 23kV N/A N/A N/A
Killam Library 250,520 Campus 23kV N/A N/A N/A
Building Area (sq. .) SystemMax.
Load(kVA)Min.
Load(kVA)Avg.
Load(kVA)
Total 23 kV System (NSPI Meter)
Campus 23kV 10,528 9,087 9,643
B Building 37,769 NSPI 25kV 992 824 591
F Building 24,146 NSPI 25kV 36 32 34
G Building 20,843 NSPI 25kV 222 190 136
Gerard Hall 94,270 NSPI 25kV 221 143 186
H Building 43,831 NSPI 25kV 258 93 179
P Building 5,472 NSPI 25kV 125 71 82
Commentary
Future Considerations
Under this Master Plan, there are a number of proposed buildings planned which in total will add a rela vely signi cant load to the total load of the Dalhousie campus. To deal with these addi onal loads, considera on should be given to adding a new main 25 kV feed to the west side of the campus to service proposed new buildings along and near Oxford Street. The new feed could supply the Life Sciences Building and the exis ng buildings now fed through the Life Sciences Building, and also extend out to the new buildings. Ul mately, this could evolve into East and West distribu on systems. O oading the East system by removing the Life Sciences Building could free up approximately 3,000 kVA of capacity for future projects on the east side of the campus. The ming and loca on for the new service could be coordinated with major renova on works or new construc on in this por on of the campus.
Spli ng up the campus-wide distribu on system may also o er the opportunity to covert the 23 kV system to a more standard 25 kV system, depending how the split is implemented.
Future decisions to connect new buildings to the campus-wide system (as opposed to a connec on directly from the NSPI system) may be impacted, in part by any parallel decisions to extend the exis ng u lity services tunnel system.
Should new buildings be constructed and serviced directly from the U lity, it is recommended that allowances are made for future connec on to the campus electrical distribu on system. This may include spare ductbanks, spare conduits and physical space for medium voltage switches.
Energy Efficiency
In addi on to recon guring the exis ng systems, considera on should be given to the energy usage of both the exis ng and new buildings. Energy targets should be established for new construc on/major renova on and building renova on projects. The establishment of these targets should be such that they are meaningful but achievable, graduated such that the energy use targets become more aggressive over me, and building energy usages should be monitored and compared to the targets, to track progress. It is also impera ve that energy targets are both accepted and supported by senior Dalhousie administra on.
9
Dalhousie University - Campus Master PlanU lity Infrastructure Assessment
A.3.

Energy targets will be speci c to the building types, size and usage and will di er for new construc on/major renova on and minor renova on projects. A recommenda on for new construc on and major renova on targets would be ini ally set at 35% be er than the Model Na onal Energy Code of Canada (MNECB), with an ul mate goal of carbon neutrality by the year 2030. The 2030 targets would be in line with Architecture 2030 and the Canada Green Building Council goals. In addi on to the MNECB, CaGBC (LEEDTM) and Architecture 2030, there are a number of other resources available regarding energy usage including but not necessarily limited to NRCan, Energy Star and ASHRAE 90.1.
The reduc on in electrical energy use can be accomplished through e cient design, use of e cient and properly sized equipment, control strategies, ongoing maintenance and both ini al and ongoing commissioning ac vi es. Some sample energy e cient technologies and techniques include: geothermal, fuel cells, variable frequency drives on HVAC and pumping equipment, duct/pipe sized to reduce motor loads, use of e cient/low loss transformers, high e ciency ballasts and lamps, daylight harves ng, occupancy controlled ven la on and ligh ng, high insula on values in walls and roofs, high thermal insula on values of window, op mized solar heat gain coe cient of windows, drain water heat recovery, low ow shower heads and faucets, ven la on air heat recovery, op mized building controls systems, op mized building orienta on (for new buildings), passive solar hea ng and minimizing uncontrolled air leakage.
In addi on to the reduc on in energy usage, considera on for on-site renewable technologies should be considered; this may include technologies such as solar air, solar hydronic panels, photo voltaic panels, biomass and wind power.
Steam Supply and Distribution
System Descrip on
The Dalhousie campus is heated through an underground steam distribu on network supplied from a Central Hea ng Plant (CHP) located in the Facili es Management Building. The CHP was built in 1971 and consists of two Babcock & Wilcox D-Type water tube boilers. These boilers are each rated at 85,000 lb/hr at 150 psig saturated giving a total plant capacity of 170,000 lb/hr. The boilers were designed for and currently re Bunker C heavy fuel oil. The boilers supply steam to the en re campus (approx 4,000,000 sq. ) via a tunnel system. The Sexton campus (Formerly TUNS) is also connected to the CHP through a direct buried steam line connected to the east end of the distribu on system. The CHP operates 24 hours a day, 365 days per year.
Peak load of approximately 162,000 lb/h occurs in the winter hea ng season. The summer load is approximately 40,000 lb/h and comes mainly from absorp on chillers.
There is a 12” steam line that runs from the CHP under Seymour Street to Chamber B (Seymour/University). Here the steam line tees into the backbone of the steam distribu on system which runs east-west along University Avenue. The steam lines on University Avenue are 10” from Chamber B (Seymour/University) east to Tupper Building. From Tupper Building to Summer Street the main is 16”. (Note: This line was sized by Nova Sco a Power to be part of a much larger district hea ng scheme.)
From Summer Street to Sexton, the steam line is sized at 8” and consists of direct buried pipe with 10 access chambers approximately every 300 .
The 12” steam line runs from Chamber B (Seymour/University) west past the Killam Library to Chamber F (SW Corner of Killam Library). From Chamber F, the line is reduced to 10” and runs around the north side of Chemistry and Henry Hicks Buildings and into LSC.
Branch lines to supply various buildings or groups of buildings are taken from the main line in various loca ons.
10
Dalhousie University - Campus Master PlanU lity Infrastructure Assessment
Central heating plant
A.3.

Comments
The exis ng central hea ng plant at Dalhousie University is inadequate to support any future growth. The exis ng plant capacity is nameplate rated at 170,000 lb/hr (2 x 85,000 lb/hr boilers). Peak winter demand is in the order of 162,000 lb/hr. If one boiler fails in the winter, there would be major disrup ons to campus opera ons. Under such an occurrence the University has an emergency plan that can be deployed which will simply avoid damage to the buildings in terms of weather impact. The space condi ons will not be suitable for normal use, and research will be put at risk.
At 37 years old, the exis ng boilers are nearing the end of their useful life and are theore cally due to be replaced.
The 12” line that runs from the CHP under Seymour Street to Chamber B (Seymour/University) is at its velocity limit right now. This is not an issue currently because it is sized properly for the capacity of the exis ng CHP. If the CHP is expanded, then this line will need to be increased in size.
At Chamber F (SW Corner of Killam Library) the steam line is reduced to 10” and runs around the North side of Chemistry and Henry Hicks Buildings and into LSC. If all future development west of Chamber F (ST6, ST8-13) is completed then this 10” line would need to be upgraded to 12”.
There is an 8”direct buried line from Summer St to Sexton campus. It has capacity to supply 60,000 lb/hr. Current usage at campus could be es mated at approximately 15,000 lb/hr. The addi onal capacity on this line could accommodate proposed future growth of this site. It is noted that there are ongoing maintenance problems with this buried line. The main problems have been around water ooding in access chambers par cularly Chamber 5 at the Morris Brenton intersec on.
The main steam line along University Ave is adequately sized so that it could accommodate addi onal steam input from another source i.e. VG Hospital or Halifax In rmary. The 10” sec on from Chamber B (Seymour/University) to Tupper might need to be increased depending if the current plant is kept in opera on.
With new modern LEED equivalent buildings, we have es mated peak hea ng loads at 25 Btu/hr/ 2 depending on the type of building (i.e., mul story, research etc). For non-LEED buildings, we would assume 35 Btu/hr/ 2. For steam line sizing we have used a velocity limit of 10,000 /min.
1.
2.
3.
4.
5.
6.
7.
11
Dalhousie University - Campus Master PlanU lity Infrastructure Assessment
A.3.

APPENDIX A.4
ENERGYA.4
DA
LHO
US
IE C
AM
PU
S M
AS
TER
PLA
N
FRA
ME
WO
RK
PLA
N

Dalhousie ENERGYSupply/Demand Analysis and Recommendations


1
Dalhousie Energy - Supply /Demand Analysis and Recommenda onsDra - July 2009
Dalhousie EnergySupply/Demand Analysis and Recommenda ons (dra )
June, 2009
“Energy cannot be created or destroyed; it can only be changed from one form to another.” -Albert Einstein
“If you can’t measure it, you can’t manage it” -Robert Kaplan
“Think outside the box? There is no box” – Amory Lovins
AbstractDalhousie University owns a large por olio of buildings with almost 5.0 million square feet spread over roughly 100 buildings on 3 campuses. The campus Master Plan es mates a capacity to increase that built area by over 3.0 million square feet over me.
Dalhousie now spends approximately $14 million/year on energy but lacks an overall energy vision or management plan. Energy performance data for individual buildings is incomplete or en rely lacking.
Energy costs are budgeted on a year to year basis with reference to market condi ons. Energy distribu on equipment and networks for steam heat and electricity are currently opera ng at full capacity.
Energy prices will rise and be increasingly complicated by issues regarding the deple on, security, and impact on climate by the fossil fuels Dalhousie relies directly on for space hea ng and indirectly on for electricity.
Governments, corpora ons, NGO’s, u li es and ci zens are taking a variety of steps with varying degrees of urgency to ensure security of energy supply, mi ga on of and adapta on to climate change and other strategies in support of a de-carbonized economy.
Dalhousie needs to develop a holis c and integrated energy perspec ve and a comprehensive energy management plan to ensure future viability of the university and sustain its aspira on for growth. Dalhousie has the resources for suppor ng such a vision with the O ce of Sustainability, the College of Sustainability and ongoing mul disciplinary energy research.
Leadership from the board of governors and the most senior levels of administra on will be required to implement this transforma ve change.
Establish targets for energy reduc on and a team to manage and direct opera ons funded through energy savings.
In Summary: Consume less energy and search out alterna ve, renewable sources.
•
•
•
•
•
•
•
•
A.4.

2
Dalhousie Energy - Supply /Demand Analysis and Recommenda onsDra - July 2009
Overview
Dalhousie occupies roughly 4,900,000SF of built space, including residences, across 3 campuses.
Annual energy costs for the University are approaching $14M/year or approximately $2.85/SF. At this rate energy costs are a distant second to Dalhousie’s annual compensa on budget ( roughly $200M/year ) but unlike the complex structures built around human resource management, there appears to be no such plan around energy management and in par cular demand side management. At today’s prices high performance buildings could be opera ng at less than $2.00/SF. A 25% reduc on in energy consump on would produce a net savings of $3.5M/year. With the poten al to add as much as 3,000,000SF of addi onal built area with Master Planned development the annual burden of energy costs, at today’s prices, would rise by almost $9,000,000. Complica ng the metrics of the calcula on are the improved performance of buildings, new and old, the vola lity of fuel prices, and the security of supply- par cularly of fossil fuels.
The consump on of fossil fuels and its impact on Climate Change are a rela vely recent complica on. Increasingly dire predic ons about the future arrive almost daily through the popular news media with the scien c community weighing in with each report of the Intergovernmental Panel on Climate Change. (IPCC) The Interna onal post- Kyoto conference scheduled for Copenhagen in December 2009 will almost certainly reveal even more worrisome data from all corners of the globe.
Some would even argue the rate of deple on of fossil fuels, oil and gas in par cular, is the more serious challenge.
It is in this context that Dalhousie needs to consider its own rela onship to energy supply, distribu on and use. There is uncertainty around energy in the future both globally and locally and the future is both a moment and a long me.
Dalhousie is currently running at capacity for both its steam genera on poten al and its electrical distribu on network. In each case the University is at a pping point.
Dalhousie buildings range in type from wood frame to stone to concrete, to glass and steel construc on and in age from over 150 years to the present. Together with the people who occupy them, they consume plenty of energy. Every single Dalhousie building consumes more energy than it needs to. In many cases, like the Dunn, Tupper and Life Sciences buildings for example, energy costs are far above those of contemporary buildings such as the McCain and Rowe buildings. Low performance building design, age, deferred maintenance on equipment and building upgrades and lack of strategic energy management have been contribu ng factors to the wasteful use of a nite resource. A signi cant energy savings ini a ve needs to be developed in a long term, strategic, and universal way.
Figure 1 illustrates an incomplete view of Dalhousie’s energy consump on (based on available data) and compared to a Canadian na onal average.
Credit: CBCL Limited
A.4.

3
Dalhousie Energy - Supply /Demand Analysis and Recommenda onsDra - July 2009
Supply and Demand
It is assumed the future will bring steadily, if not sharply, increasing energy costs and the rate of fossil fuel resource deple on and climate impacts present addi onal risk. Opinions di er on global “peak oil”. The Associa on of Scien sts for Peak Oil (ASPO) suggests it has already passed and the Interna onal Energy Agency (IEA) represen ng the oil industry suggests it may not be reached un l at least 2020 although it has recently warned of a looming oil capacity crunch as early as 2013. Almost all of Nova Sco a’s electricity is produced through the combus on of imported coal (Columbia) and most of its space hea ng need is met by the combus on of imported oil (Gulf of Mexico/US, Venezuela). As a result, Nova Sco a’s energy security is at risk and so therefore is Dalhousie’s.
Figure 2 illustrates global issues related to energy security.
Global demand is growing, global supply is dwindling and the geopoli cal challenges of fossil fuel extrac on and retrieval from ever more remote sources are ge ng increasingly complicated and risky. Exactly how much remains is a ma er of conjecture but with daily global consump on at roughly 85,000,000 barrels it’s a fact there is less and less every day.
Figure 3 illustrates recent es mates for Peak World Oil Produc on.
A.4.

4
Dalhousie Energy - Supply /Demand Analysis and Recommenda onsDra - July 2009
With renewable energy sources beginning to make headway through wind, hydro, solar and the promise of dal and biomass all encouraged by the Environmental Goals and Sustainable Prosperity Act of 2007 concerns over supply may diminish over me. Over 85% of Nova Sco a’s energy needs are currently met by the combus on of fossil fuels. For Dalhousie this number is closer to 100% with its reliance on Bunker C fuel oil to produce and distribute steam heat and its reliance on NSPI’s coal generated electricity. With an cipated addi onal costs assigned to carbon based fuel combus on an addi onal burden will be added to Dalhousie’s annual energy budget. Hydro-electric power from Labrador o ers a poten al clean energy op on for Nova Sco a but there is a risk the transmission lines and the energy may bypass the Province and go directly to highly compe ve markets in the north eastern United States.
Fossil fuels con nue to rise in price in a highly vola le market. 10 years ago a barrel of oil was US$16. In September 2007 it was US$80. In August, 2008 it skyrocketed to US$147 – a price many say was a glimpse of the future. By December 2008 the price had fallen precipitously to bo om out at US$33 then in the subsequent 6 months it has more than doubled to over US$70/barrel. No dependable price forecast is available.
Dalhousie’s Budget Advisory Commi ee has monitored the vola lity in energy costs and the 2008-2009 budget for energy was increased by $1,800,000. The subsequent year’s budget, 2009-2010 actually reduces the energy budget by $300,000, presumably at least partly in response to the lower oil prices seen in late 2008 and early 2009. In the absence of a long term energy strategy, the budget process manages energy costs on a year to year basis based on historical market data. Energy impacts on the broader life of the university or projected savings through demand side management were not evident in Budget Advisory Commi ee (BAC) minutes.
Dalhousie Facili es Management es mates the university will require capacity augmenta on by December 2010. Recent project-centred ini a ves addressing supply side Dalhousie energy concerns describe 5 op ons. In order of descending capital cost they are as follows. (capital cost/annual O & M savings/CO2 Reduc on/simple payback)
1. 15 MW Co-Gen/VG-HI-Dal Interconnec on ($47M/$856k/106k tonnes/12 years)
2. 15MW Co-Gen/ VG Dal Interconnec on ($41.2M/$560k/105k tonnes/12.6 years)
3. 7MW Co-Gen VG-Dal Interconnec on ($30.4M/$560k/70.3k tonnes/7.4 years)
4. VG-Dal Interconnec on/ Addi onal Boilers at VG ($16.1M/$560k/25.2k tonnes/6.9 years)
5. VG-Dal Interconnec on/ Convert Dal to Gas ($5.7M/$170k/25.2k tonnes/5.5 years)
Carbon
CO2 cap and trade policies in the European Union have already put a price on carbon in that market. Similar protocols will be in place in North America with the current federal government projec ng regula ons in place for cap and trade on carbon emissions by 2011. Bri sh Columbia established an ascending carbon tax commencing at $10/tonne in 2008.
The rst carbon trading transac on within Nova Sco a was announced in June, 2009 when the Berwick Electric Commission purchased a one tonne carbon credit from Minas Basin Pulp and Power Company.
With its heavy reliance on fossil fuels, Dalhousie will also need to purchase carbon credits if it con nues the current prac ce of genera ng its own steam with Bunker C oil. NSPI faces similar costs associated in genera ng electricity from coal.
These are rela vely new and increasingly urgent and challenging issues for governments, corpora ons, ci zens - and universi es, all over the world. Dalhousie and the world face an uncertain energy future. Solu ons are not likely found in a “business as usual” approach.
Figure 4 illustrates the rela onship between CO2 emissions and global temperature varia ons.
Credit: UNEP / GRID Arendal
A.4.

5
Dalhousie Energy - Supply /Demand Analysis and Recommenda onsDra - July 2009
Credit: CBCL Limited
Figure 5 illustrates par al CO2 emissions from Dalhousie.
A.4.

6
Dalhousie Energy - Supply /Demand Analysis and Recommenda onsDra - July 2009
A Compe ve World
Many organiza ons, including universi es and colleges in direct compe on with Dalhousie are taking innova ve approaches to energy management coupled to sustainability strategies and climate change ac on plans. Locally, the Nova Sco a Community College has demonstrated innova ve approaches to holis c green programs and facili es and partnered with Nova Sco a Power to research alterna ve energy strategies through a program called “Advancing Sustainability”.
Dalhousie needs to demonstrate its leadership in energy policy to stabilize costs and con nue to a ract students and faculty increasingly tuned in to the internal green ini a ves of university opera ons. They have to “walk the talk”.
For example, some ins tu ons have long standing programs in place.
In 2006, the University of Bri sh Columbia completed an 8 year program called “Ecotrek” which included the retro t of 300 academic buildings with energy and water conserva on systems. Capital costs were recovered through energy performance contrac ng. Core campus energy use was reduced by 20%, water use by 30% and GHG’s by 15%. Annual savings for the university were over $2.5M. UBC has also cul vated a semi-autonomous rela onship with the City of Vancouver to reach superior levels of sustainability through local food procurement, increased waste diversion from land lls and food waste compos ng for example. With its increasingly urban campus Dalhousie may be in a posi on to cul vate a similar rela onship with the Halifax Regional Municipality.
University of Victoria installed 173 photovoltaic panels on their McKinnon Gym building in the 1980’s that generate 350,000kWh of energy every year. Solar panels are also used to power cket dispensers and lights at campus transit stops.
In September 2008, Blekinge Ins tute of Technology in Karlskrona, Sweden, achieved carbon neutrality. Designed for a 2050 climate, Lauren an University’s Living with the Lakes project will be designed to exceed LEED Pla num.
Renewable energy technologies harves ng wind and solar energy are deployed at universi es all over the United States and Canada. An assessment of solar energy poten al for all Dalhousie buildings forms a key part of this campus master plan. Detailed solar energy assessments are provided for the Killam Library and Tupper Medical buildings.
Energy Touches Everything
Transporta on: a key element of energy management with links to tra c demand management (TDM), eet vehicle policies (hybrid, alterna ve fuels, size and type), sta air travel policies – alternate technology deployment eg webinars, video conferencing, and proac ve support of ac ve transporta on policies.
Scheduling: In Nova Sco a primary energy is used for space hea ng. Expanding the use of buildings into the warmer months of the year is an opportunity to expand the role and mandate of Dalhousie with minimal energy impacts. More subtle shi s involving ex- me daily class schedules or expanding to 6 day/week programs will also present signi cant opportuni es for energy savings.
Food services: Comprehensive energy policy can impact food service with ini a ves around fuel type, local sourcing, organic standards and waste stream management.
Technology: Computers and other electrical devices consume large amounts of energy much of which is transformed to heat. Energy sensi ve procurement policies can specify energy e ciency in goods and services. With a district energy network waste heat from buildings heavy in equipment use, labs for example, can be transferred to buildings with high hea ng demands like residences.
Green Building Standards: Organiza ons such as the Canada Green Building Council (www.cagbc.org) are developing energy benchmarking and performance measurement tools for buildings with products like LEED Exis ng Buildings - Opera ons and Maintenance (LEED EBOM) with the target of achieving 50% reduc on in energy and water consump on for 100,000 commercial buildings and 1,000,000 homes by 2015. A 50 megatonne reduc on in Canadian GHG emissions sets an ambi ous goal for this program and will make a signi cant impact in mee ng Canada’s Kyoto and post-Kyoto GHG reduc on obliga ons. Universi es and Colleges make up over 10% of LEED registered or cer ed buildings in Canada. Beginning in 2010 the Environmental Goals and Sustainable Prosperity Act will mandate LEED Gold for publicly funded buildings. More ambi ous protocols are emerging to address the impact of building opera ons on green house gas emissions and climate change.
The Living Building Ins tute (www.ilbi.org) requires buildings to supply 100% of a building’s energy needs via on-site renewable technology. Over 50 projects are registered in North America.
Opportuni es
As signatories to 3 interna onal declara ons related to environment and sustainability over the past 20 years, (the Halifax Declara on, the Talloires Declara on and the UNEP Interna onal Declara on on Cleaner Produc on), Dalhousie has already demonstrated a clear indica on of its commitment. More recently, establishment of the O ce of Sustainability, the College of Sustainability, The President’s Advisory Council on Sustainability and the imminent release of the University Sustainability Plan as well as ongoing research across many facul es provides further indica on of where Dalhousie is moving in the future. If Dalhousie is going to succeed in becoming the best university in Canada, as it has set out to do, then it must give special a en on to coordina ng these e orts and establishing ac on plans to achieve speci c and ambi ous goals. Sustainability is a broad term and in the lexicon of environmental, social and economic con uence, it is giving way to the idea of “resilience” as a more poignant reminder of our fragile planet. A resilient university will be one that understands the full extent that society and its ins tu ons rely on a ordable, available and renewable sources of energy and that responsibility for the stewardship of available resources resides at the highest level.
A.4.

7
Dalhousie Energy - Supply /Demand Analysis and Recommenda onsDra - July 2009
Credit: Manchester Guardian
Thin Film Solar Photo Voltaic Membrane
Op ons for Considera on
1. Establish an Energy Vision and Management Plan for Dalhousie within the O ce of Sustainability repor ng directly to the President.
2. Establish an Energy Management team to carry out the vision. Hire an Energy Management director and suppor ng sta as required. Finance the Energy Management team and ini a ves through energy savings. A 25% reduc on in 5 years or less can provide up to $3.5M/year to fund opera ons.
3. Develop a comprehensive Demand Side Management plan. Set a minimum campus wide energy reduc on target of 25% within 5 years. Review progress on a semi-annual basis. Con nue to explore energy supply op ons including co-genera on and alterna ve, renewable fuel sources with or without partners.
4. Start documen ng all energy related data for every building. Iden fy units of energy consumed and cost per unit of energy. Express energy savings in dollars and tonnes of green house gas emissions saved. Iden fy building speci c ini a ves taken in each case with results expressed as above.
5. Install comprehensive monitoring and veri ca on tools for every building.
6. Develop an energy e ciency and conserva on educa on program for all university stakeholders to support individual ac on.
7. Post the Vision and Management plan on Dalhousie’s web site. Communicate results from monitoring network in real me. Calculate and post green house gas emissions results on a daily basis.
8. Partner with governments, NSPI, other ins tu ons and the private sector to collaborate, innovate and share data. Where appropriate cost share expenses on mutual ini a ves.
9. Develop energy budgets for all new construc on and major renova on projects. Use emerging energy performance tools such as LEED EBOM (Exis ng Buildings Opera ons and Maintenance).
10. Through the College of Sustainability and Dal Communica ons, develop a university wide awareness program to iden fy and address the meaningful links between energy management and water conserva on, climate change, transporta on, food, scheduling, waste management, air quality, ligh ng in addi on to basic building opera ons.
A.4.

APPENDIX A.5
SOLAR INVENTORYA.5
DA
LHO
US
IE C
AM
PU
S M
AS
TER
PLA
N
FRA
ME
WO
RK
PLA
N

A.5.3IBI GROUP |
DALHOUSIE UNIVERSITY FRAMEWORK PLANAPPENDIX A.5 SOLAR INVENTORY
DA
LHO
US
IE C
AM
PU
S M
AS
TER
PLA
N
FRA
ME
WO
RK
PLA
N
This report was prepared by Green Power Labs Inc. (GPLI) for IBI Group/WHW Architects and Dalhousie University. The materials in this report re!ect GPLI’s best judgment based on the information available to the company at the time of report preparation. Any use of this report by a third party, or any reliance on or decisions made based on it, are the responsibility of such third parties. GPLI accepts no responsibility for damages, if any, suffered by any third party as a result of decisions made or actions based on this report.
Executive Summary Solar energy can be a valuable resource in Nova Scotia, providing a means to reduce life-cycle energy costs and environmental impacts, and to improve energy security. Dalhousie University’s interest in solar energy is substantiated by recent developments in solar technologies, by increasing fuel prices, and by a global concern to reduce greenhouse gases.
The effectiveness of solar technologies depends on the amount of solar radiation available, the conversion capability of the available technologies, and the demands for use of the energy.
The objectives of this solar suitability assessment are to determine the suitability of the University facilities and open areas to solar energy, and to develop recommendations for applying solar energy technologies in the University’s energy mix.
The solar resource is quanti"ed using a combination of surface weather station information and satellite data for the geographic area.
Maps are presented for the Studley, Carleton and Sexton campuses describing solar gain and the effect of shading by obstructions to sunlight.
A SolarStarTM rating is used to identify the buildings most suited for solar applications.
Current technologies for solar water heating, solar air heating and photo-voltaic power generation are presented and discussed.
The generating potential of solar water heating and solar air heating on campus is mapped for each building.
The total solar resource and generating potential of buildings is estimated:
Area (m2) after Obstructions
Total Annual Radiation (MWh)
Solar Thermal Generating Potential
(MWhth)Solar Electric Generating
Potential (MWhe)Solar Suitable Roof Surface: 44,142 57,115 9,400 3,700
Solar Suitable Wall Surface: 23,182 22,903 12,600 -
TOTAL 80,018 22,000 3,700
Solar energy technology could replace 20% of the heating energy that is currently provided by the Central Heating Plant.
Building-mounted solar electrical generation could provide approximately 5% of the University’s electrical needs.
Solar suitability assessments were carried out on the Sir Charles Tupper Building and the Killam Memorial Library. The buildings provide signi"cant opportunities for using renewable energy technologies to displace the use of fossil fuel.
At both sites, solar air heating provides more energy at less cost than solar water heating.

DALHOUSIE CAMPUS MASTER PLAN FRAMEWORK PLAN A.5 SOLAR INVENTORY
A.5.4 JULY 2010
1 IntroductionSolar energy can be a valuable resource in Nova Scotia, providing a means to reduce life-cycle energy costs and environmental impacts, and to improve energy security. Dalhousie University’s interest in solar energy is substantiated by recent developments in solar technologies, by increasing fuel prices, and by a global concern to reduce greenhouse gases.
The effectiveness of solar technologies depends on the amount of solar radiation available, the conversion capability of the available technologies, and the demands for use of the energy.
The objectives of this solar suitability assessment are to determine the suitability of the University facilities and open areas to solar energy, and to develop recommendations for applying solar energy technologies in the University’s energy mix.
First, the solar resource is quanti"ed using surface weather station information and satellite data for the geographic area.
The effect of shading by obstructions to sunlight are calculated and mapped in terms of net solar gain for the Studley, Carleton and Sexton campus areas.
A SolarStarTM methodology is used to identify the buildings most suited for solar applications.
Solar technologies are discussed, and the solar generating potential of each building is estimated.
Finally, solar suitability assessments are carried out on two buildings, the Sir Charles Tupper Building and the Killam Memorial Library, to provide examples of the potential application of solar technologies at speci"c buildings.
2 Solar Resource AssessmentUsers of solar energy technologies need high-quality solar radiation data to maximize the output of the energy systems and the return on investment.
Solar gain at the Earth’s surface is the sum of direct and diffuse radiation. When sunlight passes through the Earth’s atmosphere, a portion is scattered or absorbed by haze, particles, or clouds, of which only a portion reaches the Earth’s surface as diffuse radiation. On an overcast day, essentially all radiation that reaches the ground is diffuse, while on a clear day most radiation is direct. Radiation levels are also affected by the position of the Sun above the horizon; this angle - and the nature of the air mass through which the sunlight travels - changes during the day and through the year.
Historically, ground measurements have been used to determine surface-level radiation and other weather parameters for renewable energy projects. Although ground measurement data have been used successfully in the past, there are inherent problems and limitations in using them for resource assessment. We access the solar energy information from NASA Earth Science Enterprise (ESE) program’s satellite and reanalysis research data. In contrast to ground measurements, the Surface meteorology and Solar Energy (SSE) data set is a continuous and consistent global climatology of solar gain and other weather data over a period of 10 years or more.
Major inputs to the radiation calculations were obtained from the World Climate Research Program’s International Satellite and Cloud Climatology Program (ISCCP) sponsored by NASA. Version DX 8-km radiance and cloud were used. Water vapour was taken from the NASA Data Assimilation Of"ce’s Version 1 Goddard Earth Observation System (GEOS-1) data for each 2O x 2.5O latitude/longitude cell over the globe for the period July 1983 through June 1993 on a 3-hourly basis. The 10-year data period contained 3.5 El Nino years, 2 La Nina years, and 4.5 “near-average” years, which is representative for long-term climatology of the study area.
For solar energy resource assessments we use the total annual radiation based on calculations of monthly average solar gain on a horizontal surface. This value is typically referred to as global horizontal radiation, expressed as a daily average in units of kWh/m2/day. The following map, Figure 2-1, describes average yearly radiation levels on horizontal surfaces in Nova Scotia, based on these data.
Figure 2-1: Solar map of Nova Scotia; Global Horizontal Radiation 3.3-3.6 kWh/m2/day
Figure 2-2 below, shows the monthly dynamics of solar gain in Halifax Region, and differences between the ground site and satellite datasets.
Figure 2-2: Global Horizontal Radiation, Halifax Region (kWh/m2/day).

APPENDIX A.5 SOLAR INVENTORY
A.5.5IBI GROUP |
DA
LHO
US
IE C
AM
PU
S M
AS
TER
PLA
N
FRA
ME
WO
RK
PLA
N
Campus-Wide Solar GainThe solar radiation rates of the Studley, Charleton and Sexton Campuses are presented in the following Figures. The maps were developed using the NASA data for solar gain, and an obstructions analysis of Lidar 3-D modeling data.
LIDAR (Light Detection And Ranging) is an optical remote sensing technology that measures properties of scattered light to "nd range and other information of a distant target. Airborne laser scanning delivers detailed surface information (approx. 10 points/m#). This study used data for the Halifax area provided by PHB Technologies / LaserMap Image Plus under contract to Halifax Regional Municipality in May 2007. The data was processed to obtain the solar radiation intensity for each point in a 0.2 m grid covering the three campuses. At each point, a ‘virtual "sheye’ image of the surrounding topography was developed from the LIDAR data, as illustrated in Figure 2-3 and an obstructions analysis was performed to estimate the total annual solar radiation.
The virtual "sheye image shows obstructions to sunlight from the roof of the Nu-Tech building, Dalhousie index D280. The red line shows the Sun’s path on June 15th; the blue line represents December 15th.
Figure 2-3: Virtual Fisheye Image - Roof of Nu-Tech Building.
Calculations were performed for the year in bi-weekly intervals. The model analyses the solar angle and altitude-air mass impacts throughout the day. The effects of shading from obstructions are calculated at each time-step on each component (direct, diffuse and re!ected) of solar gain.
The results are mapped in Figure 2-4, Figure 2-5 and Figure 2-6 below.
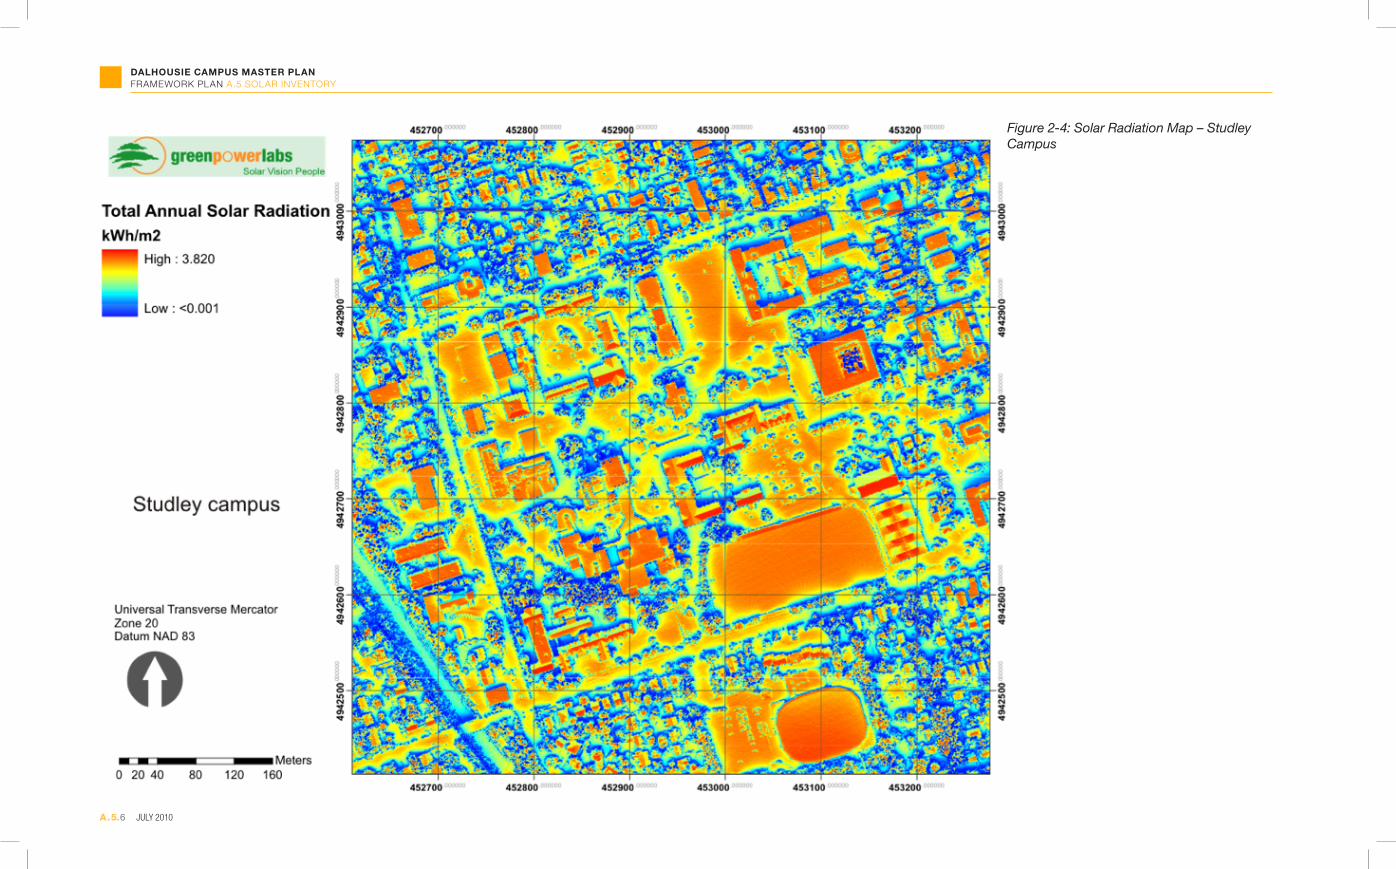
The maps identify the best roof surfaces for the installation of solar technologies. The maps also identify the impact of landscaping features on solar throughout the campuses. For example, ‘hot spots’ in Figure 2-4 include the Wickwire Field and the Killam Library, while areas with trees have little solar gain at ground level.
The model may be used as a design tool, for example, by adding proposed building or landscaping options to the LIDAR data to obtain radiation characteristics throughout the year.
DALHOUSIE CAMPUS MASTER PLAN FRAMEWORK PLAN A.5 SOLAR INVENTORY
A.5.6 JULY 2010
Figure 2-4: Solar Radiation Map – Studley Campus

APPENDIX A.5 SOLAR INVENTORY
A.5.7IBI GROUP |
DA
LHO
US
IE C
AM
PU
S M
AS
TER
PLA
N
FRA
ME
WO
RK
PLA
N
Figure 2-5: Solar Radiation Map – Carleton Campus

DALHOUSIE CAMPUS MASTER PLAN FRAMEWORK PLAN A.5 SOLAR INVENTORY
A.5.8 JULY 2010
Figure 2-6: Solar Radiation Map – Sexton Campus

APPENDIX A.5 SOLAR INVENTORY
A.5.9IBI GROUP |
DA
LHO
US
IE C
AM
PU
S M
AS
TER
PLA
N
FRA
ME
WO
RK
PLA
N
3 Solar Resource Potential of Campus BuildingsThe suitability of a site for solar energy generation is determined by a number of natural and architectural factors, including topography, landscape, building aesthetic criteria, roof con"guration and façade characteristics. For existing buildings, these factors are considered to estimate the areas of roof, wall and/or site surfaces which can be used for harvesting solar energy, and the net amount of solar radiation that can reach the surfaces.
In the case of roofs, the azimuth and slope affect the maximum theoretical solar gain of a surface. The roof shape and features determine the available surface area, or effective surface, of the roof. The surrounding vegetation, neighbouring buildings, open space and topography in!uence the proportion of the solar radiation reaching the effective surface.
At Dalhousie’s geographic location, a !at surface has an average annual radiation rate of 3.52 kWh/m2/d. A maximum radiation rate of 4.10 kWh/m2/d is achieved for "xed surfaces which are sloped at an angle of 35º to the horizontal, and orientated due south.
The solar suitability rate of a surface is a measure of the value of a surface for solar energy generation; it is de"ned as a ratio of the annual solar gain of the surface to the solar gain of a surface that is orientated to maximize the value. The !at surface has a solar suitability rate of 88%.
Figure 3-1 shows the variation of solar suitability rate with azimuth and slope, speci"c to Dalhousie’s geographic location.
The most southerly facing walls of Dalhousie buildings have an azimuth of between 18º and 22º east of south, the majority being at 18º. The larger buildings are predominantly !at-roofed: approximately 3/4 of the overall roof area is nominally !at, 1/8 is sloped and planar, and 1/8 is curved. The slopes typically vary between 20º (nominally 4:12) and 45º (12:12).
The solar suitability rates of the typical roof and wall elements are described below in Table 3-1.
Figure 3-1: Solar Suitability Rate by Azimuth and Slope
Table 3-1: Solar Suitability Rates, Unobstructed – Dalhousie University
Azimuth (deg)Slope ‘North’ ‘East’ ‘South’ ‘West’(deg) +162 -108 -18 +720 88.0% 88.0% 88.0% 88.0%20 72.8% 81.9% 97.2% 89.6%45 53.7% 71.4% 98.1% 85.2%90 35.1% 50.2% 71.2% 61.9%

DALHOUSIE CAMPUS MASTER PLAN FRAMEWORK PLAN A.5 SOLAR INVENTORY
A.5.10 JULY 2010
The south faces of walls and sloped roofs are signi"cantly more valuable than west- or east-facing slopes. West walls are more valuable than east walls. Also, as indicated by values for the north-facing slopes, diffuse and re!ected radiation are signi"cant to the total solar gain.
Solar suitable surfaces are areas of roofs, walls or landscape which are orientated and available for solar technologies. For this assessment, solar suitable surfaces were considered to include south- or west-facing roof or wall surfaces, or !at roofs, with a minimum dimension of 3.0 m (10’) to accommodate solar equipment.
The 95 buildings included in this assessment have a total roof area of 88,000 m2, of which 45,000 m2 is considered suitable for solar applications. 62 of the buildings have !at roofs of which 41,000 m2 is considered suitable for solar applications. The remaining 4,000 m2 of suitable roof area is derived from sloped roofs, excluding the curved roof slopes of sports buildings.
The buildings have a total wall area of 128,000 m2 of which 15,000 m2 south-facing and 9,000 m2 west-facing walls are considered suitable for solar applications.
Obstructions to solar radiation are critical to solar gain, as illustrated in Figure 2-4 to Figure 2-6 above. Obstructions affect primarily direct radiation through shading, but they also have a signi"cant effect on diffuse radiation.
The effect of obstructions to solar gain at roofs and walls was determined using the virtual "sheye techniques described above and veri"cation by visits to each site. Results are presented in the form of an equivalent loss of suitable surface area.
Results: the Solar Gain on the suitable surfaces, net of obstructions, is summarized in Table 3-2 below.
Table 3-2: Total Annual Radiation on Solar Suitable Surfaces
Area (m2) After Obstructions
Total Annual Radiation
(kWh) After Obstructions
Solar Suitable Roof Surface: 44,142 57,115,721
Solar Suitable Wall Surface: 23,182 22,903,096
TOTAL 80,018,817
4 Solar Star Suitability RatingA SolarStarTM rating system was used to provide a quick reference on the solar resource potential of each building. The system is used here as a "rst step to selecting candidate buildings for solar technologies.
The solar resource potential of each building’s roof and wall surfaces is presented as a percentage of its optimum design value.
For !at roof surfaces, the optimum solar gain is considered to be that for a roof in which 80% of the roof area is available for solar equipment, being unused by skylights and/or mechanical systems.
For sloped roofs, the optimum is considered to be that for a roof in which one half of the roof area faces due south at the optimum slope, and all of this area is available for solar equipment.
For walls, the optimum is considered to include longer wall surfaces facing south in proportion to the ‘golden ratio’ of 1.618, for a given !oor area, and 60% of wall surfaces being available for solar applications.
All surfaces are considered unobstructed.
The results for each building are presented in the following maps, Figure 4-1, Figure 4-2, and Figure 4-3.

APPENDIX A.5 SOLAR INVENTORY
A.5.11IBI GROUP |
DA
LHO
US
IE C
AM
PU
S M
AS
TER
PLA
N
FRA
ME
WO
RK
PLA
N
Figure 4-1: Solar StarTM Rating, Studley Campus.

DALHOUSIE CAMPUS MASTER PLAN FRAMEWORK PLAN A.5 SOLAR INVENTORY
A.5.12 JULY 2010
Figure 4-2: SolarStarTM Rating, Carleton Campus.

APPENDIX A.5 SOLAR INVENTORY
A.5.13IBI GROUP |
DA
LHO
US
IE C
AM
PU
S M
AS
TER
PLA
N
FRA
ME
WO
RK
PLA
N
Figure 4-3: SolarStarTM Rating, Sexton Campus.

DALHOUSIE CAMPUS MASTER PLAN FRAMEWORK PLAN A.5 SOLAR INVENTORY
A.5.14 JULY 2010
5 Solar Energy Generation Potential Solar Water Heating (SWH) systems are used to preheat water for various applications. Most commonly, SWH systems are combined with a conventional heat source to provide domestic hot water.
The key component of SWH technology is the solar collector that converts the sunlight into heat. Types include:
Glazed Flat-Plate Collectors: the collector is contained within an insulated box covered with a sheet of glass. The box contains tubes attached to a metal absorber plate.
Evacuated-Tube Collectors: individual sealed vacuum tubes surround a metal absorber plate.
Unglazed Collectors: rubber or ultraviolet (UV) stabilized polymers are used, mainly for low-temperature applications such as heating residential swimming pools and aquaculture process water.
The most common type of solar collectors used in solar water heaters for medium- and high temperature commercial water heating applications are glazed !at-plate collectors.
Typically, SWH systems for domestic hot water include water storage tanks. The tanks store the solar energy to provide preheating at times of no solar gain; the tanks also limit overheating of the heat exchange !uid and stagnation of the collectors.
The most ef"cient SWH systems currently available have an energy conversion ef"ciency of 40-45% in typical applications.
The solar thermal generation potential of sloped roofs was estimated using a layout to maximize the number of panels on the solar suitable roof areas. For !at roofs, rows of panels were considered as spaced 6.0 m apart to control the effects of mutual shading. To account for typical edge distances, the layouts considered 90% of each roof dimension.
Solar Air Heating (SAH) technology is most widely used to heat ventilation air in buildings, but it has also been applied in processes such as crop drying where heated air is an important requirement. The worldwide demand for this technology has increased rapidly over the past decade. Solar air heating installations are being used in the cladding of south-facing exterior walls.
The system can be used to increase the volume of "ltered fresh air in buildings while reducing heating costs.
Commercially-available solar air heating systems include:
Wall-Mounted Transpired Panel Collectors: a dark-coloured corrugated metal cladding is mounted several inches from the building’s south, east or west wall. The cladding has small perforations which allow outside air to travel through its face. During the day, as outside air passes through the panel, it absorbs the solar heat generated at the panel.
Wall-Mounted Back-Pass Panel Collectors: air is drawn through inlet ports which may receive outdoor or indoor air; the air passes across the interior face of the panel before being introduced to the building’s ventilation system.
Roof-Mounted Collectors: roof-mounted air intake plenums with transpired sections are connected to roof-mounted ventilation systems.
The wall-mounted transpired panel is used as the reference SAH technology for this study. A target system ef"ciency of 68% is recommended.
Solar photovoltaic (PV) power systems are used to convert solar energy into electricity. PV power systems do not have any moving parts and are therefore intrinsically durable. The PV cells commonly use semiconductor materials that allow electrons to be energized by sunlight and freed from their atoms. Once freed, the electrons move through the material, forming an electric current.
Some PV systems provide electricity for immediate use or to store in batteries for later use. Other PV systems feed electricity directly into a utility grid, in which case electricity is drawn from the grid independently of PV generation.
Most commercial building PV systems are in the range of 5 to 50 kW. Systems include:
Flat-plate PV systems: !at-plate panels can be either "xed in place or allowed to track the Sun with solar trackers. These systems are currently most common in solar power supply applications on commercial buildings.
Concentrator PV Systems: relatively inexpensive materials such as plastic lenses and metal housings focus solar energy for conversion to electricity. Building-integrated concentrator system may also generate heat for water or space heating applications.
A !at-plate PV system is used as the reference PV technology for this study. The current PV module ef"ciency is in the range of 15% to 18%. The PV generation potential of the site was estimated using a possible layout of panels on the solar suitable roof areas to maximize the number of panels, similar to that for SWH technologies.
Results: The solar energy generating potential of the existing buildings on campus is summarized below in.
Table 5-1, and is mapped for each building in Figure 5-1, Figure 5-2 and Figure 5-3.
Table 5-1: Total Annual Solar Energy Generation Potential
Area (m2) After Obstructions
Total Annual Radiation (MWh) After
Obstructions
Solar Thermal Generating Potential
(MWh thermal)
Solar Electric Generating Potential
(MWhe)*Solar Suitable Roof Surface: 44,142 57,115 9,400 3,700Solar Suitable Wall Surface: 23,182 22,903 12,600 -TOTAL 80,018 22,000 3,700
* Electrical generation potential would displace solar water heating potential at roof surfaces

APPENDIX A.5 SOLAR INVENTORY
A.5.15IBI GROUP |
DA
LHO
US
IE C
AM
PU
S M
AS
TER
PLA
N
FRA
ME
WO
RK
PLA
N
Figure 5-1: Studley Campus Buildings - Solar Water Heating and Air Heating Potential

DALHOUSIE CAMPUS MASTER PLAN FRAMEWORK PLAN A.5 SOLAR INVENTORY
A.5.16 JULY 2010
Figure 5-1: Studley Campus Buildings - Solar Water Heating and Air Heating Potential

APPENDIX A.5 SOLAR INVENTORY
A.5.17IBI GROUP |
DA
LHO
US
IE C
AM
PU
S M
AS
TER
PLA
N
FRA
ME
WO
RK
PLA
N
Figure 5-2: Carleton Campus - Solar Water Heating and Air Heating Potential
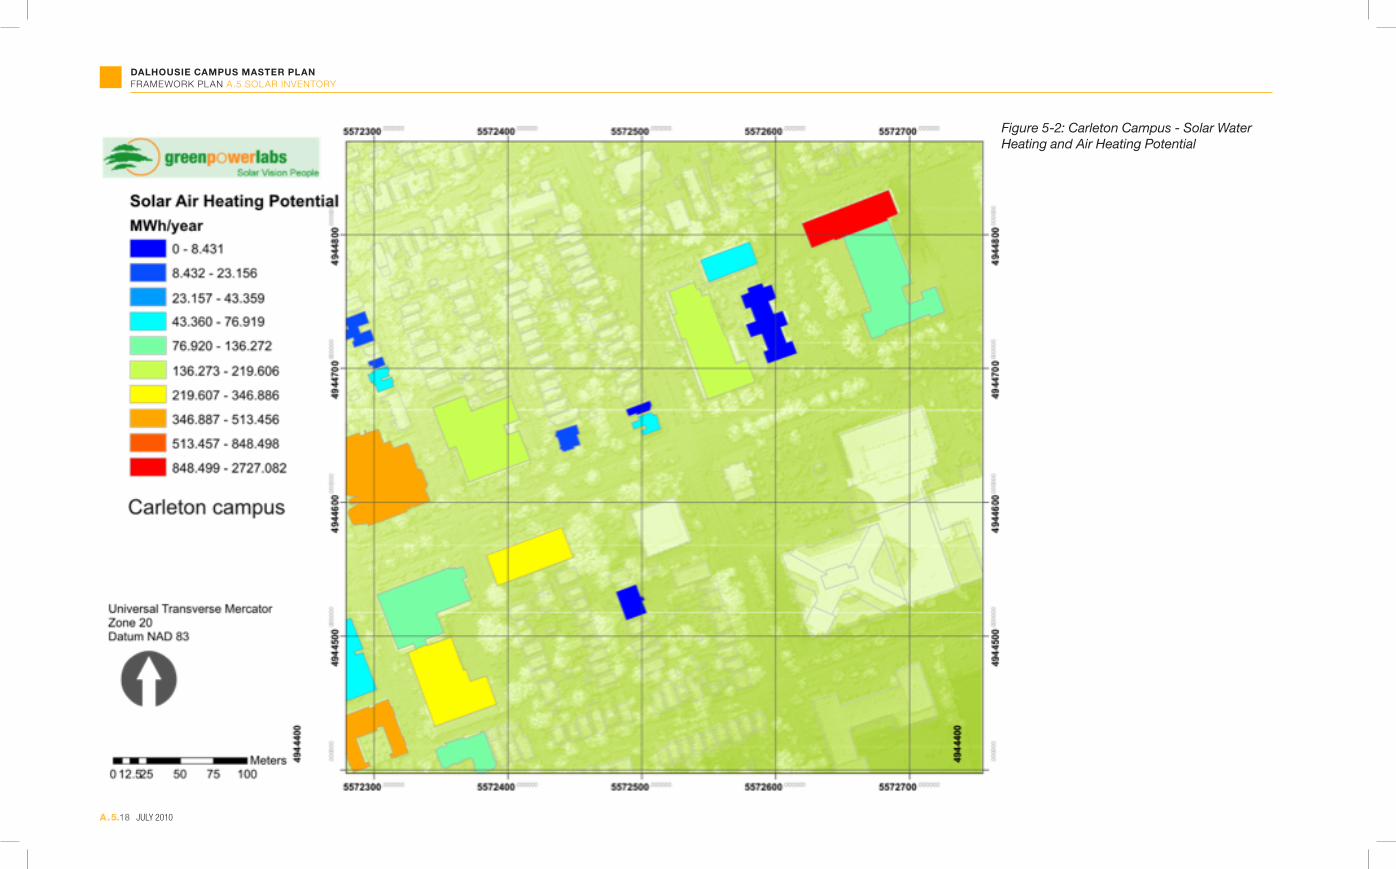
DALHOUSIE CAMPUS MASTER PLAN FRAMEWORK PLAN A.5 SOLAR INVENTORY
A.5.18 JULY 2010
Figure 5-2: Carleton Campus - Solar Water Heating and Air Heating Potential

APPENDIX A.5 SOLAR INVENTORY
A.5.19IBI GROUP |
DA
LHO
US
IE C
AM
PU
S M
AS
TER
PLA
N
FRA
ME
WO
RK
PLA
N
Figure 5-3: Sexton Campus Buildings - Solar Water Heating and Air Heating Potential
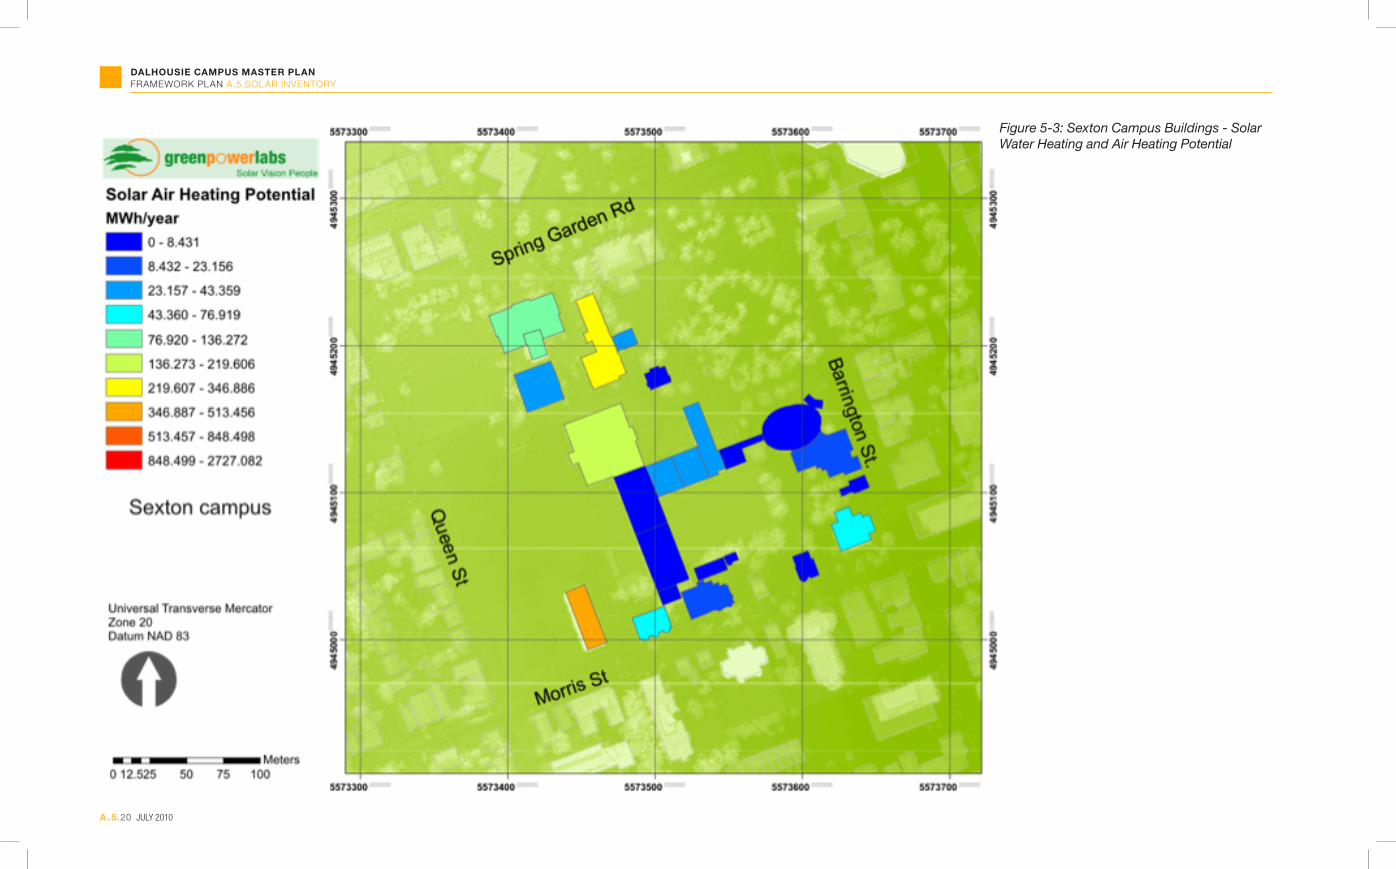
DALHOUSIE CAMPUS MASTER PLAN FRAMEWORK PLAN A.5 SOLAR INVENTORY
A.5.20 JULY 2010
Figure 5-3: Sexton Campus Buildings - Solar Water Heating and Air Heating Potential
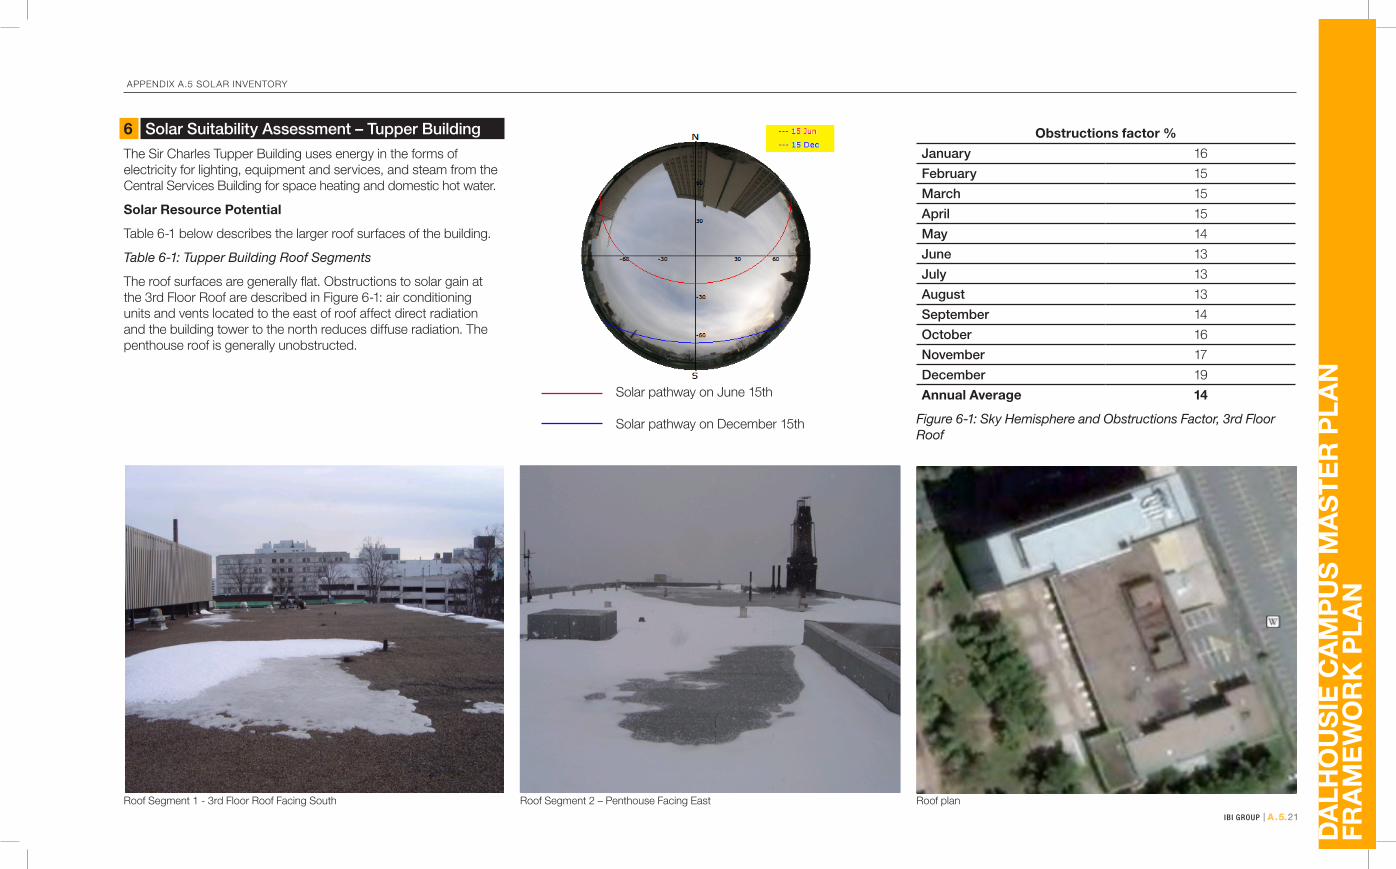
APPENDIX A.5 SOLAR INVENTORY
A.5.21IBI GROUP |
DA
LHO
US
IE C
AM
PU
S M
AS
TER
PLA
N
FRA
ME
WO
RK
PLA
N
6 Solar Suitability Assessment – Tupper Building The Sir Charles Tupper Building uses energy in the forms of electricity for lighting, equipment and services, and steam from the Central Services Building for space heating and domestic hot water.
Solar Resource Potential
Table 6-1 below describes the larger roof surfaces of the building.
Table 6-1: Tupper Building Roof Segments
The roof surfaces are generally !at. Obstructions to solar gain at the 3rd Floor Roof are described in Figure 6-1: air conditioning units and vents located to the east of roof affect direct radiation and the building tower to the north reduces diffuse radiation. The penthouse roof is generally unobstructed.
Solar pathway on June 15th Solar pathway on December 15th
Obstructions factor %January 16February 15March 15April 15May 14June 13July 13August 13September 14October 16November 17December 19Annual Average 14
Figure 6-1: Sky Hemisphere and Obstructions Factor, 3rd Floor Roof
Roof Segment 1 - 3rd Floor Roof Facing South Roof Segment 2 – Penthouse Facing East Roof plan

DALHOUSIE CAMPUS MASTER PLAN FRAMEWORK PLAN A.5 SOLAR INVENTORY
A.5.22 JULY 2010
Typically, solar collector panels are installed in a sloped position to maximize the intensity of the solar resource. A slope of approximately 350 and row spacing of 2.5 times the collector dimension is recommended to maximize year-round energy production. As described in Table 6-2 below, the total solar energy yield for rack-mounted panels is less than the !at-roof condition.
Table 6-2: Solar Yield at Solar Suitable Surfaces
Roof segmentTotal on the roof segment, kWh/d
Annual total energy yield, MWh
1 - !at roof 2,414 881.671 - rack-mounted system 1,772 647.39
2 - !at roof 2,112 771.412 - rack-mounted system 1,551 566.43
Table 6-3 below describes the most suitable wall surface for solar applications.
Table 6-3: Tupper Building Wall Segments
South Wall Segment 1
Notes: Each !oor includes a mechanical room with an air intake grille on the south face of the building. The intake grilles are 1.2 m wide and 2.4 m high; they align directly above each other in the centre of the precast wall.
Air is exhausted by ducts which are led to top of the building.
The following table indicates the average solar energy available at the south-facing wall segment throughout an average year. The increased values in winter months, relative to the fall and summer months, is due to the angle of the Sun in the sky and increased solar re!ection when there is snow. The peaking winter values are important to solar air applications which are used for space heating.
Table 6-4: Tupper Building South Wall Solar Energy Resource Potential
MonthDaily solar energy resource potential
azimuth -19 degrees (kWh/m"/d)January 3.12February 3.81March 3.43April 2.89May 2.70June 2.69July 2.77August 2.96September 3.24October 3.11November 2.44December 2.34Annual 2.95
Energy Consumption
Hot water is used by in Tupper Building’s cafeteria kitchens, washrooms and utility rooms. The water is circulated at an operating temperature of 60OC. The quantity of hot water used is not measured. We estimate hot water consumption to be 2,600,000 L annually, requiring 163 MWh of energy.
Energy requirements for air heating are dependent on the rate of fresh air supply, the outside air temperature and heat content, the required building temperature, building heat losses and building heat sources.

APPENDIX A.5 SOLAR INVENTORY
A.5.23IBI GROUP |
DA
LHO
US
IE C
AM
PU
S M
AS
TER
PLA
N
FRA
ME
WO
RK
PLA
N
The energy required to heat fresh air was estimated to be 417 MWh annually. Our energy modelling used a design fresh air supply !ow rate of 1,200 CFM per !oor, an occupancy rate of 60 persons per !oor, 12-hours daily, Monday-Saturday, an indoor air temperature range of 21-23OC, and a heating season of October to April.
Energy Generation Potential
Solar water heating (SWH) technologies preheat water in combination with a conventional heating source. The Tupper Building includes domestic hot water tanks in the Mechanical Penthouse which are heated by steam from the Central Services Building. The SWH system will pre-heat water supplied to these tanks. We recommend the detailed consideration of a system with 40 collectors and 3,600 L of storage. The collector system would constitute four sets of ten-collector arrays mounted on racks on the most convenient segment of roof. Roof Segment 2 is proposed.
The solar energy delivered by the proposed system is described in Table 6-5 below.
Table 6-5: Tupper Roof Segment 2 SWH Heating Delivered by Month
Month
Heating delivered (MWh) before obstructions
Obstruction Factor
Heating delivered (MWh) after obstructions
January 3.44 0.0% 3.44February 4.74 0.0% 4.74March 6.63 0.0% 6.63April 6.86 0.0% 6.86May 7.66 0.0% 7.66June 7.91 0.0% 7.91July 8.16 0.0% 8.16August 7.66 0.0% 7.66September 6.65 0.0% 6.65October 5.25 0.0% 5.25November 2.93 0.0% 2.93December 2.30 0.0% 2.30Annual Total 70.19 0.0% 70.19
The system’s characteristics are described below in Table 6-6.
Table 6-6: Tupper Building - SWH System Performance
40-collector, 3600 L storage SWH systemSWH system capacity kWth 75.3Speci#c yield (1) kWh/m# 522Energy Delivered MWh/year 70.19Solar fraction 42.9%Greenhouse Gas Reduction te CO2/year 29
Budget $220,000Nova Scotia Solar Water Heating Rebate $20,000-$33,000
ecoENERGY for Renewable Heat (Federal incentive)
$33,800
Financial Payback Period (2) years 12
1. Speci"c yield is the amount of energy delivered annually per unit of gross collector area after obstructions.
2. Return on Investment: our analysis considered the following:
• No.6 oil price $ .70 /L
• Average ef"ciency of distributed energy system 65%
Annual increase in oil price: 10%.
The proposed Solar Air Heating (SAH) application is to pre-heat air for the HVAC systems at each !oor.
The system provides more energy at less cost than solar water heating.
A wall-mounted transpired panel is proposed, centred on the existing intake louvres and running the full height of the South Wall, as illustrated in Figure 6-2. The proposed panel is supported 200-300 mm from the precast surface; the framing is connected through the precast concrete panels to the building structure at each !oor. A panel width of 5.6 m (18’) is recommended. The system’s characteristics are described below in Table 6-7.
Figure 6-2: Tupper Building South Wall with Solar Air Heating Panel
Table 6-7: Tupper Building – Solar Air Heating System Performance
5.6 m wide SAH systemEnergy Delivered MWh/year 125.85 Solar fraction 30%Greenhouse Gas Reduction te CO2/year 51.8budget $156,000Nova Scotia Solar Water Heating Rebate $20,000
ecoENERGY for Renewable Heat (Federal incentive) $18,800
Financial Payback Period (1) years 6.5
(1) See Table 6-6 footnotes.

DALHOUSIE CAMPUS MASTER PLAN FRAMEWORK PLAN A.5 SOLAR INVENTORY
A.5.24 JULY 2010
7 Solar Suitability Assessment – Killam LibraryThe Killam Memorial Library uses energy in the form of steam from the Central Services Building for space heating and domestic hot water heating. Electricity is used for lighting, equipment and services.
The building includes a "ve-storey atrium which provides an interior courtyard and natural light to the surrounding building. The building was constructed in the mid-1960’s; the courtyard was enclosed by a translucent roof in the late 1990’s.
Solar Resource Potential
Table 7-1: below identi!es two of the larger roof surfaces of the building.
Table 7-1: Killam Library Roof Segments
Notes: Roof surfaces are generally !at and unobstructed. The single major obstruction is the atrium roof, which is approximately 1.2 m – 2.4 m above the original roof.
The two roof segments selected represent approximately half of the roof area. Table 7-2 below indicates the total solar energy yield for collector panels in the !at position and for arrays of rack-mounted panels sloped at 35O. Collectors in Roof Segment 1 are orientated 19O east of due south; collectors on Roof Segment 2 are orientated due south.
Table 7-2: Solar Yield at Solar Suitable Surfaces
Roof segmentDaily Solar radiation intensity
kWh/m"/d)Total on the roof segment,
kWh/dAnnual total energy yield,
MWh1 - !at roof 3.52 3,168 1,157.111 - rack-mounted system 4.04 2,326 849.642 - !at roof 3.39 2,179 795.752 - rack-mounted system 3.93 1,616 590.41
Roof Segment 1 - West Side of Roof Roof Segment 2 - South Side of Roof Roof plan

APPENDIX A.5 SOLAR INVENTORY
A.5.25IBI GROUP |
DA
LHO
US
IE C
AM
PU
S M
AS
TER
PLA
N
FRA
ME
WO
RK
PLA
N
For solar air heating applications, Table 7-3 below describes the most suitable wall surface for solar applications.
Table 7-3: Killam Library South Wall
Notes: "ve-storey structure; large areas clad with precast concrete panels; upper sections are "nished in structural concrete. Two central HVAC rooms: above the Fifth Floor west side, and basement-level Mechanical Rooms. Air intakes are on west side above "fth !oor and at ground level in the courtyard.
As with the Tupper Building, the maximum available daily solar gain over an average year is 2.98 kWh/m#/d. For the heating period under investigation (October to April) the average daily gain at the south wall of the Killam Library is 3.02 kWh/m#/d.
Energy Consumption
Hot water is used by the Killam Library for cafeteria sinks, washrooms and cleaning. The domestic hot water consumption was estimated to be 1,168,000 L annually, requiring 72.8 MWh of energy.
The energy required to provide fresh air and heat the space was estimated to be 700 MWh annually, using minimum standards for fresh air supply.
Energy Generation Potential
The Killam Library includes domestic hot water tanks in the basement-level Mechanical Room which are heated by steam from the Central Services Building. The solar water heating system will pre-heat water supplied to these tanks. We recommend a system with 20 collectors and 1,800 L of storage for budgeting purposes, and that hot water use is measured as part of the system design.
Table 7-4: Killam Library - SWH System Performance
20-collector, 1800 L storage SWH systemSWH system capacity kWth 37.7Speci#c yield (1) kWh/m# 590Energy Delivered MWh/year 33.9Solar fraction 46.5%Greenhouse Gas Reduction te CO2/year 14.1budget $96,000Nova Scotia Solar Water Heating Rebate $14,400
ecoENERGY for Renewable Heat (Federal incentive) $16,900
Financial Payback Period (1) years 10.5
(1) See Table 6-6 footnotes.
The proposed solar air heating system will:
• increase the amount of fresh air to the building;
• de-stratify air in the atrium; and
• pre-heat the air that is drawn into the basement-level air handling system.
A transpired collector panel is recommended on the south wall, connected to the roof of the atrium by a roof-top duct and fan. The solar-warmed air will mix with air in the atrium roof area, causing air to be circulated downward to the !oor of the courtyard and into the mechanical HVAC system.
The solar air heating system was evaluated for a !ow rate of 6,000 CFM, which is estimated to be 1/3 – 1/2 of the total fresh air requirement for the building, or one air change in the atrium every 40-45 minutes.
The air heating panel will be centred over the in-situ concrete wall at the top !oor of the South Elevation. The design dimensions of the panel are illustrated in Figure 7-1; architectural requirements would determine the "nal shape, colour(s) and possible use of the panel for signage.
Figure 7-1: Killam Library South Wall with Solar Air Heating Panel (Concept)
While not investigated in this study, a similar panel may be used on the west wall to preheat air entering the penthouse-level HVAC system.
The system’s characteristics are described below in Table 7-5.
Table 7-5: Killam Library – Solar Air Heating System Performance
125 m2 SAH systemEnergy Delivered MWh/year 90.2 Solar fraction 39%Greenhouse Gas Reduction te CO2/year 38.7budget $110,000Nova Scotia Solar Water Heating Rebate $16,500
ecoENERGY for Renewable Heat (Federal incentive) $8,000
Financial Payback Period (1) years 5.5
(1) See Table 6-6 footnotes.

DALHOUSIE CAMPUS MASTER PLAN FRAMEWORK PLAN A.5 SOLAR INVENTORY
A.5.26 JULY 2010
8 ConclusionsThe solar suitability assessment investigated the suitability of the University facilities and open areas to solar energy, and offers recommendations and examples for using solar energy technologies in the University’s energy mix.
The solar resource is quanti"ed using a combination of surface weather station information and satellite data for the geographic area.
Maps are presented for the Studley, Carleton and Sexton campuses describing solar gain and the effect of shading by obstructions to sunlight.
A SolarStarTM rating is used to identify the buildings most suited for solar applications.
Current technologies for solar water heating, solar air heating and photo-voltaic power generation are presented and discussed.
The generating potential of solar water heating and solar air heating on campus is mapped for each building.
The solar resource and generating potential of buildings is summarized in Table 8-1.
Table 8-1: Total Annual Solar Energy Generation Potential
Area (m2) after Obstructions
Total Annual Radiation (MWh)
Solar Thermal Generating Potential
(MWhth)
Solar Electric Generating Potential
(MWhe)*Solar Suitable Roof Surface: 44,142 57,115 9,400 3,700Solar Suitable Wall Surface: 23,182 22,903 12,600 -TOTAL 80,018 22,000 3,700
* Electrical generation potential would displace solar water heating potential at roof surfaces
Solar energy technology could replace 20% of the heating energy that is currently provided by the central heating plant.
Building-mounted solar electrical generation could provide approximately 5% of the University’s electrical needs.
Solar suitability assessments were carried out on the Sir Charles Tupper Building and the Killam Memorial Library. The buildings provide signi"cant opportunities for using renewable energy technologies to displace the use of fossil fuel: solar water heating and air heating technologies have the capacity to deliver 40-50% of the buildings’ domestic hot water needs and 30-40% of the buildings’ space heating energy needs.
At both sites, solar air heating provides more energy at less cost than solar water heating.
9 BibliographyASHRAE 62.1-2004. (2004). Ventilation for Acceptable Indoor air Quality. Atlanta, GA: American Society ofHeating, Refrigerating and Ai- Conditioning Engineers.
Canada, N. R. (2003). Commercial Solar Water Heating Systems.
Conserval Engineering Inc. SolarWall Systems http://solarwall.com/en/home.php. Toronto ON: Conserval Engineering Inc.
Dalhousie Unversity Facilities Management. (2009). Annual Electrical Consumption (NSPI Meter ION 8600). Halifax, NS: Dalhousie University.
EnerCan. (2008). RETScreen 4 modelling software. Ottawa, Ont.
EnerWorks Inc. Commercial and Industrial Solutions. (www.enerworks.com). Dorchester, ON: EnerWorks Inc.
Green Power Labs Inc. (2008). calculations - Long-Term Health Care Homes (three locations). Dartmouth, NS: N/A.
Marbek Resource Consultants. (2008). ecoENERGY for Renewable Heat - Basis of Payment and Level of Incentives for ecoEnergy for Renewable Heat Program. Ottawa ON: Canada - ecoENERGY.
Matrix Energy. Matrix Air Systems http://www.matrixenergy.ca/front.html. Montreal PQ: Matrix Energy.
RETScreen International. (2008). Solar Air Heating - RETScreen Software http://www.retscreen.net/ang/g_solara.php. Ottawa ON: Natural Resources Canada.
Thermo Dynamics Ltd. Thermo Dynamics Ltd: Solar Heating. www.thermo-dynamics.com. Dartmouth, NS: Thermo Dynamics Ltd.


APPENDIX B.1
LEARNING COMMONS HUBSB.1
DA
LHO
US
IE C
AM
PU
S M
AS
TER
PLA
N
FRA
ME
WO
RK
PLA
N

The HUB ConceptDesign Guidelines for Dalhousie University Learning Commons HUBS
April 2010
is the ‘classroom of the future’
the library_

Contents : Why the HUB Concept is Important ................................. 2
Map of HUB Locations on Dalhousie Campus ................. 3
Concentrate Resources ............................................ 5 Incorporate Innovative Technology ........................... 6 Promote Social Synergy ........................................... 7 Maximize Flexibility ................................................... 8

Why the HUB Concept is Important : Dalhousie University’s campus master plan has articulated a vision of creating four Learning Commons Hubs across the campus to address the changing nature of education and encourage idea exchange among students. This plan is recognition of Dalhousie’s facilities as strategic resources with the potential to advance both their mission and competitive advantage. With each passing year, higher education is facing new trends and universities are challenged by an evolving array of external forces, including advances in technology, emerging new user needs, and increasing demands for real-world learning environments.
a result, institutions throughout the world are developing long-term strategic plans for available resources including capital, people, technology, information and, of particular importance, facilities. “Learning Hubs” are emerging as a design concept that provides
but rather allow students to coherently communicate ideas, concepts, and arguments using a variety of mediums. The proposed Learning Commons Hubs at Dalhousie are envisioned as collaborative centres with integrated resources and technology that support the increasingly mobile student work patterns and encourage group synergies to occur outside of more formal classroom environments.
2

QUADLEARNINGCOMMONS
LSCLEARNINGCOMMONS
DOWNTOWNDOWNTOWN
HEALTH SCIENCES LEARNINGCOMMONS
LEARNINGCOMMONS

The Learning Commons Hubs at Dalhousie are intended to provide innovative learning spaces beyond the classroom to support interdisciplinary and group study and promote social interaction.The Learning Commons Hubs are spaces focused on students but essentially designed to include everyone with an overarching objective of encouraging mingling between students, faculty, staff and the surrounding community. Much like a lobby in a hotel, these Learning Commons Hubs should act as a welcoming entrance to the facility, establish a sense of place, and provide an
environments and information centres that provide access to a wide range of opportunities and accommodate different styles
resources and support. While a common philosophy will set the parameters for the designs, the Learning Commons Hubs are not intended to have identical design outcomes.
Concentrate Resources
Incorporate Innovative Technology
Promote Social Synergy
Maximize Flexibility
4

Concentrate Resources : The Learning Commons Hub will contribute meaningful elements of interest while simultaneously providing seamless points of access to information resources and support services.
Create an environment that draws people in by providing valuable resources, particularly ones that facilitate learning.Some examples of possible elements that demonstrate this
One-stop Reference and Help Desk (information, ITS, research, orientation, student services) Supplementary library servicesStudent Society space/desk (shared)
Self-prep food area (microwave, hot water)Vending machinesPersonal or project-based locker storageWashrooms (and possibly shower facilities)Short-term child careExhibition / gallery space Space for faculty to be available / conduct seminars
5

In recognizing that the digital age has irrevocably affected both the learning and teaching process with technology emerging as a primary tool of education, a sophisticated technological infrastructure is an integral attribute of the Learning Commons Hubs.
Interior public spaces present an opportunity to incorporate innovative technology into campus design. Some examples of
Digital information screens, posting areasPrinters and copiersElectronic plug outletsWireless or plug-in internet accessPlug and play display monitors or projectorsInteractive, touch sensitive screens
Computers labsKVM switch (keyboard, video or video display unit, mouse)Video conferencing
6
is the ‘classroom of the future’
the library_

The Learning Commons HUBs will facilitate socialization and interdisciplinary interaction as a valuable component of the learning experience.
Create a learning community that expands the learning experience from the classroom to other learning contexts. Some examples of possible elements that
Welcoming entrance to the building, the gathering lobby and help desk, etc.Transparency (reduce barriers & intimidation;; “people attract people”)
arrangements)Entertainment (climbing wall, educational games, music room, TVs)Health and well-being (natural light and ventilation)Capability to host events (alumni, student societies, guest lectures)
7

Maximize Flexibility : Learning Commons Hubs to accommodate a variety of functions and activities while minimizing potential barriers for future possibilities.
Space expansion capacityNo walls or easily moveable wallsInnovative acoustical / sound barriers
Environmental controlsUniversal design principles / barrier-free accessFacilitates group learning (variety of group study spaces & large work surfaces)Extended or continuous hours of operation / access
8

IBI Group is a multi-disciplinary consulting organization o!ering services in four areas of practice Urban Land | Facilities | Transportation | Systems Technologies
www.ibigroup.com
is the ‘classroom of the future’
the library_


APPENDIX B.2
ATHLETICS & RECREATION PROGRAMB.2
DA
LHO
US
IE C
AM
PU
S M
AS
TER
PLA
N
FRA
ME
WO
RK
PLA
N

B.2.1IBI GROUP |
DALHOUSIE UNIVERSITY FRAMEWORK PLANAPPENDIX B.2 - REVIEW OF ATHLETICS & RECREATION PROGRAMS JULY 2010
DA
LHO
US
IE C
AM
PU
S M
AS
TER
PLA
N
FRA
ME
WO
RK
PLA
N
Executive Summary Universities across Canada averaged a 0.6 percent growth in enrolment during the 2007-2008 academic year. The previous year also saw a relatively small increase in university enrolment (0.9 percent). These two years are notable departures from the steady increase of 2.9 percent in university enrolment over the last ten years. The swelling ranks of student populations have put additional demands on the university infrastructure, in particular athletic and recreation programming and facilities.
The purpose of this study is to review !tness and athletic trends for the purposes of informing the master planning process at Dalhousie University. This is undertaken through a literature review of athletic/!tness trends and a comparative review of athletics and recreation programs and facilities, as well as usage and revenue generation.
The study is organized into three sections. The !rst section reviews !tness and athletics trends literature. The second section is a comparative analysis of select universities including Dalhousie that details participation in formal (varsity, club teams) and informal (drop-in recreation, intramurals) recreation. The third section provides a summary of !ndings. An appendix contains tables listing speci!c information for each of the six universities in the comparison of facilities, use, varsity teams, drop in recreation, club sports, wellness and !tness, and facilities.
It should be noted that the comparative review did not produce homogeneous results. The statistical information regarding these topics varied greatly between universities and affected the results of the comparative analysis. The universities surveyed have different operating models, departmental structures, reporting structures, and policies. These differences pose challenges to comparing the athletics and recreation programs. In addition, there was varying degrees of available information pertaining to public use of facilities. Generally the public use of the recreational facilities varied and no space standards exist to assist programming for public use. However, the most notable !nding regarding public use of the recreational facilities was the generation of revenue through this use.

DALHOUSIE CAMPUS MASTER PLAN FRAMEWORK PLAN
B.2.2
B.2 REVIEW OF ATHLETICS & RECREATION PROGRAMS
JULY 2010
Introduction and PurposeThe purpose of this study is !rst to examine !tness industry trends to gain an understanding of potential future student demands for athletic/!tness facilities, and second, to provide a comparative review of athletic and recreation programs and users in six Canadian universities.
The !rst section of the report is a literature review of !tness trends. The literature is drawn from the American College of Sports Medicine, American Council on Exercise, and Statistics Canada. The information pertains mainly to 2009 !tness trends and Canadian participation in sport.
The second section of the report provides a comparative overview of athletic and recreation programs and facilities available at the following Canadian universities:
• Dalhousie University • McGill University • Memorial University• Queen’s University• University of New Brunswick (Fredericton)• University of British Columbia (Vancouver)
A pro!le was developed for each university that lists the recreational activities available to students (varsity team sports, sports clubs, and intramurals), total number of participants in each type of recreational activity, wellness and !tness programming, recreational facilities, and new recreational facilities. Where available data pertaining to the public use of the recreational facilities, space utilization and revenue generation, is presented.
Section 1: Review of Fitness Industry Trends Literature Fitness trends are sensitive a number of variables. These variables include: levels of disposable income, new !tness technologies (equipment and routines), participation in sports, the media, and the development of niche markets. Consequently, changes in the variables, such as levels of disposable income, will in"uence annual !tness trends.
1.1 Fitness Trends for 2009 The American College of Sports Medicine (ACSM) is a sports medicine and exercise science organization with international, national and regional membership of 20,000. For the past four years (2007-2010) ACSM has published a survey of its members to determine future !tness trends. The report introduction notes that the purpose of the survey is to capture annual trends and that it is normal and even expected that the same trends would appear for multiple years in a trends survey.
In late 2009, the American College of Sports Medicine (ACSM) undertook a survey of 9,9889 of ACSM certi!ed professionals (personal trainers, health/!tness instructors, health !tness experts, exercise specialists, health/!tness directors and program directors) to determine the top worldwide !tness trends for 2010.
The !tness trends for 2010 con!rmed !ndings from the 2008 and 2009 surveys. Six of the top ten !tness trends have perpetuated through the 2008, 2009 and 2010 surveys (see Table 1). The remaining four !tness trends have shifted over the three years from stabilization activities (balance training, yoga, pilates, and stability ball) to including more directed !tness/sport related activities (functional !tness, sport-speci!c training, and group personal training).
Table 1: Top 10 Worldwide Fitness Trends 2008, 2009, 2010
2008 2009 2010
1. Educated and experienced !tness 1. Educated and experienced !tness 1. Educated and experienced !tness
2. Children and obesity 2. Children and obesity 2. Children and obesity
3. Personal training 3. Personal training 3. Personal training
4. Strength training 4. Strength training 4. Strength training
5. Core training 5. Core training 5. Core training
6. Special !tness programs for older adults 6. Special !tness programs for older adults 6. Special !tness programs for older adults
7. Pilates 7. Pilates 7. Functional !tness
8. Functional !tness 8. Stability ball 8 Sport-speci!c training
9. Stability ball 9. Sport-speci!c training 9. Pilates
10. Yoga 10. Balance training 10. Group personal training
Source: American College of Sports Medicine, 2009.
Upon the completion of the survey a group of internationally recognized experts in the !elds of health and !tness were asked to comment on the !ndings.

B.2.3IBI GROUP |
APPENDIX B.2 - REVIEW OF ATHLETICS & RECREATION PROGRAMS JULY 2010
DA
LHO
US
IE C
AM
PU
S M
AS
TER
PLA
N
FRA
ME
WO
RK
PLA
N
1.2 American Council on Exercise: Fitness Trend PredictionsThe American Council on Exercise (ACE) is one of the largest non-pro!t !tness certi!cation, education, and training providers in the world. ACE has been conducting surveys of its worldwide network of personal trainers, group !tness experts, advanced health and !tness specialists and lifestyle and weight management consultants since 1999.
For comparative purposes the results of the 2008, 2009, and 2010 !tness trends are included in Table 2. While there are some similarities between the two years, there are also differences. Most notably is the shift towards exercise that required little or no equipment. ACE attributes this simpli!cation of !tness programs to a decline in disposable income pertaining to the economic recession.
Table 2: ACE Fitness Trends, 2008, 2009, and 2010
ACE Most Popular Fitness Trends in 2008 ACE Most Popular Fitness Trends in 2009 ACE Most Popular Fitness Trends in 2010
1. Out of the box workouts 1. Boot camp style workout 1. Cost-conscious workouts at !tness clubs and at home
2. Body weight and equipment free workouts 2. Budget friendly workouts 2. Group training
3. Event or sports speci!c programming 3. Specialty classes 3. Time ef!cient workouts for the time pressured American
4. Boomer !tness focus 4. Getting back to basics 4. Exergaming
5. Focused express workouts 5. Circuit training 5. Boomer-speci!c programs
6. Total wellness programming 6. Kettlebells 6. Functional training workouts
7. Hybrid programming 7. Boomer !tness 7. Health and !tness awareness
8. Personal training 8. Technology based !tness 8. Importance of proper professional credentials
9. Technology based workouts 9. Event or sport speci!c exercises 9. Specialty exercise classes
10. Functional strength training 10. Mixing it up 10. Fitness training tools
Source: American Council on Exercise. “Fitness Trend Predictions.” 2008, 2009, 2010.

DALHOUSIE CAMPUS MASTER PLAN FRAMEWORK PLAN
B.2.4
B.2 REVIEW OF ATHLETICS & RECREATION PROGRAMS
JULY 2010
1.3 Sport Participation in Canada, 2005In 2004, as part of the General Social Survey, Statistics Canada produced a report that analyzed Canadian participation in sport. The survey detailed many aspects of participation in sport (activities, rates of participation across age groups and gender, socio-economic factors that contribute to participation in sports, and the rationale for sports participation). However, due to the breadth of the report, only the most relevant sections have been noted herein.
Statistics Canada has found a relationship between educational attainment and participation in organized sport. Persons with university educational attainment levels are much more likely (33 percent) to participate in organized sports than persons with a high school education (25 percent). Figure 1 captures sport participation across levels of education attainment for 1998 to 205. Figure 1 also captures the decline in the number of Canadians participating in sports from 1998 (34 percent) to 2005 (28 percent).
Figure 1: Sport Participation Rates by Level of Education, 1998 and 2005
Source: Statistics Canada, 2005.
Students have the highest participation in sport than any other group in Canadian society. However, this rate has fallen from 68 percent in 1998 to 51 percent in 2005.
Figure 2: Participation Rates by Labour Force Status, 1992, 1998 and 2005
Source: Statistics Canada, 2005.
Of the Canadians surveyed, 73 percent indicated that relaxation was the most bene!cial outcome of participating in sports. This was followed closely by physical health and !tness at 68 percent. Improvement in social networks by meeting new friends/acquaintances ranks as least important at 34 percent.
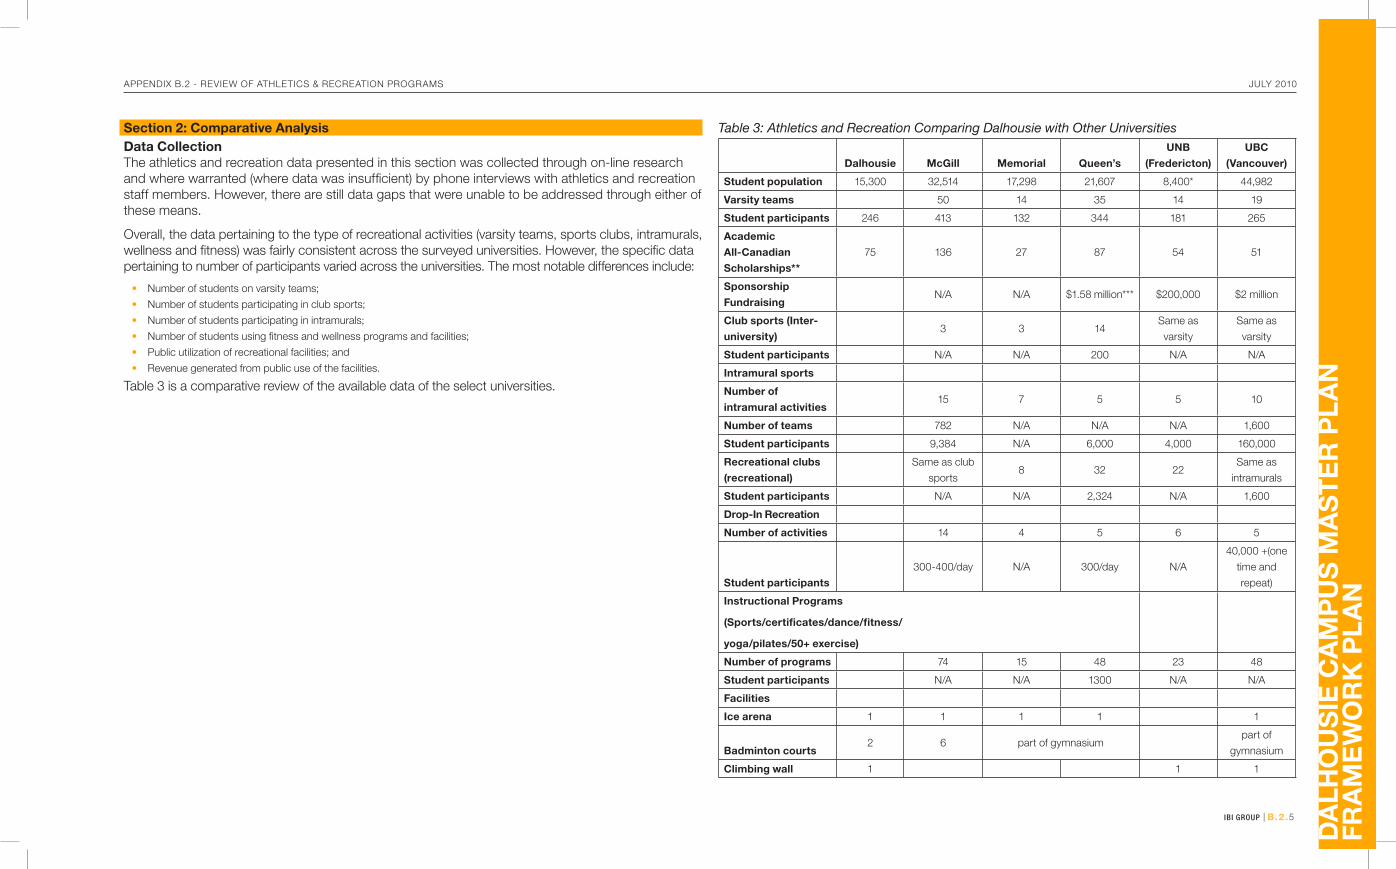
B.2.5IBI GROUP |
APPENDIX B.2 - REVIEW OF ATHLETICS & RECREATION PROGRAMS JULY 2010
DA
LHO
US
IE C
AM
PU
S M
AS
TER
PLA
N
FRA
ME
WO
RK
PLA
N
Section 2: Comparative AnalysisData Collection The athletics and recreation data presented in this section was collected through on-line research and where warranted (where data was insuf!cient) by phone interviews with athletics and recreation staff members. However, there are still data gaps that were unable to be addressed through either of these means.
Overall, the data pertaining to the type of recreational activities (varsity teams, sports clubs, intramurals, wellness and !tness) was fairly consistent across the surveyed universities. However, the speci!c data pertaining to number of participants varied across the universities. The most notable differences include:
• Number of students on varsity teams;• Number of students participating in club sports;• Number of students participating in intramurals;• Number of students using !tness and wellness programs and facilities;• Public utilization of recreational facilities; and • Revenue generated from public use of the facilities.
Table 3 is a comparative review of the available data of the select universities.
Table 3: Athletics and Recreation Comparing Dalhousie with Other Universities
Dalhousie McGill Memorial Queen’s UNB
(Fredericton)UBC
(Vancouver)
Student population 15,300 32,514 17,298 21,607 8,400* 44,982
Varsity teams 50 14 35 14 19
Student participants 246 413 132 344 181 265
Academic All-Canadian Scholarships**
75 136 27 87 54 51
Sponsorship Fundraising
N/A N/A $1.58 million*** $200,000 $2 million
Club sports (Inter-university)
3 3 14Same as varsity
Same as varsity
Student participants N/A N/A 200 N/A N/A
Intramural sports
Number of intramural activities
15 7 5 5 10
Number of teams 782 N/A N/A N/A 1,600
Student participants 9,384 N/A 6,000 4,000 160,000
Recreational clubs (recreational)
Same as club sports
8 32 22Same as
intramurals
Student participants N/A N/A 2,324 N/A 1,600
Drop-In Recreation
Number of activities 14 4 5 6 5
Student participants300-400/day N/A 300/day N/A
40,000 +(one time and repeat)
Instructional Programs
(Sports/certi!cates/dance/!tness/
yoga/pilates/50+ exercise)
Number of programs 74 15 48 23 48
Student participants N/A N/A 1300 N/A N/A
Facilities
Ice arena 1 1 1 1 1
Badminton courts2 6 part of gymnasium
part of gymnasium
Climbing wall 1 1 1

DALHOUSIE CAMPUS MASTER PLAN FRAMEWORK PLAN
B.2.6
B.2 REVIEW OF ATHLETICS & RECREATION PROGRAMS
JULY 2010
Dalhousie McGill Memorial Queen’s UNB
(Fredericton)UBC
(Vancouver)
Dance studio 1 1 1
Dojo 1
Fields 2 2 4 2 7
Field House 1 (3 gyms) 1
Fitness centre 2 1 1 1 1 1
Gymnasium 2w 1 3 3 2 3
Indoor !eld 1
Pool 1 1 1 1 1 2
Racquetball courts 1 2 3
Track (indoor) 1 1 1 1
Stadium 1 1 1 1
Squash courts 7 13 3 7
Tennis courts (outdoor)
2 4 2
Tennis courts (indoor)
4 4
Public utilization of facilities
80% public use non-academic term/20% academic
term
The Works Centre 90% public; The Field House 90% student
use
N/A N/A
90% public use non-academic term/10% academic
term
Public and student use of facilities
3000 daily visits
30,000 weekly visits to the
Aquarena and Field House
PEC 80,000 visits/month
N/A
Revenue from public use
N/A N/A N/A N/A N/A
Recent capital investments
FacilityN/A
Field House (opened in
2002)
Queen’s Centre
Chapman !eld (all weather
turf and dome)
Thunderbird winter sports centre (arena)
Cost N/A $13 million $26 million $1.7 million $38.5 million
Year openedN/A 2002
under construction
2007 2008
Dalhousie McGill Memorial Queen’s UNB
(Fredericton)UBC
(Vancouver)
* Student population in 2006/07
** Academic All-Canadians CIS Academic All-Canadian certi!cates are presented annually to student-athletes who have achieved an academic standing of 80% or better while playing on one of their university’s varsity teams.
** Includes facility rentals

B.2.7IBI GROUP |
APPENDIX B.2 - REVIEW OF ATHLETICS & RECREATION PROGRAMS JULY 2010
DA
LHO
US
IE C
AM
PU
S M
AS
TER
PLA
N
FRA
ME
WO
RK
PLA
N
Section 3: Summary of Findings & conclusions The summary of !ndings from the literature review and comparative analysis include:
• Fitness trends for 2010 suggest that exercises with little to no equipment are most highly demanded. Fitness activities that use little or no equipment include activities such as pilates and boot camp. This suggests that consumers have a price sensitivity during economic recessions, but that participation in !tness persists during these periods.
• The Statistics Canada report suggests that a person with a university degree is more likely to participate in sport than a person with lower levels of educational attainment. As a result facilitating sport participation in university will help to create a healthier population across Canada.
• The Statistics Canada study notes that there has been a decline in sports participation across Canada, but students continue to be the largest group that participate in sports across the labour force. Therefore, there continues to be a strong demand for athletics and recreation facilities at universities.
• The Statistics Canada study reveals that survey participants engage in sports primarily to promote relaxation. This is an important consideration for university administrators as university can be stressful time for students. As a result students should have access to adequate facilities.
• The universities surveyed indicated that the increase in student enrolment has not resulted in a commensurate increase in athletics facilities. As a result the demand for athletics facilities outstrips the supply. All of the universities surveyed noted that their athletics facilities were insuf!cient to satisfy the demands of students let alone to satisfy the demand from the community at large. While capital investments have been made at some universities they have only partially alleviated the demand for student athletics and recreation spaces For example, at Queen’s University intramurals teams meet on a ten to fourteen day cycle and not weekly, as they did in the past.
• Student populations do not have a direct bearing on the number of varsity teams offered at the universities. For example, UNB Fredericton has the same number of varsity teams as Memorial University even though it has less than half of the student population. McGill University has the most varsity teams, but it has a smaller student population than UBC which has less than half of McGill’s varsity teams.
• The Academic All-Canadian Scholarship does not directly correlate to the size of the varsity programs. For example, 33 percent of McGill University varsity athletes were awarded an All-Canadian Scholarship and 29 percent of University of New Brunswick varsity athletes were awarded an All-Canadian Scholarship. There are over twice as many varsity athletes at McGill University than the University of New Brunswick.
• Intramural sports varied between the schools, with some schools having fewer intramural sports and more sports clubs.
• The data on public use of the recreational facilities varied: - McGill – summer 80 % public use of facilities, winter 20% public use of
facilities. - Memorial – the Works Centre 90% public, The Field House 90% student use.
- Queen’s – not available. - UBC – 90% public use non-academic term/10% academic term. - UNB – no data exists; this data is not collected by the university.
The data on revenue generated from public use was generally not available. This directly relates to the budgeting process of the universities. The available data includes:
- McGill – would not disclose. - Memorial – not available. - Queen’s – approximately 25% of the 6.3 million is derived from revenue
generation (this data includes many other components; more speci!c data has been requested).
- UBC – not available. - UNB – not available.
• The universities surveyed employ different operating and !nancial models. - At Memorial University the Aquarena (!tness centre, pool, and arena) and
the Field House are under the management of a separately incorporate entity, The Works. The Aquarena was constructed in 1989 and the Field House opened in 2002. The Works did not !nance the capital costs of either facility. The Field House was constructed with funds raised during an alumni capital campaign in 2000. This entity operates the Aquarena and Field House, has a separate board of directors, and directly reports to the president of Memorial. However, The Works does not operate like a line department in that it is not a part of the university per se. The Works has an annual operating budget of $5.5 million. This is generated through a University subsidy ($396,000), City of St. John’s subsidy ($125,000), student recreation fees ($1.25 million), and through public programs ($3.7 million). Prior to the current operating model the City had operated the Aquarena until 1995 and then the University operated it until 2002. Both the City and the University contributed approximately 70 percent to the operating budget. Under the current operating model the University now contributes less than 10 percent to the total operating budget. The City contributes a subsidy to The Works because there are no public facilities within the same area that have a 65m pool. As part of the management agreement The Works is entitled to retain any additional revenue that they have attained above and beyond operating costs. Since The Works began operations in 2002 they have accumulated $2 million in “savings.” They have used portions of this funding for capital upgrades to their facilities. To date The Works has !nanced all capital improvements, the University has not provided any capital funding for upgrades.
- McGill, Memorial, Queen’s, and UBC derive part of their operating revenue from corporate sponsorship of their varsity teams. At McGill, Queen’s, and UBC the corporate sponsors support the varsity department. At Memorial University there are corporate sponsors for the varsity department as well as sport speci!c sponsors. For example, the women’s volleyball team is sponsored by Don Cherry’s Sports Grill. Corporate sponsors are advertized through announcements at games, print material, and hospitality opportunities. Data was not available on the revenue generated from sponsorship funding at McGill, Memorial, Queen’s, and UBC.
ConclusionsDalhousie University is at an impasse; demand for the existing athletics and recreation facilities by the student population and public is consistently outstripping supply. The demand for increasing athletics and recreation facilities on campus is common across the universities surveyed. Each university is approaching the development of future athletics and recreation facilities through unique organizational arrangements. To proactively chart a course towards athletics and recreation renewal on campus Dalhousie needs to seek out a “made for Dalhousie” solution that investigates new opportunities for creative organizational arrangement. As a part of this process Dalhousie could evaluate new opportunities for management and cost-sharing of the existing and future athletics and recreation facilities. The example of Memorial University’s unique management of The Works, should be further investigated and analyzed for applicability at Dalhousie University. Dalhousie University should undertake a business case analysis to evaluate the best organizational and management !t for existing and future athletics and recreation facility development.

DALHOUSIE CAMPUS MASTER PLAN FRAMEWORK PLAN
B.2.8
B.2 REVIEW OF ATHLETICS & RECREATION PROGRAMS
JULY 2010
Appendix: UniversitY Athletics and Recreation Pro!les Table 4 McGill University Athletics and Recreation
2008 Data
Varsity Teams " Drop-In Recreation #
Number of varsity teams 50 Activity #
Number of students on varsity teams 413 Badminton #
# # Basketball #
Men Women Jogging #
Badminton Badminton Shinny Hockey #
Baseball Basketball Skating #
Basketball Cheerleading Soccer #
Cross-country Cross-country Squash #
Curling Curling Swimming #
Cycling Cycling Table Tennis #
Fencing Fencing Tennis #
Figure skating Fieldhockey Tennis Round Robin #
Football Figure skating Ultimate Frisbee #
Golf Ice hocky Volleyball #
Ice hockey Lacrosse Water-polo #
Lacrosse Rowing Instructional Courses (classes) #
Rowing Rugby Course Number of courses offered
Rugby Sailing Dance (11) 11
Sailing Skiing-Alpine Aquatics (4) 4
Skiing-Alpine Skiing-NordicFitness and Wellness (Aerobics and Yoga) (22) 22
Skiing-Nordic Soccer Martial Arts (10) 10
Soccer Squash Sports (9) 9
Squash Swimming Outdoor Pursuits (2) 2
Swimming Synchronized Swimming Staff Fitness (McGill Staff only) (16) 16
Tennis Tennis Facilities 74
Track & Field Track & Field McGill Sports Centre #
Ultimate Ultimate McConnell Arena #
Volleyball Volleyball Percival Molson Stadium #
Wrestling Wrestling Tomlinson Field house #
Intramurals # G. Donald Love Competition Hall #
Ball Hockey # Memorial Pool #
Basketball # Webster Squash Courts #
Dodgeball # McGill Sports Medicine Clinic #
Flag Football # Forbes Field #
Ice Hockey # Outdoor Tennis Courts #
Outdoor Soccer #
Use of facilities (Percival Molson Stadium, the Sports Complex, McConnell Arena, as well as the McGill Sport Medicine Clinic)
70% of students and 40% of staff regularly use the facilities
Ultimate # McGill Sports Complex 3,000 daily visits
Volleyball # Summer Camps #
Club Sports # McGill Summer Camps 1,000 children
McGill Masters Swim Club # # #
McGill Triathlon Club # # #
University Squash Club # # #

B.2.9IBI GROUP |
APPENDIX B.2 - REVIEW OF ATHLETICS & RECREATION PROGRAMS JULY 2010
DA
LHO
US
IE C
AM
PU
S M
AS
TER
PLA
N
FRA
ME
WO
RK
PLA
N
Table 5 Memorial University – Memorial University Sea-Hawks (Varsity and Club Sports) and Memorial School of Human Kinetics and Recreation
2008 Data
Varsity Teams " Fitness and Recreation Courses #
Number of varsity teams 14 Course Number of courses offered
Number of students on varsity teams 132Fitness and Wellness (Aerobics and Strength Conditioning) 13
Men Women Boot Camp & Tone
Fitness studio classes
Basketball Basketball Athletic Style Step
Cross Country Cheerleading Advanced Step
Curling Curling Intermediate Step
Soccer Soccer Body Bar Sculpt
Swimming Swimming Body Bar Interval
Volleyball Volleyball Absolute Abs
Wrestling Wrestling High / Low & Absolute Abs
Varsity Team Corporate Sponsors # Pilates Toning
HITS 99.1 FM # Morning Fit
K-Rock # Trim & Tone
The Telegram # On the Ball
Molson Canadian # Shallow water !tness
Pool classesPizza Hut # Deep water !tness
KFC " Casual Recreation/Drop-in #
Life… With the Works # Indoor track No booking required
Holiday Inn # Green sports courts Booking required
Mitsubishi Motors # Hardwood courts Booking required
Subway # Squash courts Booking required
LeGrow’s Travel # Facilities #
Burger King # Aquarena #
Team Supporters # Field House
Indoor track, pool, !eld house courts, strength and conditioning centre
Iceberg (Curling) # Mun Gym Courts - basketball, soccer
Don Cherry’s (W Volley) # Fitness Centre2 workout areas, 100 pieces of cardio, 2 squash courts
The Out!tter’s (W Volley) # # #
Parsons & Sons Ltd (W Volley) # # #
Reebok (M Volley) # # #
Specialty Apparel (M Volley) # # #
Frontline Paintball (M Volley) # # #
The Woods (M Volley) # # #
Club Teams # # #
Number of club teams 3 # #
Number of students on club teams N/A # #
Cheerleading # # #
Curling # # #
Rowing # # #
Intramurals # # #
Number of intramural activities 7 # #
Badminton # # #
Basketball # # #
Ultimate Frisbee # # #
Hockey # # #
Squash # # #
Bowling # # #
Water Polo # # #

DALHOUSIE CAMPUS MASTER PLAN FRAMEWORK PLAN
B.2.10
B.2 REVIEW OF ATHLETICS & RECREATION PROGRAMS
JULY 2010
Table 6 Queen’s University – Queen’s Athletics and Recreation
2008 Data "
Varsity Sports " Intramurals #
Number of varsity teams 35 Number of intramural teams #
Number of students on varsity teams 344
Number of students on sports clubs #
Men Women Volleyball #
Basketball Basketball Basketball #
Cross Country Cross Country Soccer #
Fencing Fencing Hockey #
Figure Skating Field Hockey Inntertube Waterpolo #
Football Figure Skating Instructional Programs Number of courses offered
Hockey Lacrosse Fencing 3
Rowing Hockey Dance 2
Rugby Rowing Yoga 2
Soccer Rugby Stretching 1
Swimming Soccer Tai Chi 1
Track & Field Swimming Tennis 4
Volleyball Track & Field Pilates 2
# Volleyball Golf 2
Sports Club (ICS Participation) # Squash 2
Number of sports clubs 11 Casual Recreation/Drop-In #
Number of students on sports clubs 200 Basketball #
Men Women Indoor Soccer #
Baseball Cheerleading Volleyball #
Cheerleading Curling Rec Swim #
Golf Fastpitch Badminton #
Lacrosse Golf Sports Days #
Mountain Biking Mountain Biking Geared to grades 4 to 8 #
Nordic Skiing Nordic Skiing Annually three days per year #
Sailing Sailing $20 per student #
Squash Squash Facilities #
Triathlon Synchro Swimming (w) Physical Education Centre #
Ultimate Triathlon Richardson Stadium #
Water Polo Ultimate Tindall Field #
Wrestling Water Polo Memorial Centre #
# Wrestling Queen’s Centre #
Recreation Clubs # # #
Number of recreation clubs 32 # #
Number of students on recreation clubs 2500 # #
Archery Club # # #
Badminton Club # # #
Break Dance Club # # #
Climbing Club # # #
Dance Club # # #
Dance Team # # #
Dance Pack # # #
Equestrian Club # # #
Flow Dance Club # # #
Gymnastics Club # # #
Haidon Gumdo Club # # #
Highland Dance Club # # #
Indoor Field Hockey Club # # #
Jiu Jitsu Club # # #
Judo Club # # #
Karate Club # # #
Olynpic Tae Kwon Do Club # # #
Outdoors Club # # #
Rowing Club # # #
Scuba Club # # #
Ski and Snowboard Club # # #
Squash Club # # #
Table Tennis Club # # #
Tae Kwon Do Club # # #
Tennis Club # # #
Total Martial Arts Club # # #
Trampoline Club # # #
Wild Water Club # # #
Yoga Club # # #

B.2.11IBI GROUP |
APPENDIX B.2 - REVIEW OF ATHLETICS & RECREATION PROGRAMS JULY 2010
DA
LHO
US
IE C
AM
PU
S M
AS
TER
PLA
N
FRA
ME
WO
RK
PLA
N
Table 7 University of New Brunswick – University of New Brunswick Athletics (Fredricton) and University of New Brunswick Campus Recreation
"2008 Data
Varsity Teams " Fitness and Recreation Courses "
Number of varsity teams 14 Course Number of Courses Offered
Number of students on varsity teams 200 Dance 11
Men Women Aquatics 4
Basketball Basketball Fitness and Wellness (Aerobics and Yoga) 22
Soccer Soccer Martial Arts 10
Volleyball Volleyball Sports 9
Hockey # Outdoor Pursuits 2
Swimming # Staff Fitness (McGill Staff only) 16
Club Teams # Instructional Courses #
Baseball # Dance #
Cheerleading # Bootcamp #
Cricket # Yoga/Pilates #
Cross Country # Aqua!t #
Dance Club # Programs for 50+ #
Fencing # Open Recreation/Drop-in #
Field Hockey # Basketball #
Football # Volleyball #
Judo # Skating
Kayak # Badminton #
Lacrosse # Cardio room #
Masters Swim # Strength training #
Men’s Rugby # Climbing wall #
Men’s Swimming # Squash courts
Ringette # # #
Rock Climbing # Facilities #
Scuba # Gymnasia (Main/West) #
Synchro Skating # Strength Training Room #
Table Tennis # Raquetball/Squash Courts (3) #
Women’s Hockey # Dance Studio #
Women’s Rugby # South Gym #
Wrestling # Fields (Softball/College) #
Intramurals # Climbing wall #
Number of students in intramurals 4000 Swimming Pool #
Badminton # Fitness Trail #
Softball #Aitken University Centre for Skating and Jogging #
Frisbee # Cardio Training Room #
Flag football # Athletics Budget $1 million (06/07)
Outdoor soccer (M/W) # # #

DALHOUSIE CAMPUS MASTER PLAN FRAMEWORK PLAN
B.2.12
B.2 REVIEW OF ATHLETICS & RECREATION PROGRAMS
JULY 2010
Table 8 University of British Columbia – UBC Thunderbirds (Varsity) and UBC Rec
2008 Data "
Varsity Teams (CIS and NCAA) " UBC Rec # #
Men Women UBC Rec participants (one time and repeat) 61,000 #
Baseball Basketball UBC Rec events offered 68 #
Basketball Field Hockey Intramurals # #
Football Golf Ball Hockey # #
Golf Ice hockey Volleyball # #
Ice Hockey Rowing Soccer # #
Rowing (m/w) Soccer Basketball # #
Rugby Swimming Flag Football # #
Soccer Track Futsal # #
Swimming Volleyball Ultimate # #
Track # Ice Hockey # #
Volleyball # Dodgeball # #
Varsity Sponsors # Summer Soccer League # #
Booster Juice # Drop-In Recreation # #
Big Kahuna # Volleyball #
Coca-cola # Badminton # #
# # Table Tennis # #
Holiday Inn Hotel & Suites # Basketball # #
RCMP # Instructional Courses (classes) # #
Migz BBQ on Broadway # Martial Arts (17) # #
drinkmilk.ca # Sport Instruction (1) # #
Domino’s Pizza # Certi!cations (1) # #
Russell # Wellness/Conditioning/Running (5) # #
Shopper’s Drug Mart # Yoga (9) # #
Mahony & Sons # Pilates (4) # #
Molson # Dance (11) # #
The Province # Facilities # #
UBC Bookstore # Aquatic Centre # #
The Pita Pit # Boathouse # #
Powerbar # Tennis Centre # #
Total fundraising from sponsorship $2 million Thunderbird Stadium # #
Varsity athletics program expenditures $4,525,800 War Memorial Gym # #
Financial aid distributed to female athletes annual average $188,094 Thunderbird Sports Centre (Arena) # #
Intramurals #Student Recreation Centre (3 gym courts, dojo, !tness facility, and climbing wall) # #
Ball Hockey # 7 sports !elds # #
Volleyball # Community Use of the Facilities # #
Soccer # University Neighbourhood Association
5,000 residents living on campus #
Basketball # University Neighbourhood Association
Pay student rates #
Flag Football # Public use of recreational facilities
non-academic term: 90% non-academic is public use


B.3APPENDIX B.3
ACCESSIBILITY
DA
LHO
US
IE C
AM
PU
S M
AS
TER
PLA
N
FRA
ME
WO
RK
PLA
N

B.3.1IBI GROUP |
DA
LHO
US
IE C
AM
PU
S M
AS
TER
PLA
N
FRA
ME
WO
RK
PLA
N
ACCESSIBILITYTHE OBJECTIVERecognizing the diversity of interior and exterior environments comprising the Dalhousie University campus, the long term objective of full accessibility is indeed challenging, and a multi-year program to realize this objective is both complex and costly. Nevertheless, the objective is worthy and the need to address this problem is necessary; increasingly government regulations are focusing on meeting the requirements of the disabled for full access to both public and private built as well as service environments.!
OPPORTUNITIESThe realistic approach to achieving a fully accessible campus! is (1) to accept that it will take a number of years to achieve and must be carried out in phases of investment and construction, and (2) that it will generally be achieved as part of capital project initiatives: new construction, retro-"ts, renovations and capital repairs & replacement (i.e. deferred maintenance) projects. A multi-year plan and implementation program is required to guide annual capital expenditures to achieve these initiatives.
PLAN PREPARATION Preparation of the required Multi-year Accessibility Plan is outlined in terms of six basic steps:
1. Establishing an Accessibility Program Planning Committee to ensure that all essential university interest groups are represented including Facilities Management, the Dalhousie Of"ce of Accessibility, the Of"ce of Sustainability, students and faculty, and relevant executive vice presidents. It will be this committee that should set the objectives and terms of reference for the planning, with the assistance of external experts;
2. Reviewing current university Accessibility Standards and determining if they are adequate (considering options) and relevant to university objectives, operating policies and physical conditions;
3. Conducting a Technical Audit of the university built environment, aimed at identifying accessibility de"ciencies and remediation costs in accordance with the standards;
4. Establishing criteria for Priority Setting and identifying Priority Projects aimed at phasing the improvements over time;
5. Identifying Plan Options that are then subjected to a feasibility analysis leading to determining the Preferred Plan;
6. Finalizing the Plan to include annual project de"nitions and capital programs, for adoption by the university executive and Board.
PLAN EXECUTIONOnce adopted as policy, the role of the Committee is to set performance targets, measures and schedules, then routinely audit progress and record "ndings and conclusions in periodic reports.
Without the discipline of sustained stewardship and institutional commitment, the goal of achieving an accessible university campus cannot be achieved where, as in Dalhousie’s case, the campus is comprised of many buildings of diverse age, design and condition.
DALHOUSIE UNIVERSITY FRAMEWORK PLANAPPENDIX B.3 ACCESSIBILITY

APPENDIX B.4
SPACE FORECAST ANALYSISB.4
DA
LHO
US
IE C
AM
PU
S M
AS
TER
PLA
N
FRA
ME
WO
RK
PLA
N

2008 Enrolment VARIANCEExisting Generated Space Existing
Space (NOTE 1) As Per COU to COUInventory Standards Generated(NASF) (NASF) (NASF)
CARLTONDENTISTRY 79,628 69,962 (9,666) SEE NOTES 3 & 4
HEALTH PROFESSIONS 107,190 346,592 (239,402) SEE NOTE 3MEDICINE 121,115 210,360 (89,245) SEE NOTE 4
COMMON POOL CLASSROOMS 16,229
Totals 324,162 NASF
(338,314) NASF Space Shortage Based on COU Stds.
LOW END HIGH END LOW END HIGH END2008 2018 2018 10-Year 10-Year
Projected Projected Change in Change inUndergraduate Undergraduate Undergraduate Undergraduate Undergraduate
Enrolment Enrolment Enrolment Enrolment Enrolment
DENTISTRY 247 247 - - (247) HEALTH PROFESSIONS 2,011 2,174 - 163 (2,011)
MEDICINE 391 443 - 52 (391) 2,649 2,864 - 215 (2,649) Students
NASF of Common Pool Classroom Per Student (Based on Existing) 6 6 NASF/Student1,317 (16,229) NASF Estimated Additional Common Pool Classroom Space
LOW HIGH in the next 10 Years
LOW END HIGH END2018 2018
Projected ProjectedAdditional Additional
Faculty NASF Faculty NASF
DENTISTRY - - HEALTH PROFESSIONS 15,597 -
MEDICINE 15,365 -
30,962 - NASF Additional Faculty Specific Space (NASF)LOW HIGH

FOR THE CARLTON CAMPUSIN THE NEXT 10 YEARS PLAN FOR:
LOW END HIGH END338,314 338,314 To bring space to COU Standard
1,317 2,634 Growth in Common Pool Classrooms30,962 61,924 Faculty Space for Enrolment Growth
370,593 402,872 NASF1.65 1.65 Grossup Factor
611,479 664,739 GSFLOW HIGH
Note 1: Existing Space Figures are for COU Formula Space Only and does not account for around 8000 NASF of other space under each Faculty OR Other Unviersity Services on tha campusNote 2: Breakdown of Administrative Staff not available for direct comparison at this level of detail.Note 3: There are also 16,229 NASF in Common Pool Classrooms on the Carlton Campus which are not inventoried under a specific Department/Faculty.Note 4: Information for Dentistry Weekly Scheduled Contact Lab Hours is not available and therefore the Existing "Lab Undergraduate Space" of 35497 nasf is considered up to COU standards for this palnning exercise.
GENERAL NOTE: The comparison of existing space inventory by Faculty may not provide in certain instances a complete and realistic comparison between space inventoried under a certain Faculty and space generated by the COU method.While the COU generated space will include all classroom space required for a certain Faculty based on enrolment, the existing inventory for the same Faculty may not necessarily include this space which may be part of the "common pool" space.The variance, in certain instances, may therefore be misleading and conclusions should not be based on this summary.

DALHOUSIE UNIVERSITY MASTER PLANTABLE 1 - PROJECTED ENROLMENT AND SPACE REQUIREMENTS
Page T1.3 of 82
PROJECTED STUDENT ENROLMENT(2008) SHORT TERM
BASELINE PROJECTEDENROLMENT ENROLMENT
15277 17783STUDENTS STUDENTS
PROJECTED SPACE REQUIREMENTSEXISTING NET ASSIGNABLE SPACE (NASF) 2,330,749 2,330,749
PROJECTED ADDITIONAL NET ASSIGNABLE SPACE (NASF) 260,111 TOTAL NET ASSIGNABLE SPACE (NASF) 2,330,749 2,590,860
TOTAL GROSS SPACE (GSF) 3,845,736 4,274,919
Note 1.1: NASF is Net Assignaable Square FeetNote 1.2: GSF is Gross Squre Feet accounting for circulation, building service space and building and construction grossupNote 1.3: Assumed incremental 5-Year increase in enrolment: 2506 students Ref. Table 6Note 1.4: COU calculated incremental 5-Year increase in space requirements: 260,111 NASF Ref. Appendix C pages C3 and C4Note 1.5: The existing assignable space DOES NOT include 647,342 nasf of residential space (COU Category 17 in the University Space Inventory). This space is dealt with separately at this time.Note 1.6: Net assignable to gross space conversion factor used is 1.65Note 1.7: The 1.65 factor accounts for the 1,162,695 Non-Assignable SF (COU Category 16 in the University Space Inventory) and also allows for the building/construction grossupNote 1.8: For details on Existing net assignable space, reference Table 2

DALHOUSIE UNIVERSITY MASTER PLANTABLE 2 - COMPARISON AT UNIVERSITY LEVEL: EXISTING SPACE TO COU GENERATED SPACE
Page T2.4 of 82
DALHOUSIE UNIVERSITYBaseline (2008) Enrolment VARIANCE Short Term Enrolment Growth
Existing Generated Space Existing Generated SpaceCOU Space As Per COU to COU As Per COU
COU Space Inventory Standards Generated StandardsCat. # Category (NASF) (NASF) (NASF) (NASF)
Formula Areas (NASF)1 Classroom Facilities 202,058 178,472 23,586 207,7482 Lab Undergraduate 178,026 176,068 1,958 202,1093 Lab Graduate & Faculty 410,478 678,466 (267,988) 709,9954 Academic Office & Related Space 415,556 471,970 (56,414) 400,5535 Campus Study Space & Library Facilities 261,217 253,843 7,374 282,0286 Recreation Athletic Space 161,554 130,589 30,965 152,0117 Food Services 45,401 72,550 (27,149) 84,4508 Bookstore & Merchandizing Facilities 39,566 72,550 (32,984) 84,4509 Plant Maintenance 31,037 32,303 (1,266) 33,971
10 Administrative Offices & Related Space 152,659 174,639 (21,980) 203,28711 AV/TV Facilities 4,368 7,255 (2,887) 8,44512 Central Services 15,569 14,510 1,059 16,89013 Health Service Facilities 4,381 4,353 28 5,06714 Student Activity Space 48,365 72,550 (24,185) 84,45015 Assembly & Exhibition Facilities 70,831 21,765 49,066 25,335
Subtotal - Formula Areas 2,041,066 2,361,881 (320,815) 2,500,78916 Non-Assignable (SF) 1,162,695
Non-Formula Areas (NASF)17 Residential Space 647,342 18 Animal Space19 Other 289,683 20 Health Sciences Clinical Facilities
Subtotal - Non-Formula Areas 937,025 TOTALS 4,140,786
TOTAL ASSIGNABLE SF 2,978,091 TOTAL NON-ASSIGNABLE SF 1,162,695 39% is the percentage ofexisting non-assignable to existing assignable space
Note 2.1: NASF is Net Assignaable Square FeetNote 2.2: COU refers to the Council of Ontario Universities method of generating space standards based on enrolments and other factorsNote 2.3: Existing Space Inventory numbers are based the Unioversity's inventory of buildings, spaces and rooms at the time of the analysisNote 2.4: In the case of low/high COU estimating factors available, the low factors were used unless otherwise indicatedNote 2.5: Variances between Existing and COU Generated Space are only shown for the present. Note 2.6: Showing variances for Growth Period is not feasible as the basecase after growth is an unknown.Note 2.7: For calculations of COU generated space reference Appendix C, pages C-1, C2, C25 to C34Note 2.8: COU Space Categories 16 to 20 are not formula-based, or based on enrolment/staffing related input measures, and therefore a comparison is not possible

DALHOUSIE UNIVERSITY MASTER PLANTABLE 3 - SUMMARY COMPARISON AT FACULTY LEVEL: CURRENT SPACE TO COU GENERATED SPACE
Page T3.5 of 82
Baseline (2008) Enrolment VARIANCEExisting Generated Space Existing
Space As Per COU to COUInventory Standards Generated
FACULTY (NASF) (NASF) (NASF)SEXTONARCHITECTURE & PLANNING 35,393 18,880 16,513ENGINEERING 79,628 210,150 (130,522) SEE NOTE 3.11STUDLEYARTS & SOCIAL SCIENCES 94,650 105,586 (10,936) SEE NOTES 3.10 & 3.12COMPUTER SCIENCE 35,673 34,684 989 SEE NOTE 3.12LAW 66,841 21,161 45,680 SEE NOTE 3.12MANAGEMENT 29,828 73,930 (44,102) SEE NOTE 3.12SCIENCE 414,670 448,448 (33,778) SEE NOTE 3.12CARLTONDENTISTRY 79,628 34,465 45,163 SEE NOTES 3.13 & 3.14HEALTH PROFESSIONS 107,190 346,592 (239,402) SEE NOTE 3.13MEDICINE 121,115 210,360 (89,245) SEE NOTE 3.10
1,064,616 1,504,257 (439,641)
GENERAL NOTE: The comparison of existing space inventory by Faculty may not provide in certain instances a complete and realistic comparison between space inventoried under a certain Faculty and space generated by the COU method.While the COU generated space will include all classroom space required for a certain Faculty based on enrolment, the existing inventory for the same Faculty may not necessarily include this space which may be part of the "common pool" space.The variance, in certain instances, may therefore be misleading and conclusions should not be based on this summary. The detailed Tables 3A to 3J may provide clarifications in these instances and should also be reviewed.
Note 3.1: NASF is Net Assignable Square Feet.Note 3.2: COU refers to the Council of Ontario Universities method of generating space standards based on enrolments and other factors.Note 3.3: Existing Space Inventory numbers are based the University's inventory (by Department) of buildings, spaces and rooms at the time of the analysis.Note 3.4: In the case of low/high COU estimating factors available, the low factors were used unless otherwise indicated.Note 3.5: Variances between Existing and COU Generated Space are only shown for the present. Note 3.6: For calculations of COU generated space reference Appendix C, pages C35 to C54.Note 3.7: Some COU categories do not apply to all/some of the Faculties.Note 3.8: Library stack/collection space (COU Category 5) may not be listed under a Department/Faculty and may account for some variances.Note 3.9: COU Space Categories 16 to 20 are not formula-based, or based on enrolment/staffing related input measures, and therefore a comparison is not possible.Note 3.10: Breakdown of Administrative Staff not available for direct comparison at this level of detail.Note 3.11: There are also 8,217 NASF in Common Pool Classrooms on the Sexton Campus which are not inventoried under a specific Department/Faculty.Note 3.12: There are also 85,179 NASF in Common Pool Classrooms on the Studley Campus which are not inventoried under a specific Department/Faculty.Note 3.13: There are also 16,229 NASF in Common Pool Classrooms on the Carlton Campus which are not inventoried under a specific Department/Faculty.Note 3.14: Information for Dentistry Weekly Scheduled Contact Lab Hours is not available and therefore comparison is not feasible.Note 3.15: Faculty-specific details are provided in Tables 3A to 3J in the AppendicesNote 3.16: Summary Comparison above is for COU "Formula-Based" Space ONLY

DALHOUSIE UNIVERSITY MASTER PLANTABLE 4 - PROJECTED UNDERGRADUATE ENROLMENT AND SPACE REQUIREMENTS BY FACULTY/CAMPUS
FACULTY SPECIFIC SPACE ONLY AS PER UNIVERSITY SPACE INVENTORY
Page 4.6 of 82
Baseline Year (2008) Short Term Projected
Exis
ting
Und
ergr
adua
te E
nrol
men
t
Exis
ting
Net
Ass
igna
ble
Spac
e (N
ASF
)
Proj
ecte
d A
dditi
onal
Net
Ass
igna
ble
Spac
e (N
ASF
)
Tota
l Net
Ass
igna
ble
Spac
e (N
ASF
)
Tota
l GR
OSS
Spa
ce (G
SF)
Proj
ecte
d U
nder
grad
uate
Enr
olm
ent
Exis
ting
Net
Ass
igna
ble
Spac
e (N
ASF
)
Proj
ecte
d A
dditi
onal
Net
Ass
igna
ble
Spac
e (N
ASF
)
Tota
l Net
Ass
igna
ble
Spac
e (N
ASF
)
Tota
l GR
OSS
Spa
ce (G
SF)
SEXTONArchitecture & Planning 253 35393 744 36137 59626 264 36137 744 36881 60853Engineering 1280 85706 1129 86835 143277 1289 86835 1129 87964 145140
Subtotals 1533 121099 1873 122972 202903 1553 122972 1873 124844 205993STUDLEYArts and Social Sciences 2665 94720 28253 122973 202906 3121 122973 28253 151227 249524Computer Science 242 35883 920 36803 60725 254 36803 920 37723 62243Law 455 66841 137 66978 110513 457 66978 137 67114 110739Management 1325 29828 75117 104945 173159 2536 104945 75117 180062 297102Science 2695 416199 76076 492275 812254 3293 492275 76076 568351 937779
Subtotals 7382 643471 180503 823974 1359557 9661 823974 180503 1004477 1657387CARLTONDentistry 247 85706 0 85706 141415 247 85706 0 85706 141415Health Professions 2011 107190 15597 122787 202598 2174 122787 15597 138383 228333Medicine 391 123259 15365 138624 228730 443 138624 15365 153990 254083
Subtotals 2649 316155 30962 347117 572743 2864 347117 30962 378079 623831
TOTALS 11564 1080725 213338 1294063 2135203 14078 1294063 213338 1507400 2487211
Note 4.1: NASF is Net Assignable Square Feet.Note 4.2: GSF is Gross Square Feet accounting for circulation, building service space and building and construction grossup.Note 4.3: Enrolment numbers DO NOT include Interdisciplinary/Multifaculty OR Graduate Students since there is no projected growth to these under the shown Faculties, and projected increase in space requirements is based on the increase in undergraduate enrolment.Note 4.4: Projected Additional Net Assignable Space is based on the COU (Council of Ontario Universities) method of generating space standards based on enrolments and other factors.Note 4.5: Existing Space Inventory numbers are based the University's inventory of buildings, spaces and rooms at the time of the analysis coded to Departments under each Faculty.Note 4.6: For calculations of Projected Additional space (5-year incremental increase) by the COU method, reference Appendix C, pages C-5 to C24.Note 4.7: Note that the existing space shown above is Department/Faculty specific and EXCLUDES other space such as Common Pool Classrooms etc.Note 4.8: Net assignable to gross space conversion factor used is 1.65
Assumed incremental 5 year increase in enrolment after 2013 Assumed incremental 5 year increase in space after 2013 (SEE NOTE 4.6)Architecture and Planning 11 students Architecture and Planning 744 NASFEngineering 9 students Engineering 1,129 NASFArts and Social Sciences 456 students Arts and Social Sciences 28,253 NASFComputer Science 12 students Computer Science 920 NASFLaw 2 students Law 137 NASFManagement 1211 students Management 75,117 NASFScience 598 students Science 76,076 NASFDentistry 0 students Dentistry 0 NASFHealth Professions 163 students Health Professions 15,597 NASFMedicine 52 students Medicine 15,365 NASF

DALHOUSIE UNIVERSITY MASTER PLANTABLE 5 - SUMMARY OF CLASSROOM SPACE ANALYSIS
Page 5.7 of 82
Existing Estimated Increase Estimated IncreaseClassrooms Over 5-Years Over 5-Years
(NASF) (NASF) (GSF) DETAIL OF COMMON POOL CLASSROOMS
SEXTON BUILDING AREA in NASF CAMPUSArchitecture & Planning 14,230 129 212 LSC-BIOL&EARTH 622 STUDLEYEngineering 2,341 105 173 LSC-OCEANOGRAPHY 918 STUDLEYCommon Pool 8,217 SEE NOTE 5.6 LSC-PSYCHOLOGY 4,345 STUDLEY
Subtotals 24,788 234 386 SEE NOTE 5.5 LSC-COMMON AREA 14,670 STUDLEYSTUDLEY DUNN BLDG 8,500 STUDLEYArts and Social Sciences 8,285 5,327 8,790 HENRY HICKS ACAD 5,815 STUDLEYComputer Science 1,685 140 231 CHEMISTRY 3,359 STUDLEYLaw 12,832 23 39 KILLAM LIB 3,735 STUDLEYManagement 1,354 14,147 23,343 MCCAIN ARTS&SC 24,096 STUDLEYScience 7,728 6,986 11,527 KENNETH C ROWE 13,656 STUDLEYCommon Pool 85,179 SEE NOTE 5.6 GOLDBERG COMPUPTER BLDG. 1,542 STUDLEY
Subtotals 117,063 26,624 43,930 SEE NOTE 5.5 A. MACDONALD 3,921 STUDLEYCARLTON DENTISTRY 9,107 CARLTONDentistry 2,341 0 0 TUPPER BLDG 7,122 CARLTONHealth Professions 15,647 1,904 3,142 B BLDG. & B. BLDG. ADDITION 8,217 SEXTONMedicine 8,689 607 1,002 109,625 Common Pool 16,229 SEE NOTE 5.6
Subtotals 42,906 2,512 4,144 SEE NOTE 5.5
TOTALS (FACULTY SPECIFIC) 75,132 29,370 48,460 SEE NOTE 5.5TOTALS (COMMON POOL) 109,625 SEE NOTE 5.5
TOTALS (ALL OTHER) 17,301 0GRAND TOTAL 202,058
Note 5.1: NASF is Net Assignable Square Feet.Note 5.2: GSF is Gross Square Feet accounting for circulation, building service space and building and construction grossup.Note 5.3: Net assignable to gross space conversion factor used is 1.65Note 5.4: For calculations of estimated increase over 5-years (incremental increase) by the COU method, reference Appendix C, pages C-5 to C24.Note 5.5: Note that the estimated increase in net assignable square feet includes common pool classroom incremental increase.Note 5.6: Details of Common Pool Classrooms are provided in side table.

DALHOUSIE UNIVERSITY MASTER PLANTABLES 6 - ENROLMENT / STAFF FIGURES USED IN ANALYSES
Page 6.8 of 82
SEXTON (Undergrad.) STUDLEY (Undergrad.) CARLTON (Undergrad.) All (Grad.)
Arc
hite
ctur
e an
d Pl
anni
ng
Eng
inee
ring
SUB
TOTA
LS
Art
s and
Soc
ial S
cien
ces
Com
pute
r Sc
ienc
e
Law
Man
agem
ent
Scie
nce
Inte
rdis
./Oth
er/C
on.E
d./M
ulti
Facu
lty
SUB
TOTA
LS
Den
tistr
y
Hea
lth P
rofe
ssio
ns
Med
icin
e
SUB
TOTA
LS
GR
AD
UAT
E S
TU
DE
NT
S
STUDENT ENROLMENT FIGURES Undergrad. ALLActual Enrolment 2008 253 1280 1533 2665 242 455 1325 2695 61 7443 247 2011 391 2649 3652 11625 15277
Projected Enrolment 2013 264 1289 1553 3121 254 457 2536 3293 53 9714 247 2174 443 2864 3652 14131 17783Projected Increase By 2013 11 9 20 456 12 2 1211 598 -8 2271 0 163 52 215 0 2506 2506
FTE Increase By 2013 (0.882353 Conversion Factor) 10 8 18 402 11 2 1069 528 -7 2004 0 144 46 190 0 2211 2211FACULTY & GRADUATE STUDENT FTE'S
Faculty FTEs as of Dec. 1, 2008 24 88 112 165 29 39 71 200 32 536 41 149 183 373 3 1024Graduate Students FTEs as of Dec. 1 2008 123 299 423 209 171 24 448 441 74 1366 544 170 714 149 2652
PDF as of Dec. 1 2008 11 11 1 1 50 52 2 43 45 7 115Average Number of Student FTE PER Faculty FTE 14 16 16 13 11 23 14 4 5 16 3 53 16Projected Increase (5-Yr. Increment) Faculty FTE's 0.7 0.5 1.2 25.9 0.8 0.2 46.8 37.4 111.1 0.0 9.2 16.3 25.6 0.0 138
Projected Total Faculty FTE's by 2013 24.9 88.3 113.3 190.9 30.1 39.2 117.6 237.2 52.0 667.0 41.0 158.2 199.3 398.6 3 1182MGMNT./ADMIN./PROF. SUPPORT STAFF
FTE ACAD. Staff (COU Cat. 4) as of Dec. 1, 2008 590FTE ADMIN. Staff (COU Cat. 10) as of Dec. 1, 2008 832
Av. Num. of Student FTE PER Cat. 4 Staff FTE 22.8 Av. Num. of Student FTE PER Cat. 10 Staff FTE 16.2
Proj. Increase (5-Yr. Increment) Cat. 4 Staff FTE's 97 Proj. Increase (5-Yr. Increment) Cat. 10 Staff FTE's 136
Projected Total Cat. 4 Staff FTE's by 2013 687Projected Total Cat. 10 Staff FTE's by 2013 968
Note 6.1: Student to FTE Conversion Factor 0.8824Note 6.2: Student Enrolment and Projected Enrolment are based on actual and preliminary enrolments by Faculty as of December 1, 2008.Note 6.3: In order to estimate increase to Faculty FTEs and Other Staff FTEs, the exisitng ratios of Faculty (or Other Staff) FTEs to Student FTEs is used at this time.Note 6.4: Non-Faculty FTEs include administrators, professionals, support, research admin. support, research support staff union, NS Union of pub. employees, staff other, confidential clerical secretarial and senior mgmnt.Note 6.5: Non-Faculty FTE's EXCLUDES non-office workers for Facilities Management as well as Housing staff located in COU Category 17 officesNote 6.6: All other Non-Faculty Staff are split into two categories: Academic Staff (under COU category 4) and Administrative Staff (under COU category 10)Note 6.7: Staff FTE's for the following Departments are EXCLUDED: Anaesthesia; Emergency Medicine; Faculty of Medicine General: Kellogg Library; Law Libnrary; Obstetrics & Gynaecology; Ophthalmology and Visual Science; Oral and Maxillofacial Sciences; Pathology: Pediatrics; Radiation Oncology; Radiology; Saint John Regional Hospital; Sexton Design and Tech. Library; Surgery; Un iversity Library; University Secretariat-Senate; Urology; Varsity; Writing Resource Center. (188 FTE's)Note 6.8: FTE's for Post-Graduate Med Ed (483 FTE's) /Other PDFs are EXCLUDED in Details

DALHOUSIE UNIVERSITY MASTER PLANTABLES 6 - ENROLMENT / STAFF FIGURES USED IN ANALYSES
Page 6.9 of 82
This part of Table 6 is linked to Appendix C "Calculations by COU Standards Method" and is for calculation purposes only.Count for COU Calculation (Cat. 3 Research Lab Space)(Count based on predominant lab type)
All 08 Add-5 Arch. Eng. Arts& Comp. Law Mgmnt Sc. Dent. Health MedicineGp. A 1197.56 62.951 Faculty 85.91 243.005 269.745 114.72 50.83 295.335 445.242 41 421.955 289.365Gp. B 243.005 0.48835 E B E D E E A A A AGp. C. Add-5 0.679 0.488 25.930 0.807 0.162 46.794 37.395 0.000 9.244 16.312Gp. D 114.72 0.80681Gp. E 701.82 73.5651

DALHOUSIE MASTER PLANAPPENDIX A - DATA FOR WEEKLY SCHEDULED CONTACT LAB HOURS BY FACULTY
Page A-10 of 82
WEEKLY SHCEDULED CONTACT LAB HOURS - WSCLH - DATA USED IN ANALYSISDATA TRANSFEREDD TO APPENDIX C AS SQUARE FEET (Overrides Formulas for Cat. 2)
10.76426265 Fall 2008 (SF) (NASM) (NASF)Actual Enrollment HOURS m2 GENERATED SF GENERATED COU Factor Used Sub-totals / Dept. TOTALS TOTALS
ANAT 12 0 2 0 0 0.6 Faculty FacultyANAT 9999 102 6 367 3953 0.6 79 853 ARCHITECTURE & PALNNINGANAT 12 1 0 0 0.6 71 759 ARTS & SOCIAL SCIENCES
3953 105 1133 COMPUTER SCIENCEBIOC 3 3 3 5 58 0.6 5855 63024 ENGINEERINGBIOC 3 2 3 4 39 0.6 1268 13653 HEALTH PROFESSIONSBIOC 3 3 3 5 58 0.6 340 3656 MANAGEMENTBIOC 3 3 3 5 58 0.6 446 4805 MEDICINEBIOC 3 3 3 5 58 0.6 8192 88185 SCIENCEBIOC 3 3 3 5 58 0.6BIOC 3 3 2 4 39 0.6 16357 176068 TOTAL (ALL)BIOC 3 3 2 4 39 0.6 SM SFBIOC 3 3 2 4 39 0.6BIOC 3 2 2 2 26 0.6BIOC 3 3 2 4 39 0.6BIOC 0 0 0 0 0.6BIOC 3 3 2 4 39 0.6BIOC 30 20 2 24 258 0.6BIOC 30 15 3 27 291 0.6BIOC 34 31 3 56 601 0.6BIOC 26 34 3 61 659 0.6BIOC 3 3 3 5 58 0.6BIOC 3 3 2 4 39 0.6BIOC 3 4 3 7 78 0.6BIOC 3 3 3 5 58 0.6BIOC 3 1 2 1 13 0.6BIOC 3 3 2 4 39 0.6BIOC 5 1 0 0 0.6BIOC 3 2 3 4 39 0.6BIOC 92 90 6 324 3488 0.6
6168BIOE 999 0 3 0 0 0.8BIOE 9999 6 3 14 155 0.8BIOE 9999 0 0 0 0.8BIOE 99 9 3 22 233 0.8
388BIOL 12 9 2 11 116 0.6BIOL 21 21 3 38 407 0.6BIOL 21 21 3 38 407 0.6BIOL 21 21 3 38 407 0.6BIOL 21 20 3 36 388 0.6BIOL 21 21 3 38 407 0.6BIOL 21 21 3 38 407 0.6BIOL 19 17 2 20 220 0.6BIOL 19 18 2 22 233 0.6BIOL 19 20 2 24 258 0.6BIOL 19 17 2 20 220 0.6BIOL 19 17 2 20 220 0.6

DALHOUSIE MASTER PLANAPPENDIX A - DATA FOR WEEKLY SCHEDULED CONTACT LAB HOURS BY FACULTY
Page A-11 of 82
BIOL 0 3 0 0 0.6BIOL 19 17 2 20 220 0.6BIOL 5 0 3 0 0 0.6BIOL 5 1 3 2 19 0.6BIOL 10 5 3 9 97 0.6BIOL 25 23 2 28 297 0.6BIOL 25 25 2 30 323 0.6BIOL 25 24 2 29 310 0.6BIOL 25 25 2 30 323 0.6BIOL 25 23 2 28 297 0.6BIOL 28 27 3 49 523 0.6BIOL 28 24 3 43 465 0.6BIOL 28 25 3 45 484 0.6BIOL 28 27 3 49 523 0.6BIOL 21 21 3 38 407 0.6BIOL 6 0 0 0 0.6BIOL 26 23 3 41 446 0.6BIOL 26 25 3 45 484 0.6BIOL 9 3 3 5 58 0.6BIOL 9 1 3 2 19 0.6BIOL 25 20 2 24 258 0.6BIOL 25 24 3 43 465 0.6BIOL 19 19 2 23 245 0.6BIOL 21 20 3 36 388 0.6BIOL 21 20 3 36 388 0.6BIOL 24 24 2 29 310 0.6BIOL 24 23 2 28 297 0.6BIOL 24 23 2 28 297 0.6BIOL 24 24 2 29 310 0.6BIOL 24 24 2 29 310 0.6BIOL 24 24 2 29 310 0.6BIOL 24 24 2 29 310 0.6BIOL 24 23 2 28 297 0.6BIOL 24 23 2 28 297 0.6BIOL 24 24 2 29 310 0.6BIOL 24 23 2 28 297 0.6BIOL 24 21 2 25 271 0.6BIOL 24 22 2 26 284 0.6BIOL 24 22 2 26 284 0.6BIOL 24 19 2 23 245 0.6BIOL 24 24 2 29 310 0.6BIOL 24 23 2 28 297 0.6BIOL 24 24 2 29 310 0.6BIOL 24 23 2 28 297 0.6BIOL 24 20 2 24 258 0.6BIOL 24 23 2 28 297 0.6BIOL 24 24 2 29 310 0.6BIOL 24 23 2 28 297 0.6BIOL 24 23 2 28 297 0.6BIOL 24 23 2 28 297 0.6BIOL 24 21 2 25 271 0.6BIOL 24 24 2 29 310 0.6BIOL 24 24 2 29 310 0.6BIOL 24 24 2 29 310 0.6BIOL 24 23 2 28 297 0.6

DALHOUSIE MASTER PLANAPPENDIX A - DATA FOR WEEKLY SCHEDULED CONTACT LAB HOURS BY FACULTY
Page A-12 of 82
BIOL 24 23 2 28 297 0.6BIOL 24 22 2 26 284 0.6BIOL 24 24 2 29 310 0.6BIOL 24 24 2 29 310 0.6BIOL 75 12 0 0 0.6BIOL 19 17 2 20 220 0.6BIOL 19 18 2 22 233 0.6BIOL 2 2 2.5 3 32 0.6BIOL 3 4 2.5 6 65 0.6BIOL 25 24 3 43 465 0.6BIOL 25 11 3 20 213 0.6BIOL 25 24 3 43 465 0.6BIOL 25 23 3 41 446 0.6BIOL 25 25 3 45 484 0.6BIOL 25 23 3 41 446 0.6BIOL 5 5 0 0 0.6BIOL 21 21 3 38 407 0.6BIOL 26 28 3 50 543 0.6BIOL 26 28 3 50 543 0.6BIOL 26 27 3 49 523 0.6BIOL 26 25 3 45 484 0.6BIOL 26 29 3 52 562 0.6BIOL 26 18 3 32 349 0.6BIOL 20 17 3 31 329 0.6BIOL 20 18 3 32 349 0.6BIOL 20 18 3 32 349 0.6BIOL 20 17 3 31 329 0.6BIOL 0 0 3 0 0 0.6BIOL 3 0 2.5 0 0 0.6BIOL 2 0 2.5 0 0 0.6BIOL 26 27 3 49 523 0.6BIOL 17 11 4 26 284 0.6BIOL 10 0 0 0 0.6BIOL 24 21 2 25 271 0.6
29742BMNG 14 10 0 0 0.3
0BUSI 80 57 1.5 26 276 0.3
276CHEE 39 30 2 48 517 0.8CHEE 60 41 2 66 706 0.8CHEE 50 32 3 77 827 0.8CHEE 50 30 3 72 775 0.8CHEE 9999 2 2 3 34 0.8CHEE 9999 30 4 96 1033 0.8
3892CHEM 18 18 3 32 349 0.6CHEM 18 18 3 32 349 0.6CHEM 30 29 3 52 562 0.6CHEM 60 56 3 101 1085 0.6CHEM 45 45 3 81 872 0.6CHEM 40 39 3 70 756 0.6CHEM 30 31 3 56 601 0.6CHEM 30 14 3 25 271 0.6CHEM 50 48 3 86 930 0.6

DALHOUSIE MASTER PLANAPPENDIX A - DATA FOR WEEKLY SCHEDULED CONTACT LAB HOURS BY FACULTY
Page A-13 of 82
CHEM 50 43 3 77 833 0.6CHEM 25 24 3 43 465 0.6CHEM 25 24 3 43 465 0.6CHEM 50 48 3 86 930 0.6CHEM 50 49 3 88 949 0.6CHEM 50 35 3 63 678 0.6CHEM 50 47 3 85 911 0.6CHEM 50 50 3 90 969 0.6CHEM 50 48 3 86 930 0.6CHEM 12 12 4 29 310 0.6CHEM 12 12 4 29 310 0.6CHEM 12 12 4 29 310 0.6CHEM 50 50 3 90 969 0.6CHEM 30 30 3 54 581 0.6CHEM 30 21 3 38 407 0.6CHEM 20 13 3 23 252 0.6CHEM 50 49 3 88 949 0.6CHEM 60 61 3 110 1182 0.6CHEM 50 50 3 90 969 0.6CHEM 12 10 4 24 258 0.6CHEM 6 0 4 0 0 0.6CHEM 30 20 1.5 18 194 0.6CHEM 30 8 1.5 7 78 0.6CHEM 24 26 4 62 672 0.6CHEM 24 23 4 55 594 0.6CHEM 18 17 3 31 329 0.6CHEM 12 6 3 11 116 0.6CHEM 50 47 3 85 911 0.6CHEM 50 50 3 90 969 0.6CHEM 50 47 3 85 911 0.6CHEM 12 10 3 18 194 0.6CHEM 12 5 3 9 97 0.6CHEM 12 9 3 16 174 0.6CHEM 25 6 0 0 0.6CHEM 25 25 3 45 484 0.6CHEM 25 20 3 36 388 0.6CHEM 50 47 3 85 911 0.6CHEM 50 48 3 86 930 0.6CHEM 50 18 3 32 349 0.6
27701CIVL 9999 45 2 72 775 0.8CIVL 999 64 3 154 1653 0.8CIVL 40 40 3 96 1033 0.8CIVL 9999 67 2 107 1154 0.8CIVL 9999 65 3 156 1679 0.8CIVL 9999 13 2 21 224 0.8CIVL 9999 36 2 58 620 0.8CIVL 9999 47 2 75 809 0.8CIVL 40 44 3 106 1137 0.8
9085COMM 45 43 1.5 19 208 0.3COMM 45 44 1.5 20 213 0.3COMM 45 45 1.5 20 218 0.3COMM 45 44 1.5 20 213 0.3COMM 45 45 1.5 20 218 0.3

DALHOUSIE MASTER PLANAPPENDIX A - DATA FOR WEEKLY SCHEDULED CONTACT LAB HOURS BY FACULTY
Page A-14 of 82
COMM 45 44 1.5 20 213 0.3COMM 45 44 1.5 20 213 0.3COMM 31 33 1.5 15 160 0.3COMM 45 43 1.5 19 208 0.3COMM 45 45 1.5 20 218 0.3COMM 45 45 1.5 20 218 0.3COMM 45 43 1.5 19 208 0.3COMM 45 43 1.5 19 208 0.3COMM 45 44 1.5 20 213 0.3COMM 15 14 1.5 6 68 0.3
2998CSCI 34 25 3 23 242 0.3CSCI 34 30 3 27 291 0.3CSCI 34 24 3 22 233 0.3CSCI 34 6 3 5 58 0.3
823DCYT 4 3 2 4 39 0.6DCYT 10 6 1.5 5 58 0.6DCYT 10 9 3 16 174 0.6DCYT 10 9 3.5 19 203 0.6DCYT 3 2 2 2 26 0.6DCYT 3 2 2 2 26 0.6
526DMUT 5 4 3 7 78 0.6DMUT 5 5 3 9 97 0.6DMUT 5 6 3 11 116 0.6
291ECED 9999 43 1.5 39 417 0.6ECED 91 113 3 203 2189 0.6ECED 91 90 3 162 1744 0.6ECED 9998 42 3 76 814 0.6ECED 999 33 3 59 639 0.6ECED 99 31 3 56 601 0.6ECED 999 47 2 56 607 0.6ECED 99 35 2 42 452 0.6ECED 999 33 2 40 426 0.6ECED 9999 13 1.5 12 126 0.6ECED 60 19 2 23 245 0.6
8260ECMM 0 3 2 2 19 0.3ECMM 0 4 2 2 26 0.3
45ECON 50 31 1.5 14 150 0.3
150ENGI 60 58 3 139 1498 0.8ENGI 60 58 3 139 1498 0.8ENGI 60 57 3 137 1473 0.8ENGI 60 42 3 101 1085 0.8ENGI 60 61 3 146 1576 0.8ENGI 60 62 3 149 1602 0.8ENGI 90 80 3 192 2067 0.8ENGI 90 87 3 209 2248 0.8
13046ENGM 60 49 1.5 22 237 0.3ENGM 60 35 1.5 16 170 0.3

DALHOUSIE MASTER PLANAPPENDIX A - DATA FOR WEEKLY SCHEDULED CONTACT LAB HOURS BY FACULTY
Page A-15 of 82
ENGM 60 60 1.5 27 291 0.3ENGM 60 58 1.5 26 281 0.3ENGM 9999 21 2 13 136 0.3ENGM 9999 6 2 4 39 0.3
1153ENVE 25 11 2 18 189 0.8ENVE 9999 31 3.0 74 801 0.8ENVE 999 19 3 46 491 0.8ENVE 30 24 2 38 413 0.8ENVE 9999 16 3 38 413 0.8ENVE 9999 5 0 0 0.8
2308ENVI 25 26 2 31 336 0.6
336ENVS 4 1 2 1 13 0.6ENVS 10 4 3 7 78 0.6ENVS 10 1 3 2 19 0.6ENVS 10 4 3 7 78 0.6ENVS 10 3 3 5 58 0.6ENVS 10 2 3 4 39 0.6
284ERTH 15 15 3 27 291 0.6ERTH 10 4 3 7 78 0.6ERTH 20 18 3 32 349 0.6ERTH 40 28 3 50 543 0.6ERTH 40 36 3 65 698 0.6ERTH 5 3 3 5 58 0.6ERTH 5 0 3 0 0 0.6ERTH 10 10 3 18 194 0.6ERTH 5 3 3 5 58 0.6ERTH 10 4 3 7 78 0.6ERTH 5 1 3 2 19 0.6ERTH 40 15 3 27 291 0.6ERTH 35 18 3 32 349 0.6ERTH 10 6 3 11 116 0.6ERTH 5 0 3 0 0 0.6ERTH 28 15 2 18 194 0.6ERTH 20 11 2 13 142 0.6ERTH 30 28 3 50 543 0.6ERTH 30 29 3 52 562 0.6ERTH 30 25 3 45 484 0.6ERTH 20 14 3 25 271 0.6ERTH 30 19 3 34 368 0.6
5684FOSC 25 3 3 5 48 0.5FOSC 25 4 3 6 65 0.5FOSC 25 15 3.5 26 283 0.5FOSC 9999 5 3 8 81 0.5FOSC 999 2 3 3 32 0.5FOSC 20 2 3 3 32 0.5FOSC 20 6 3 9 97 0.5FOSC 5 4 3 6 65 0.5
702GEOG 5 3 3 5 48 0.5GEOG 5 1 3 2 16 0.5

DALHOUSIE MASTER PLANAPPENDIX A - DATA FOR WEEKLY SCHEDULED CONTACT LAB HOURS BY FACULTY
Page A-16 of 82
GEOG 5 0 3 0 0 0.5GEOG 5 0 3 0 0 0.5GEOG 5 0 3 0 0 0.5GEOG 5 4 3 6 65 0.5
129HINF 20 11 1.5 5 53 0.3
53HSCE 23 17 1.5 15 165 0.6HSCE 52 37 1.5 33 358 0.6
523IENG 999 25 2 40 431 0.8IENG 50 29 2 46 499 0.8IENG 50 23 2 37 396 0.8IENG 999 25 2 40 431 0.8IENG 999 24 1.5 29 310 0.8IENG 999 24 2 38 413 0.8IENG 999 47 2 75 809 0.8IENG 9999 25 2 40 431 0.8IENG 999 26 2 42 448 0.8IENG 9999 14 2 22 241 0.8IENG 9999 21 2 34 362 0.8IENG 99 53 2 85 913 0.8
5684INFO 30 30 1.5 14 145 0.3INFO 30 23 1.5 10 111 0.3
257KINE 9 7 1 4 38 0.5KINE 9 8 1 4 43 0.5KINE 9 9 1 5 48 0.5KINE 9 9 1 5 48 0.5KINE 9 9 1 5 48 0.5KINE 9 9 1 5 48 0.5KINE 25 10 1.5 8 81 0.5KINE 25 12 1.5 9 97 0.5KINE 25 10 1.5 8 81 0.5KINE 25 24 1.5 18 194 0.5KINE 16 16 1.5 12 129 0.5KINE 16 15 1.5 11 121 0.5KINE 16 12 1.5 9 97 0.5KINE 16 11 1.5 8 89 0.5KINE 16 4 1.5 3 32 0.5KINE 16 13 1.5 10 105 0.5KINE 16 7 1.5 5 57 0.5KINE 17 17 1 9 91 0.5KINE 19 19 1 10 102 0.5KINE 14 14 1 7 75 0.5KINE 9 9 1 5 48 0.5KINE 16 15 1.5 11 121 0.5KINE 25 24 1 12 129 0.5KINE 25 24 1 12 129 0.5KINE 25 25 1 13 135 0.5KINE 25 14 1 7 75 0.5KINE 25 24 1.5 18 194 0.5
2457MARI 18 18 2.5 27 291 0.6

DALHOUSIE MASTER PLANAPPENDIX A - DATA FOR WEEKLY SCHEDULED CONTACT LAB HOURS BY FACULTY
Page A-17 of 82
MARI 17 15 2.5 23 242 0.6MARI 9 7 3 13 136 0.6MARI 9 8 3 14 155 0.6MARI 7 4 3 7 78 0.6MARI 8 3 3 5 58 0.6MARI 33 12 4 29 310 0.6
1269MATL 999 39 3 94 1008 0.8MATL 9999 25 3 60 646 0.8MATL 999 14 3 34 362 0.8MATL 999 14 2 22 241 0.8MATL 999 13 2 21 224 0.8MATL 999 13 2 21 224 0.8MATL 9999 22 3 53 568 0.8MATL 999 22 3 53 568 0.8MATL 9999 0 0 0 0.8MATL 9999 13 3 31 336 0.8MATL 9999 22 3 53 568 0.8MATL 9999 18 3 43 465 0.8
5210MECH 999 61 3 146 1576 0.8MECH 999 57 3 137 1473 0.8MECH 999 59 3 142 1524 0.8MECH 999 60 2 96 1033 0.8MECH 999 61 2 98 1051 0.8MECH 999 57 2 91 982 0.8MECH 20 20 3 48 517 0.8MECH 20 13 2 21 224 0.8MECH 20 13 2 21 224 0.8MECH 9999 21 2 34 362 0.8
8964MICI 46 0 2 0 0 0.6MICI 45 41 2 49 530 0.6MICI 45 42 2 50 543 0.6MICI 12 0 0 0 0.6
1072MINE 40 37 3 89 956 0.8MINE 999 18 3 43 465 0.8MINE 9999 27 3 65 698 0.8MINE 9999 7 3 17 181 0.8MINE 9999 17 2 27 293 0.8MINE 40 36 2 58 620 0.8MINE 9999 9 2 14 155 0.8MINE 30 19 3 46 491 0.8MINE 9999 5 2 8 86 0.8MINE 9999 11 3 26 284 0.8
4228NESC 20 22 1.5 20 213 0.6NESC 20 22 1.5 20 213 0.6NESC 55 49 2 59 633 0.6NESC 6 11 2 13 142 0.6NESC 10 2 1.5 2 19 0.6NESC 5 3 1.5 3 29 0.6
1250NUMT 4 4 2 5 52 0.6

DALHOUSIE MASTER PLANAPPENDIX A - DATA FOR WEEKLY SCHEDULED CONTACT LAB HOURS BY FACULTY
Page A-18 of 82
NUMT 8 5 4 12 129 0.6NUMT 8 2 0 0 0.6NUMT 4 4 2 5 52 0.6NUMT 4 1 2 1 13 0.6NUMT 4 4 2 5 52 0.6
297NURS 34 34 2 20 220 0.3NURS 34 35 2 21 226 0.3NURS 34 33 2 20 213 0.3NURS 33 25 2 15 161 0.3NURS 12 13 4 16 168 0.3NURS 12 14 4 17 181 0.3NURS 12 12 4 14 155 0.3NURS 12 12 4 14 155 0.3NURS 10 10 2 6 65 0.3NURS 10 10 2 6 65 0.3NURS 10 10 2 6 65 0.3NURS 10 10 2 6 65 0.3NURS 10 10 2 6 65 0.3NURS 10 10 2 6 65 0.3NURS 10 10 2 6 65 0.3NURS 10 10 2 6 65 0.3NURS 12 8 4 10 103 0.3NURS 10 10 2 6 65 0.3NURS 7 7 4 8 90 0.3NURS 12 11 2 7 71 0.3NURS 11 9 2 5 58 0.3NURS 11 10 2 6 65 0.3NURS 17 12 2 7 78 0.3NURS 17 17 2 10 110 0.3NURS 17 17 2 10 110 0.3NURS 17 17 2 10 110 0.3NURS 17 17 2 10 110 0.3NURS 17 17 2 10 110 0.3NURS 17 17 2 10 110 0.3NURS 16 13 2 8 84 0.3NURS 16 15 2 9 97 0.3NURS 4 0 4 0 0 0.3NURS 8 8 4 10 103 0.3NURS 6 5 0 0 0.3NURS 12 12 2 7 78 0.3NURS 12 7 2 4 45 0.3NURS 10 10 2 6 65 0.3NURS 10 9 2 5 58 0.3NURS 10 3 2 2 19 0.3
3733OCEA 5 0 2 0 0 0.6OCEA 15 0 2 0 0 0.6
0PETR 30 6 2 10 103 0.8
103PHAR 95 87 3 157 1686 0.6PHAR 95 92 3 166 1783 0.6
3468PHYC 20 15 3 27 291 0.6

DALHOUSIE MASTER PLANAPPENDIX A - DATA FOR WEEKLY SCHEDULED CONTACT LAB HOURS BY FACULTY
Page A-19 of 82
PHYC 51 42 3 76 814 0.6PHYC 52 43 3 77 833 0.6PHYC 52 43 3 77 833 0.6PHYC 50 39 3 70 756 0.6PHYC 51 36 3 65 698 0.6PHYC 48 43 3 77 833 0.6PHYC 70 42 3 76 814 0.6PHYC 45 42 3 76 814 0.6PHYC 70 45 3 81 872 0.6PHYC 50 27 3 49 523 0.6PHYC 35 25 3 45 484 0.6PHYC 40 31 3 56 601 0.6PHYC 10 15 3 27 291 0.6PHYC 43 37 3 67 717 0.6PHYC 10 4 3 7 78 0.6PHYC 30 25 3 45 484 0.6PHYC 5 1 3 2 19 0.6PHYC 38 31 3 56 601 0.6PHYC 1 5 3 9 97 0.6PHYC 15 14 1 8 90 0.6PHYC 9998 1 1 1 6 0.6PHYC 1 1 3 2 19 0.6PHYC 5 0 3 0 0 0.6PHYC 5 1 3 2 19 0.6PHYC 5 1 3 2 19 0.6PHYC 2 1 3 2 19 0.6PHYC 9999 3 0 0 0.6PHYC 48 50 3 90 969 0.6PHYC 1 1 3 2 19 0.6PHYC 9999 0 0 0 0.6PHYC 9999 0 0 0 0.6PHYC 9999 2 0 0 0.6PHYC 9999 0 0 0 0.6
12614PHYL 9998 5 0 0 0.6PHYL 9998 0 0 0 0.6PHYL 60 38 2 46 491 0.6PHYL 60 28 2 34 362 0.6
853PLAN 45 44 3 79 853 0.6
853PSYO 10 13 2 13 140 0.5PSYO 10 20 2 20 215 0.5PSYO 10 16 2 16 172 0.5PSYO 10 16 2 16 172 0.5PSYO 10 17 2 17 183 0.5PSYO 10 17 2 17 183 0.5PSYO 10 15 2 15 161 0.5PSYO 10 16 2 16 172 0.5PSYO 10 18 2 18 194 0.5PSYO 10 18 2 18 194 0.5PSYO 20 0 2 0 0 0.5PSYO 20 14 2 14 151 0.5PSYO 9 6 2 6 65 0.5PSYO 20 11 1.5 8 89 0.5

DALHOUSIE MASTER PLANAPPENDIX A - DATA FOR WEEKLY SCHEDULED CONTACT LAB HOURS BY FACULTY
Page A-20 of 82
PSYO 15 4 1.5 3 32 0.52123
RADT 17 17 3 31 329 0.6RADT 6 6 3 11 116 0.6RADT 6 6 3 11 116 0.6RADT 17 16 1.5 14 155 0.6RADT 5 5 3 9 97 0.6RADT 5 5 3 9 97 0.6RADT 6 6 3 11 116 0.6RADT 6 5 3 9 97 0.6
1124RSPT 15 8 3 14 155 0.6RSPT 10 7 2 8 90 0.6RSPT 15 12 3 22 233 0.6RSPT 15 9 1.5 8 87 0.6RSPT 15 13 3 23 252 0.6RSPT 15 3 1.5 3 29 0.6RSPT 15 12 2 14 155 0.6RSPT 99 6 3 11 116 0.6RSPT 99 6 3 11 116 0.6
1234THEA 24 16 1.5 14 155 0.6THEA 24 19 1.5 17 184 0.6THEA 24 15 1.5 14 145 0.6THEA 24 15 1.5 14 145 0.6THEA 30 10 2 12 129 0.6
75910694 1233 16,357 176,068 176,068
SM SF SF

DALHOUSIE MASTER PLANAPPENDIX B - PROJECTED INCREASE IN UNDERGRADUATE LAB SPACE USED IN COU CALCULATIONS
Page B-21
THIS TABLE IS USED IN CALCULATIONS IN APPENDIX CPROJECTED INCREASE IN LAB (UNDERGRADUATE) SPACE (COU CATEGORY 2)ANALYSIS BASED ON WEEKLY SCHEDULED CONTACT LAB HOURS (WSCLH) IN APPENDIX A
COU Generated Equiv. Lab Space Projected Projected Projected IncreaseLab Space (NASF) Enrolment FTEs (NASF) FTE's Increase in TFE's in Lab SpaceBased on WSCLH Per FTE (NASF) Major Lab
FACULTY for Fall 2008 Fall 2008 Fall 2008 2013 (2008 to 2013) By 2013 GroupArchitecture and Planning 853 253 223 3.818972928 233 10 37 XArts and Social Sciences 759 2665 2351 0.322725902 2754 403 130 ZComputer Science 1133 242 214 5.308293466 224 10 56 ZDentistry N/A 247 218 N/A 247 29 N/AEngineering 63024 1280 1129 55.80269071 1137 8 423 WHealth Professions 13653 2011 1774 7.694297283 1918 144 1105 XLaw N/A 455 401 N/A 457 56 N/AManagement 3656 1325 1169 3.126754062 2238 1069 3342 ZMedicine 4805 391 345 13.92801892 443 98 1365 XScience 88185 2695 2378 37.08465975 2906 528 19583 XInterdisciplinary/Multi Faculty N/A 61 54 N/A 47 -7 N/A
TOTALS 176,068 11625 10257 127 12604 2347 26,041 5-Yr. Incremental Increase
WSLCH Reference calculations in Appendix AFTE Conversion Factor 0.882353
Year 2008 Year 2013 Year 2018 Year 2024 Year 2029 Year 2034176,068 202,109 228,150 254,191 280,232 306,273 (NASF)

DALHOUSIE UNIVERSITY MASTER PLANAPPENDIX C - CALCULATION BY COU STANDARDS METHOD
Page C-22 of 82
DALHOUSIE UNIVERSITY CALCULATIONS INPUT: 2008 ENROLMENT (15277 STUDENTS)
COU COU Total COUCOU COU Space COU Input Generated TOTALS
COU Space Space Factor Input Measure Space INCat. # Category Factor Description Measure Description (NASM) (NASF)
Formula Areas 1 Classroom Facilities 1.23 NASM 13480 FTE Students 16,580 178,4722 Lab Undergraduate
Group W 0.8 NASM 0 WSLCH 0 SeeGroup X 0.6 NASM 0 WSLCH 0 WSCLHGroup Y 0.5 NASM 0 WSLCH 0 SeeGroup Z 0.3 NASM 0 WSLCH 0 176,068 WSCLH
3 Lab Graduate & FacultyGroup A 45 NASM 1197.562 FTE Faculty + 0.5 Other Researchers + 0.5 Graduates 53,890Group B 30 NASM 243.005 FTE Faculty + 0.5 Other Researchers + 0.5 Graduates 7,290Group C 20 NASM 0 FTE Faculty + 0.5 Other Researchers + 0.5 Graduates 0Group D 10 NASM 114.72 FTE Faculty + 0.5 Other Researchers + 0.5 Graduates 1,147Group E 1 NASM 701.82 FTE Faculty + 0.5 Other Researchers + 0.5 Graduates 702 678,466
4 Academic Office & Related SpaceFaculty 13 NASM 1177 FTE Faculty + 15% Allowance 15,305
Other Research Appointments 13 NASM 115 FTE Other Research Appointments 1,495Graduate Sudents 4 NASM 2652 FTE Graduate Students 10,606
Non-Academic Staff 13 NASM 590 FTE Academic Staff Requiring Offices 7,670Office Services 25% NASM 25% 25% of above 8,769 471,970
5 Campus Study Space & Library FacilitiesStudy 0.6 NASM 13480 FTE Students 8,088
Student Computer Rooms 0.08 NASM 10257 FTE Undergraduate Students 821Stack (Compact Storage) 0.004 NASM 0 EV for actual % of Collection in Compact Storage 0
Stack Remainder 1 0.007 NASM 300000 EV for 0-300,000 volumes 2,100Stack Remainder 2 0.006 NASM 300000 EV for next 300,000 volumes 1,800Stack Remainder 3 0.005 NASM 1244260 EV for rest of collection 6,221
Service 0.25 0.25x(Stack&Study) No Input Required 25% of Stack and Study Totals 4552 253,843 Atypical6 Recreation Athletic Space
All Institutions 0.9 NASM 13480 FTE Students 12,132Institutions with less than 4,000 FTE 2000 NASM No Input Required PLUS ? CheckInstitutions with 4,000 to 8,000 FTE 1000 NASM No Input Required PLUS ? 0 130,589 Check
7 Food ServicesLow Range 0.5 NASM 13480 FTE Students 6,740High Range 0.7 NASM FTE Students 0 72,550
8 Bookstore & Merchandizing FacilitiesLow Range 0.5 NASM 13480 FTE Students 6,740High Range 0.7 NASM FTE Students 0 72,550
9 Plant Maintenance 0.015 1.5% of Total NASM No Input Required Sum of NASM Categories 1-15 (& 17-20 if applied) 3,001 32,303 Atypical10 Administrative Offices & Related Space
Administrative Offices 13 NASM 832 FTE Non-Academic Staff Requiring Offices 10,816Office Services 0.5 50% of NASM No Input Required 50% of Space Generated for Non-Academic Staff 5,408 174,639 Atypical
11 AV/TV FacilitiesLow Range 0.05 NASM 13480 FTE Students 674High Range 0.35 NASM FTE Students 0 7,255
12 Central ServicesLow Range 0.1 NASM 13480 FTE Students 1,348High Range 0.3 NASM FTE Students 0 14,510
13 Health Service FacilitiesLow Range 0.03 NASM 13480 FTE Students 404High Range 0.05 NASM FTE Students 0 4,353

DALHOUSIE UNIVERSITY MASTER PLANAPPENDIX C - CALCULATION BY COU STANDARDS METHOD
Page C-23 of 82
14 Student Activity SpaceLow Range 0.5 NASM 13480 FTE Students 6,740High Range 0.7 NASM FTE Students 0 72,550
15 Assembly & Exhibition FacilitiesLow Range 0.15 NASM 13480 FTE Students 2,022High Range 0.4 NASM FTE Students 0 21,765
TOTAL NASF 2,361,881NASM to NASF Conversion Factor 10.76426265
TOTAL NASM 219,419

DALHOUSIE UNIVERSITY MASTER PLANAPPENDIX C - CALCULATION BY COU STANDARDS METHOD
Page C-24 of 82
DALHOUSIE UNIVERSITY CALCULATIONS INPUT: INCREMENTAL INCREASE OF 2,506 STUDENTS BY YEAR 2013
COU COU Total COUCOU COU Space COU Input Generated TOTALS
COU Space Space Factor Input Measure Space INCat. # Category Factor Description Measure Description (NASM) (NASF)
Formula Areas 1 Classroom Facilities 1.23 NASM 2211 FTE Students 2,720 29,2762 Lab Undergraduate
Group W 0.8 NASM 0 WSLCH 0 SeeGroup X 0.6 NASM 0 WSLCH 0 WSCLHGroup Y 0.5 NASM 0 WSLCH 0 SeeGroup Z 0.3 NASM 0 WSLCH 0 26,041 WSCLH
3 Lab Graduate & FacultyGroup A 45 NASM 62.95102909 FTE Faculty + 0.5 Other Researchers + 0.5 Graduates 2,833Group B 30 NASM 0.488353687 FTE Faculty + 0.5 Other Researchers + 0.5 Graduates 15 Approx.Group C 20 NASM 0 FTE Faculty + 0.5 Other Researchers + 0.5 Graduates 0 2% / Yr.Group D 10 NASM 0.806810519 FTE Faculty + 0.5 Other Researchers + 0.5 Graduates 8 ofGroup E 1 NASM 73.56508316 FTE Faculty + 0.5 Other Researchers + 0.5 Graduates 74 31,529 Existing
4 Academic Office & Related SpaceFaculty 13 NASM 158 FTE Faculty + 15% Allowance 2,060
Other Research Appointments 13 NASM 0 FTE Other Research Appointments 0Graduate Sudents 4 NASM 0 FTE Graduate Students 0
Non-Academic Staff 13 NASM 97 FTE Academic Staff Requiring Offices 1,258Office Services 25% NASM 25% 25% of above 830 44,651
5 Campus Study Space & Library FacilitiesStudy 0.6 NASM 2211 FTE Students 1,327
Student Computer Rooms 0.08 NASM 2211 FTE Undergraduate Students 177Stack (Compact Storage) 0.004 NASM 0 EV for actual % of Collection in Compact Storage 0
Stack Remainder 1 0.007 NASM 125000 EV for 0-300,000 volumes 875Stack Remainder 2 0.006 NASM 0 EV for next 300,000 volumes 0Stack Remainder 3 0.005 NASM 0 EV for rest of collection 0
Service 0.25 0.25x(Stack&Study) No Input Required 25% of Stack and Study Totals 550 31,529 Atypical6 Recreation Athletic Space
All Institutions 0.9 NASM 2211 FTE Students 1,990Institutions with less than 4,000 FTE 2000 NASM No Input Required PLUS ? CheckInstitutions with 4,000 to 8,000 FTE 1000 NASM No Input Required PLUS ? 0 21,422 Check
7 Food ServicesLow Range 0.5 NASM 2211 FTE Students 1,106High Range 0.7 NASM FTE Students 0 11,901
8 Bookstore & Merchandizing FacilitiesLow Range 0.5 NASM 2211 FTE Students 1,106High Range 0.7 NASM FTE Students 0 11,901
9 Plant Maintenance 0.015 1.5% of Total NASM No Input Required Sum of NASM Categories 1-15 (& 17-20 if applied) 321 3,459 Atypical10 Administrative Offices & Related Space
Administrative Offices 13 NASM 136 FTE Non-Academic Staff Requiring Offices 1,774Office Services 0.5 50% of NASM No Input Required 50% of Space Generated for Non-Academic Staff 887 28,647 Atypical
11 AV/TV FacilitiesLow Range 0.05 NASM 2211 FTE Students 111High Range 0.35 NASM FTE Students 0 1,190
12 Central ServicesLow Range 0.1 NASM 2211 FTE Students 221High Range 0.3 NASM FTE Students 0 2,380
13 Health Service FacilitiesLow Range 0.03 NASM 2211 FTE Students 66High Range 0.05 NASM FTE Students 0 714

DALHOUSIE UNIVERSITY MASTER PLANAPPENDIX C - CALCULATION BY COU STANDARDS METHOD
Page C-25 of 82
14 Student Activity SpaceLow Range 0.5 NASM 2211 FTE Students 1,106High Range 0.7 NASM FTE Students 0 11,901
15 Assembly & Exhibition FacilitiesLow Range 0.15 NASM 2211 FTE Students 332High Range 0.4 NASM FTE Students 0 3,570
TOTAL NASF 260,111NASM to NASF Conversion Factor 10.76426265
TOTAL NASM 24,164

DALHOUSIE UNIVERSITY MASTER PLANAPPENDIX C - CALCULATION BY COU STANDARDS METHOD
Page C-26 of 82
FACULTY OF ARCHITECTURE AND PLANNINGCALCULATIONS INPUT: INCREMENTAL INCREASE OF 11 STUDENTS BY YEAR 2013
COU COU Total COUCOU COU Space COU Input Generated TOTALS
COU Space Space Factor Input Measure Space INCat. # Category Factor Description Measure Description (NASM) (NASF)
Formula Areas 1 Classroom Facilities 1.23 NASM 10 FTE Students 12 1292 Lab Undergraduate
Group W 0.8 NASM 0 WSLCH 0 SeeGroup X 0.6 NASM 0 WSLCH 0 WSCLHGroup Y 0.5 NASM 0 WSLCH 0 SeeGroup Z 0.3 NASM 0 WSLCH 0 37 WSCLH
3 Lab Graduate & FacultyGroup A 45 NASM FTE Faculty + 0.5 Other Researchers + 0.5 Graduates 0Group B 30 NASM FTE Faculty + 0.5 Other Researchers + 0.5 Graduates 0Group C 20 NASM FTE Faculty + 0.5 Other Researchers + 0.5 Graduates 0Group D 10 NASM FTE Faculty + 0.5 Other Researchers + 0.5 Graduates 0Group E 1 NASM 0.679163345 FTE Faculty + 0.5 Other Researchers + 0.5 Graduates 1 7
4 Academic Office & Related SpaceFaculty 13 NASM 1 FTE Faculty + 15% Allowance 10
Other Research Appointments 13 NASM FTE Other Research Appointments 0Graduate Sudents 4 NASM FTE Graduate Students 0
Non-Academic Staff 13 NASM FTE Academic Staff Requiring Offices 0Office Services 25% NASM 25% 25% of above 3 137
5 Campus Study Space & Library FacilitiesStudy 0.6 NASM 10 FTE Students 6
Student Computer Rooms 0.08 NASM 10 FTE Undergraduate Students 1Stack (Compact Storage) 0.004 NASM 0 EV for actual % of Collection in Compact Storage 0
Stack Remainder 1 0.007 NASM 550 EV for 0-300,000 volumes 4Stack Remainder 2 0.006 NASM 0 EV for next 300,000 volumes 0Stack Remainder 3 0.005 NASM 0 EV for rest of collection 0
Service 0.25 0.25x(Stack&Study) No Input Required 25% of Stack and Study Totals 2 139 Atypical6 Recreation Athletic Space
All Institutions 0.9 NASM 10 FTE Students 9Institutions with less than 4,000 FTE 2000 NASM No Input Required PLUS ? CheckInstitutions with 4,000 to 8,000 FTE 1000 NASM No Input Required PLUS ? 0 94 Check
7 Food ServicesLow Range 0.5 NASM 10 FTE Students 5High Range 0.7 NASM FTE Students 0 52
8 Bookstore & Merchandizing FacilitiesLow Range 0.5 NASM 10 FTE Students 5High Range 0.7 NASM FTE Students 0 52
9 Plant Maintenance 0.015 1.5% of Total NASM No Input Required Sum of NASM Categories 1-15 (& 17-20 if applied) 1 10 Atypical10 Administrative Offices & Related Space
Administrative Offices 13 NASM FTE Non-Academic Staff Requiring Offices 0Office Services 0.5 50% of NASM No Input Required 50% of Space Generated for Non-Academic Staff 0 0 Atypical
11 AV/TV FacilitiesLow Range 0.05 NASM 10 FTE Students 0High Range 0.35 NASM FTE Students 0 5
12 Central ServicesLow Range 0.1 NASM 10 FTE Students 1High Range 0.3 NASM FTE Students 0 10
13 Health Service FacilitiesLow Range 0.03 NASM 10 FTE Students 0High Range 0.05 NASM FTE Students 0 3

DALHOUSIE UNIVERSITY MASTER PLANAPPENDIX C - CALCULATION BY COU STANDARDS METHOD
Page C-27 of 82
14 Student Activity SpaceLow Range 0.5 NASM 10 FTE Students 5High Range 0.7 NASM FTE Students 0 52
15 Assembly & Exhibition FacilitiesLow Range 0.15 NASM 10 FTE Students 1High Range 0.4 NASM FTE Students 0 16
TOTAL NASF 744NASM to NASF Conversion Factor 10.76426265
TOTAL NASM 69

DALHOUSIE UNIVERSITY MASTER PLANAPPENDIX C - CALCULATION BY COU STANDARDS METHOD
Page C-28 of 82
FACULTY OF ENGINEERINGCALCULATIONS INPUT: INCREMENTAL INCREASE OF 9 STUDENTS BY YEAR 2013
COU COU Total COUCOU COU Space COU Input Generated TOTALS
COU Space Space Factor Input Measure Space INCat. # Category Factor Description Measure Description (NASM) (NASF)
Formula Areas 1 Classroom Facilities 1.23 NASM 8 FTE Students 10 1052 Lab Undergraduate
Group W 0.8 NASM 0 WSLCH 0 SeeGroup X 0.6 NASM 0 WSLCH 0 WSCLHGroup Y 0.5 NASM 0 WSLCH 0 SeeGroup Z 0.3 NASM 0 WSLCH 0 423 WSCLH
3 Lab Graduate & FacultyGroup A 45 NASM FTE Faculty + 0.5 Other Researchers + 0.5 Graduates 0Group B 30 NASM 0.488353687 FTE Faculty + 0.5 Other Researchers + 0.5 Graduates 15Group C 20 NASM FTE Faculty + 0.5 Other Researchers + 0.5 Graduates 0Group D 10 NASM FTE Faculty + 0.5 Other Researchers + 0.5 Graduates 0Group E 1 NASM FTE Faculty + 0.5 Other Researchers + 0.5 Graduates 0 158
4 Academic Office & Related SpaceFaculty 13 NASM 0 FTE Faculty + 15% Allowance 6
Other Research Appointments 13 NASM FTE Other Research Appointments 0Graduate Sudents 4 NASM FTE Graduate Students 0
Non-Academic Staff 13 NASM FTE Academic Staff Requiring Offices 0Office Services 25% NASM 25% 25% of above 2 85
5 Campus Study Space & Library FacilitiesStudy 0.6 NASM 8 FTE Students 5
Student Computer Rooms 0.08 NASM 8 FTE Undergraduate Students 1Stack (Compact Storage) 0.004 NASM 0 EV for actual % of Collection in Compact Storage 0
Stack Remainder 1 0.007 NASM 450 EV for 0-300,000 volumes 3Stack Remainder 2 0.006 NASM 0 EV for next 300,000 volumes 0Stack Remainder 3 0.005 NASM 0 EV for rest of collection 0
Service 0.25 0.25x(Stack&Study) No Input Required 25% of Stack and Study Totals 2 113 Atypical6 Recreation Athletic Space
All Institutions 0.9 NASM 8 FTE Students 7Institutions with less than 4,000 FTE 2000 NASM No Input Required PLUS ? CheckInstitutions with 4,000 to 8,000 FTE 1000 NASM No Input Required PLUS ? 0 77 Check
7 Food ServicesLow Range 0.5 NASM 8 FTE Students 4High Range 0.7 NASM FTE Students 0 43
8 Bookstore & Merchandizing FacilitiesLow Range 0.5 NASM 8 FTE Students 4High Range 0.7 NASM FTE Students 0 43
9 Plant Maintenance 0.015 1.5% of Total NASM No Input Required Sum of NASM Categories 1-15 (& 17-20 if applied) 1 10 Atypical10 Administrative Offices & Related Space
Administrative Offices 13 NASM FTE Non-Academic Staff Requiring Offices 0Office Services 0.5 50% of NASM No Input Required 50% of Space Generated for Non-Academic Staff 0 0 Atypical
11 AV/TV FacilitiesLow Range 0.05 NASM 8 FTE Students 0High Range 0.35 NASM FTE Students 0 4
12 Central ServicesLow Range 0.1 NASM 8 FTE Students 1High Range 0.3 NASM FTE Students 0 9
13 Health Service FacilitiesLow Range 0.03 NASM 8 FTE Students 0High Range 0.05 NASM FTE Students 0 3

DALHOUSIE UNIVERSITY MASTER PLANAPPENDIX C - CALCULATION BY COU STANDARDS METHOD
Page C-29 of 82
14 Student Activity SpaceLow Range 0.5 NASM 8 FTE Students 4High Range 0.7 NASM FTE Students 0 43
15 Assembly & Exhibition FacilitiesLow Range 0.15 NASM 8 FTE Students 1High Range 0.4 NASM FTE Students 0 13
TOTAL NASF 1,129NASM to NASF Conversion Factor 10.76426265
TOTAL NASM 105

DALHOUSIE UNIVERSITY MASTER PLANAPPENDIX C - CALCULATION BY COU STANDARDS METHOD
Page C-30 of 82
FACULTY OF ARTS AND SOCIAL SCIENCESCALCULATIONS INPUT: INCREMENTAL INCREASE OF 456 STUDENTS BY YEAR 2013
COU COU Total COUCOU COU Space COU Input Generated TOTALS
COU Space Space Factor Input Measure Space INCat. # Category Factor Description Measure Description (NASM) (NASF)
Formula Areas 1 Classroom Facilities 1.23 NASM 402 FTE Students 495 5,3272 Lab Undergraduate
Group W 0.8 NASM 0 WSLCH 0 SeeGroup X 0.6 NASM 0 WSLCH 0 WSCLHGroup Y 0.5 NASM 0 WSLCH 0 SeeGroup Z 0.3 NASM 0 WSLCH 0 130 WSCLH
3 Lab Graduate & FacultyGroup A 45 NASM FTE Faculty + 0.5 Other Researchers + 0.5 Graduates 0Group B 30 NASM FTE Faculty + 0.5 Other Researchers + 0.5 Graduates 0Group C 20 NASM FTE Faculty + 0.5 Other Researchers + 0.5 Graduates 0Group D 10 NASM FTE Faculty + 0.5 Other Researchers + 0.5 Graduates 0Group E 1 NASM 25.92975521 FTE Faculty + 0.5 Other Researchers + 0.5 Graduates 26 279
4 Academic Office & Related SpaceFaculty 13 NASM 26 FTE Faculty + 15% Allowance 337
Other Research Appointments 13 NASM FTE Other Research Appointments 0Graduate Sudents 4 NASM FTE Graduate Students 0
Non-Academic Staff 13 NASM FTE Academic Staff Requiring Offices 0Office Services 25% NASM 25% 25% of above 84 4,536
5 Campus Study Space & Library FacilitiesStudy 0.6 NASM 402 FTE Students 241
Student Computer Rooms 0.08 NASM 402 FTE Undergraduate Students 32Stack (Compact Storage) 0.004 NASM 0 EV for actual % of Collection in Compact Storage 0
Stack Remainder 1 0.007 NASM 22800 EV for 0-300,000 volumes 160Stack Remainder 2 0.006 NASM 0 EV for next 300,000 volumes 0Stack Remainder 3 0.005 NASM 0 EV for rest of collection 0
Service 0.25 0.25x(Stack&Study) No Input Required 25% of Stack and Study Totals 100 5,742 Atypical6 Recreation Athletic Space
All Institutions 0.9 NASM 402 FTE Students 362Institutions with less than 4,000 FTE 2000 NASM No Input Required PLUS ? CheckInstitutions with 4,000 to 8,000 FTE 1000 NASM No Input Required PLUS ? 0 3,898 Check
7 Food ServicesLow Range 0.5 NASM 402 FTE Students 201High Range 0.7 NASM FTE Students 0 2,166
8 Bookstore & Merchandizing FacilitiesLow Range 0.5 NASM 402 FTE Students 201High Range 0.7 NASM FTE Students 0 2,166
9 Plant Maintenance 0.015 1.5% of Total NASM No Input Required Sum of NASM Categories 1-15 (& 17-20 if applied) 39 416 Atypical10 Administrative Offices & Related Space
Administrative Offices 13 NASM FTE Non-Academic Staff Requiring Offices 0Office Services 0.5 50% of NASM No Input Required 50% of Space Generated for Non-Academic Staff 0 0 Atypical
11 AV/TV FacilitiesLow Range 0.05 NASM 402 FTE Students 20High Range 0.35 NASM FTE Students 0 217
12 Central ServicesLow Range 0.1 NASM 402 FTE Students 40High Range 0.3 NASM FTE Students 0 433
13 Health Service FacilitiesLow Range 0.03 NASM 402 FTE Students 12High Range 0.05 NASM FTE Students 0 130

DALHOUSIE UNIVERSITY MASTER PLANAPPENDIX C - CALCULATION BY COU STANDARDS METHOD
Page C-31 of 82
14 Student Activity SpaceLow Range 0.5 NASM 402 FTE Students 201High Range 0.7 NASM FTE Students 0 2,166
15 Assembly & Exhibition FacilitiesLow Range 0.15 NASM 402 FTE Students 60High Range 0.4 NASM FTE Students 0 650
TOTAL NASF 28,253NASM to NASF Conversion Factor 10.76426265
TOTAL NASM 2,625

DALHOUSIE UNIVERSITY MASTER PLANAPPENDIX C - CALCULATION BY COU STANDARDS METHOD
Page C-32 of 82
FACULTY OF COMPUTER SCIENCECALCULATIONS INPUT: INCREMENTAL INCREASE OF 12 STUDENTS BY YEAR 2013
COU COU Total COUCOU COU Space COU Input Generated TOTALS
COU Space Space Factor Input Measure Space INCat. # Category Factor Description Measure Description (NASM) (NASF)
Formula Areas 1 Classroom Facilities 1.23 NASM 11 FTE Students 13 1402 Lab Undergraduate
Group W 0.8 NASM 0 WSLCH 0 SeeGroup X 0.6 NASM 0 WSLCH 0 WSCLHGroup Y 0.5 NASM 0 WSLCH 0 SeeGroup Z 0.3 NASM 0 WSLCH 0 56 WSCLH
3 Lab Graduate & FacultyGroup A 45 NASM FTE Faculty + 0.5 Other Researchers + 0.5 Graduates 0Group B 30 NASM FTE Faculty + 0.5 Other Researchers + 0.5 Graduates 0Group C 20 NASM FTE Faculty + 0.5 Other Researchers + 0.5 Graduates 0Group D 10 NASM 0.806810519 FTE Faculty + 0.5 Other Researchers + 0.5 Graduates 8Group E 1 NASM FTE Faculty + 0.5 Other Researchers + 0.5 Graduates 0 87
4 Academic Office & Related SpaceFaculty 13 NASM 1 FTE Faculty + 15% Allowance 12
Other Research Appointments 13 NASM FTE Other Research Appointments 0Graduate Sudents 4 NASM FTE Graduate Students 0
Non-Academic Staff 13 NASM FTE Academic Staff Requiring Offices 0Office Services 25% NASM 25% 25% of above 3 162
5 Campus Study Space & Library FacilitiesStudy 0.6 NASM 11 FTE Students 6
Student Computer Rooms 0.08 NASM 11 FTE Undergraduate Students 1Stack (Compact Storage) 0.004 NASM 0 EV for actual % of Collection in Compact Storage 0
Stack Remainder 1 0.007 NASM 600 EV for 0-300,000 volumes 4Stack Remainder 2 0.006 NASM 0 EV for next 300,000 volumes 0Stack Remainder 3 0.005 NASM 0 EV for rest of collection 0
Service 0.25 0.25x(Stack&Study) No Input Required 25% of Stack and Study Totals 3 151 Atypical6 Recreation Athletic Space
All Institutions 0.9 NASM 11 FTE Students 10Institutions with less than 4,000 FTE 2000 NASM No Input Required PLUS ? CheckInstitutions with 4,000 to 8,000 FTE 1000 NASM No Input Required PLUS ? 0 103 Check
7 Food ServicesLow Range 0.5 NASM 11 FTE Students 5High Range 0.7 NASM FTE Students 0 57
8 Bookstore & Merchandizing FacilitiesLow Range 0.5 NASM 11 FTE Students 5High Range 0.7 NASM FTE Students 0 57
9 Plant Maintenance 0.015 1.5% of Total NASM No Input Required Sum of NASM Categories 1-15 (& 17-20 if applied) 1 13 Atypical10 Administrative Offices & Related Space
Administrative Offices 13 NASM FTE Non-Academic Staff Requiring Offices 0Office Services 0.5 50% of NASM No Input Required 50% of Space Generated for Non-Academic Staff 0 0 Atypical
11 AV/TV FacilitiesLow Range 0.05 NASM 11 FTE Students 1High Range 0.35 NASM FTE Students 0 6
12 Central ServicesLow Range 0.1 NASM 11 FTE Students 1High Range 0.3 NASM FTE Students 0 11
13 Health Service FacilitiesLow Range 0.03 NASM 11 FTE Students 0High Range 0.05 NASM FTE Students 0 3

DALHOUSIE UNIVERSITY MASTER PLANAPPENDIX C - CALCULATION BY COU STANDARDS METHOD
Page C-33 of 82
14 Student Activity SpaceLow Range 0.5 NASM 11 FTE Students 5High Range 0.7 NASM FTE Students 0 57
15 Assembly & Exhibition FacilitiesLow Range 0.15 NASM 11 FTE Students 2High Range 0.4 NASM FTE Students 0 17
TOTAL NASF 920NASM to NASF Conversion Factor 10.76426265
TOTAL NASM 85

DALHOUSIE UNIVERSITY MASTER PLANAPPENDIX C - CALCULATION BY COU STANDARDS METHOD
Page C-34 of 82
FACULTY OF LAWCALCULATIONS INPUT: INCREMENTAL INCREASE OF 2 STUDENTS BY YEAR 2013
COU COU Total COUCOU COU Space COU Input Generated TOTALS
COU Space Space Factor Input Measure Space INCat. # Category Factor Description Measure Description (NASM) (NASF)
Formula Areas 1 Classroom Facilities 1.23 NASM 2 FTE Students 2 232 Lab Undergraduate
Group W 0.8 NASM 0 WSLCH 0 SeeGroup X 0.6 NASM 0 WSLCH 0 WSCLHGroup Y 0.5 NASM 0 WSLCH 0 SeeGroup Z 0.3 NASM 0 WSLCH 0 0 WSCLH
3 Lab Graduate & FacultyGroup A 45 NASM FTE Faculty + 0.5 Other Researchers + 0.5 Graduates 0Group B 30 NASM FTE Faculty + 0.5 Other Researchers + 0.5 Graduates 0Group C 20 NASM FTE Faculty + 0.5 Other Researchers + 0.5 Graduates 0Group D 10 NASM FTE Faculty + 0.5 Other Researchers + 0.5 Graduates 0Group E 1 NASM 0.161887974 FTE Faculty + 0.5 Other Researchers + 0.5 Graduates 0 2
4 Academic Office & Related SpaceFaculty 13 NASM 0 FTE Faculty + 15% Allowance 2
Other Research Appointments 13 NASM FTE Other Research Appointments 0Graduate Sudents 4 NASM FTE Graduate Students 0
Non-Academic Staff 13 NASM FTE Academic Staff Requiring Offices 0Office Services 25% NASM 25% 25% of above 1 33
5 Campus Study Space & Library FacilitiesStudy 0.6 NASM 2 FTE Students 1
Student Computer Rooms 0.08 NASM 2 FTE Undergraduate Students 0Stack (Compact Storage) 0.004 NASM 0 EV for actual % of Collection in Compact Storage 0
Stack Remainder 1 0.007 NASM 100 EV for 0-300,000 volumes 1Stack Remainder 2 0.006 NASM 0 EV for next 300,000 volumes 0Stack Remainder 3 0.005 NASM 0 EV for rest of collection 0
Service 0.25 0.25x(Stack&Study) No Input Required 25% of Stack and Study Totals 0 25 Atypical6 Recreation Athletic Space
All Institutions 0.9 NASM 2 FTE Students 2Institutions with less than 4,000 FTE 2000 NASM No Input Required PLUS ? CheckInstitutions with 4,000 to 8,000 FTE 1000 NASM No Input Required PLUS ? 0 17 Check
7 Food ServicesLow Range 0.5 NASM 2 FTE Students 1High Range 0.7 NASM FTE Students 0 9
8 Bookstore & Merchandizing FacilitiesLow Range 0.5 NASM 2 FTE Students 1High Range 0.7 NASM FTE Students 0 9
9 Plant Maintenance 0.015 1.5% of Total NASM No Input Required Sum of NASM Categories 1-15 (& 17-20 if applied) 0 2 Atypical10 Administrative Offices & Related Space
Administrative Offices 13 NASM FTE Non-Academic Staff Requiring Offices 0Office Services 0.5 50% of NASM No Input Required 50% of Space Generated for Non-Academic Staff 0 0 Atypical
11 AV/TV FacilitiesLow Range 0.05 NASM 2 FTE Students 0High Range 0.35 NASM FTE Students 0 1
12 Central ServicesLow Range 0.1 NASM 2 FTE Students 0High Range 0.3 NASM FTE Students 0 2
13 Health Service FacilitiesLow Range 0.03 NASM 2 FTE Students 0High Range 0.05 NASM FTE Students 0 1

DALHOUSIE UNIVERSITY MASTER PLANAPPENDIX C - CALCULATION BY COU STANDARDS METHOD
Page C-35 of 82
14 Student Activity SpaceLow Range 0.5 NASM 2 FTE Students 1High Range 0.7 NASM FTE Students 0 9
15 Assembly & Exhibition FacilitiesLow Range 0.15 NASM 2 FTE Students 0High Range 0.4 NASM FTE Students 0 3
TOTAL NASF 137NASM to NASF Conversion Factor 10.76426265
TOTAL NASM 13

DALHOUSIE UNIVERSITY MASTER PLANAPPENDIX C - CALCULATION BY COU STANDARDS METHOD
Page C-36 of 82
FACULTY OF MANAGEMENTCALCULATIONS INPUT: INCREMENTAL INCREASE OF 1211 STUDENTS BY YEAR 2013
COU COU Total COUCOU COU Space COU Input Generated TOTALS
COU Space Space Factor Input Measure Space INCat. # Category Factor Description Measure Description (NASM) (NASF)
Formula Areas 1 Classroom Facilities 1.23 NASM 1069 FTE Students 1,314 14,1472 Lab Undergraduate
Group W 0.8 NASM 0 WSLCH 0 SeeGroup X 0.6 NASM 0 WSLCH 0 WSCLHGroup Y 0.5 NASM 0 WSLCH 0 SeeGroup Z 0.3 NASM 0 WSLCH 0 3,342 WSCLH
3 Lab Graduate & FacultyGroup A 45 NASM FTE Faculty + 0.5 Other Researchers + 0.5 Graduates 0Group B 30 NASM FTE Faculty + 0.5 Other Researchers + 0.5 Graduates 0Group C 20 NASM FTE Faculty + 0.5 Other Researchers + 0.5 Graduates 0Group D 10 NASM FTE Faculty + 0.5 Other Researchers + 0.5 Graduates 0Group E 1 NASM 46.79427662 FTE Faculty + 0.5 Other Researchers + 0.5 Graduates 47 504
4 Academic Office & Related SpaceFaculty 13 NASM 54 FTE Faculty + 15% Allowance 700
Other Research Appointments 13 NASM FTE Other Research Appointments 0Graduate Sudents 4 NASM FTE Graduate Students 0
Non-Academic Staff 13 NASM FTE Academic Staff Requiring Offices 0Office Services 25% NASM 25% 25% of above 175 9,413
5 Campus Study Space & Library FacilitiesStudy 0.6 NASM 1069 FTE Students 641
Student Computer Rooms 0.08 NASM 1069 FTE Undergraduate Students 85Stack (Compact Storage) 0.004 NASM 0 EV for actual % of Collection in Compact Storage 0
Stack Remainder 1 0.007 NASM 60550 EV for 0-300,000 volumes 424Stack Remainder 2 0.006 NASM 0 EV for next 300,000 volumes 0Stack Remainder 3 0.005 NASM 0 EV for rest of collection 0
Service 0.25 0.25x(Stack&Study) No Input Required 25% of Stack and Study Totals 266 15,250 Atypical6 Recreation Athletic Space
All Institutions 0.9 NASM 1069 FTE Students 962Institutions with less than 4,000 FTE 2000 NASM No Input Required PLUS ? CheckInstitutions with 4,000 to 8,000 FTE 1000 NASM No Input Required PLUS ? 0 10,352 Check
7 Food ServicesLow Range 0.5 NASM 1069 FTE Students 534High Range 0.7 NASM FTE Students 0 5,751
8 Bookstore & Merchandizing FacilitiesLow Range 0.5 NASM 1069 FTE Students 534High Range 0.7 NASM FTE Students 0 5,751
9 Plant Maintenance 0.015 1.5% of Total NASM No Input Required Sum of NASM Categories 1-15 (& 17-20 if applied) 99 1,061 Atypical10 Administrative Offices & Related Space
Administrative Offices 13 NASM FTE Non-Academic Staff Requiring Offices 0Office Services 0.5 50% of NASM No Input Required 50% of Space Generated for Non-Academic Staff 0 0 Atypical
11 AV/TV FacilitiesLow Range 0.05 NASM 1069 FTE Students 53High Range 0.35 NASM FTE Students 0 575
12 Central ServicesLow Range 0.1 NASM 1069 FTE Students 107High Range 0.3 NASM FTE Students 0 1,150
13 Health Service FacilitiesLow Range 0.03 NASM 1069 FTE Students 32High Range 0.05 NASM FTE Students 0 345

DALHOUSIE UNIVERSITY MASTER PLANAPPENDIX C - CALCULATION BY COU STANDARDS METHOD
Page C-37 of 82
14 Student Activity SpaceLow Range 0.5 NASM 1069 FTE Students 534High Range 0.7 NASM FTE Students 0 5,751
15 Assembly & Exhibition FacilitiesLow Range 0.15 NASM 1069 FTE Students 160High Range 0.4 NASM FTE Students 0 1,725
TOTAL NASF 75,117NASM to NASF Conversion Factor 10.76426265
TOTAL NASM 6,978

DALHOUSIE UNIVERSITY MASTER PLANAPPENDIX C - CALCULATION BY COU STANDARDS METHOD
Page C-38 of 82
FACULTY OF SCIENCECALCULATIONS INPUT: INCREMENTAL INCREASE OF 598 STUDENTS BY YEAR 2013
COU COU Total COUCOU COU Space COU Input Generated TOTALS
COU Space Space Factor Input Measure Space INCat. # Category Factor Description Measure Description (NASM) (NASF)
Formula Areas 1 Classroom Facilities 1.23 NASM 528 FTE Students 649 6,9862 Lab Undergraduate
Group W 0.8 NASM 0 WSLCH 0 SeeGroup X 0.6 NASM 0 WSLCH 0 WSCLHGroup Y 0.5 NASM 0 WSLCH 0 SeeGroup Z 0.3 NASM 0 WSLCH 0 19,583 WSCLH
3 Lab Graduate & FacultyGroup A 45 NASM 37.39502126 FTE Faculty + 0.5 Other Researchers + 0.5 Graduates 1,683Group B 30 NASM FTE Faculty + 0.5 Other Researchers + 0.5 Graduates 0Group C 20 NASM FTE Faculty + 0.5 Other Researchers + 0.5 Graduates 0Group D 10 NASM FTE Faculty + 0.5 Other Researchers + 0.5 Graduates 0Group E 1 NASM FTE Faculty + 0.5 Other Researchers + 0.5 Graduates 0 18,114
4 Academic Office & Related SpaceFaculty 13 NASM 43 FTE Faculty + 15% Allowance 559
Other Research Appointments 13 NASM FTE Other Research Appointments 0Graduate Sudents 4 NASM FTE Graduate Students 0
Non-Academic Staff 13 NASM FTE Academic Staff Requiring Offices 0Office Services 25% NASM 25% 25% of above 140 7,522
5 Campus Study Space & Library FacilitiesStudy 0.6 NASM 528 FTE Students 317
Student Computer Rooms 0.08 NASM 528 FTE Undergraduate Students 42Stack (Compact Storage) 0.004 NASM 0 EV for actual % of Collection in Compact Storage 0
Stack Remainder 1 0.007 NASM 29900 EV for 0-300,000 volumes 209Stack Remainder 2 0.006 NASM 0 EV for next 300,000 volumes 0Stack Remainder 3 0.005 NASM 0 EV for rest of collection 0
Service 0.25 0.25x(Stack&Study) No Input Required 25% of Stack and Study Totals 131 7,530 Atypical6 Recreation Athletic Space
All Institutions 0.9 NASM 528 FTE Students 475Institutions with less than 4,000 FTE 2000 NASM No Input Required PLUS ? CheckInstitutions with 4,000 to 8,000 FTE 1000 NASM No Input Required PLUS ? 0 5,112 Check
7 Food ServicesLow Range 0.5 NASM 528 FTE Students 264High Range 0.7 NASM FTE Students 0 2,840
8 Bookstore & Merchandizing FacilitiesLow Range 0.5 NASM 528 FTE Students 264High Range 0.7 NASM FTE Students 0 2,840
9 Plant Maintenance 0.015 1.5% of Total NASM No Input Required Sum of NASM Categories 1-15 (& 17-20 if applied) 78 835 Atypical10 Administrative Offices & Related Space
Administrative Offices 13 NASM FTE Non-Academic Staff Requiring Offices 0Office Services 0.5 50% of NASM No Input Required 50% of Space Generated for Non-Academic Staff 0 0 Atypical
11 AV/TV FacilitiesLow Range 0.05 NASM 528 FTE Students 26High Range 0.35 NASM FTE Students 0 284
12 Central ServicesLow Range 0.1 NASM 528 FTE Students 53High Range 0.3 NASM FTE Students 0 568
13 Health Service FacilitiesLow Range 0.03 NASM 528 FTE Students 16High Range 0.05 NASM FTE Students 0 170

DALHOUSIE UNIVERSITY MASTER PLANAPPENDIX C - CALCULATION BY COU STANDARDS METHOD
Page C-39 of 82
14 Student Activity SpaceLow Range 0.5 NASM 528 FTE Students 264High Range 0.7 NASM FTE Students 0 2,840
15 Assembly & Exhibition FacilitiesLow Range 0.15 NASM 528 FTE Students 79High Range 0.4 NASM FTE Students 0 852
TOTAL NASF 76,076NASM to NASF Conversion Factor 10.76426265
TOTAL NASM 7,067

DALHOUSIE UNIVERSITY MASTER PLANAPPENDIX C - CALCULATION BY COU STANDARDS METHOD
Page C-40 of 82
FACULTY OF DENTISTRYCALCULATIONS INPUT: INCREMENTAL INCREASE OF 0 STUDENTS BY YEAR 2013
COU COU Total COUCOU COU Space COU Input Generated TOTALS
COU Space Space Factor Input Measure Space INCat. # Category Factor Description Measure Description (NASM) (NASF)
Formula Areas 1 Classroom Facilities 1.23 NASM 0 FTE Students 0 02 Lab Undergraduate
Group W 0.8 NASM 0 WSLCH 0 SeeGroup X 0.6 NASM 0 WSLCH 0 WSCLHGroup Y 0.5 NASM 0 WSLCH 0 SeeGroup Z 0.3 NASM 0 WSLCH 0 0 WSCLH
3 Lab Graduate & FacultyGroup A 45 NASM 0 FTE Faculty + 0.5 Other Researchers + 0.5 Graduates 0Group B 30 NASM FTE Faculty + 0.5 Other Researchers + 0.5 Graduates 0Group C 20 NASM FTE Faculty + 0.5 Other Researchers + 0.5 Graduates 0Group D 10 NASM FTE Faculty + 0.5 Other Researchers + 0.5 Graduates 0Group E 1 NASM FTE Faculty + 0.5 Other Researchers + 0.5 Graduates 0 0
4 Academic Office & Related SpaceFaculty 13 NASM 0 FTE Faculty + 15% Allowance 0
Other Research Appointments 13 NASM FTE Other Research Appointments 0Graduate Sudents 4 NASM FTE Graduate Students 0
Non-Academic Staff 13 NASM FTE Academic Staff Requiring Offices 0Office Services 25% NASM 25% 25% of above 0 0
5 Campus Study Space & Library FacilitiesStudy 0.6 NASM 0 FTE Students 0
Student Computer Rooms 0.08 NASM 0 FTE Undergraduate Students 0Stack (Compact Storage) 0.004 NASM 0 EV for actual % of Collection in Compact Storage 0
Stack Remainder 1 0.007 NASM 0 EV for 0-300,000 volumes 0Stack Remainder 2 0.006 NASM 0 EV for next 300,000 volumes 0Stack Remainder 3 0.005 NASM 0 EV for rest of collection 0
Service 0.25 0.25x(Stack&Study) No Input Required 25% of Stack and Study Totals 0 0 Atypical6 Recreation Athletic Space
All Institutions 0.9 NASM 0 FTE Students 0Institutions with less than 4,000 FTE 2000 NASM No Input Required PLUS ? CheckInstitutions with 4,000 to 8,000 FTE 1000 NASM No Input Required PLUS ? 0 0 Check
7 Food ServicesLow Range 0.5 NASM 0 FTE Students 0High Range 0.7 NASM FTE Students 0 0
8 Bookstore & Merchandizing FacilitiesLow Range 0.5 NASM 0 FTE Students 0High Range 0.7 NASM FTE Students 0 0
9 Plant Maintenance 0.015 1.5% of Total NASM No Input Required Sum of NASM Categories 1-15 (& 17-20 if applied) 0 0 Atypical10 Administrative Offices & Related Space
Administrative Offices 13 NASM FTE Non-Academic Staff Requiring Offices 0Office Services 0.5 50% of NASM No Input Required 50% of Space Generated for Non-Academic Staff 0 0 Atypical
11 AV/TV FacilitiesLow Range 0.05 NASM 0 FTE Students 0High Range 0.35 NASM FTE Students 0 0
12 Central ServicesLow Range 0.1 NASM 0 FTE Students 0High Range 0.3 NASM FTE Students 0 0
13 Health Service FacilitiesLow Range 0.03 NASM 0 FTE Students 0High Range 0.05 NASM FTE Students 0 0

DALHOUSIE UNIVERSITY MASTER PLANAPPENDIX C - CALCULATION BY COU STANDARDS METHOD
Page C-41 of 82
14 Student Activity SpaceLow Range 0.5 NASM 0 FTE Students 0High Range 0.7 NASM FTE Students 0 0
15 Assembly & Exhibition FacilitiesLow Range 0.15 NASM 0 FTE Students 0High Range 0.4 NASM FTE Students 0 0
TOTAL NASF 0NASM to NASF Conversion Factor 10.76426265
TOTAL NASM -

DALHOUSIE UNIVERSITY MASTER PLANAPPENDIX C - CALCULATION BY COU STANDARDS METHOD
Page C-42 of 82
FACULTY OF HEALTH PROFESSIONSCALCULATIONS INPUT: INCREMENTAL INCREASE OF 163 STUDENTS BY YEAR 2013
COU COU Total COUCOU COU Space COU Input Generated TOTALS
COU Space Space Factor Input Measure Space INCat. # Category Factor Description Measure Description (NASM) (NASF)
Formula Areas 1 Classroom Facilities 1.23 NASM 144 FTE Students 177 1,9042 Lab Undergraduate
Group W 0.8 NASM 0 WSLCH 0 SeeGroup X 0.6 NASM 0 WSLCH 0 WSCLHGroup Y 0.5 NASM 0 WSLCH 0 SeeGroup Z 0.3 NASM 0 WSLCH 0 1,105 WSCLH
3 Lab Graduate & FacultyGroup A 45 NASM 9.243628966 FTE Faculty + 0.5 Other Researchers + 0.5 Graduates 416Group B 30 NASM FTE Faculty + 0.5 Other Researchers + 0.5 Graduates 0Group C 20 NASM FTE Faculty + 0.5 Other Researchers + 0.5 Graduates 0Group D 10 NASM FTE Faculty + 0.5 Other Researchers + 0.5 Graduates 0Group E 1 NASM FTE Faculty + 0.5 Other Researchers + 0.5 Graduates 0 4,478
4 Academic Office & Related SpaceFaculty 13 NASM 9 FTE Faculty + 15% Allowance 120
Other Research Appointments 13 NASM FTE Other Research Appointments 0Graduate Sudents 4 NASM FTE Graduate Students 0
Non-Academic Staff 13 NASM FTE Academic Staff Requiring Offices 0Office Services 25% NASM 25% 25% of above 30 1,617
5 Campus Study Space & Library FacilitiesStudy 0.6 NASM 144 FTE Students 86
Student Computer Rooms 0.08 NASM 144 FTE Undergraduate Students 12Stack (Compact Storage) 0.004 NASM 0 EV for actual % of Collection in Compact Storage 0
Stack Remainder 1 0.007 NASM 8150 EV for 0-300,000 volumes 57Stack Remainder 2 0.006 NASM 0 EV for next 300,000 volumes 0Stack Remainder 3 0.005 NASM 0 EV for rest of collection 0
Service 0.25 0.25x(Stack&Study) No Input Required 25% of Stack and Study Totals 36 2,053 Atypical6 Recreation Athletic Space
All Institutions 0.9 NASM 144 FTE Students 129Institutions with less than 4,000 FTE 2000 NASM No Input Required PLUS ? CheckInstitutions with 4,000 to 8,000 FTE 1000 NASM No Input Required PLUS ? 0 1,393 Check
7 Food ServicesLow Range 0.5 NASM 144 FTE Students 72High Range 0.7 NASM FTE Students 0 774
8 Bookstore & Merchandizing FacilitiesLow Range 0.5 NASM 144 FTE Students 72High Range 0.7 NASM FTE Students 0 774
9 Plant Maintenance 0.015 1.5% of Total NASM No Input Required Sum of NASM Categories 1-15 (& 17-20 if applied) 20 214 Atypical10 Administrative Offices & Related Space
Administrative Offices 13 NASM FTE Non-Academic Staff Requiring Offices 0Office Services 0.5 50% of NASM No Input Required 50% of Space Generated for Non-Academic Staff 0 0 Atypical
11 AV/TV FacilitiesLow Range 0.05 NASM 144 FTE Students 7High Range 0.35 NASM FTE Students 0 77
12 Central ServicesLow Range 0.1 NASM 144 FTE Students 14High Range 0.3 NASM FTE Students 0 155
13 Health Service FacilitiesLow Range 0.03 NASM 144 FTE Students 4High Range 0.05 NASM FTE Students 0 46

DALHOUSIE UNIVERSITY MASTER PLANAPPENDIX C - CALCULATION BY COU STANDARDS METHOD
Page C-43 of 82
14 Student Activity SpaceLow Range 0.5 NASM 144 FTE Students 72High Range 0.7 NASM FTE Students 0 774
15 Assembly & Exhibition FacilitiesLow Range 0.15 NASM 144 FTE Students 22High Range 0.4 NASM FTE Students 0 232
TOTAL NASF 15,597NASM to NASF Conversion Factor 10.76426265
TOTAL NASM 1,449

DALHOUSIE UNIVERSITY MASTER PLANAPPENDIX C - CALCULATION BY COU STANDARDS METHOD
Page C-44 of 82
FACULTY OF MEDICINECALCULATIONS INPUT: INCREMENTAL INCREASE OF 52 STUDENTS BY YEAR 2013
COU COU Total COUCOU COU Space COU Input Generated TOTALS
COU Space Space Factor Input Measure Space INCat. # Category Factor Description Measure Description (NASM) (NASF)
Formula Areas 1 Classroom Facilities 1.23 NASM 46 FTE Students 56 6072 Lab Undergraduate
Group W 0.8 NASM 0 WSLCH 0 SeeGroup X 0.6 NASM 0 WSLCH 0 WSCLHGroup Y 0.5 NASM 0 WSLCH 0 SeeGroup Z 0.3 NASM 0 WSLCH 0 1,365 WSCLH
3 Lab Graduate & FacultyGroup A 45 NASM 16.31237886 FTE Faculty + 0.5 Other Researchers + 0.5 Graduates 734Group B 30 NASM FTE Faculty + 0.5 Other Researchers + 0.5 Graduates 0Group C 20 NASM FTE Faculty + 0.5 Other Researchers + 0.5 Graduates 0Group D 10 NASM FTE Faculty + 0.5 Other Researchers + 0.5 Graduates 0Group E 1 NASM FTE Faculty + 0.5 Other Researchers + 0.5 Graduates 0 7,902
4 Academic Office & Related SpaceFaculty 13 NASM 19 FTE Faculty + 15% Allowance 244
Other Research Appointments 13 NASM FTE Other Research Appointments 0Graduate Sudents 4 NASM FTE Graduate Students 0
Non-Academic Staff 13 NASM FTE Academic Staff Requiring Offices 0Office Services 25% NASM 25% 25% of above 61 3,281
5 Campus Study Space & Library FacilitiesStudy 0.6 NASM 46 FTE Students 28
Student Computer Rooms 0.08 NASM 46 FTE Undergraduate Students 4Stack (Compact Storage) 0.004 NASM 0 EV for actual % of Collection in Compact Storage 0
Stack Remainder 1 0.007 NASM 2600 EV for 0-300,000 volumes 18Stack Remainder 2 0.006 NASM 0 EV for next 300,000 volumes 0Stack Remainder 3 0.005 NASM 0 EV for rest of collection 0
Service 0.25 0.25x(Stack&Study) No Input Required 25% of Stack and Study Totals 11 655 Atypical6 Recreation Athletic Space
All Institutions 0.9 NASM 46 FTE Students 41Institutions with less than 4,000 FTE 2000 NASM No Input Required PLUS ? CheckInstitutions with 4,000 to 8,000 FTE 1000 NASM No Input Required PLUS ? 0 445 Check
7 Food ServicesLow Range 0.5 NASM 46 FTE Students 23High Range 0.7 NASM FTE Students 0 247
8 Bookstore & Merchandizing FacilitiesLow Range 0.5 NASM 46 FTE Students 23High Range 0.7 NASM FTE Students 0 247
9 Plant Maintenance 0.015 1.5% of Total NASM No Input Required Sum of NASM Categories 1-15 (& 17-20 if applied) 19 207 Atypical10 Administrative Offices & Related Space
Administrative Offices 13 NASM FTE Non-Academic Staff Requiring Offices 0Office Services 0.5 50% of NASM No Input Required 50% of Space Generated for Non-Academic Staff 0 0 Atypical
11 AV/TV FacilitiesLow Range 0.05 NASM 46 FTE Students 2High Range 0.35 NASM FTE Students 0 25
12 Central ServicesLow Range 0.1 NASM 46 FTE Students 5High Range 0.3 NASM FTE Students 0 49
13 Health Service FacilitiesLow Range 0.03 NASM 46 FTE Students 1High Range 0.05 NASM FTE Students 0 15

DALHOUSIE UNIVERSITY MASTER PLANAPPENDIX C - CALCULATION BY COU STANDARDS METHOD
Page C-45 of 82
14 Student Activity SpaceLow Range 0.5 NASM 46 FTE Students 23High Range 0.7 NASM FTE Students 0 247
15 Assembly & Exhibition FacilitiesLow Range 0.15 NASM 46 FTE Students 7High Range 0.4 NASM FTE Students 0 74
TOTAL NASF 15,365NASM to NASF Conversion Factor 10.76426265
TOTAL NASM 1,427
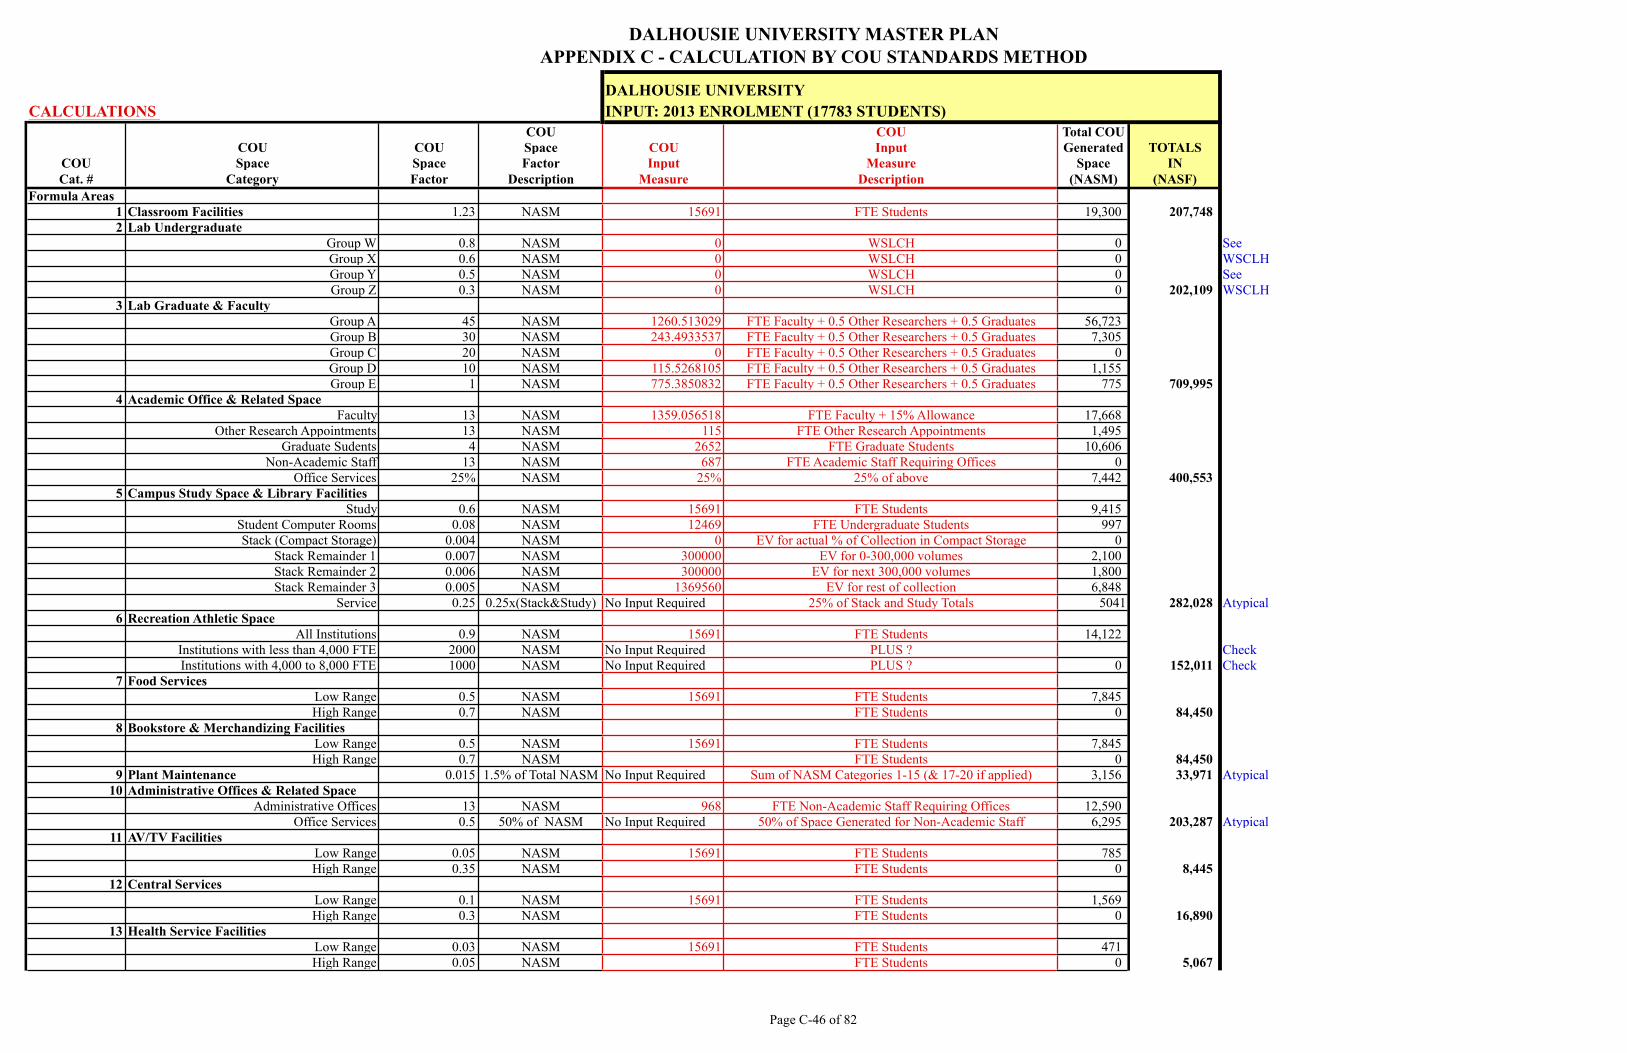
DALHOUSIE UNIVERSITY MASTER PLANAPPENDIX C - CALCULATION BY COU STANDARDS METHOD
Page C-46 of 82
DALHOUSIE UNIVERSITYCALCULATIONS INPUT: 2013 ENROLMENT (17783 STUDENTS)
COU COU Total COUCOU COU Space COU Input Generated TOTALS
COU Space Space Factor Input Measure Space INCat. # Category Factor Description Measure Description (NASM) (NASF)
Formula Areas 1 Classroom Facilities 1.23 NASM 15691 FTE Students 19,300 207,7482 Lab Undergraduate
Group W 0.8 NASM 0 WSLCH 0 SeeGroup X 0.6 NASM 0 WSLCH 0 WSCLHGroup Y 0.5 NASM 0 WSLCH 0 SeeGroup Z 0.3 NASM 0 WSLCH 0 202,109 WSCLH
3 Lab Graduate & FacultyGroup A 45 NASM 1260.513029 FTE Faculty + 0.5 Other Researchers + 0.5 Graduates 56,723Group B 30 NASM 243.4933537 FTE Faculty + 0.5 Other Researchers + 0.5 Graduates 7,305Group C 20 NASM 0 FTE Faculty + 0.5 Other Researchers + 0.5 Graduates 0Group D 10 NASM 115.5268105 FTE Faculty + 0.5 Other Researchers + 0.5 Graduates 1,155Group E 1 NASM 775.3850832 FTE Faculty + 0.5 Other Researchers + 0.5 Graduates 775 709,995
4 Academic Office & Related SpaceFaculty 13 NASM 1359.056518 FTE Faculty + 15% Allowance 17,668
Other Research Appointments 13 NASM 115 FTE Other Research Appointments 1,495Graduate Sudents 4 NASM 2652 FTE Graduate Students 10,606
Non-Academic Staff 13 NASM 687 FTE Academic Staff Requiring Offices 0Office Services 25% NASM 25% 25% of above 7,442 400,553
5 Campus Study Space & Library FacilitiesStudy 0.6 NASM 15691 FTE Students 9,415
Student Computer Rooms 0.08 NASM 12469 FTE Undergraduate Students 997Stack (Compact Storage) 0.004 NASM 0 EV for actual % of Collection in Compact Storage 0
Stack Remainder 1 0.007 NASM 300000 EV for 0-300,000 volumes 2,100Stack Remainder 2 0.006 NASM 300000 EV for next 300,000 volumes 1,800Stack Remainder 3 0.005 NASM 1369560 EV for rest of collection 6,848
Service 0.25 0.25x(Stack&Study) No Input Required 25% of Stack and Study Totals 5041 282,028 Atypical6 Recreation Athletic Space
All Institutions 0.9 NASM 15691 FTE Students 14,122Institutions with less than 4,000 FTE 2000 NASM No Input Required PLUS ? CheckInstitutions with 4,000 to 8,000 FTE 1000 NASM No Input Required PLUS ? 0 152,011 Check
7 Food ServicesLow Range 0.5 NASM 15691 FTE Students 7,845High Range 0.7 NASM FTE Students 0 84,450
8 Bookstore & Merchandizing FacilitiesLow Range 0.5 NASM 15691 FTE Students 7,845High Range 0.7 NASM FTE Students 0 84,450
9 Plant Maintenance 0.015 1.5% of Total NASM No Input Required Sum of NASM Categories 1-15 (& 17-20 if applied) 3,156 33,971 Atypical10 Administrative Offices & Related Space
Administrative Offices 13 NASM 968 FTE Non-Academic Staff Requiring Offices 12,590Office Services 0.5 50% of NASM No Input Required 50% of Space Generated for Non-Academic Staff 6,295 203,287 Atypical
11 AV/TV FacilitiesLow Range 0.05 NASM 15691 FTE Students 785High Range 0.35 NASM FTE Students 0 8,445
12 Central ServicesLow Range 0.1 NASM 15691 FTE Students 1,569High Range 0.3 NASM FTE Students 0 16,890
13 Health Service FacilitiesLow Range 0.03 NASM 15691 FTE Students 471High Range 0.05 NASM FTE Students 0 5,067

DALHOUSIE UNIVERSITY MASTER PLANAPPENDIX C - CALCULATION BY COU STANDARDS METHOD
Page C-47 of 82
14 Student Activity SpaceLow Range 0.5 NASM 15691 FTE Students 7,845High Range 0.7 NASM FTE Students 0 84,450
15 Assembly & Exhibition FacilitiesLow Range 0.15 NASM 15691 FTE Students 2,354High Range 0.4 NASM FTE Students 0 25,335
TOTAL NASF 2,500,789NASM to NASF Conversion Factor 10.76426265
TOTAL NASM 232,323

DALHOUSIE UNIVERSITY MASTER PLANAPPENDIX C - CALCULATION BY COU STANDARDS METHOD
Page C-48 of 82
DALHOUSIE UNIVERSITYCALCULATIONS INPUT: 2018 ENROLMENT (20289 STUDENTS)
COU COU Total COUCOU COU Space COU Input Generated TOTALS
COU Space Space Factor Input Measure Space INCat. # Category Factor Description Measure Description (NASM) (NASF)
Formula Areas 1 Classroom Facilities 1.23 NASM 17902 FTE Students 22,020 237,0242 Lab Undergraduate
Group W 0.8 NASM 0 WSLCH 0 SeeGroup X 0.6 NASM 0 WSLCH 0 WSCLHGroup Y 0.5 NASM 0 WSLCH 0 SeeGroup Z 0.3 NASM 0 WSLCH 0 228,150 WSCLH
3 Lab Graduate & FacultyGroup A 45 NASM 1323.464058 FTE Faculty + 0.5 Other Researchers + 0.5 Graduates 59,556Group B 30 NASM 243.9817074 FTE Faculty + 0.5 Other Researchers + 0.5 Graduates 7,319Group C 20 NASM 0 FTE Faculty + 0.5 Other Researchers + 0.5 Graduates 0Group D 10 NASM 116.333621 FTE Faculty + 0.5 Other Researchers + 0.5 Graduates 1,163Group E 1 NASM 848.9501663 FTE Faculty + 0.5 Other Researchers + 0.5 Graduates 849 741,524
4 Academic Office & Related SpaceFaculty 13 NASM 1320 FTE Faculty + 15% Allowance 17,155
Other Research Appointments 13 NASM 115 FTE Other Research Appointments 1,495Graduate Sudents 4 NASM 2652 FTE Graduate Students 10,606
Non-Academic Staff 13 NASM 784 FTE Academic Staff Requiring Offices 0Office Services 25% NASM 25% 25% of above 7,314 393,651
5 Campus Study Space & Library FacilitiesStudy 0.6 NASM 17902 FTE Students 10,741
Student Computer Rooms 0.08 NASM 14680 FTE Undergraduate Students 1,174Stack (Compact Storage) 0.004 NASM 0 EV for actual % of Collection in Compact Storage 0
Stack Remainder 1 0.007 NASM 300000 EV for 0-300,000 volumes 2,100Stack Remainder 2 0.006 NASM 300000 EV for next 300,000 volumes 1,800Stack Remainder 3 0.005 NASM 1494860 EV for rest of collection 7,474
Service 0.25 0.25x(Stack&Study) No Input Required 25% of Stack and Study Totals 5529 310,213 Atypical6 Recreation Athletic Space
All Institutions 0.9 NASM 17902 FTE Students 16,112Institutions with less than 4,000 FTE 2000 NASM No Input Required PLUS ? CheckInstitutions with 4,000 to 8,000 FTE 1000 NASM No Input Required PLUS ? 0 173,432 Check
7 Food ServicesLow Range 0.5 NASM 17902 FTE Students 8,951High Range 0.7 NASM FTE Students 0 96,351
8 Bookstore & Merchandizing FacilitiesLow Range 0.5 NASM 17902 FTE Students 8,951High Range 0.7 NASM FTE Students 0 96,351
9 Plant Maintenance 0.015 1.5% of Total NASM No Input Required Sum of NASM Categories 1-15 (& 17-20 if applied) 3,401 36,606 Atypical10 Administrative Offices & Related Space
Administrative Offices 13 NASM 1105 FTE Non-Academic Staff Requiring Offices 14,364Office Services 0.5 50% of NASM No Input Required 50% of Space Generated for Non-Academic Staff 7,182 231,934 Atypical
11 AV/TV FacilitiesLow Range 0.05 NASM 17902 FTE Students 895High Range 0.35 NASM FTE Students 0 9,635
12 Central ServicesLow Range 0.1 NASM 17902 FTE Students 1,790High Range 0.3 NASM FTE Students 0 19,270
13 Health Service FacilitiesLow Range 0.03 NASM 17902 FTE Students 537High Range 0.05 NASM FTE Students 0 5,781

DALHOUSIE UNIVERSITY MASTER PLANAPPENDIX C - CALCULATION BY COU STANDARDS METHOD
Page C-49 of 82
14 Student Activity SpaceLow Range 0.5 NASM 17902 FTE Students 8,951High Range 0.7 NASM FTE Students 0 96,351
15 Assembly & Exhibition FacilitiesLow Range 0.15 NASM 17902 FTE Students 2,685High Range 0.4 NASM FTE Students 0 28,905
TOTAL NASF 2,705,181NASM to NASF Conversion Factor 10.76426265
TOTAL NASM 251,311

DALHOUSIE UNIVERSITY MASTER PLANAPPENDIX C - CALCULATION BY COU STANDARDS METHOD
Page C-50 of 82
DALHOUSIE UNIVERSITYCALCULATIONS INPUT: 2024 ENROLMENT (22795 STUDENTS)
COU COU Total COUCOU COU Space COU Input Generated TOTALS
COU Space Space Factor Input Measure Space INCat. # Category Factor Description Measure Description (NASM) (NASF)
Formula Areas 1 Classroom Facilities 1.23 NASM 20113 FTE Students 24,739 266,3002 Lab Undergraduate
Group W 0.8 NASM 0 WSLCH 0 SeeGroup X 0.6 NASM 0 WSLCH 0 WSCLHGroup Y 0.5 NASM 0 WSLCH 0 SeeGroup Z 0.3 NASM 0 WSLCH 0 254,191 WSCLH
3 Lab Graduate & FacultyGroup A 45 NASM 1386.415087 FTE Faculty + 0.5 Other Researchers + 0.5 Graduates 62,389Group B 30 NASM 244.4700611 FTE Faculty + 0.5 Other Researchers + 0.5 Graduates 7,334Group C 20 NASM 0 FTE Faculty + 0.5 Other Researchers + 0.5 Graduates 0Group D 10 NASM 117.1404316 FTE Faculty + 0.5 Other Researchers + 0.5 Graduates 1,171Group E 1 NASM 922.5152495 FTE Faculty + 0.5 Other Researchers + 0.5 Graduates 923 773,054
4 Academic Office & Related SpaceFaculty 13 NASM 1457 FTE Faculty + 15% Allowance 18,946
Other Research Appointments 13 NASM 115 FTE Other Research Appointments 1,495Graduate Sudents 4 NASM 2652 FTE Graduate Students 10,606
Non-Academic Staff 13 NASM 880 FTE Academic Staff Requiring Offices 0Office Services 25% NASM 25% 25% of above 7,762 417,757
5 Campus Study Space & Library FacilitiesStudy 0.6 NASM 20113 FTE Students 12,068
Student Computer Rooms 0.08 NASM 16891 FTE Undergraduate Students 1,351Stack (Compact Storage) 0.004 NASM 0 EV for actual % of Collection in Compact Storage 0
Stack Remainder 1 0.007 NASM 300000 EV for 0-300,000 volumes 2,100Stack Remainder 2 0.006 NASM 300000 EV for next 300,000 volumes 1,800Stack Remainder 3 0.005 NASM 1620160 EV for rest of collection 8,101
Service 0.25 0.25x(Stack&Study) No Input Required 25% of Stack and Study Totals 6017 338,398 Atypical6 Recreation Athletic Space
All Institutions 0.9 NASM 20113 FTE Students 18,102Institutions with less than 4,000 FTE 2000 NASM No Input Required PLUS ? CheckInstitutions with 4,000 to 8,000 FTE 1000 NASM No Input Required PLUS ? 0 194,854 Check
7 Food ServicesLow Range 0.5 NASM 20113 FTE Students 10,057High Range 0.7 NASM FTE Students 0 108,252
8 Bookstore & Merchandizing FacilitiesLow Range 0.5 NASM 20113 FTE Students 10,057High Range 0.7 NASM FTE Students 0 108,252
9 Plant Maintenance 0.015 1.5% of Total NASM No Input Required Sum of NASM Categories 1-15 (& 17-20 if applied) 3,689 39,707 Atypical10 Administrative Offices & Related Space
Administrative Offices 13 NASM 1241 FTE Non-Academic Staff Requiring Offices 16,139Office Services 0.5 50% of NASM No Input Required 50% of Space Generated for Non-Academic Staff 8,069 260,582 Atypical
11 AV/TV FacilitiesLow Range 0.05 NASM 20113 FTE Students 1,006High Range 0.35 NASM FTE Students 0 10,825
12 Central ServicesLow Range 0.1 NASM 20113 FTE Students 2,011High Range 0.3 NASM FTE Students 0 21,650
13 Health Service FacilitiesLow Range 0.03 NASM 20113 FTE Students 603High Range 0.05 NASM FTE Students 0 6,495

DALHOUSIE UNIVERSITY MASTER PLANAPPENDIX C - CALCULATION BY COU STANDARDS METHOD
Page C-51 of 82
14 Student Activity SpaceLow Range 0.5 NASM 20113 FTE Students 10,057High Range 0.7 NASM FTE Students 0 108,252
15 Assembly & Exhibition FacilitiesLow Range 0.15 NASM 20113 FTE Students 3,017High Range 0.4 NASM FTE Students 0 32,476
TOTAL NASF 2,941,045NASM to NASF Conversion Factor 10.76426265
TOTAL NASM 273,223

DALHOUSIE UNIVERSITY MASTER PLANAPPENDIX C - CALCULATION BY COU STANDARDS METHOD
Page C-52 of 82
DALHOUSIE UNIVERSITYCALCULATIONS INPUT: 2029 ENROLMENT (25301 STUDENTS)
COU COU Total COUCOU COU Space COU Input Generated TOTALS
COU Space Space Factor Input Measure Space INCat. # Category Factor Description Measure Description (NASM) (NASF)
Formula Areas 1 Classroom Facilities 1.23 NASM 22324 FTE Students 27,459 295,5762 Lab Undergraduate
Group W 0.8 NASM 0 WSLCH 0 SeeGroup X 0.6 NASM 0 WSLCH 0 WSCLHGroup Y 0.5 NASM 0 WSLCH 0 SeeGroup Z 0.3 NASM 0 WSLCH 0 280,232 WSCLH
3 Lab Graduate & FacultyGroup A 45 NASM 1449.366116 FTE Faculty + 0.5 Other Researchers + 0.5 Graduates 65,221Group B 30 NASM 244.9584147 FTE Faculty + 0.5 Other Researchers + 0.5 Graduates 7,349Group C 20 NASM 0 FTE Faculty + 0.5 Other Researchers + 0.5 Graduates 0Group D 10 NASM 117.9472421 FTE Faculty + 0.5 Other Researchers + 0.5 Graduates 1,179Group E 1 NASM 996.0803326 FTE Faculty + 0.5 Other Researchers + 0.5 Graduates 996 804,583
4 Academic Office & Related SpaceFaculty 13 NASM 1595 FTE Faculty + 15% Allowance 20,738
Other Research Appointments 13 NASM 115 FTE Other Research Appointments 1,495Graduate Sudents 4 NASM 2652 FTE Graduate Students 10,606
Non-Academic Staff 13 NASM 977 FTE Academic Staff Requiring Offices 0Office Services 25% NASM 25% 25% of above 8,210 441,863
5 Campus Study Space & Library FacilitiesStudy 0.6 NASM 22324 FTE Students 13,395
Student Computer Rooms 0.08 NASM 19102 FTE Undergraduate Students 1,528Stack (Compact Storage) 0.004 NASM 0 EV for actual % of Collection in Compact Storage 0
Stack Remainder 1 0.007 NASM 300000 EV for 0-300,000 volumes 2,100Stack Remainder 2 0.006 NASM 300000 EV for next 300,000 volumes 1,800Stack Remainder 3 0.005 NASM 1745460 EV for rest of collection 8,727
Service 0.25 0.25x(Stack&Study) No Input Required 25% of Stack and Study Totals 6505 366,583 Atypical6 Recreation Athletic Space
All Institutions 0.9 NASM 22324 FTE Students 20,092Institutions with less than 4,000 FTE 2000 NASM No Input Required PLUS ? CheckInstitutions with 4,000 to 8,000 FTE 1000 NASM No Input Required PLUS ? 0 216,275 Check
7 Food ServicesLow Range 0.5 NASM 22324 FTE Students 11,162High Range 0.7 NASM FTE Students 0 120,153
8 Bookstore & Merchandizing FacilitiesLow Range 0.5 NASM 22324 FTE Students 11,162High Range 0.7 NASM FTE Students 0 120,153
9 Plant Maintenance 0.015 1.5% of Total NASM No Input Required Sum of NASM Categories 1-15 (& 17-20 if applied) 3,977 42,808 Atypical10 Administrative Offices & Related Space
Administrative Offices 13 NASM 1378 FTE Non-Academic Staff Requiring Offices 17,913Office Services 0.5 50% of NASM No Input Required 50% of Space Generated for Non-Academic Staff 8,956 289,229 Atypical
11 AV/TV FacilitiesLow Range 0.05 NASM 22324 FTE Students 1,116High Range 0.35 NASM FTE Students 0 12,015
12 Central ServicesLow Range 0.1 NASM 22324 FTE Students 2,232High Range 0.3 NASM FTE Students 0 24,031
13 Health Service FacilitiesLow Range 0.03 NASM 22324 FTE Students 670High Range 0.05 NASM FTE Students 0 7,209

DALHOUSIE UNIVERSITY MASTER PLANAPPENDIX C - CALCULATION BY COU STANDARDS METHOD
Page C-53 of 82
14 Student Activity SpaceLow Range 0.5 NASM 22324 FTE Students 11,162High Range 0.7 NASM FTE Students 0 120,153
15 Assembly & Exhibition FacilitiesLow Range 0.15 NASM 22324 FTE Students 3,349High Range 0.4 NASM FTE Students 0 36,046
TOTAL NASF 3,176,909NASM to NASF Conversion Factor 10.76426265
TOTAL NASM 295,135

DALHOUSIE UNIVERSITY MASTER PLANAPPENDIX C - CALCULATION BY COU STANDARDS METHOD
Page C-54 of 82
DALHOUSIE UNIVERSITYCALCULATIONS INPUT: 2034 ENROLMENT (27807 STUDENTS)
COU COU Total COUCOU COU Space COU Input Generated TOTALS
COU Space Space Factor Input Measure Space INCat. # Category Factor Description Measure Description (NASM) (NASF)
Formula Areas 1 Classroom Facilities 1.23 NASM 24536 FTE Students 30,179 324,8522 Lab Undergraduate
Group W 0.8 NASM 0 WSLCH 0 SeeGroup X 0.6 NASM 0 WSLCH 0 WSCLHGroup Y 0.5 NASM 0 WSLCH 0 SeeGroup Z 0.3 NASM 0 WSLCH 0 306,273 WSCLH
3 Lab Graduate & FacultyGroup A 45 NASM 1512.317145 FTE Faculty + 0.5 Other Researchers + 0.5 Graduates 68,054Group B 30 NASM 245.4467684 FTE Faculty + 0.5 Other Researchers + 0.5 Graduates 7,363Group C 20 NASM 0 FTE Faculty + 0.5 Other Researchers + 0.5 Graduates 0Group D 10 NASM 118.7540526 FTE Faculty + 0.5 Other Researchers + 0.5 Graduates 1,188Group E 1 NASM 1069.645416 FTE Faculty + 0.5 Other Researchers + 0.5 Graduates 1,070 836,113
4 Academic Office & Related SpaceFaculty 13 NASM 1733 FTE Faculty + 15% Allowance 22,529
Other Research Appointments 13 NASM 115 FTE Other Research Appointments 1,495Graduate Sudents 4 NASM 2652 FTE Graduate Students 10,606
Non-Academic Staff 13 NASM 1074 FTE Academic Staff Requiring Offices 0Office Services 25% NASM 25% 25% of above 8,658 465,969
5 Campus Study Space & Library FacilitiesStudy 0.6 NASM 24536 FTE Students 14,721
Student Computer Rooms 0.08 NASM 21313 FTE Undergraduate Students 1,705Stack (Compact Storage) 0.004 NASM 0 EV for actual % of Collection in Compact Storage 0
Stack Remainder 1 0.007 NASM 300000 EV for 0-300,000 volumes 2,100Stack Remainder 2 0.006 NASM 300000 EV for next 300,000 volumes 1,800Stack Remainder 3 0.005 NASM 2470760 EV for rest of collection 12,354
Service 0.25 0.25x(Stack&Study) No Input Required 25% of Stack and Study Totals 7744 435,135 Atypical6 Recreation Athletic Space
All Institutions 0.9 NASM 24536 FTE Students 22,082Institutions with less than 4,000 FTE 2000 NASM No Input Required PLUS ? CheckInstitutions with 4,000 to 8,000 FTE 1000 NASM No Input Required PLUS ? 0 237,697 Check
7 Food ServicesLow Range 0.5 NASM 24536 FTE Students 12,268High Range 0.7 NASM FTE Students 0 132,054
8 Bookstore & Merchandizing FacilitiesLow Range 0.5 NASM 24536 FTE Students 12,268High Range 0.7 NASM FTE Students 0 132,054
9 Plant Maintenance 0.015 1.5% of Total NASM No Input Required Sum of NASM Categories 1-15 (& 17-20 if applied) 4,321 46,514 Atypical10 Administrative Offices & Related Space
Administrative Offices 13 NASM 1514 FTE Non-Academic Staff Requiring Offices 19,687Office Services 0.5 50% of NASM No Input Required 50% of Space Generated for Non-Academic Staff 9,844 317,876 Atypical
11 AV/TV FacilitiesLow Range 0.05 NASM 24536 FTE Students 1,227High Range 0.35 NASM FTE Students 0 13,205
12 Central ServicesLow Range 0.1 NASM 24536 FTE Students 2,454High Range 0.3 NASM FTE Students 0 26,411
13 Health Service FacilitiesLow Range 0.03 NASM 24536 FTE Students 736High Range 0.05 NASM FTE Students 0 7,923

DALHOUSIE UNIVERSITY MASTER PLANAPPENDIX C - CALCULATION BY COU STANDARDS METHOD
Page C-55 of 82
14 Student Activity SpaceLow Range 0.5 NASM 24536 FTE Students 12,268High Range 0.7 NASM FTE Students 0 132,054
15 Assembly & Exhibition FacilitiesLow Range 0.15 NASM 24536 FTE Students 3,680High Range 0.4 NASM FTE Students 0 39,616
TOTAL NASF 3,453,745NASM to NASF Conversion Factor 10.76426265
TOTAL NASM 320,853

DALHOUSIE UNIVERSITY MASTER PLANAPPENDIX C - CALCULATION BY COU STANDARDS METHOD
Page C-56 of 82
FACULTY OF ARCHITECTURE AND PLANNING CALCULATIONS (TRANSFER Existing Space Categories ONLY) INPUT: 2008 ENROLMENT (253 STUDENTS)
COU COU Total COUCOU COU Space COU Input Generated TOTALS
COU Space Space Factor Input Measure Space INCat. # Category Factor Description Measure Description (NASM) (NASF)
Formula Areas 1 Classroom Facilities 1.23 NASM 223 FTE Students 275 2,9562 Lab Undergraduate
Group W 0.8 NASM 0 WSLCH 0 SeeGroup X 0.6 NASM 0 WSLCH 0 WSCLHGroup Y 0.5 NASM 0 WSLCH 0 SeeGroup Z 0.3 NASM 0 WSLCH 0 853 WSCLH
3 Lab Graduate & FacultyGroup A 45 NASM FTE Faculty + 0.5 Other Researchers + 0.5 Graduates 0Group B 30 NASM FTE Faculty + 0.5 Other Researchers + 0.5 Graduates 0Group C 20 NASM FTE Faculty + 0.5 Other Researchers + 0.5 Graduates 0Group D 10 NASM FTE Faculty + 0.5 Other Researchers + 0.5 Graduates 0Group E 1 NASM FTE Faculty + 0.5 Other Researchers + 0.5 Graduates 0 0
4 Academic Office & Related SpaceFaculty 13 NASM 28 FTE Faculty + 15% Allowance 363
Other Research Appointments 13 NASM 0 FTE Other Research Appointments 0Graduate Sudents 4 NASM 123 FTE Graduate Students 493
Non-Academic Staff 13 NASM FTE Academic Staff Requiring Offices 0Office Services 25% NASM 25% 25% of above 214 11,515
5 Campus Study Space & Library FacilitiesStudy 0.6 NASM 223 FTE Students 134
Student Computer Rooms 0.08 NASM 223 FTE Undergraduate Students 18Stack (Compact Storage) 0.004 NASM 0 EV for actual % of Collection in Compact Storage 0
Stack Remainder 1 0.007 NASM EV for 0-300,000 volumes 0Stack Remainder 2 0.006 NASM EV for next 300,000 volumes 0Stack Remainder 3 0.005 NASM EV for rest of collection 0
Service 0.25 0.25x(Stack&Study) No Input Required 25% of Stack and Study Totals 33 1,994 Atypical6 Recreation Athletic Space
All Institutions 0.9 NASM 223 FTE Students 201Institutions with less than 4,000 FTE 2000 NASM No Input Required PLUS ? CheckInstitutions with 4,000 to 8,000 FTE 1000 NASM No Input Required PLUS ? 0 2,163 Check
7 Food ServicesLow Range 0.5 NASM 223 FTE Students 112High Range 0.7 NASM FTE Students 0 1,201
8 Bookstore & Merchandizing FacilitiesLow Range 0.5 NASM 223 FTE Students 112High Range 0.7 NASM FTE Students 0 1,201
9 Plant Maintenance 0.015 1.5% of Total NASM No Input Required Sum of NASM Categories 1-15 (& 17-20 if applied) 32 345 Atypical10 Administrative Offices & Related Space
Administrative Offices 13 NASM FTE Non-Academic Staff Requiring Offices 0Office Services 0.5 50% of NASM No Input Required 50% of Space Generated for Non-Academic Staff 0 0 Atypical
11 AV/TV FacilitiesLow Range 0.05 NASM 223 FTE Students 11High Range 0.35 NASM FTE Students 0 120
12 Central ServicesLow Range 0.1 NASM 223 FTE Students 22High Range 0.3 NASM FTE Students 0 240
13 Health Service FacilitiesLow Range 0.03 NASM 223 FTE Students 7High Range 0.05 NASM FTE Students 0 72

DALHOUSIE UNIVERSITY MASTER PLANAPPENDIX C - CALCULATION BY COU STANDARDS METHOD
Page C-57 of 82
14 Student Activity SpaceLow Range 0.5 NASM 223 FTE Students 112High Range 0.7 NASM FTE Students 0 1,201
15 Assembly & Exhibition FacilitiesLow Range 0.15 NASM 223 FTE Students 33High Range 0.4 NASM FTE Students 0 360
TOTAL NASF 24,223NASM to NASF Conversion Factor 10.76426265
TOTAL NASM 2,250
FACULTY OF ENGINEERING CALCULATIONS (TRANSFER Existing Space Categories ONLY) INPUT: 2008 ENROLMENT (1280 STUDENTS)
COU COU Total COUCOU COU Space COU Input Generated TOTALS
COU Space Space Factor Input Measure Space INCat. # Category Factor Description Measure Description (NASM) (NASF)
Formula Areas 1 Classroom Facilities 1.23 NASM 1129 FTE Students 1,389 14,9532 Lab Undergraduate
Group W 0.8 NASM 0 WSLCH 0 SeeGroup X 0.6 NASM 0 WSLCH 0 WSCLHGroup Y 0.5 NASM 0 WSLCH 0 SeeGroup Z 0.3 NASM 0 WSLCH 0 63,024 WSCLH
3 Lab Graduate & FacultyGroup A 45 NASM FTE Faculty + 0.5 Other Researchers + 0.5 Graduates 0Group B 30 NASM 243.005 FTE Faculty + 0.5 Other Researchers + 0.5 Graduates 7,290Group C 20 NASM FTE Faculty + 0.5 Other Researchers + 0.5 Graduates 0Group D 10 NASM FTE Faculty + 0.5 Other Researchers + 0.5 Graduates 0Group E 1 NASM FTE Faculty + 0.5 Other Researchers + 0.5 Graduates 0 78,473
4 Academic Office & Related SpaceFaculty 13 NASM 101 FTE Faculty + 15% Allowance 1,314
Other Research Appointments 13 NASM 11 FTE Other Research Appointments 143Graduate Sudents 4 NASM 299 FTE Graduate Students 1,197
Non-Academic Staff 13 NASM FTE Academic Staff Requiring Offices 0Office Services 25% NASM 25% 25% of above 663 35,706
5 Campus Study Space & Library FacilitiesStudy 0.6 NASM 1129 FTE Students 678
Student Computer Rooms 0.08 NASM 1129 FTE Undergraduate Students 90

DALHOUSIE UNIVERSITY MASTER PLANAPPENDIX C - CALCULATION BY COU STANDARDS METHOD
Page C-58 of 82
Stack (Compact Storage) 0.004 NASM 0 EV for actual % of Collection in Compact Storage 0Stack Remainder 1 0.007 NASM EV for 0-300,000 volumes 0Stack Remainder 2 0.006 NASM EV for next 300,000 volumes 0Stack Remainder 3 0.005 NASM EV for rest of collection 0
Service 0.25 0.25x(Stack&Study) No Input Required 25% of Stack and Study Totals 169 10,091 Atypical6 Recreation Athletic Space
All Institutions 0.9 NASM 1129 FTE Students 1,016Institutions with less than 4,000 FTE 2000 NASM No Input Required PLUS ? CheckInstitutions with 4,000 to 8,000 FTE 1000 NASM No Input Required PLUS ? 0 10,942 Check
7 Food ServicesLow Range 0.5 NASM 1129 FTE Students 565High Range 0.7 NASM FTE Students 0 6,079
8 Bookstore & Merchandizing FacilitiesLow Range 0.5 NASM 1129 FTE Students 565High Range 0.7 NASM FTE Students 0 6,079
9 Plant Maintenance 0.015 1.5% of Total NASM No Input Required Sum of NASM Categories 1-15 (& 17-20 if applied) 240 2,586 Atypical10 Administrative Offices & Related Space
Administrative Offices 13 NASM FTE Non-Academic Staff Requiring Offices 0Office Services 0.5 50% of NASM No Input Required 50% of Space Generated for Non-Academic Staff 0 0 Atypical
11 AV/TV FacilitiesLow Range 0.05 NASM 1129 FTE Students 56High Range 0.35 NASM FTE Students 0 608
12 Central ServicesLow Range 0.1 NASM 1129 FTE Students 113High Range 0.3 NASM FTE Students 0 1,216
13 Health Service FacilitiesLow Range 0.03 NASM 1129 FTE Students 34High Range 0.05 NASM FTE Students 0 365
14 Student Activity SpaceLow Range 0.5 NASM 1129 FTE Students 565High Range 0.7 NASM FTE Students 0 6,079
15 Assembly & Exhibition FacilitiesLow Range 0.15 NASM 1129 FTE Students 169High Range 0.4 NASM FTE Students 0 1,824
TOTAL NASF 238,023NASM to NASF Conversion Factor 10.76426265
TOTAL NASM 22,112

DALHOUSIE UNIVERSITY MASTER PLANAPPENDIX C - CALCULATION BY COU STANDARDS METHOD
Page C-59 of 82
FACULTY OF ARTS & SOCIAL SCIENCESCALCULATIONS (TRANSFER Existing Space Categories ONLY) INPUT: 2008 ENROLMENT (2665 STUDENTS)
COU COU Total COUCOU COU Space COU Input Generated TOTALS
COU Space Space Factor Input Measure Space INCat. # Category Factor Description Measure Description (NASM) (NASF)
Formula Areas 1 Classroom Facilities 1.23 NASM 2351 FTE Students 2,892 31,1342 Lab Undergraduate
Group W 0.8 NASM 0 WSLCH 0 SeeGroup X 0.6 NASM 0 WSLCH 0 WSCLHGroup Y 0.5 NASM 0 WSLCH 0 SeeGroup Z 0.3 NASM 0 WSLCH 0 759 WSCLH
3 Lab Graduate & FacultyGroup A 45 NASM FTE Faculty + 0.5 Other Researchers + 0.5 Graduates 0Group B 30 NASM FTE Faculty + 0.5 Other Researchers + 0.5 Graduates 0Group C 20 NASM FTE Faculty + 0.5 Other Researchers + 0.5 Graduates 0Group D 10 NASM FTE Faculty + 0.5 Other Researchers + 0.5 Graduates 0Group E 1 NASM FTE Faculty + 0.5 Other Researchers + 0.5 Graduates 0 0
4 Academic Office & Related SpaceFaculty 13 NASM 190 FTE Faculty + 15% Allowance 2,466
Other Research Appointments 13 NASM 1 FTE Other Research Appointments 13Graduate Sudents 4 NASM 209 FTE Graduate Students 834
Non-Academic Staff 13 NASM FTE Academic Staff Requiring Offices 0Office Services 25% NASM 25% 25% of above 828 44,585
5 Campus Study Space & Library FacilitiesStudy 0.6 NASM 2351 FTE Students 1,411
Student Computer Rooms 0.08 NASM 2351 FTE Undergraduate Students 188Stack (Compact Storage) 0.004 NASM 0 EV for actual % of Collection in Compact Storage 0
Stack Remainder 1 0.007 NASM EV for 0-300,000 volumes 0Stack Remainder 2 0.006 NASM EV for next 300,000 volumes 0Stack Remainder 3 0.005 NASM EV for rest of collection 0
Service 0.25 0.25x(Stack&Study) No Input Required 25% of Stack and Study Totals 353 21,009 Atypical6 Recreation Athletic Space
All Institutions 0.9 NASM 2351 FTE Students 2,116Institutions with less than 4,000 FTE 2000 NASM No Input Required PLUS ? CheckInstitutions with 4,000 to 8,000 FTE 1000 NASM No Input Required PLUS ? 0 22,781 Check
7 Food ServicesLow Range 0.5 NASM 2351 FTE Students 1,176High Range 0.7 NASM FTE Students 0 12,656
8 Bookstore & Merchandizing FacilitiesLow Range 0.5 NASM 2351 FTE Students 1,176High Range 0.7 NASM FTE Students 0 12,656
9 Plant Maintenance 0.015 1.5% of Total NASM No Input Required Sum of NASM Categories 1-15 (& 17-20 if applied) 231 2,487 Atypical10 Administrative Offices & Related Space
Administrative Offices 13 NASM FTE Non-Academic Staff Requiring Offices 0Office Services 0.5 50% of NASM No Input Required 50% of Space Generated for Non-Academic Staff 0 0 Atypical
11 AV/TV FacilitiesLow Range 0.05 NASM 2351 FTE Students 118High Range 0.35 NASM FTE Students 0 1,266
12 Central ServicesLow Range 0.1 NASM 2351 FTE Students 235High Range 0.3 NASM FTE Students 0 2,531
13 Health Service FacilitiesLow Range 0.03 NASM 2351 FTE Students 71High Range 0.05 NASM FTE Students 0 759

DALHOUSIE UNIVERSITY MASTER PLANAPPENDIX C - CALCULATION BY COU STANDARDS METHOD
Page C-60 of 82
14 Student Activity SpaceLow Range 0.5 NASM 2351 FTE Students 1,176High Range 0.7 NASM FTE Students 0 12,656
15 Assembly & Exhibition FacilitiesLow Range 0.15 NASM 2351 FTE Students 353High Range 0.4 NASM FTE Students 0 3,797
TOTAL NASF 169,075NASM to NASF Conversion Factor 10.76426265
TOTAL NASM 15,707
FACULTY OF COMPUTER SCIENCESCALCULATIONS (TRANSFER Existing Space Categories ONLY) INPUT: 2008 ENROLMENT (242 STUDENTS)
COU COU Total COUCOU COU Space COU Input Generated TOTALS
COU Space Space Factor Input Measure Space INCat. # Category Factor Description Measure Description (NASM) (NASF)
Formula Areas 1 Classroom Facilities 1.23 NASM 214 FTE Students 263 2,8272 Lab Undergraduate
Group W 0.8 NASM 0 WSLCH 0 SeeGroup X 0.6 NASM 0 WSLCH 0 WSCLHGroup Y 0.5 NASM 0 WSLCH 0 SeeGroup Z 0.3 NASM 0 WSLCH 0 1,133 WSCLH
3 Lab Graduate & FacultyGroup A 45 NASM FTE Faculty + 0.5 Other Researchers + 0.5 Graduates 0Group B 30 NASM FTE Faculty + 0.5 Other Researchers + 0.5 Graduates 0Group C 20 NASM FTE Faculty + 0.5 Other Researchers + 0.5 Graduates 0Group D 10 NASM 114.72 FTE Faculty + 0.5 Other Researchers + 0.5 Graduates 1,147Group E 1 NASM FTE Faculty + 0.5 Other Researchers + 0.5 Graduates 0 12,349
4 Academic Office & Related SpaceFaculty 13 NASM 34 FTE Faculty + 15% Allowance 438
Other Research Appointments 13 NASM 0 FTE Other Research Appointments 0Graduate Sudents 4 NASM 171 FTE Graduate Students 683
Non-Academic Staff 13 NASM FTE Academic Staff Requiring Offices 0Office Services 25% NASM 25% 25% of above 280 15,088
5 Campus Study Space & Library FacilitiesStudy 0.6 NASM 214 FTE Students 128
Student Computer Rooms 0.08 NASM 214 FTE Undergraduate Students 17

DALHOUSIE UNIVERSITY MASTER PLANAPPENDIX C - CALCULATION BY COU STANDARDS METHOD
Page C-61 of 82
Stack (Compact Storage) 0.004 NASM 0 EV for actual % of Collection in Compact Storage 0Stack Remainder 1 0.007 NASM EV for 0-300,000 volumes 0Stack Remainder 2 0.006 NASM EV for next 300,000 volumes 0Stack Remainder 3 0.005 NASM EV for rest of collection 0
Service 0.25 0.25x(Stack&Study) No Input Required 25% of Stack and Study Totals 32 1,908 Atypical6 Recreation Athletic Space
All Institutions 0.9 NASM 214 FTE Students 192Institutions with less than 4,000 FTE 2000 NASM No Input Required PLUS ? CheckInstitutions with 4,000 to 8,000 FTE 1000 NASM No Input Required PLUS ? 0 2,069 Check
7 Food ServicesLow Range 0.5 NASM 214 FTE Students 107High Range 0.7 NASM FTE Students 0 1,149
8 Bookstore & Merchandizing FacilitiesLow Range 0.5 NASM 214 FTE Students 107High Range 0.7 NASM FTE Students 0 1,149
9 Plant Maintenance 0.015 1.5% of Total NASM No Input Required Sum of NASM Categories 1-15 (& 17-20 if applied) 54 577 Atypical10 Administrative Offices & Related Space
Administrative Offices 13 NASM FTE Non-Academic Staff Requiring Offices 0Office Services 0.5 50% of NASM No Input Required 50% of Space Generated for Non-Academic Staff 0 0 Atypical
11 AV/TV FacilitiesLow Range 0.05 NASM 214 FTE Students 11High Range 0.35 NASM FTE Students 0 115
12 Central ServicesLow Range 0.1 NASM 214 FTE Students 21High Range 0.3 NASM FTE Students 0 230
13 Health Service FacilitiesLow Range 0.03 NASM 214 FTE Students 6High Range 0.05 NASM FTE Students 0 69
14 Student Activity SpaceLow Range 0.5 NASM 214 FTE Students 107High Range 0.7 NASM FTE Students 0 1,149
15 Assembly & Exhibition FacilitiesLow Range 0.15 NASM 214 FTE Students 32High Range 0.4 NASM FTE Students 0 345
TOTAL NASF 40,156NASM to NASF Conversion Factor 10.76426265
TOTAL NASM 3,731
FACULTY OF LAW

DALHOUSIE UNIVERSITY MASTER PLANAPPENDIX C - CALCULATION BY COU STANDARDS METHOD
Page C-62 of 82
CALCULATIONS (TRANSFER Existing Space Categories ONLY) INPUT: 2008 ENROLMENT (455 STUDENTS)COU COU Total COU
COU COU Space COU Input Generated TOTALSCOU Space Space Factor Input Measure Space INCat. # Category Factor Description Measure Description (NASM) (NASF)
Formula Areas 1 Classroom Facilities 1.23 NASM 401 FTE Students 494 5,3152 Lab Undergraduate
Group W 0.8 NASM 0 WSLCH 0 SeeGroup X 0.6 NASM 0 WSLCH 0 WSCLHGroup Y 0.5 NASM 0 WSLCH 0 SeeGroup Z 0.3 NASM 0 WSLCH 0 0 WSCLH
3 Lab Graduate & FacultyGroup A 45 NASM FTE Faculty + 0.5 Other Researchers + 0.5 Graduates 0Group B 30 NASM FTE Faculty + 0.5 Other Researchers + 0.5 Graduates 0Group C 20 NASM FTE Faculty + 0.5 Other Researchers + 0.5 Graduates 0Group D 10 NASM FTE Faculty + 0.5 Other Researchers + 0.5 Graduates 0Group E 1 NASM 50.83 FTE Faculty + 0.5 Other Researchers + 0.5 Graduates 51 547
4 Academic Office & Related SpaceFaculty 13 NASM 45 FTE Faculty + 15% Allowance 583
Other Research Appointments 13 NASM 0 FTE Other Research Appointments 0Graduate Sudents 4 NASM 24 FTE Graduate Students 95
Non-Academic Staff 13 NASM FTE Academic Staff Requiring Offices 0Office Services 25% NASM 25% 25% of above 169 9,119
5 Campus Study Space & Library FacilitiesStudy 0.6 NASM 401 FTE Students 241
Student Computer Rooms 0.08 NASM 401 FTE Undergraduate Students 32Stack (Compact Storage) 0.004 NASM 0 EV for actual % of Collection in Compact Storage 0
Stack Remainder 1 0.007 NASM EV for 0-300,000 volumes 0Stack Remainder 2 0.006 NASM EV for next 300,000 volumes 0Stack Remainder 3 0.005 NASM EV for rest of collection 0
Service 0.25 0.25x(Stack&Study) No Input Required 25% of Stack and Study Totals 60 3,587 Atypical6 Recreation Athletic Space
All Institutions 0.9 NASM 401 FTE Students 361Institutions with less than 4,000 FTE 2000 NASM No Input Required PLUS ? CheckInstitutions with 4,000 to 8,000 FTE 1000 NASM No Input Required PLUS ? 0 3,889 Check
7 Food ServicesLow Range 0.5 NASM 401 FTE Students 201High Range 0.7 NASM FTE Students 0 2,161
8 Bookstore & Merchandizing FacilitiesLow Range 0.5 NASM 401 FTE Students 201High Range 0.7 NASM FTE Students 0 2,161
9 Plant Maintenance 0.015 1.5% of Total NASM No Input Required Sum of NASM Categories 1-15 (& 17-20 if applied) 42 455 Atypical10 Administrative Offices & Related Space
Administrative Offices 13 NASM FTE Non-Academic Staff Requiring Offices 0Office Services 0.5 50% of NASM No Input Required 50% of Space Generated for Non-Academic Staff 0 0 Atypical
11 AV/TV FacilitiesLow Range 0.05 NASM 401 FTE Students 20High Range 0.35 NASM FTE Students 0 216
12 Central ServicesLow Range 0.1 NASM 401 FTE Students 40High Range 0.3 NASM FTE Students 0 432
13 Health Service FacilitiesLow Range 0.03 NASM 401 FTE Students 12High Range 0.05 NASM FTE Students 0 130
14 Student Activity SpaceLow Range 0.5 NASM 401 FTE Students 201

DALHOUSIE UNIVERSITY MASTER PLANAPPENDIX C - CALCULATION BY COU STANDARDS METHOD
Page C-63 of 82
High Range 0.7 NASM FTE Students 0 2,16115 Assembly & Exhibition Facilities
Low Range 0.15 NASM 401 FTE Students 60High Range 0.4 NASM FTE Students 0 648
TOTAL NASF 30,821NASM to NASF Conversion Factor 10.76426265
TOTAL NASM 2,863
FACULTY OF MANAGEMENTCALCULATIONS (TRANSFER Existing Space Categories ONLY) INPUT: 2008 ENROLMENT (1325 STUDENTS)
COU COU Total COUCOU COU Space COU Input Generated TOTALS
COU Space Space Factor Input Measure Space INCat. # Category Factor Description Measure Description (NASM) (NASF)
Formula Areas 1 Classroom Facilities 1.23 NASM 1169 FTE Students 1,438 15,4792 Lab Undergraduate
Group W 0.8 NASM 0 WSLCH 0 SeeGroup X 0.6 NASM 0 WSLCH 0 WSCLHGroup Y 0.5 NASM 0 WSLCH 0 SeeGroup Z 0.3 NASM 0 WSLCH 0 3,656 WSCLH
3 Lab Graduate & FacultyGroup A 45 NASM FTE Faculty + 0.5 Other Researchers + 0.5 Graduates 0Group B 30 NASM FTE Faculty + 0.5 Other Researchers + 0.5 Graduates 0Group C 20 NASM FTE Faculty + 0.5 Other Researchers + 0.5 Graduates 0Group D 10 NASM FTE Faculty + 0.5 Other Researchers + 0.5 Graduates 0Group E 1 NASM 295.335 FTE Faculty + 0.5 Other Researchers + 0.5 Graduates 295 3,179
4 Academic Office & Related SpaceFaculty 13 NASM 81 FTE Faculty + 15% Allowance 1,059
Other Research Appointments 13 NASM 1 FTE Other Research Appointments 13Graduate Sudents 4 NASM 448 FTE Graduate Students 1,792
Non-Academic Staff 13 NASM FTE Academic Staff Requiring Offices 0Office Services 25% NASM 25% 25% of above 716 38,534
5 Campus Study Space & Library FacilitiesStudy 0.6 NASM 1169 FTE Students 701
Student Computer Rooms 0.08 NASM 1169 FTE Undergraduate Students 94Stack (Compact Storage) 0.004 NASM 0 EV for actual % of Collection in Compact Storage 0
Stack Remainder 1 0.007 NASM EV for 0-300,000 volumes 0

DALHOUSIE UNIVERSITY MASTER PLANAPPENDIX C - CALCULATION BY COU STANDARDS METHOD
Page C-64 of 82
Stack Remainder 2 0.006 NASM EV for next 300,000 volumes 0Stack Remainder 3 0.005 NASM EV for rest of collection 0
Service 0.25 0.25x(Stack&Study) No Input Required 25% of Stack and Study Totals 175 10,445 Atypical6 Recreation Athletic Space
All Institutions 0.9 NASM 1169 FTE Students 1,052Institutions with less than 4,000 FTE 2000 NASM No Input Required PLUS ? CheckInstitutions with 4,000 to 8,000 FTE 1000 NASM No Input Required PLUS ? 0 11,326 Check
7 Food ServicesLow Range 0.5 NASM 1169 FTE Students 585High Range 0.7 NASM FTE Students 0 6,292
8 Bookstore & Merchandizing FacilitiesLow Range 0.5 NASM 1169 FTE Students 585High Range 0.7 NASM FTE Students 0 6,292
9 Plant Maintenance 0.015 1.5% of Total NASM No Input Required Sum of NASM Categories 1-15 (& 17-20 if applied) 142 1,530 Atypical10 Administrative Offices & Related Space
Administrative Offices 13 NASM FTE Non-Academic Staff Requiring Offices 0Office Services 0.5 50% of NASM No Input Required 50% of Space Generated for Non-Academic Staff 0 0 Atypical
11 AV/TV FacilitiesLow Range 0.05 NASM 1169 FTE Students 58High Range 0.35 NASM FTE Students 0 629
12 Central ServicesLow Range 0.1 NASM 1169 FTE Students 117High Range 0.3 NASM FTE Students 0 1,258
13 Health Service FacilitiesLow Range 0.03 NASM 1169 FTE Students 35High Range 0.05 NASM FTE Students 0 378
14 Student Activity SpaceLow Range 0.5 NASM 1169 FTE Students 585High Range 0.7 NASM FTE Students 0 6,292
15 Assembly & Exhibition FacilitiesLow Range 0.15 NASM 1169 FTE Students 175High Range 0.4 NASM FTE Students 0 1,888
TOTAL NASF 107,180NASM to NASF Conversion Factor 10.76426265
TOTAL NASM 9,957
FACULTY OF SCIENCECALCULATIONS (TRANSFER Existing Space Categories ONLY) INPUT: 2008 ENROLMENT (2695 STUDENTS)

DALHOUSIE UNIVERSITY MASTER PLANAPPENDIX C - CALCULATION BY COU STANDARDS METHOD
Page C-65 of 82
COU COU Total COUCOU COU Space COU Input Generated TOTALS
COU Space Space Factor Input Measure Space INCat. # Category Factor Description Measure Description (NASM) (NASF)
Formula Areas 1 Classroom Facilities 1.23 NASM 2378 FTE Students 2,925 31,4842 Lab Undergraduate
Group W 0.8 NASM 0 WSLCH 0 SeeGroup X 0.6 NASM 0 WSLCH 0 WSCLHGroup Y 0.5 NASM 0 WSLCH 0 SeeGroup Z 0.3 NASM 0 WSLCH 0 88,185 WSCLH
3 Lab Graduate & FacultyGroup A 45 NASM 445.242 FTE Faculty + 0.5 Other Researchers + 0.5 Graduates 20,036Group B 30 NASM FTE Faculty + 0.5 Other Researchers + 0.5 Graduates 0Group C 20 NASM FTE Faculty + 0.5 Other Researchers + 0.5 Graduates 0Group D 10 NASM FTE Faculty + 0.5 Other Researchers + 0.5 Graduates 0Group E 1 NASM FTE Faculty + 0.5 Other Researchers + 0.5 Graduates 0 215,672
4 Academic Office & Related SpaceFaculty 13 NASM 230 FTE Faculty + 15% Allowance 2,987
Other Research Appointments 13 NASM 50 FTE Other Research Appointments 650Graduate Sudents 4 NASM 441 FTE Graduate Students 1,764
Non-Academic Staff 13 NASM FTE Academic Staff Requiring Offices 0Office Services 25% NASM 25% 25% of above 1,350 72,664
5 Campus Study Space & Library FacilitiesStudy 0.6 NASM 2378 FTE Students 1,427
Student Computer Rooms 0.08 NASM 2378 FTE Undergraduate Students 190Stack (Compact Storage) 0.004 NASM 0 EV for actual % of Collection in Compact Storage 0
Stack Remainder 1 0.007 NASM EV for 0-300,000 volumes 0Stack Remainder 2 0.006 NASM EV for next 300,000 volumes 0Stack Remainder 3 0.005 NASM EV for rest of collection 0
Service 0.25 0.25x(Stack&Study) No Input Required 25% of Stack and Study Totals 357 21,245 Atypical6 Recreation Athletic Space
All Institutions 0.9 NASM 2378 FTE Students 2,140Institutions with less than 4,000 FTE 2000 NASM No Input Required PLUS ? CheckInstitutions with 4,000 to 8,000 FTE 1000 NASM No Input Required PLUS ? 0 23,037 Check
7 Food ServicesLow Range 0.5 NASM 2378 FTE Students 1,189High Range 0.7 NASM FTE Students 0 12,798
8 Bookstore & Merchandizing FacilitiesLow Range 0.5 NASM 2378 FTE Students 1,189High Range 0.7 NASM FTE Students 0 12,798
9 Plant Maintenance 0.015 1.5% of Total NASM No Input Required Sum of NASM Categories 1-15 (& 17-20 if applied) 573 6,164 Atypical10 Administrative Offices & Related Space
Administrative Offices 13 NASM FTE Non-Academic Staff Requiring Offices 0Office Services 0.5 50% of NASM No Input Required 50% of Space Generated for Non-Academic Staff 0 0 Atypical
11 AV/TV FacilitiesLow Range 0.05 NASM 2378 FTE Students 119High Range 0.35 NASM FTE Students 0 1,280
12 Central ServicesLow Range 0.1 NASM 2378 FTE Students 238High Range 0.3 NASM FTE Students 0 2,560
13 Health Service FacilitiesLow Range 0.03 NASM 2378 FTE Students 71High Range 0.05 NASM FTE Students 0 768
14 Student Activity SpaceLow Range 0.5 NASM 2378 FTE Students 1,189High Range 0.7 NASM FTE Students 0 12,798

DALHOUSIE UNIVERSITY MASTER PLANAPPENDIX C - CALCULATION BY COU STANDARDS METHOD
Page C-66 of 82
15 Assembly & Exhibition FacilitiesLow Range 0.15 NASM 2378 FTE Students 357High Range 0.4 NASM FTE Students 0 3,840
TOTAL NASF 505,293NASM to NASF Conversion Factor 10.76426265
TOTAL NASM 46,942
FACULTY OF DENTISTRYCALCULATIONS (TRANSFER Existing Space Categories ONLY) INPUT: 2008 ENROLMENT (247 STUDENTS)
COU COU Total COUCOU COU Space COU Input Generated TOTALS
COU Space Space Factor Input Measure Space INCat. # Category Factor Description Measure Description (NASM) (NASF)
Formula Areas 1 Classroom Facilities 1.23 NASM 218 FTE Students 268 2,8862 Lab Undergraduate
Group W 0.8 NASM 0 WSLCH 0 SeeGroup X 0.6 NASM 0 WSLCH 0 WSCLHGroup Y 0.5 NASM 0 WSLCH 0 SeeGroup Z 0.3 NASM 0 WSLCH 0 0 WSCLH
3 Lab Graduate & FacultyGroup A 45 NASM 41 FTE Faculty + 0.5 Other Researchers + 0.5 Graduates 1,845Group B 30 NASM FTE Faculty + 0.5 Other Researchers + 0.5 Graduates 0Group C 20 NASM FTE Faculty + 0.5 Other Researchers + 0.5 Graduates 0Group D 10 NASM FTE Faculty + 0.5 Other Researchers + 0.5 Graduates 0Group E 1 NASM FTE Faculty + 0.5 Other Researchers + 0.5 Graduates 0 19,860
4 Academic Office & Related SpaceFaculty 13 NASM 47 FTE Faculty + 15% Allowance 613
Other Research Appointments 13 NASM 0 FTE Other Research Appointments 0Graduate Sudents 4 NASM 0 FTE Graduate Students 0
Non-Academic Staff 13 NASM FTE Academic Staff Requiring Offices 0Office Services 25% NASM 25% 25% of above 153 8,247
5 Campus Study Space & Library FacilitiesStudy 0.6 NASM 218 FTE Students 131
Student Computer Rooms 0.08 NASM 218 FTE Undergraduate Students 17Stack (Compact Storage) 0.004 NASM 0 EV for actual % of Collection in Compact Storage 0
Stack Remainder 1 0.007 NASM EV for 0-300,000 volumes 0Stack Remainder 2 0.006 NASM EV for next 300,000 volumes 0

DALHOUSIE UNIVERSITY MASTER PLANAPPENDIX C - CALCULATION BY COU STANDARDS METHOD
Page C-67 of 82
Stack Remainder 3 0.005 NASM EV for rest of collection 0Service 0.25 0.25x(Stack&Study) No Input Required 25% of Stack and Study Totals 33 1,947 Atypical
6 Recreation Athletic SpaceAll Institutions 0.9 NASM 218 FTE Students 196
Institutions with less than 4,000 FTE 2000 NASM No Input Required PLUS ? CheckInstitutions with 4,000 to 8,000 FTE 1000 NASM No Input Required PLUS ? 0 2,111 Check
7 Food ServicesLow Range 0.5 NASM 218 FTE Students 109High Range 0.7 NASM FTE Students 0 1,173
8 Bookstore & Merchandizing FacilitiesLow Range 0.5 NASM 218 FTE Students 109High Range 0.7 NASM FTE Students 0 1,173
9 Plant Maintenance 0.015 1.5% of Total NASM No Input Required Sum of NASM Categories 1-15 (& 17-20 if applied) 55 590 Atypical10 Administrative Offices & Related Space
Administrative Offices 13 NASM FTE Non-Academic Staff Requiring Offices 0Office Services 0.5 50% of NASM No Input Required 50% of Space Generated for Non-Academic Staff 0 0 Atypical
11 AV/TV FacilitiesLow Range 0.05 NASM 218 FTE Students 11High Range 0.35 NASM FTE Students 0 117
12 Central ServicesLow Range 0.1 NASM 218 FTE Students 22High Range 0.3 NASM FTE Students 0 235
13 Health Service FacilitiesLow Range 0.03 NASM 218 FTE Students 7High Range 0.05 NASM FTE Students 0 70
14 Student Activity SpaceLow Range 0.5 NASM 218 FTE Students 109High Range 0.7 NASM FTE Students 0 1,173
15 Assembly & Exhibition FacilitiesLow Range 0.15 NASM 218 FTE Students 33High Range 0.4 NASM FTE Students 0 352
TOTAL NASF 39,935NASM to NASF Conversion Factor 10.76426265
TOTAL NASM 3,710
FACULTY OF HEALTH PROFESSIONSCALCULATIONS (TRANSFER Existing Space Categories ONLY) INPUT: 2008 ENROLMENT (2011 STUDENTS)
COU COU Total COU

DALHOUSIE UNIVERSITY MASTER PLANAPPENDIX C - CALCULATION BY COU STANDARDS METHOD
Page C-68 of 82
COU COU Space COU Input Generated TOTALSCOU Space Space Factor Input Measure Space INCat. # Category Factor Description Measure Description (NASM) (NASF)
Formula Areas 1 Classroom Facilities 1.23 NASM 1774 FTE Students 2,183 23,4932 Lab Undergraduate
Group W 0.8 NASM 0 WSLCH 0 SeeGroup X 0.6 NASM 0 WSLCH 0 WSCLHGroup Y 0.5 NASM 0 WSLCH 0 SeeGroup Z 0.3 NASM 0 WSLCH 0 13,653 WSCLH
3 Lab Graduate & FacultyGroup A 45 NASM 421.955 FTE Faculty + 0.5 Other Researchers + 0.5 Graduates 18,988Group B 30 NASM FTE Faculty + 0.5 Other Researchers + 0.5 Graduates 0Group C 20 NASM FTE Faculty + 0.5 Other Researchers + 0.5 Graduates 0Group D 10 NASM FTE Faculty + 0.5 Other Researchers + 0.5 Graduates 0Group E 1 NASM FTE Faculty + 0.5 Other Researchers + 0.5 Graduates 0 204,392
4 Academic Office & Related SpaceFaculty 13 NASM 171.35 FTE Faculty + 15% Allowance 2,228
Other Research Appointments 13 NASM 2 FTE Other Research Appointments 26Graduate Sudents 4 NASM 544 FTE Graduate Students 2,176
Non-Academic Staff 13 NASM FTE Academic Staff Requiring Offices 0Office Services 25% NASM 25% 25% of above 1,107 59,596
5 Campus Study Space & Library FacilitiesStudy 0.6 NASM 1774 FTE Students 1,065
Student Computer Rooms 0.08 NASM 1774 FTE Undergraduate Students 142Stack (Compact Storage) 0.004 NASM 0 EV for actual % of Collection in Compact Storage 0
Stack Remainder 1 0.007 NASM EV for 0-300,000 volumes 0Stack Remainder 2 0.006 NASM EV for next 300,000 volumes 0Stack Remainder 3 0.005 NASM EV for rest of collection 0
Service 0.25 0.25x(Stack&Study) No Input Required 25% of Stack and Study Totals 266 15,853 Atypical6 Recreation Athletic Space
All Institutions 0.9 NASM 1774 FTE Students 1,597Institutions with less than 4,000 FTE 2000 NASM No Input Required PLUS ? CheckInstitutions with 4,000 to 8,000 FTE 1000 NASM No Input Required PLUS ? 0 17,190 Check
7 Food ServicesLow Range 0.5 NASM 1774 FTE Students 887High Range 0.7 NASM FTE Students 0 9,550
8 Bookstore & Merchandizing FacilitiesLow Range 0.5 NASM 1774 FTE Students 887High Range 0.7 NASM FTE Students 0 9,550
9 Plant Maintenance 0.015 1.5% of Total NASM No Input Required Sum of NASM Categories 1-15 (& 17-20 if applied) 495 5,332 Atypical10 Administrative Offices & Related Space
Administrative Offices 13 NASM FTE Non-Academic Staff Requiring Offices 0Office Services 0.5 50% of NASM No Input Required 50% of Space Generated for Non-Academic Staff 0 0 Atypical
11 AV/TV FacilitiesLow Range 0.05 NASM 1774 FTE Students 89High Range 0.35 NASM FTE Students 0 955
12 Central ServicesLow Range 0.1 NASM 1774 FTE Students 177High Range 0.3 NASM FTE Students 0 1,910
13 Health Service FacilitiesLow Range 0.03 NASM 1774 FTE Students 53High Range 0.05 NASM FTE Students 0 573
14 Student Activity SpaceLow Range 0.5 NASM 1774 FTE Students 887High Range 0.7 NASM FTE Students 0 9,550
15 Assembly & Exhibition Facilities

DALHOUSIE UNIVERSITY MASTER PLANAPPENDIX C - CALCULATION BY COU STANDARDS METHOD
Page C-69 of 82
Low Range 0.15 NASM 1774 FTE Students 266High Range 0.4 NASM FTE Students 0 2,865
TOTAL NASF 374,463NASM to NASF Conversion Factor 10.76426265
TOTAL NASM 34,788
FACULTY OF MEDICINECALCULATIONS (TRANSFER Existing Space Categories ONLY) INPUT: 2008 ENROLMENT (391 STUDENTS)
COU COU Total COUCOU COU Space COU Input Generated TOTALS
COU Space Space Factor Input Measure Space INCat. # Category Factor Description Measure Description (NASM) (NASF)
Formula Areas 1 Classroom Facilities 1.23 NASM 345 FTE Students 424 4,5682 Lab Undergraduate
Group W 0.8 NASM 0 WSLCH 0 SeeGroup X 0.6 NASM 0 WSLCH 0 WSCLHGroup Y 0.5 NASM 0 WSLCH 0 SeeGroup Z 0.3 NASM 0 WSLCH 0 4,805 WSCLH
3 Lab Graduate & FacultyGroup A 45 NASM 289.365 FTE Faculty + 0.5 Other Researchers + 0.5 Graduates 13,021Group B 30 NASM FTE Faculty + 0.5 Other Researchers + 0.5 Graduates 0Group C 20 NASM FTE Faculty + 0.5 Other Researchers + 0.5 Graduates 0Group D 10 NASM FTE Faculty + 0.5 Other Researchers + 0.5 Graduates 0Group E 1 NASM FTE Faculty + 0.5 Other Researchers + 0.5 Graduates 0 140,166
4 Academic Office & Related SpaceFaculty 13 NASM 210.45 FTE Faculty + 15% Allowance 2,736
Other Research Appointments 13 NASM 43 FTE Other Research Appointments 559Graduate Sudents 4 NASM 170 FTE Graduate Students 679
Non-Academic Staff 13 NASM FTE Academic Staff Requiring Offices 0Office Services 25% NASM 25% 25% of above 993 53,468
5 Campus Study Space & Library FacilitiesStudy 0.6 NASM 345 FTE Students 207
Student Computer Rooms 0.08 NASM 345 FTE Undergraduate Students 28Stack (Compact Storage) 0.004 NASM 0 EV for actual % of Collection in Compact Storage 0
Stack Remainder 1 0.007 NASM EV for 0-300,000 volumes 0Stack Remainder 2 0.006 NASM EV for next 300,000 volumes 0Stack Remainder 3 0.005 NASM EV for rest of collection 0

DALHOUSIE UNIVERSITY MASTER PLANAPPENDIX C - CALCULATION BY COU STANDARDS METHOD
Page C-70 of 82
Service 0.25 0.25x(Stack&Study) No Input Required 25% of Stack and Study Totals 52 3,082 Atypical6 Recreation Athletic Space
All Institutions 0.9 NASM 345 FTE Students 311Institutions with less than 4,000 FTE 2000 NASM No Input Required PLUS ? CheckInstitutions with 4,000 to 8,000 FTE 1000 NASM No Input Required PLUS ? 0 3,342 Check
7 Food ServicesLow Range 0.5 NASM 345 FTE Students 173High Range 0.7 NASM FTE Students 0 1,857
8 Bookstore & Merchandizing FacilitiesLow Range 0.5 NASM 345 FTE Students 173High Range 0.7 NASM FTE Students 0 1,857
9 Plant Maintenance 0.015 1.5% of Total NASM No Input Required Sum of NASM Categories 1-15 (& 17-20 if applied) 295 3,171 Atypical10 Administrative Offices & Related Space
Administrative Offices 13 NASM FTE Non-Academic Staff Requiring Offices 0Office Services 0.5 50% of NASM No Input Required 50% of Space Generated for Non-Academic Staff 0 0 Atypical
11 AV/TV FacilitiesLow Range 0.05 NASM 345 FTE Students 17High Range 0.35 NASM FTE Students 0 186
12 Central ServicesLow Range 0.1 NASM 345 FTE Students 35High Range 0.3 NASM FTE Students 0 371
13 Health Service FacilitiesLow Range 0.03 NASM 345 FTE Students 10High Range 0.05 NASM FTE Students 0 111
14 Student Activity SpaceLow Range 0.5 NASM 345 FTE Students 173High Range 0.7 NASM FTE Students 0 1,857
15 Assembly & Exhibition FacilitiesLow Range 0.15 NASM 345 FTE Students 52High Range 0.4 NASM FTE Students 0 557
TOTAL NASF 219,399NASM to NASF Conversion Factor 10.76426265
TOTAL NASM 20,382
LIBRARY COLLECTION ASSUMPTIONS USED IN CALCULATIONSAverage over 5 years Totals over 5 years
Average Yearly Growth is 25,000 EV 125,000 EV
Average Yearly Growth in Enrolment 501.2 Students 2506 Students

DALHOUSIE UNIVERSITY MASTER PLANAPPENDIX C - CALCULATION BY COU STANDARDS METHOD
Page C-71 of 82
1527715470 193 students15886 416 students16436 550 students17093 657 students17783 690 students
Average Yearly New EV Per Student 49.88028731 New EV/Student 49.88028731 EV/Student
USE in Calculations for incremental grwoth 50 EV/Student
0Existing Volume 1,844,260 EV
120.72 Existing EV/Student

DALHOUSIE UNIVERSITY MASTER PLANTABLES 3A to 3J - COMPARISON AT FACULTY LEVEL: CURRENT SPACE TO COU GENERATED SPACE
Page T3.72 of 82
T-3A ARCHITECTURE & PLANNING2008 Enrolment VARIANCE
Existing Generated Space Existing COU Space As Per COU to COU
COU Space Inventory Standards GeneratedCat. # Category (NASF) (NASF) (NASF)
Formula Areas (NASF)1 Classroom Facilities 14,230 2,956 11,2742 Lab Undergraduate 5,711 853 4,8583 Lab Graduate & Faculty 04 Academic Office & Related Space 11,716 11,515 2015 Campus Study Space & Library Facilities 749 1,994 (1,245)6 Recreation Athletic Space 07 Food Services 08 Bookstore & Merchandizing Facilities 09 Plant Maintenance 0
10 Administrative Offices & Related Space 011 AV/TV Facilities 012 Central Services 013 Health Service Facilities 014 Student Activity Space 460 1,201 (741)15 Assembly & Exhibition Facilities 2,527 360 2,167
Subtotal - Formula Areas 35,393 18,880 16,51316 Non-Assignable (SF)
Non-Formula Areas (NASF)17 Residential Space18 Animal Space19 Other20 Health Sciences Clinical Facilities
Subtotal - Non-Formula Areas - TOTALS 35,393
TOTAL ASSIGNABLE SF 35,393 TOTAL NON-ASSIGNABLE SF - 0% of Assignable

DALHOUSIE UNIVERSITY MASTER PLANTABLES 3A to 3J - COMPARISON AT FACULTY LEVEL: CURRENT SPACE TO COU GENERATED SPACE
Page T3.73 of 82
T-3B ENGINEERING2008 Enrolment VARIANCE
Existing Generated Space Existing COU Space As Per COU to COU
COU Space Inventory Standards GeneratedCat. # Category (NASF) (NASF) (NASF)
Formula Areas (NASF)1 Classroom Facilities 2,341 14,953 (12,612) SEE NOTE 3.112 Lab Undergraduate 35,497 63,024 (27,527)3 Lab Graduate & Faculty 6,444 78,473 (72,029)4 Academic Office & Related Space 28,322 35,706 (7,384)5 Campus Study Space & Library Facilities 600 10,091 (9,491)6 Recreation Athletic Space 07 Food Services 08 Bookstore & Merchandizing Facilities 09 Plant Maintenance 0
10 Administrative Offices & Related Space 011 AV/TV Facilities 012 Central Services 013 Health Service Facilities 014 Student Activity Space 6,271 6,079 19215 Assembly & Exhibition Facilities 153 1,824 (1,671)
Subtotal - Formula Areas 79,628 210,150 (130,522)16 Non-Assignable (SF) 4,418
Non-Formula Areas (NASF)17 Residential Space18 Animal Space19 Other 6,078 20 Health Sciences Clinical Facilities
Subtotal - Non-Formula Areas 6,078 TOTALS 90,124
TOTAL ASSIGNABLE SF 85,706 TOTAL NON-ASSIGNABLE SF 4,418 5% of Assignable

DALHOUSIE UNIVERSITY MASTER PLANTABLES 3A to 3J - COMPARISON AT FACULTY LEVEL: CURRENT SPACE TO COU GENERATED SPACE
Page T3.74 of 82
T-3C ARTS & SOCIAL SCIENCES2008 Enrolment VARIANCE
Existing Generated Space Existing COU Space As Per COU to COU
COU Space Inventory Standards GeneratedCat. # Category (NASF) (NASF) (NASF)
Formula Areas (NASF)1 Classroom Facilities 8,285 31,134 (22,849) SEE NOTE 3.122 Lab Undergraduate 2,522 759 1,7633 Lab Graduate & Faculty 04 Academic Office & Related Space 45,691 44,585 1,1065 Campus Study Space & Library Facilities 5,937 5,9376 Recreation Athletic Space 07 Food Services 08 Bookstore & Merchandizing Facilities 531 12,656 (12,125)9 Plant Maintenance 0
10 Administrative Offices & Related Space 3,828 0 3,828 SEE NOTE 3.1011 AV/TV Facilities 012 Central Services 013 Health Service Facilities 014 Student Activity Space 1,043 12,656 (11,613)15 Assembly & Exhibition Facilities 26,813 3,797 23,016
Subtotal - Formula Areas 94,650 105,586 (10,936)16 Non-Assignable (SF) 2,597
Non-Formula Areas (NASF)17 Residential Space 70 18 Animal Space19 Other20 Health Sciences Clinical Facilities
Subtotal - Non-Formula Areas 70 TOTALS 97,317
TOTAL ASSIGNABLE SF 94,720 TOTAL NON-ASSIGNABLE SF 2,597 3% of Assignable

DALHOUSIE UNIVERSITY MASTER PLANTABLES 3A to 3J - COMPARISON AT FACULTY LEVEL: CURRENT SPACE TO COU GENERATED SPACE
Page T3.75 of 82
T-3D COMPUTER SCIENCE2008 Enrolment VARIANCE
Existing Generated Space Existing COU Space As Per COU to COU
COU Space Inventory Standards GeneratedCat. # Category (NASF) (NASF) (NASF)
Formula Areas (NASF)1 Classroom Facilities 1,685 2,827 (1,142) SEE NOTE 3.122 Lab Undergraduate 3,743 1,133 2,6103 Lab Graduate & Faculty 13,815 12,349 1,4664 Academic Office & Related Space 11,495 15,088 (3,593)5 Campus Study Space & Library Facilities 3,977 1,908 2,0696 Recreation Athletic Space 07 Food Services 08 Bookstore & Merchandizing Facilities 09 Plant Maintenance 0
10 Administrative Offices & Related Space 011 AV/TV Facilities 012 Central Services 552 230 32213 Health Service Facilities 014 Student Activity Space 406 1,149 (743)15 Assembly & Exhibition Facilities 0
Subtotal - Formula Areas 35,673 34,684 98916 Non-Assignable (SF)
Non-Formula Areas (NASF)17 Residential Space18 Animal Space19 Other 210 20 Health Sciences Clinical Facilities
Subtotal - Non-Formula Areas 210 TOTALS 35,883
TOTAL ASSIGNABLE SF 35,883 TOTAL NON-ASSIGNABLE SF - 0% of Assignable

DALHOUSIE UNIVERSITY MASTER PLANTABLES 3A to 3J - COMPARISON AT FACULTY LEVEL: CURRENT SPACE TO COU GENERATED SPACE
Page T3.76 of 82
T-3E LAW2008 Enrolment VARIANCE
Existing Generated Space Existing COU Space As Per COU to COU
COU Space Inventory Standards GeneratedCat. # Category (NASF) (NASF) (NASF)
Formula Areas (NASF)1 Classroom Facilities 12,832 5,315 7,517 SEE NOTE 3.122 Lab Undergraduate 03 Lab Graduate & Faculty 188 547 (359)4 Academic Office & Related Space 14,639 9,119 5,5205 Campus Study Space & Library Facilities 35,479 3,587 31,8926 Recreation Athletic Space 07 Food Services 08 Bookstore & Merchandizing Facilities 09 Plant Maintenance 0
10 Administrative Offices & Related Space 011 AV/TV Facilities 012 Central Services 765 432 33313 Health Service Facilities 014 Student Activity Space 2,938 2,161 77715 Assembly & Exhibition Facilities 0
Subtotal - Formula Areas 66,841 21,161 45,68016 Non-Assignable (SF) 107
Non-Formula Areas (NASF)17 Residential Space18 Animal Space19 Other20 Health Sciences Clinical Facilities
Subtotal - Non-Formula Areas - TOTALS 66,948
TOTAL ASSIGNABLE SF 66,841 TOTAL NON-ASSIGNABLE SF 107 0% of Assignable

DALHOUSIE UNIVERSITY MASTER PLANTABLES 3A to 3J - COMPARISON AT FACULTY LEVEL: CURRENT SPACE TO COU GENERATED SPACE
Page T3.77 of 82
T-3F MANAGEMENT2008 Enrolment VARIANCE
Existing Generated Space Existing COU Space As Per COU to COU
COU Space Inventory Standards GeneratedCat. # Category (NASF) (NASF) (NASF)
Formula Areas (NASF)1 Classroom Facilities 1,354 15,479 (14,125) SEE NOTE 3.122 Lab Undergraduate 03 Lab Graduate & Faculty 2,170 3,179 (1,009)4 Academic Office & Related Space 23,857 38,534 (14,677)5 Campus Study Space & Library Facilities 117 10,445 (10,328)6 Recreation Athletic Space 07 Food Services 08 Bookstore & Merchandizing Facilities 09 Plant Maintenance 0
10 Administrative Offices & Related Space 011 AV/TV Facilities 012 Central Services 013 Health Service Facilities 014 Student Activity Space 2,330 6,292 (3,962)15 Assembly & Exhibition Facilities 0
Subtotal - Formula Areas 29,828 73,930 (44,102)16 Non-Assignable (SF) 1,126
Non-Formula Areas (NASF)17 Residential Space18 Animal Space19 Other20 Health Sciences Clinical Facilities
Subtotal - Non-Formula Areas - TOTALS 30,954
TOTAL ASSIGNABLE SF 29,828 TOTAL NON-ASSIGNABLE SF 1,126 4% of Assignable

DALHOUSIE UNIVERSITY MASTER PLANTABLES 3A to 3J - COMPARISON AT FACULTY LEVEL: CURRENT SPACE TO COU GENERATED SPACE
Page T3.78 of 82
T-3G SCIENCE2008 Enrolment VARIANCE
Existing Generated Space Existing COU Space As Per COU to COU
COU Space Inventory Standards GeneratedCat. # Category (NASF) (NASF) (NASF)
Formula Areas (NASF)1 Classroom Facilities 7,728 31,484 (23,756) SEE NOTE 3.122 Lab Undergraduate 62,747 88,185 (25,438)3 Lab Graduate & Faculty 213,086 215,672 (2,586)4 Academic Office & Related Space 101,629 72,664 28,9655 Campus Study Space & Library Facilities 20,960 21,245 (285)6 Recreation Athletic Space 07 Food Services 08 Bookstore & Merchandizing Facilities 09 Plant Maintenance 0
10 Administrative Offices & Related Space 011 AV/TV Facilities 012 Central Services 955 2,560 (1,605)13 Health Service Facilities 014 Student Activity Space 5,100 12,798 (7,698)15 Assembly & Exhibition Facilities 2,465 3,840 (1,375)
Subtotal - Formula Areas 414,670 448,448 (33,778)16 Non-Assignable (SF) 2,209
Non-Formula Areas (NASF)17 Residential Space18 Animal Space19 Other 1,529 20 Health Sciences Clinical Facilities
Subtotal - Non-Formula Areas 1,529 TOTALS 418,408
TOTAL ASSIGNABLE SF 416,199 TOTAL NON-ASSIGNABLE SF 2,209 1% of Assignable

DALHOUSIE UNIVERSITY MASTER PLANTABLES 3A to 3J - COMPARISON AT FACULTY LEVEL: CURRENT SPACE TO COU GENERATED SPACE
Page T3.79 of 82
T3-H DENTISTRY2008 Enrolment VARIANCE
Existing Generated Space Existing COU Space As Per COU to COU
COU Space Inventory Standards GeneratedCat. # Category (NASF) (NASF) (NASF)
Formula Areas (NASF)1 Classroom Facilities 2,341 2,886 (545) SEE NOTE 3.132 Lab Undergraduate 35,497 0 35,497 SEE NOTE 3.143 Lab Graduate & Faculty 6,444 19,860 (13,416)4 Academic Office & Related Space 28,322 8,247 20,0755 Campus Study Space & Library Facilities 600 1,947 (1,347)6 Recreation Athletic Space 07 Food Services 08 Bookstore & Merchandizing Facilities 09 Plant Maintenance 0
10 Administrative Offices & Related Space 011 AV/TV Facilities 012 Central Services 013 Health Service Facilities 014 Student Activity Space 6,271 1,173 5,09815 Assembly & Exhibition Facilities 153 352 (199)
Subtotal - Formula Areas 79,628 34,465 45,16316 Non-Assignable (SF) 4,418
Non-Formula Areas (NASF)17 Residential Space18 Animal Space19 Other 6,078 20 Health Sciences Clinical Facilities
Subtotal - Non-Formula Areas 6,078 TOTALS 90,124
TOTAL ASSIGNABLE SF 85,706 TOTAL NON-ASSIGNABLE SF 4,418 5% of Assignable

DALHOUSIE UNIVERSITY MASTER PLANTABLES 3A to 3J - COMPARISON AT FACULTY LEVEL: CURRENT SPACE TO COU GENERATED SPACE
Page T3.80 of 82
T3-I HEALTH PROFESSIONS2008 Enrolment VARIANCE
Existing Generated Space Existing COU Space As Per COU to COU
COU Space Inventory Standards GeneratedCat. # Category (NASF) (NASF) (NASF)
Formula Areas (NASF)1 Classroom Facilities 15,647 23,493 (7,846) SEE NOTE 3.132 Lab Undergraduate 14,113 13,653 4603 Lab Graduate & Faculty 15,557 204,392 (188,835)4 Academic Office & Related Space 42,607 59,596 (16,989)5 Campus Study Space & Library Facilities 4,468 15,853 (11,385)6 Recreation Athletic Space 8,835 17,190 (8,355)7 Food Services 08 Bookstore & Merchandizing Facilities 09 Plant Maintenance 0
10 Administrative Offices & Related Space 678 0 67811 AV/TV Facilities 012 Central Services 013 Health Service Facilities 014 Student Activity Space 3,462 9,550 (6,088)15 Assembly & Exhibition Facilities 1,823 2,865 (1,042)
Subtotal - Formula Areas 107,190 346,592 (239,402)16 Non-Assignable (SF) 1,319
Non-Formula Areas (NASF)17 Residential Space18 Animal Space19 Other20 Health Sciences Clinical Facilities
Subtotal - Non-Formula Areas - TOTALS 108,509
TOTAL ASSIGNABLE SF 107,190 TOTAL NON-ASSIGNABLE SF 1,319 1% of Assignable

DALHOUSIE UNIVERSITY MASTER PLANTABLES 3A to 3J - COMPARISON AT FACULTY LEVEL: CURRENT SPACE TO COU GENERATED SPACE
Page T3.81 of 82
T3-J MEDICINE2008 Enrolment VARIANCE
Existing Generated Space Existing COU Space As Per COU to COU
COU Space Inventory Standards GeneratedCat. # Category (NASF) (NASF) (NASF)
Formula Areas (NASF)1 Classroom Facilities 8,689 4,568 4,1212 Lab Undergraduate 10,475 4,805 5,6703 Lab Graduate & Faculty 57,598 140,166 (82,568)4 Academic Office & Related Space 35,742 53,468 (17,726)5 Campus Study Space & Library Facilities 1,530 3,082 (1,552)6 Recreation Athletic Space 07 Food Services 08 Bookstore & Merchandizing Facilities 243 1,857 (1,614)9 Plant Maintenance 0
10 Administrative Offices & Related Space 3,740 0 3,740 SEE NOTE 3.1011 AV/TV Facilities 620 186 43412 Central Services 560 371 18913 Health Service Facilities 014 Student Activity Space 1,918 1,857 6115 Assembly & Exhibition Facilities 0
Subtotal - Formula Areas 121,115 210,360 (89,245)16 Non-Assignable (SF) 1,276
Non-Formula Areas (NASF)17 Residential Space 2,144 18 Animal Space19 Other20 Health Sciences Clinical Facilities
Subtotal - Non-Formula Areas 2,144 TOTALS 124,535
TOTAL ASSIGNABLE SF 123,259 TOTAL NON-ASSIGNABLE SF 1,276 1% of Assignable

DALHOUSIE UNIVERSITY MASTER PLANTABLES 3A to 3J - COMPARISON AT FACULTY LEVEL: CURRENT SPACE TO COU GENERATED SPACE
Page T3.82 of 82
NOTES TO ABOVE TABLES 3A to 3J
GENERAL NOTE: The comparison of existing space inventory by Faculty may not provide in certain instances a complete and realistic comparison between space inventoried under a certain Faculty and space generated by the COU method.While the COU generated space will include all classroom space required for a certain Faculty based on enrolment, the existing inventory for the same Faculty may not necessarily include this space which may be part of the "common pool" space.The variance, in certain instances, may therefore be misleading.
NOTES COMMON TO ALL TABLESNote 3.1: NASF is Net Assignable Square Feet.Note 3.2: COU refers to the Council of Ontario Universities method of generating space standards based on enrolments and other factors.Note 3.3: Existing Space Inventory numbers are based the University's inventory (by Department) of buildings, spaces and rooms at the time of the analysis.Note 3.4: In the case of low/high COU estimating factors available, the low factors were used unless otherwise indicated.Note 3.5: Variances between Existing and COU Generated Space are only shown for the present. Note 3.6: For calculations of COU generated space reference Appendix C, pages C35 to C54.Note 3.7: Some COU categories do not apply to all/some of the Faculties.Note 3.8: Library stack/collection space (COU Category 5) may not be listed under a Department/Faculty and may account for some variances.Note 3.9: COU Space Categories 16 to 20 are not formula-based, or based on enrolment/staffing related input measures, and therefore a comparison is not possible.
TABLE SPECIFIC NOTES REFERENCED IN INDIVIDUAL TABLESNote 3.10: Breakdown of Administrative Staff not available for direct comparison at this level of detail.Note 3.11: There are also 8,217 NASF in Common Pool Classrooms on the Sexton Campus which are not inventoried under a specific Department/Faculty.Note 3.12: There are also 85,179 NASF in Common Pool Classrooms on the Studley Campus which are not inventoried under a specific Department/Faculty.Note 3.13: There are also 16,229 NASF in Common Pool Classrooms on the Carlton Campus which are not inventoried under a specific Department/Faculty.Note 3.14: Information for Dentistry Weekly Scheduled Contact Lab Hours is not available and therefore comparison is not feasible.