Embed Size (px)
Citation preview
Daiwa Investment Conference Tokyo 2016
March 2, 2016
Copyright © 2016 JAPAN POST BANK CO., LTD. All Rights Reserved.
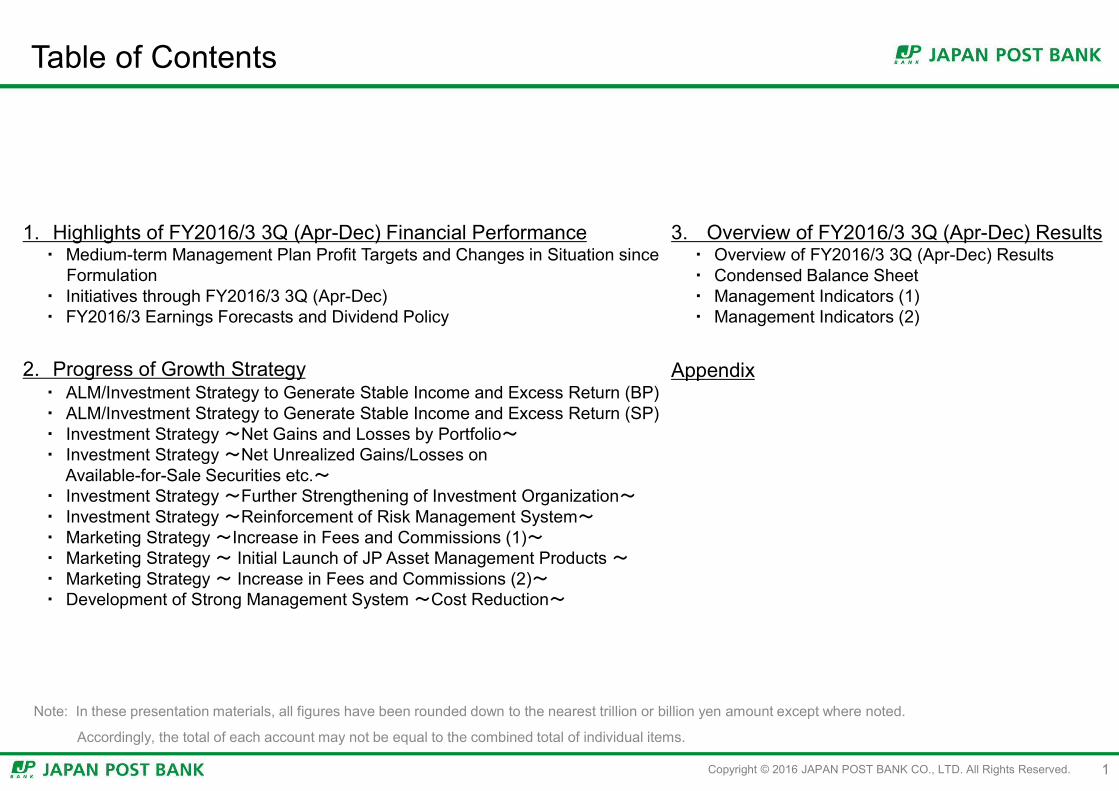
Table of Contents
1
1. Highlights of FY2016/3 3Q (Apr-Dec) Financial Performance・ Medium-term Management Plan Profit Targets and Changes in Situation since
Formulation・ Initiatives through FY2016/3 3Q (Apr-Dec)・ FY2016/3 Earnings Forecasts and Dividend Policy
2. Progress of Growth Strategy・ ALM/Investment Strategy to Generate Stable Income and Excess Return (BP)・ ALM/Investment Strategy to Generate Stable Income and Excess Return (SP)・ Investment Strategy ~Net Gains and Losses by Portfolio~・ Investment Strategy ~Net Unrealized Gains/Losses on
Available-for-Sale Securities etc.~・ Investment Strategy ~Further Strengthening of Investment Organization~・ Investment Strategy ~Reinforcement of Risk Management System~・ Marketing Strategy ~Increase in Fees and Commissions (1)~・ Marketing Strategy ~ Initial Launch of JP Asset Management Products~・ Marketing Strategy ~ Increase in Fees and Commissions (2)~・ Development of Strong Management System ~Cost Reduction~
Note: In these presentation materials, all figures have been rounded down to the nearest trillion or billion yen amount except where noted.
Accordingly, the total of each account may not be equal to the combined total of individual items.
3. Overview of FY2016/3 3Q (Apr-Dec) Results・ Overview of FY2016/3 3Q (Apr-Dec) Results・ Condensed Balance Sheet・ Management Indicators (1)・ Management Indicators (2)
Appendix
Copyright © 2016 JAPAN POST BANK CO., LTD. All Rights Reserved. 2
1.Highlights of FY2016/3 3Q (Apr-Dec) Financial Performance
Copyright © 2016 JAPAN POST BANK CO., LTD. All Rights Reserved.
Medium-term Management Plan Profit Targets and Changes in Situation since Formulation
3
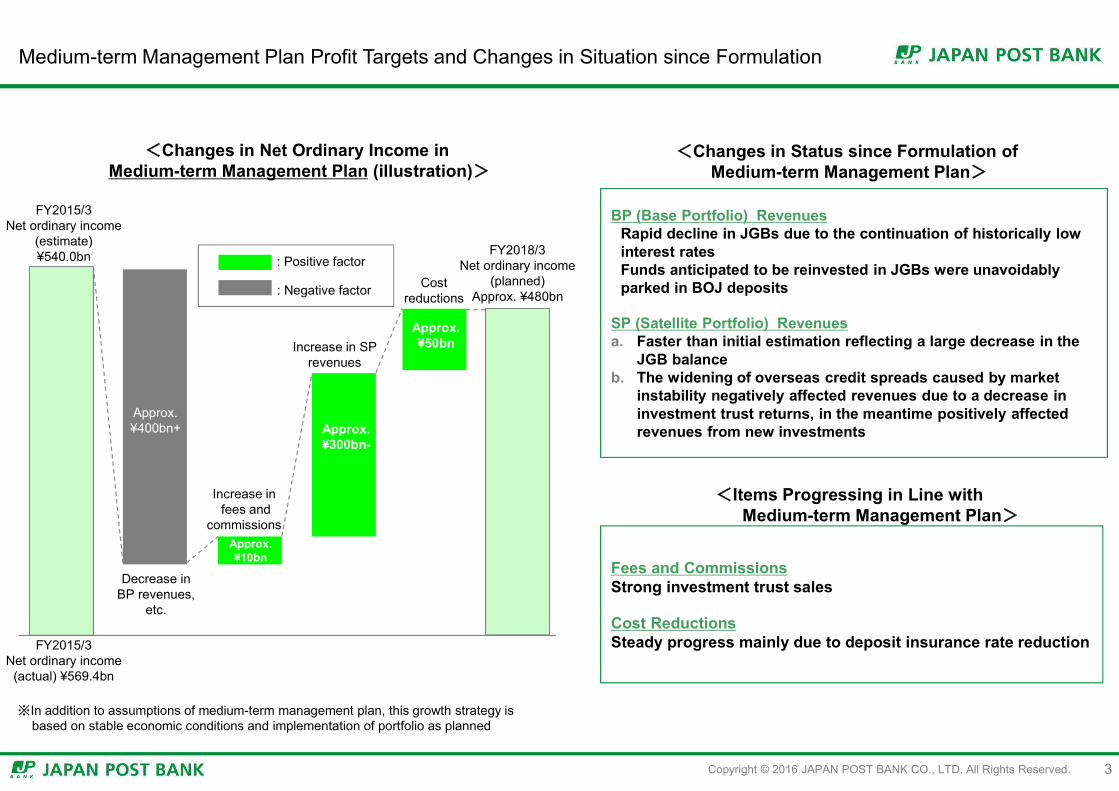
<Changes in Net Ordinary Income in Medium-term Management Plan (illustration)>
FY2015/3Net ordinary income
(estimate)¥540.0bn
Decrease in BP revenues,
etc.
Increase infees and
commissions
Increase in SP revenues
Cost reductions
FY2018/3Net ordinary income
(planned)Approx. ¥480bn
: Positive factor
: Negative factor
Approx.¥400bn+
Approx.¥10bn
Approx.¥300bn-
Approx.¥50bn
BP (Base Portfolio) RevenuesRapid decline in JGBs due to the continuation of historically low interest ratesFunds anticipated to be reinvested in JGBs were unavoidably parked in BOJ deposits
SP (Satellite Portfolio) Revenuesa. Faster than initial estimation reflecting a large decrease in the
JGB balanceb. The widening of overseas credit spreads caused by market
instability negatively affected revenues due to a decrease in investment trust returns, in the meantime positively affected revenues from new investments
<Changes in Status since Formulation of Medium-term Management Plan>
Fees and CommissionsStrong investment trust sales
Cost ReductionsSteady progress mainly due to deposit insurance rate reduction
<Items Progressing in Line withMedium-term Management Plan>
FY2015/3Net ordinary income
(actual) ¥569.4bn
※In addition to assumptions of medium-term management plan, this growth strategy isbased on stable economic conditions and implementation of portfolio as planned
Copyright © 2016 JAPAN POST BANK CO., LTD. All Rights Reserved.
Initiatives through FY2016/3 3Q (Apr-Dec)
4
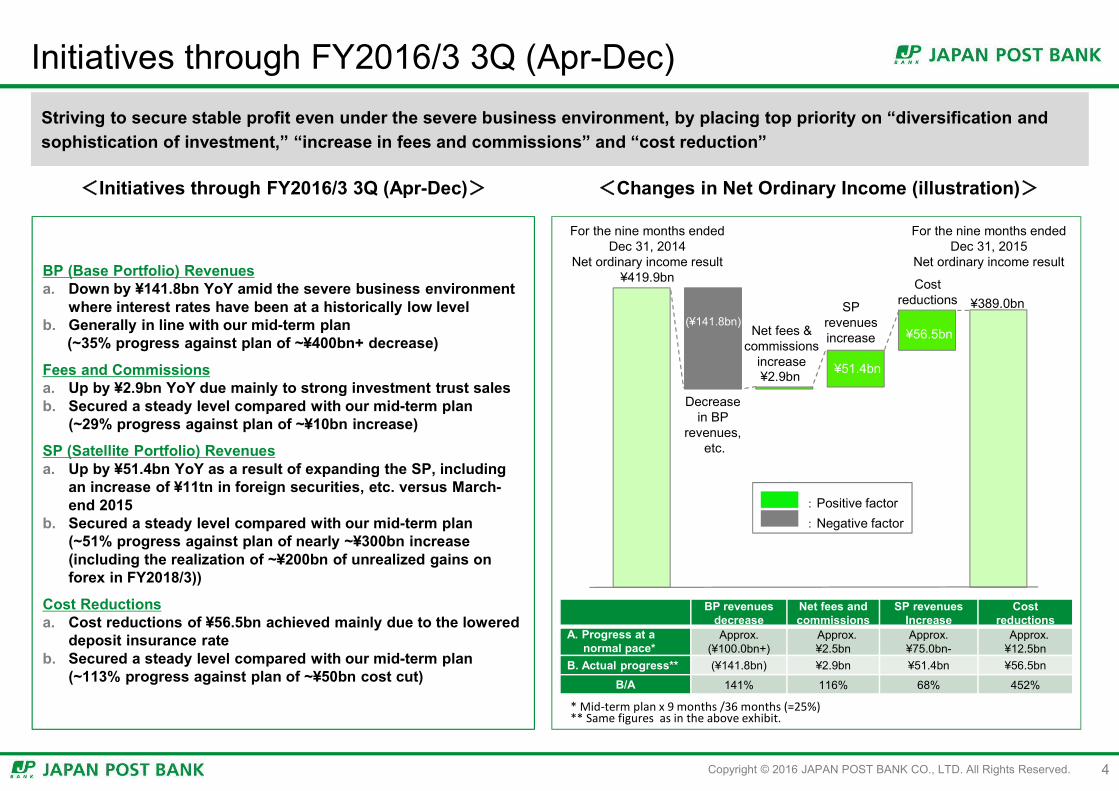
Striving to secure stable profit even under the severe business environment, by placing top priority on “diversification and sophistication of investment,” “increase in fees and commissions” and “cost reduction”
<Changes in Net Ordinary Income (illustration)>
BP (Base Portfolio) Revenuesa. Down by ¥141.8bn YoY amid the severe business environment
where interest rates have been at a historically low levelb. Generally in line with our mid-term plan
(~35% progress against plan of ~¥400bn+ decrease)
Fees and Commissionsa. Up by ¥2.9bn YoY due mainly to strong investment trust salesb. Secured a steady level compared with our mid-term plan
(~29% progress against plan of ~¥10bn increase)
SP (Satellite Portfolio) Revenuesa. Up by ¥51.4bn YoY as a result of expanding the SP, including
an increase of ¥11tn in foreign securities, etc. versus March-end 2015
b. Secured a steady level compared with our mid-term plan (~51% progress against plan of nearly ~¥300bn increase (including the realization of ~¥200bn of unrealized gains on forex in FY2018/3))
Cost Reductionsa. Cost reductions of ¥56.5bn achieved mainly due to the lowered
deposit insurance rateb. Secured a steady level compared with our mid-term plan
(~113% progress against plan of ~¥50bn cost cut)
<Initiatives through FY2016/3 3Q (Apr-Dec)>
For the nine months ended Dec 31, 2014
Net ordinary income result¥419.9bn
Decrease in BP
revenues,etc.
(¥141.8bn)Net fees &
commissionsincrease¥2.9bn
For the nine months endedDec 31, 2015
Net ordinary income result
SPrevenuesincrease ¥56.5bn
Cost reductions
¥51.4bn
:Positive factor:Negative factor
¥389.0bn
BP revenues decrease
Net fees and commissions
SP revenues Increase
Cost reductions
A. Progress at a normal pace*
Approx.(¥100.0bn+)
Approx.¥2.5bn
Approx.¥75.0bn-
Approx.¥12.5bn
B. Actual progress** (¥141.8bn) ¥2.9bn ¥51.4bn ¥56.5bn
B/A 141% 116% 68% 452%
* Mid-term plan x 9 months /36 months (=25%)** Same figures as in the above exhibit.
Copyright © 2016 JAPAN POST BANK CO., LTD. All Rights Reserved.
FY2016/3 Earnings Forecasts and Dividend Policy
5
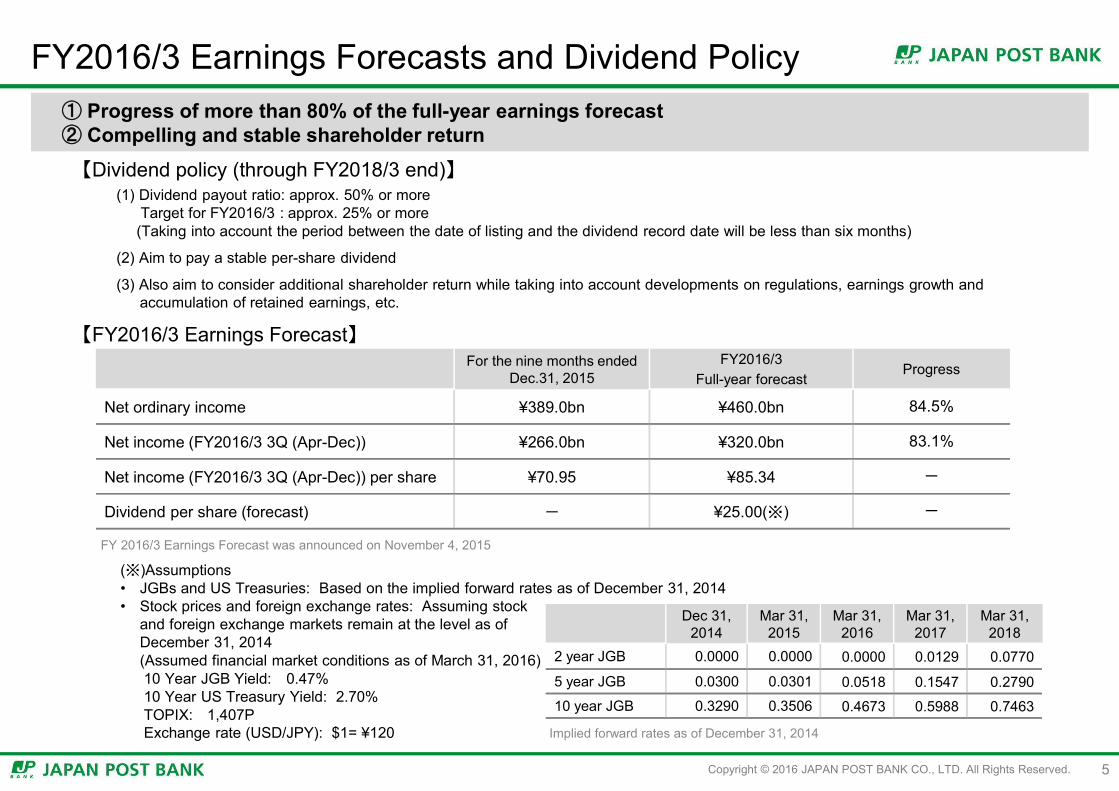
For the nine months endedDec.31, 2015
FY2016/3Full-year forecast
Progress
Net ordinary income ¥389.0bn ¥460.0bn 84.5%
Net income (FY2016/3 3Q (Apr-Dec)) ¥266.0bn ¥320.0bn 83.1%
Net income (FY2016/3 3Q (Apr-Dec)) per share ¥70.95 ¥85.34 -
Dividend per share (forecast) - ¥25.00(※) -
① Progress of more than 80% of the full-year earnings forecast② Compelling and stable shareholder return
(※)Assumptions• JGBs and US Treasuries: Based on the implied forward rates as of December 31, 2014• Stock prices and foreign exchange rates: Assuming stock
and foreign exchange markets remain at the level as ofDecember 31, 2014 (Assumed financial market conditions as of March 31, 2016)10 Year JGB Yield: 0.47%10 Year US Treasury Yield: 2.70%TOPIX: 1,407PExchange rate (USD/JPY): $1= ¥120
【FY2016/3 Earnings Forecast】
【Dividend policy (through FY2018/3 end)】(1) Dividend payout ratio: approx. 50% or more
Target for FY2016/3 : approx. 25% or more(Taking into account the period between the date of listing and the dividend record date will be less than six months)
(2) Aim to pay a stable per-share dividend
(3) Also aim to consider additional shareholder return while taking into account developments on regulations, earnings growth andaccumulation of retained earnings, etc.
FY 2016/3 Earnings Forecast was announced on November 4, 2015
Dec 31,2014
Mar 31,2015
Mar 31,2016
Mar 31,2017
Mar 31,2018
2 year JGB 0.0000 0.0000 0.0000 0.0129 0.0770
5 year JGB 0.0300 0.0301 0.0518 0.1547 0.2790
10 year JGB 0.3290 0.3506 0.4673 0.5988 0.7463
Implied forward rates as of December 31, 2014
Copyright © 2016 JAPAN POST BANK CO., LTD. All Rights Reserved. 6
2. Progress of Growth Strategy
Copyright © 2016 JAPAN POST BANK CO., LTD. All Rights Reserved.
Portfolio Management Policy
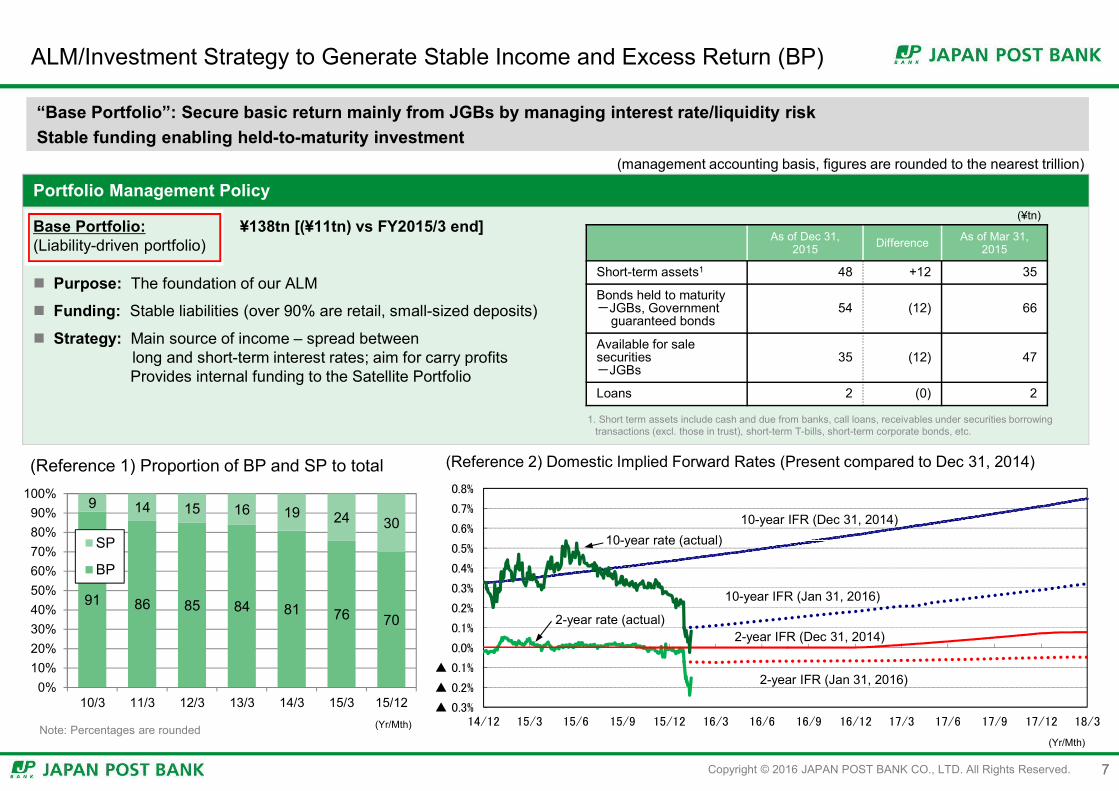
Base Portfolio: ¥138tn [(¥11tn) vs FY2015/3 end](Liability-driven portfolio)
Purpose: The foundation of our ALM
Funding: Stable liabilities (over 90% are retail, small-sized deposits)
Strategy: Main source of income – spread between long and short-term interest rates; aim for carry profitsProvides internal funding to the Satellite Portfolio
ALM/Investment Strategy to Generate Stable Income and Excess Return (BP)
“Base Portfolio”: Secure basic return mainly from JGBs by managing interest rate/liquidity risk Stable funding enabling held-to-maturity investment
7
1. Short term assets include cash and due from banks, call loans, receivables under securities borrowingtransactions (excl. those in trust), short-term T-bills, short-term corporate bonds, etc.
7
(management accounting basis, figures are rounded to the nearest trillion)
As of Dec 31, 2015 Difference As of Mar 31,
2015
Short-term assets1 48 +12 35
Bonds held to maturity-JGBs, Government
guaranteed bonds54 (12) 66
Available for sale securities-JGBs
35 (12) 47
Loans 2 (0) 2
(Reference 1) Proportion of BP and SP to total (Reference 2) Domestic Implied Forward Rates (Present compared to Dec 31, 2014)
(¥tn)
▲ 0.3%
▲ 0.2%
▲ 0.1%
0.0%
0.1%
0.2%
0.3%
0.4%
0.5%
0.6%
0.7%
0.8%
14/12 15/3 15/6 15/9 15/12 16/3 16/6 16/9 16/12 17/3 17/6 17/9 17/12 18/3
10-year IFR (Dec 31, 2014)
2-year rate (actual)
10-year rate (actual)
10-year IFR (Jan 31, 2016)
2-year IFR (Dec 31, 2014)
2-year IFR (Jan 31, 2016)
(Yr/Mth)
91 86 85 84 81 76 70
9 14 15 16 19 24 30
0%10%20%30%40%50%60%70%80%90%
100%
10/3 11/3 12/3 13/3 14/3 15/3 15/12
SP
BP
(Yr/Mth)Note: Percentages are rounded
Copyright © 2016 JAPAN POST BANK CO., LTD. All Rights Reserved.
0.4%0.8%1.2%1.6%2.0%2.4%2.8%3.2%3.6%4.0%4.4%
12/12 13/6 13/12 14/6 14/12 15/6 15/12
5-year UST
BB rating
(Yr/Mth)
A rating
BBB rating
Portfolio Management Policy
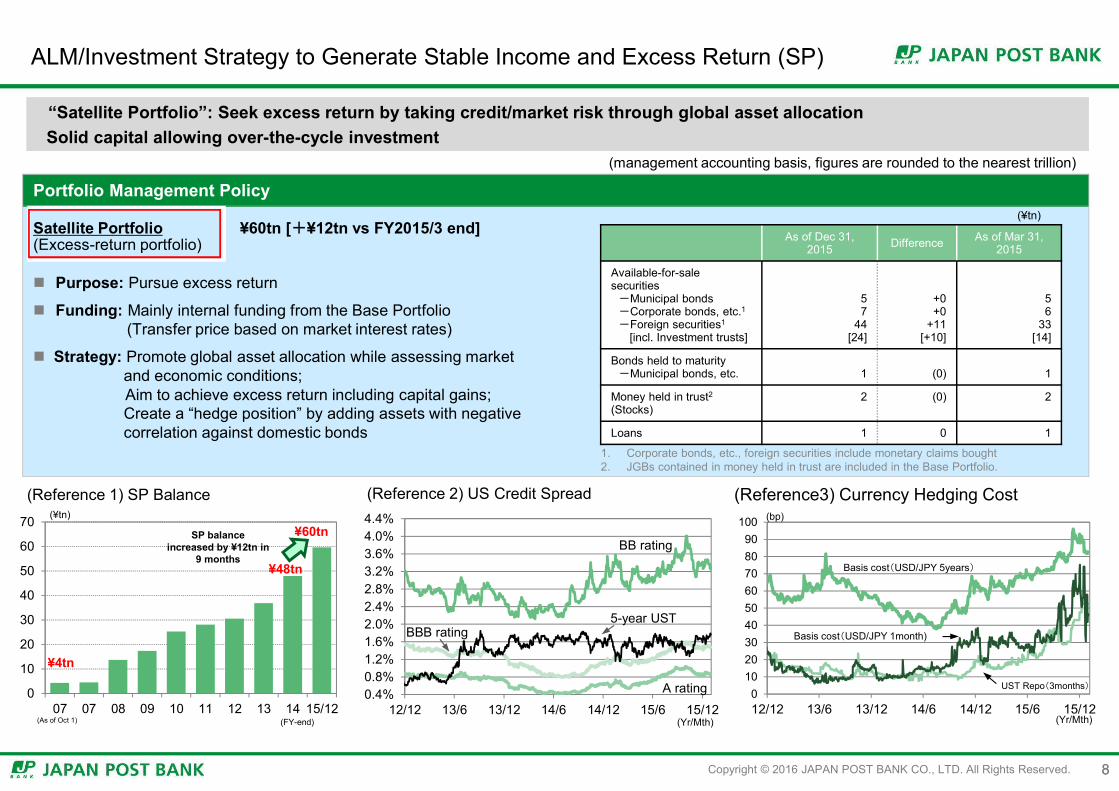
Satellite Portfolio ¥60tn [+¥12tn vs FY2015/3 end](Excess-return portfolio)
Purpose: Pursue excess return
Funding: Mainly internal funding from the Base Portfolio(Transfer price based on market interest rates)
Strategy: Promote global asset allocation while assessing marketand economic conditions;Aim to achieve excess return including capital gains;Create a “hedge position” by adding assets with negative correlation against domestic bonds
ALM/Investment Strategy to Generate Stable Income and Excess Return (SP)
“Satellite Portfolio”: Seek excess return by taking credit/market risk through global asset allocation Solid capital allowing over-the-cycle investment
8
1. Corporate bonds, etc., foreign securities include monetary claims bought2. JGBs contained in money held in trust are included in the Base Portfolio.
8
(management accounting basis, figures are rounded to the nearest trillion)
As of Dec 31, 2015 Difference As of Mar 31,
2015
Available-for-sale securities-Municipal bonds-Corporate bonds, etc.1-Foreign securities1
[incl. Investment trusts]
57
44[24]
+0+0
+11[+10]
56
33[14]
Bonds held to maturity-Municipal bonds, etc. 1 (0) 1
Money held in trust2
(Stocks)2 (0) 2
Loans 1 0 1
(Reference 1) SP Balance (Reference 2) US Credit Spread
0
10
20
30
40
50
60
70
07 07 08 09 10 11 12 13 14 15/12
(¥tn)
(As of Oct 1) (FY-end)
¥4tn
¥48tn
¥60tnSP balance increased by ¥12tn in
9 months
(¥tn)
(Reference3) Currency Hedging Cost
0102030405060708090
100
12/12 13/6 13/12 14/6 14/12 15/6 15/12(Yr/Mth)
Basis cost(USD/JPY 5years)
UST Repo(3months)
(bp)
Basis cost(USD/JPY 1month)
Copyright © 2016 JAPAN POST BANK CO., LTD. All Rights Reserved.
Investment Strategy~Net Gains and Losses by Portfolio ~
9
FY2010/3 FY2011/3 FY2012/3 FY2013/3 FY2014/3 FY2015/3For the nine
months endedDecember 31,
2014
For the nine months endedDecember 31,
2015 Average balance
Net gains / losses
Average balance
Net gains / losses
Average balance
Net gains / losses
Average balance
Net gains / losses
Average balance
Net gains / losses
Average balance
Net gains / losses
Average balance
Net gains / losses
Average balance
Net gains / losses
Total Portfolio
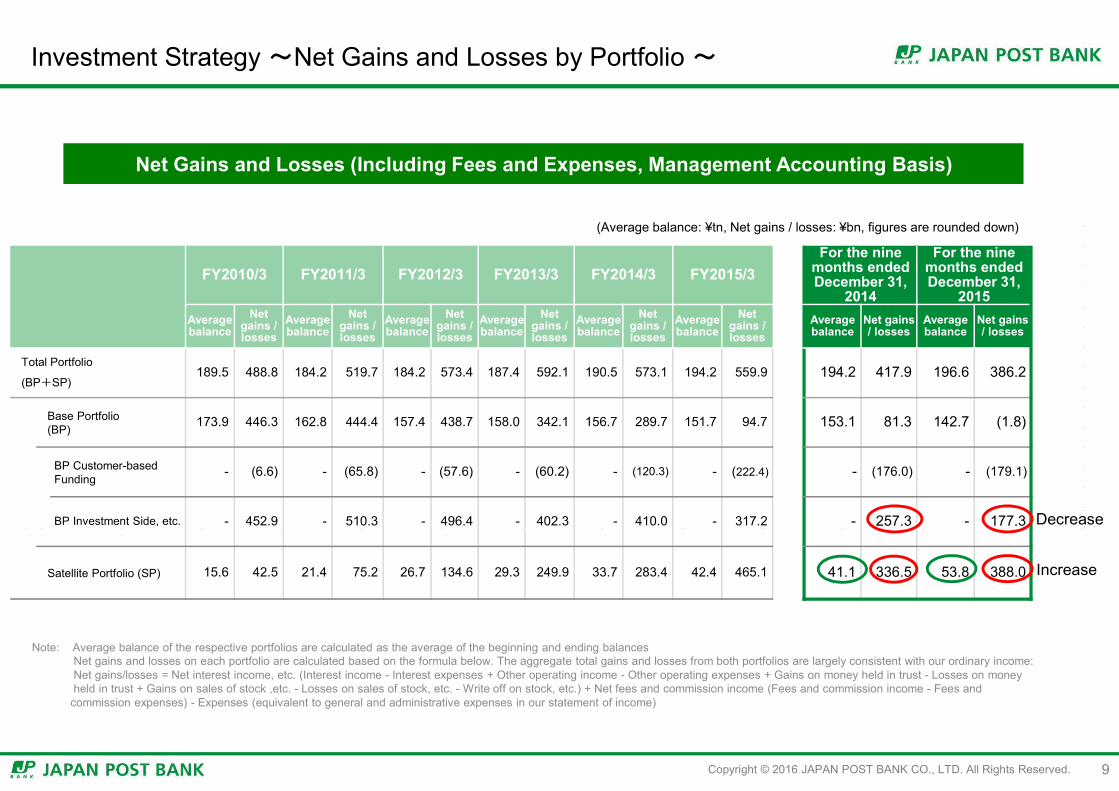
(BP+SP)189.5 488.8 184.2 519.7 184.2 573.4 187.4 592.1 190.5 573.1 194.2 559.9 194.2 417.9 196.6 386.2
Base Portfolio(BP) 173.9 446.3 162.8 444.4 157.4 438.7 158.0 342.1 156.7 289.7 151.7 94.7 153.1 81.3 142.7 (1.8)
BP Customer-based Funding - (6.6) - (65.8) - (57.6) - (60.2) - (120.3) - (222.4) - (176.0) - (179.1)
BP Investment Side, etc. - 452.9 - 510.3 - 496.4 - 402.3 - 410.0 - 317.2 - 257.3 - 177.3
Satellite Portfolio (SP) 15.6 42.5 21.4 75.2 26.7 134.6 29.3 249.9 33.7 283.4 42.4 465.1 41.1 336.5 53.8 388.0
Note: Average balance of the respective portfolios are calculated as the average of the beginning and ending balancesNet gains and losses on each portfolio are calculated based on the formula below. The aggregate total gains and losses from both portfolios are largely consistent with our ordinary income:Net gains/losses = Net interest income, etc. (Interest income - Interest expenses + Other operating income - Other operating expenses + Gains on money held in trust - Losses on moneyheld in trust + Gains on sales of stock ,etc. - Losses on sales of stock, etc. - Write off on stock, etc.) + Net fees and commission income (Fees and commission income - Fees andcommission expenses) - Expenses (equivalent to general and administrative expenses in our statement of income)
(Average balance: ¥tn, Net gains / losses: ¥bn, figures are rounded down)
Net Gains and Losses (Including Fees and Expenses, Management Accounting Basis)
Decrease
Increase
Copyright © 2016 JAPAN POST BANK CO., LTD. All Rights Reserved.
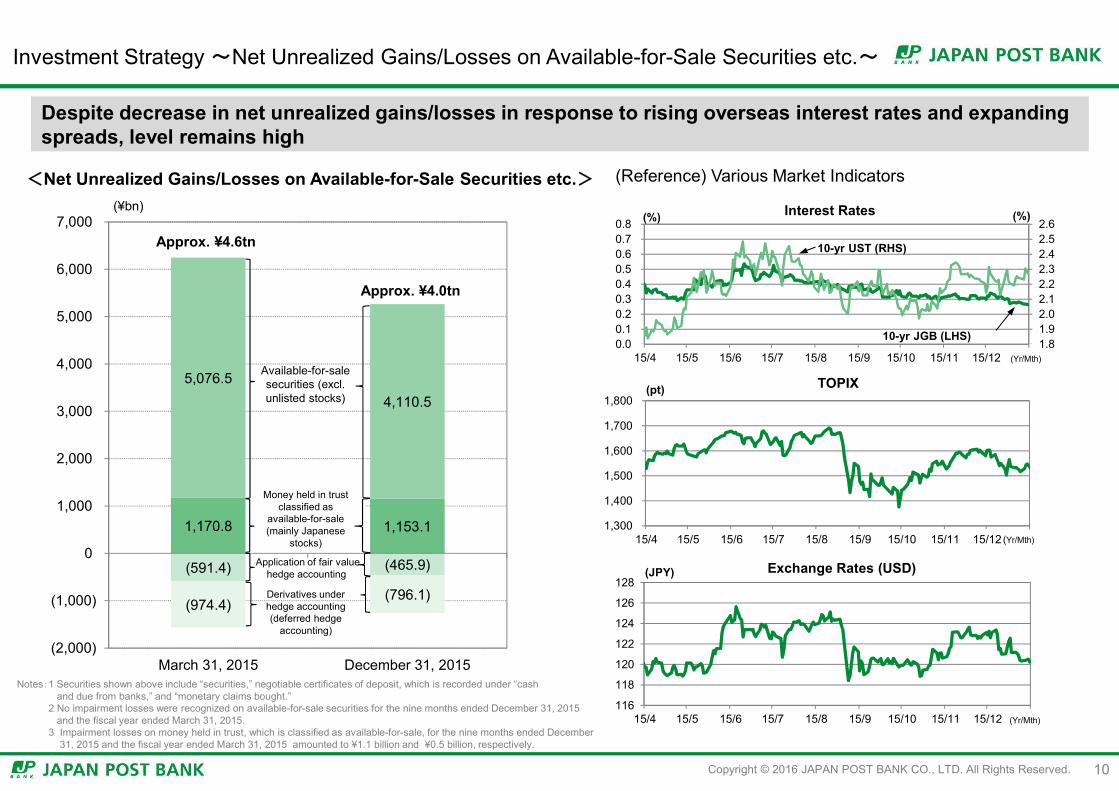
(591.4) (465.9)
(974.4)(796.1)
1,170.8 1,153.1
5,076.54,110.5
(2,000)
(1,000)
0
1,000
2,000
3,000
4,000
5,000
6,000
7,000
March 31, 2015 December 31, 2015
(¥bn)
Money held in trust classified as
available-for-sale (mainly Japanese
stocks)
Application of fair value hedge accounting
Available-for-sale securities (excl. unlisted stocks)
Derivatives under hedge accounting (deferred hedge
accounting)
Approx. ¥4.0tn
Approx. ¥4.6tn
Investment Strategy ~Net Unrealized Gains/Losses on Available-for-Sale Securities etc.~
10
Despite decrease in net unrealized gains/losses in response to rising overseas interest rates and expanding spreads, level remains high
<Net Unrealized Gains/Losses on Available-for-Sale Securities etc.> (Reference) Various Market Indicators
116
118
120
122
124
126
128
15/4 15/5 15/6 15/7 15/8 15/9 15/10 15/11 15/12
(JPY) Exchange Rates (USD)
(Yr/Mth)
1,300
1,400
1,500
1,600
1,700
1,800
15/4 15/5 15/6 15/7 15/8 15/9 15/10 15/11 15/12
(pt) TOPIX
(Yr/Mth)
1.81.92.02.12.22.32.42.52.6
0.00.10.20.30.40.50.60.70.8
15/4 15/5 15/6 15/7 15/8 15/9 15/10 15/11 15/12
(%)(%) Interest Rates
(Yr/Mth)
10-yr UST (RHS)
10-yr JGB (LHS)
Notes:1 Securities shown above include “securities,” negotiable certificates of deposit, which is recorded under “cash and due from banks,” and “monetary claims bought.”
2 No impairment losses were recognized on available-for-sale securities for the nine months ended December 31, 2015 and the fiscal year ended March 31, 2015.
3 Impairment losses on money held in trust, which is classified as available-for-sale, for the nine months ended December 31, 2015 and the fiscal year ended March 31, 2015 amounted to ¥1.1 billion and ¥0.5 billion, respectively.
Copyright © 2016 JAPAN POST BANK CO., LTD. All Rights Reserved.
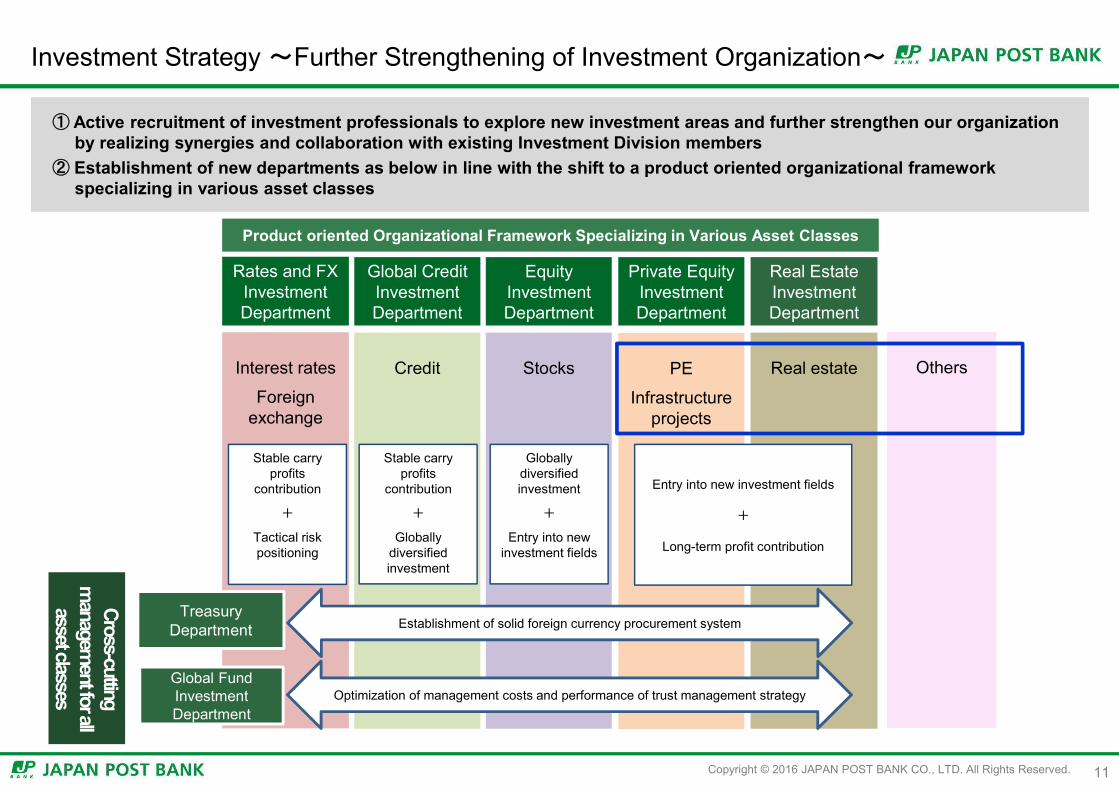
Investment Strategy ~Further Strengthening of Investment Organization~
① Active recruitment of investment professionals to explore new investment areas and further strengthen our organization by realizing synergies and collaboration with existing Investment Division members
② Establishment of new departments as below in line with the shift to a product oriented organizational framework specializing in various asset classes
11
Rates and FX Investment Department
Global Credit Investment Department
Equity Investment Department
Private Equity Investment Department
Real Estate Investment Department
Interest rates
Foreignexchange
Credit Stocks PE
Infrastructure projects
Real estate
Stable carry profits
contribution
+
Tactical risk positioning
Stable carry profits
contribution
+
Globally diversified investment
Globally diversified investment
+
Entry into new investment fields
Product oriented Organizational Framework Specializing in Various Asset Classes
Entry into new investment fields
+
Long-term profit contribution
Global Fund Investment Department
Treasury Department Establishment of solid foreign currency procurement system
Optimization of management costs and performance of trust management strategy
Cross-cuttingm
anagement for all
asset classes
Others
Copyright © 2016 JAPAN POST BANK CO., LTD. All Rights Reserved. 12
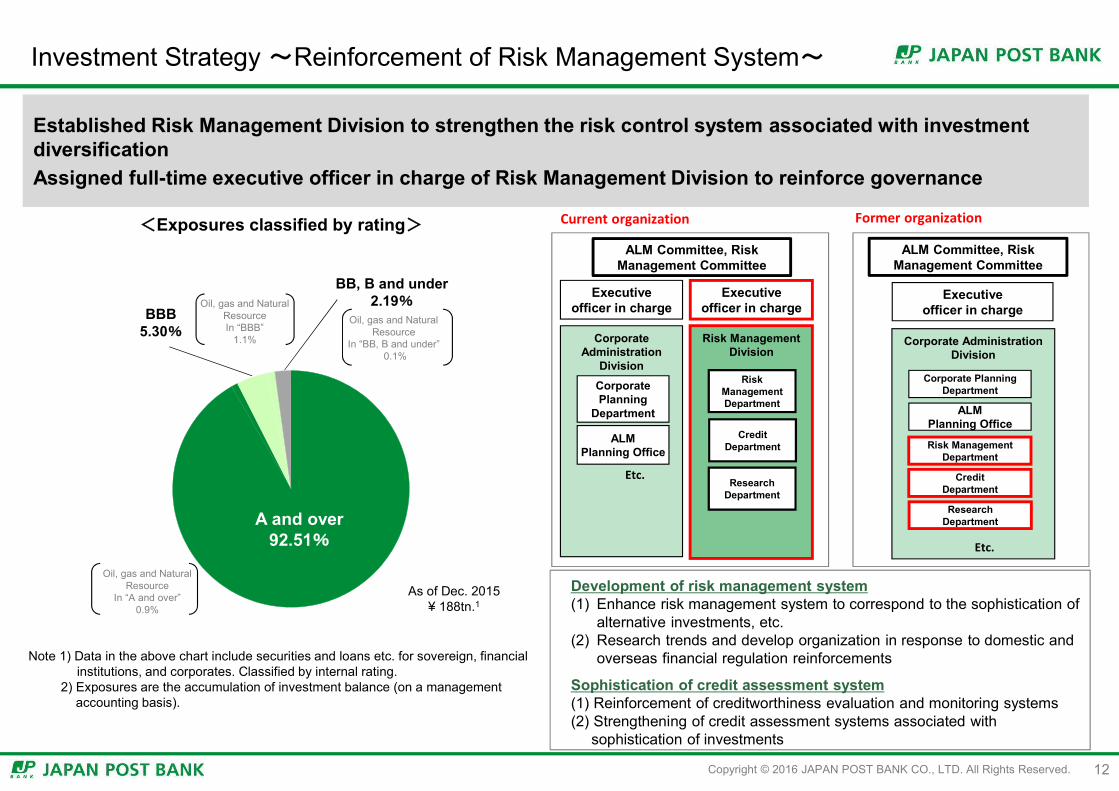
Investment Strategy ~Reinforcement of Risk Management System~
Current organization
Established Risk Management Division to strengthen the risk control system associated with investment diversificationAssigned full-time executive officer in charge of Risk Management Division to reinforce governance
Former organization
ALM Committee, Risk Management Committee
Corporate Administration
DivisionCorporate Planning
Department
ALMPlanning Office
Etc.
Executive officer in charge
Executive officer in charge
ALM Committee, Risk Management Committee
Risk Management Division
Risk ManagementDepartment
CreditDepartment
Research Department
Executive officer in charge
Corporate Administration Division
Corporate Planning Department
ALMPlanning Office
Risk Management Department
CreditDepartment
Etc.
Research Department
Development of risk management system(1) Enhance risk management system to correspond to the sophistication of
alternative investments, etc.(2) Research trends and develop organization in response to domestic and
overseas financial regulation reinforcements
Sophistication of credit assessment system(1) Reinforcement of creditworthiness evaluation and monitoring systems(2) Strengthening of credit assessment systems associated with
sophistication of investments
Oil, gas and Natural ResourceIn “BBB”
1.1%
Oil, gas and Natural Resource
In “A and over”0.9%
BBB5.30%
A and over92.51%
BB, B and under2.19%
Oil, gas and Natural Resource
In “BB, B and under”0.1%
Note 1) Data in the above chart include securities and loans etc. for sovereign, financial institutions, and corporates. Classified by internal rating.
2) Exposures are the accumulation of investment balance (on a management accounting basis).
As of Dec. 2015¥ 188tn.1
<Exposures classified by rating>
Copyright © 2016 JAPAN POST BANK CO., LTD. All Rights Reserved.
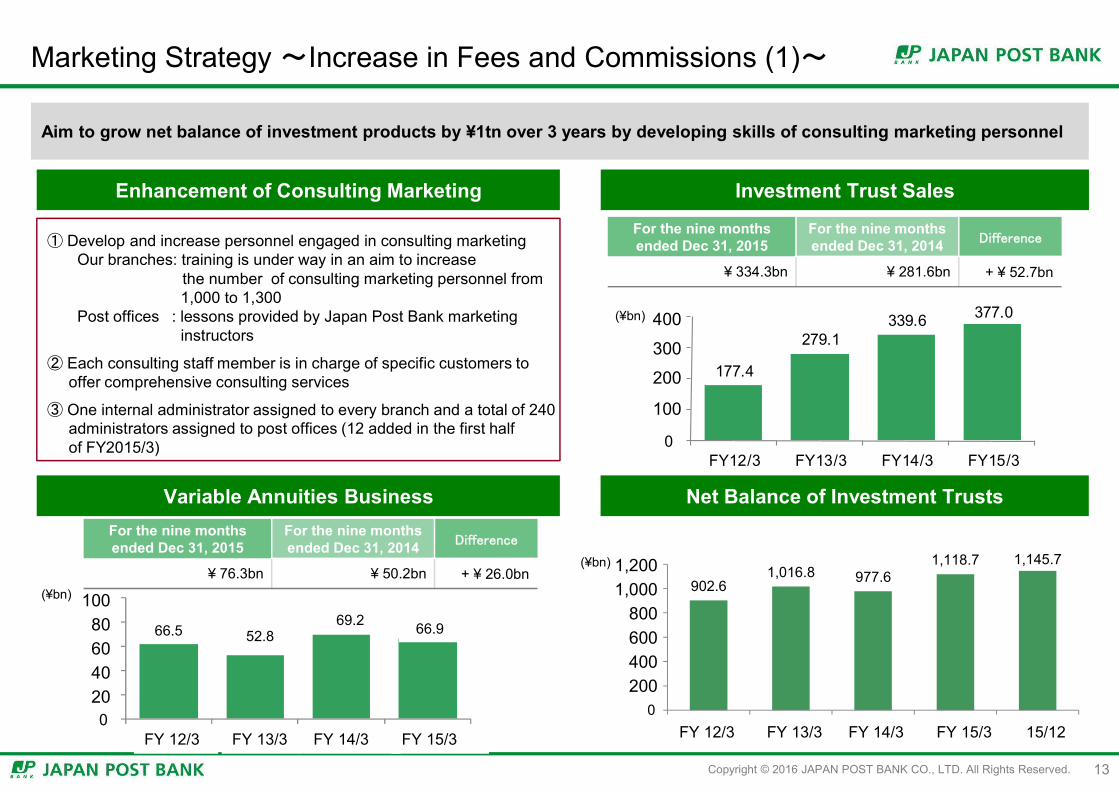
Marketing Strategy ~Increase in Fees and Commissions (1)~
13
Aim to grow net balance of investment products by ¥1tn over 3 years by developing skills of consulting marketing personnel
Enhancement of Consulting Marketing Investment Trust Sales
Variable Annuities Business
For the nine months ended Dec 31, 2015
For the nine months ended Dec 31, 2014 Difference
¥ 334.3bn ¥ 281.6bn + ¥ 52.7bn
① Develop and increase personnel engaged in consulting marketingOur branches: training is under way in an aim to increase
the number of consulting marketing personnel from 1,000 to 1,300
Post offices : lessons provided by Japan Post Bank marketing instructors
② Each consulting staff member is in charge of specific customers tooffer comprehensive consulting services
③ One internal administrator assigned to every branch and a total of 240administrators assigned to post offices (12 added in the first halfof FY2015/3)
177.4
279.1339.6 377.0
0
1,000
2,000
3,000
4,000
FY12/3 FY13/3 FY14/3 FY15/3
902.61,016.8 977.6
1,118.7 1,145.7
0
2,000
4,000
6,000
8,000
10,000
12,000
12/3期 13/3期 14/3期 15/3期 16/3期3Q末
665 528
692 669
0200400600800
1,000
12/3期 13/3期 14/3期 15/3期FY 13/3FY 12/3 FY 14/3 FY 15/3 FY 13/3FY 12/3 FY 14/3 FY 15/3
400
300
200
100
1,2001,000
800600400200
10080604020
66.5 52.869.2 66.9
(¥bn)
Net Balance of Investment Trusts
(¥bn)
For the nine months ended Dec 31, 2015
For the nine months ended Dec 31, 2014 Difference
¥ 76.3bn ¥ 50.2bn + ¥ 26.0bn(¥bn)
15/12
Copyright © 2016 JAPAN POST BANK CO., LTD. All Rights Reserved.
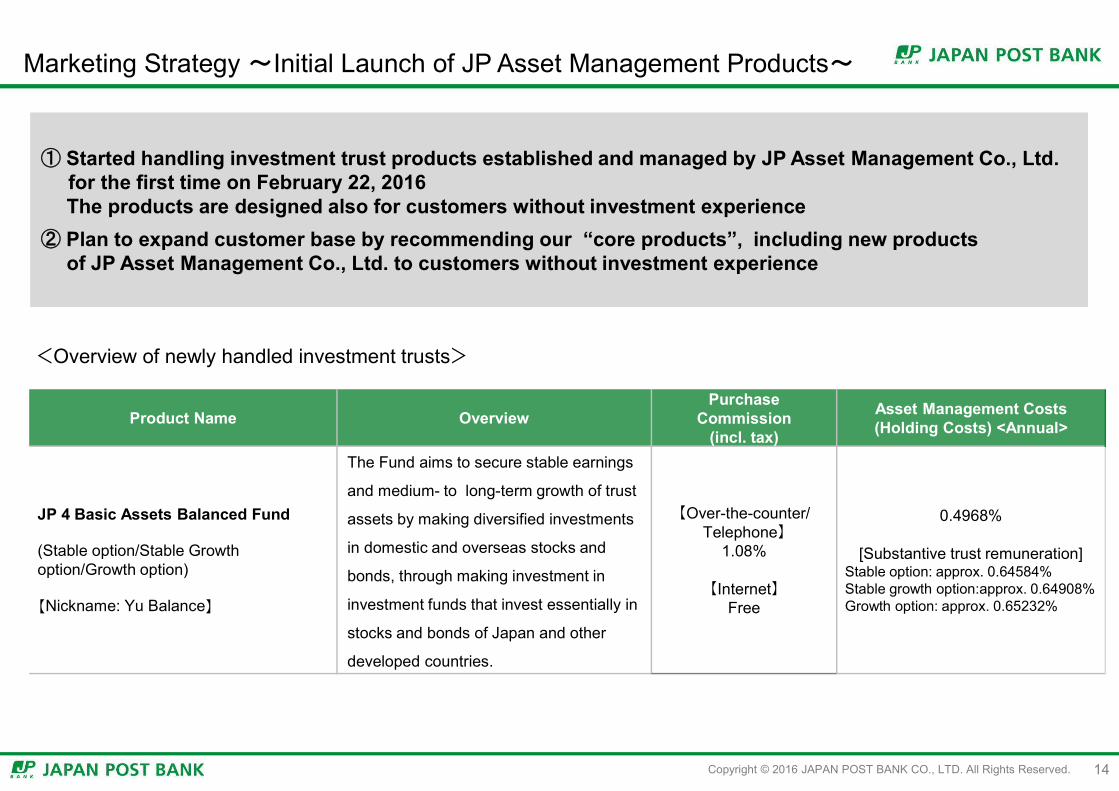
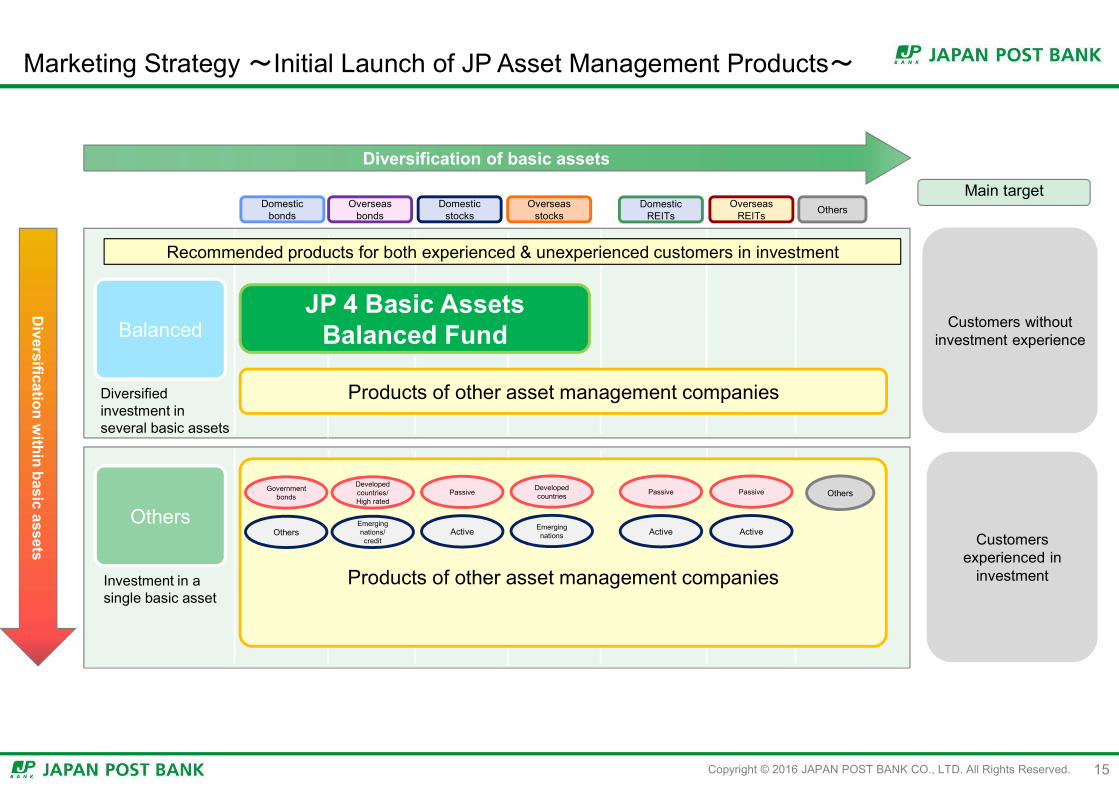
① Started handling investment trust products established and managed by JP Asset Management Co., Ltd. for the first time on February 22, 2016The products are designed also for customers without investment experience
② Plan to expand customer base by recommending our “core products”, including new products of JP Asset Management Co., Ltd. to customers without investment experience
Product Name OverviewPurchase
Commission (incl. tax)
Asset Management Costs(Holding Costs) <Annual>
JP 4 Basic Assets Balanced Fund
(Stable option/Stable Growth option/Growth option)
【Nickname: Yu Balance】
The Fund aims to secure stable earnings
and medium- to long-term growth of trust
assets by making diversified investments
in domestic and overseas stocks and
bonds, through making investment in
investment funds that invest essentially in
stocks and bonds of Japan and other
developed countries.
【Over-the-counter/Telephone】
1.08%
【Internet】Free
0.4968%
[Substantive trust remuneration]Stable option: approx. 0.64584%Stable growth option:approx. 0.64908%Growth option: approx. 0.65232%
<Overview of newly handled investment trusts>
14
Marketing Strategy ~Initial Launch of JP Asset Management Products~
Copyright © 2016 JAPAN POST BANK CO., LTD. All Rights Reserved.
Customers experienced in
investmentProducts of other asset management companies
Customers without investment experience
Main target
Diversification of basic assets
Domestic bonds
Overseas bonds
Overseas REITs
Domestic stocks Others
Balanced
Diversified investment in several basic assets
Diversification w
ithin basic assets
Overseas stocks
Others
Investment in a single basic asset
Government bonds
Others
Developed countries/High rated
Emerging nations/credit
Passive
Active
Developed countries
Emerging nations
Passive
Active
Passive
Active
Others
Recommended products for both experienced & unexperienced customers in investment
Products of other asset management companies
JP 4 Basic Assets Balanced Fund
Domestic REITs
15
Marketing Strategy ~Initial Launch of JP Asset Management Products~
Copyright © 2016 JAPAN POST BANK CO., LTD. All Rights Reserved.
Marketing Strategy ~ Increase in Fees and Commissions (2)~
16
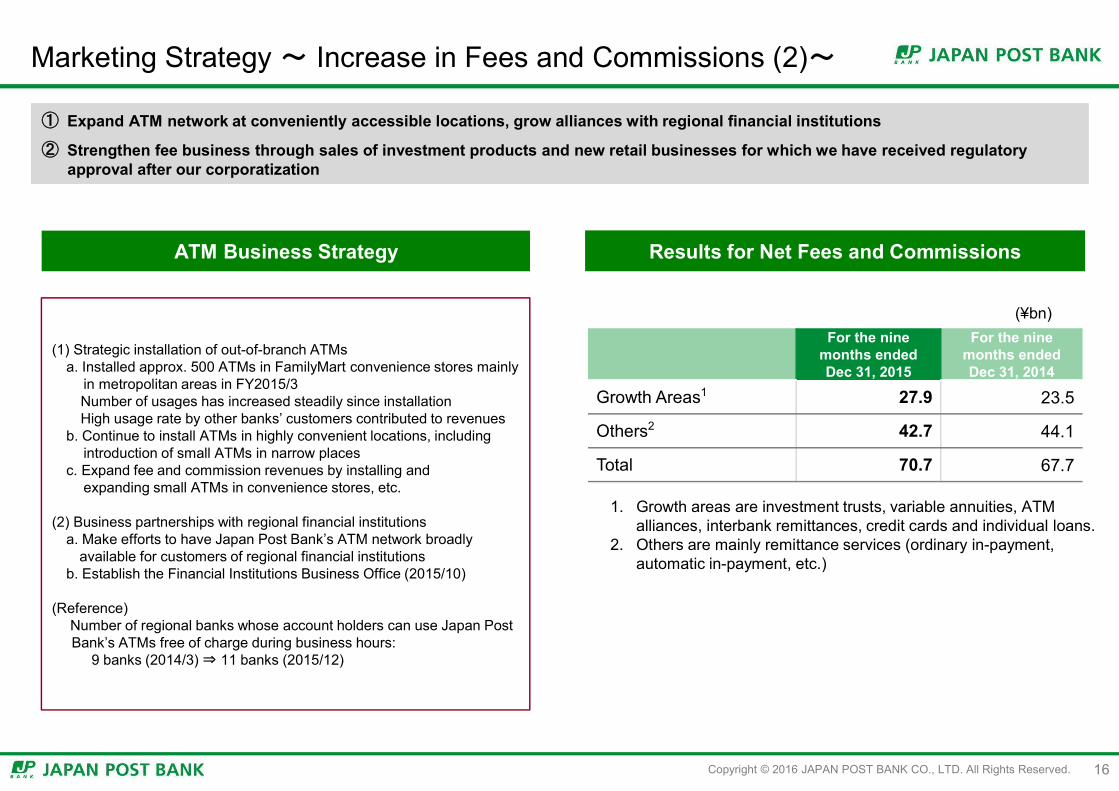
① Expand ATM network at conveniently accessible locations, grow alliances with regional financial institutions
② Strengthen fee business through sales of investment products and new retail businesses for which we have received regulatory approval after our corporatization
ATM Business Strategy Results for Net Fees and Commissions
(¥bn)For the nine
months endedDec 31, 2015
For the nine months endedDec 31, 2014
Growth Areas1 27.9 23.5
Others2 42.7 44.1
Total 70.7 67.7
1. Growth areas are investment trusts, variable annuities, ATM alliances, interbank remittances, credit cards and individual loans.
2. Others are mainly remittance services (ordinary in-payment, automatic in-payment, etc.)
(1) Strategic installation of out-of-branch ATMsa. Installed approx. 500 ATMs in FamilyMart convenience stores mainly
in metropolitan areas in FY2015/3Number of usages has increased steadily since installationHigh usage rate by other banks’ customers contributed to revenues
b. Continue to install ATMs in highly convenient locations, includingintroduction of small ATMs in narrow places
c. Expand fee and commission revenues by installing andexpanding small ATMs in convenience stores, etc.
(2) Business partnerships with regional financial institutionsa. Make efforts to have Japan Post Bank’s ATM network broadly
available for customers of regional financial institutionsb. Establish the Financial Institutions Business Office (2015/10)
(Reference)Number of regional banks whose account holders can use Japan PostBank’s ATMs free of charge during business hours:
9 banks (2014/3) ⇒ 11 banks (2015/12)
Copyright © 2016 JAPAN POST BANK CO., LTD. All Rights Reserved.
Development of Strong Management System ~Cost Reduction~
17
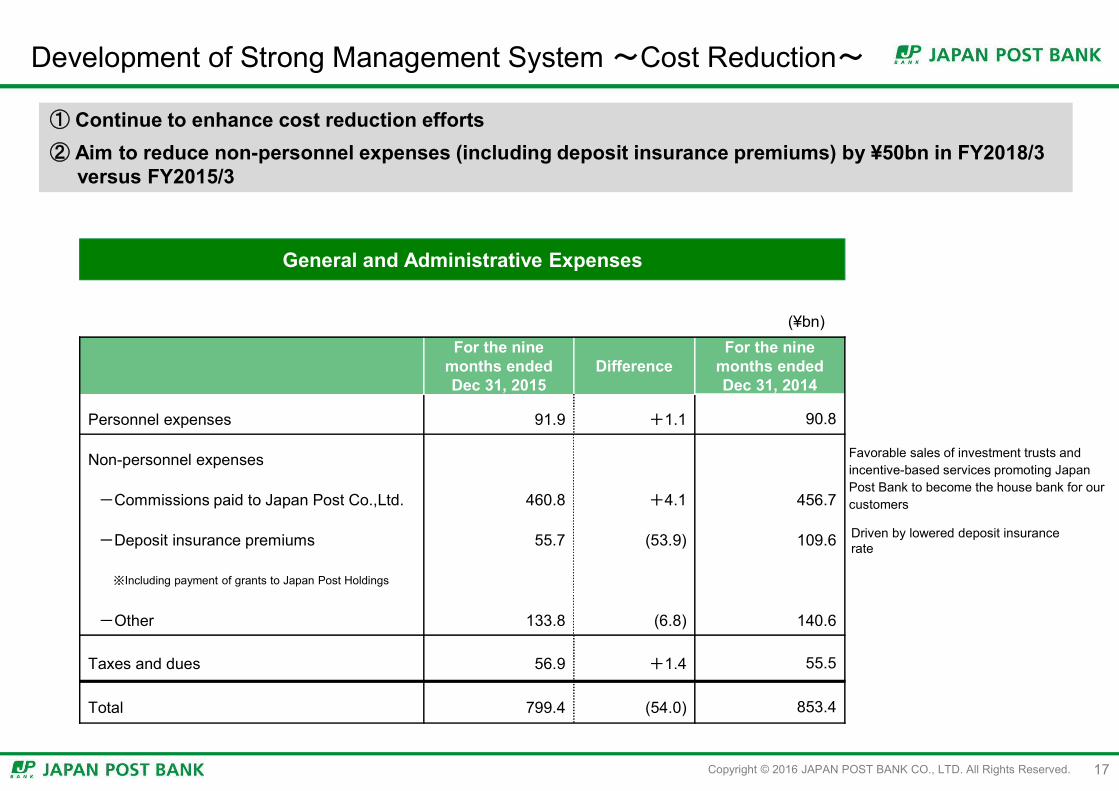
① Continue to enhance cost reduction efforts② Aim to reduce non-personnel expenses (including deposit insurance premiums) by ¥50bn in FY2018/3
versus FY2015/3
General and Administrative Expenses
For the nine months endedDec 31, 2015
DifferenceFor the nine
months endedDec 31, 2014
Personnel expenses 91.9 +1.1 90.8
Non-personnel expenses
-Commissions paid to Japan Post Co.,Ltd.
-Deposit insurance premiums
※Including payment of grants to Japan Post Holdings
-Other
460.8
55.7
133.8
+4.1
(53.9)
(6.8)
456.7
109.6
140.6
Taxes and dues 56.9 +1.4 55.5
Total 799.4 (54.0) 853.4
(¥bn)
Favorable sales of investment trusts andincentive-based services promoting JapanPost Bank to become the house bank for ourcustomers
Driven by lowered deposit insurance rate
Copyright © 2016 JAPAN POST BANK CO., LTD. All Rights Reserved. 18
3. Overview of FY2016/3 3Q (Apr-Dec) Results
Copyright © 2016 JAPAN POST BANK CO., LTD. All Rights Reserved.
Overview of FY2016/3 3Q (Apr-Dec) Results
19
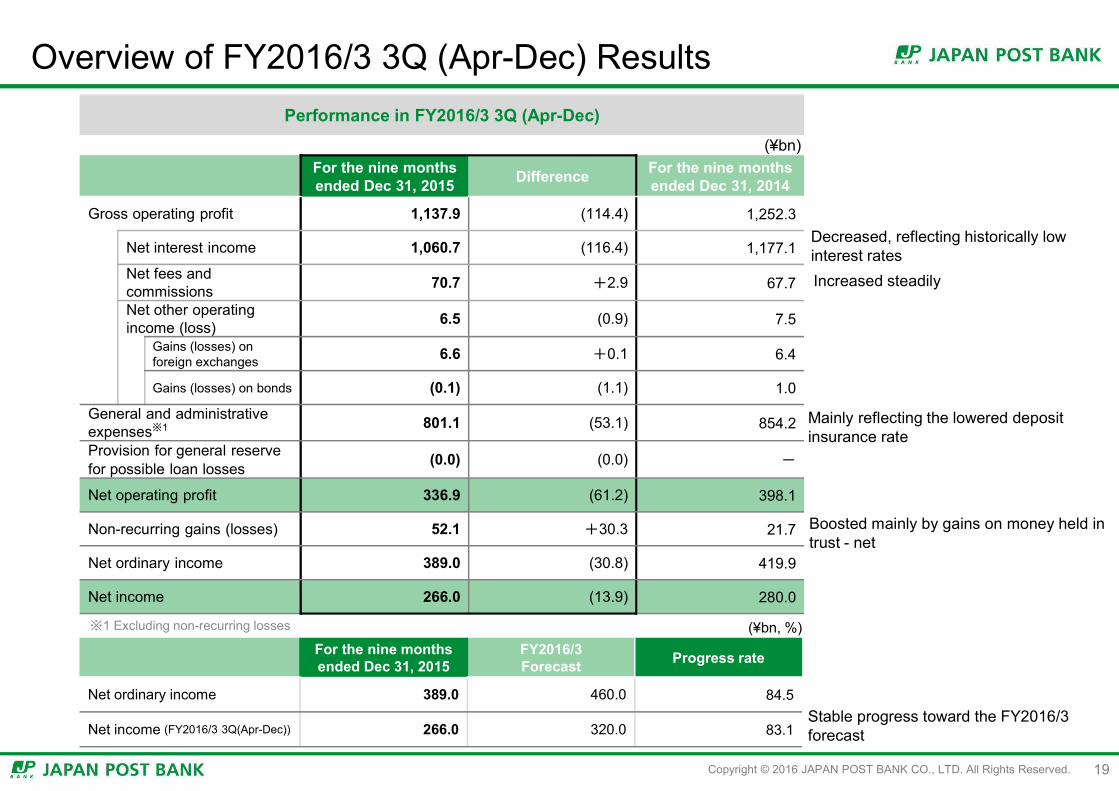
Performance in FY2016/3 3Q (Apr-Dec)
For the nine months ended Dec 31, 2015 Difference For the nine months
ended Dec 31, 2014
Gross operating profit 1,137.9 (114.4) 1,252.3
Net interest income 1,060.7 (116.4) 1,177.1
Net fees and commissions 70.7 +2.9 67.7
Net other operating income (loss) 6.5 (0.9) 7.5
Gains (losses) on foreign exchanges 6.6 +0.1 6.4
Gains (losses) on bonds (0.1) (1.1) 1.0
General and administrative expenses※1 801.1 (53.1) 854.2
Provision for general reserve for possible loan losses (0.0) (0.0) -
Net operating profit 336.9 (61.2) 398.1
Non-recurring gains (losses) 52.1 +30.3 21.7
Net ordinary income 389.0 (30.8) 419.9
Net income 266.0 (13.9) 280.0
(¥bn)
※1 Excluding non-recurring losses
。 For the nine months ended Dec 31, 2015
FY2016/3Forecast Progress rate
Net ordinary income 389.0 460.0 84.5
Net income (FY2016/3 3Q(Apr-Dec)) 266.0 320.0 83.1
(¥bn, %)
Decreased, reflecting historically low interest ratesIncreased steadily
Mainly reflecting the lowered deposit insurance rate
Stable progress toward the FY2016/3 forecast
Boosted mainly by gains on money held in trust - net
Copyright © 2016 JAPAN POST BANK CO., LTD. All Rights Reserved.
Condensed Balance Sheet
20
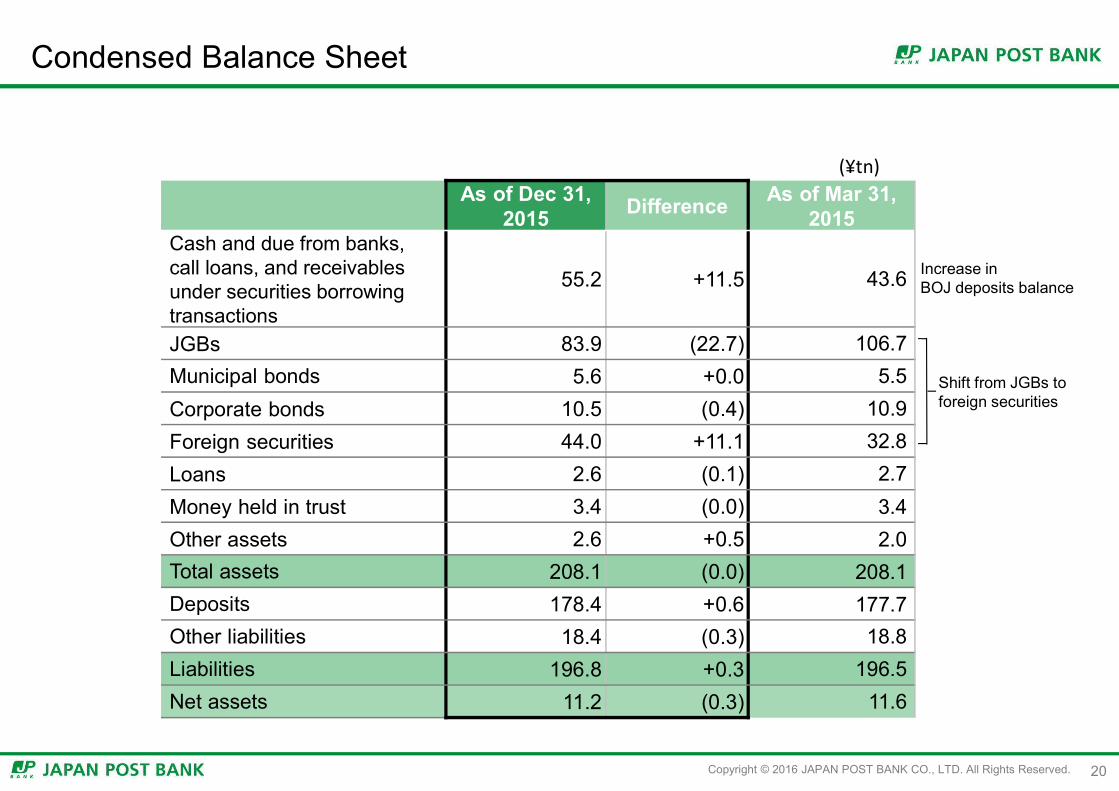
As of Dec 31, 2015 Difference As of Mar 31,
2015Cash and due from banks,call loans, and receivablesunder securities borrowingtransactions
55.2 +11.5 43.6
JGBs 83.9 (22.7) 106.7Municipal bonds 5.6 +0.0 5.5Corporate bonds 10.5 (0.4) 10.9Foreign securities 44.0 +11.1 32.8Loans 2.6 (0.1) 2.7Money held in trust 3.4 (0.0) 3.4Other assets 2.6 +0.5 2.0Total assets 208.1 (0.0) 208.1Deposits 178.4 +0.6 177.7Other liabilities 18.4 (0.3) 18.8Liabilities 196.8 +0.3 196.5Net assets 11.2 (0.3) 11.6
(¥tn)
Increase in BOJ deposits balance
Shift from JGBs toforeign securities
Copyright © 2016 JAPAN POST BANK CO., LTD. All Rights Reserved.
Management Indicators (1)
21
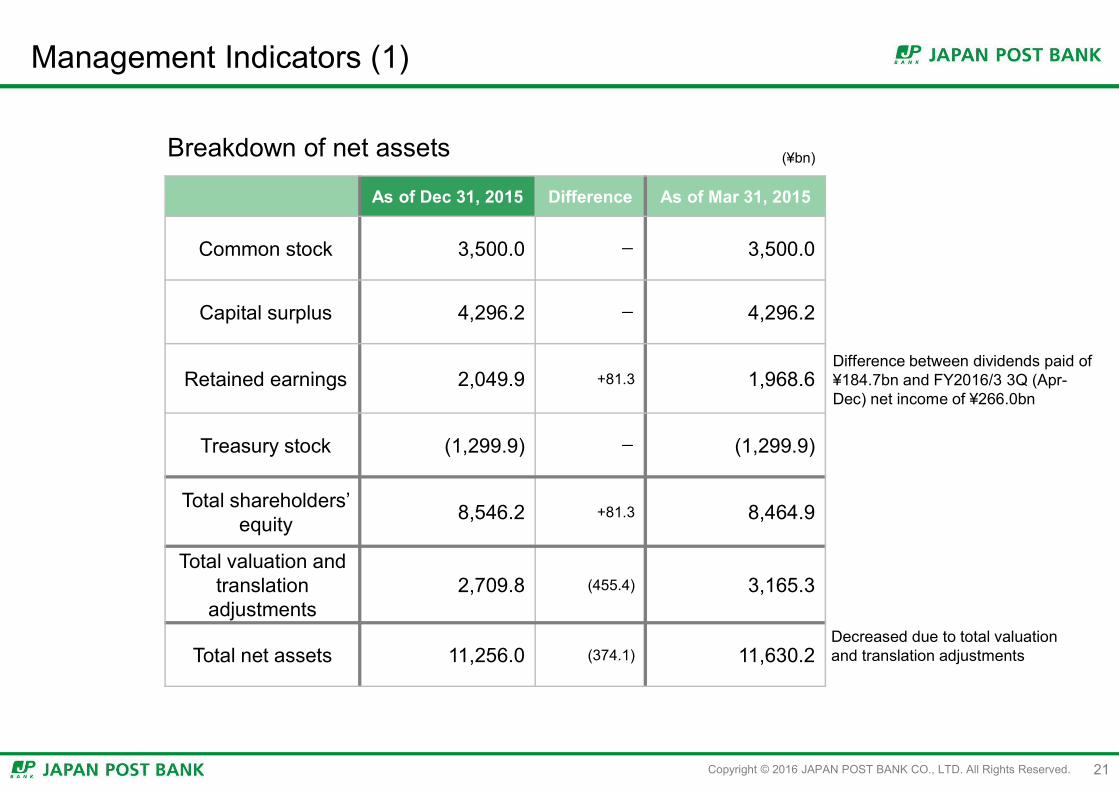
As of Dec 31, 2015 Difference As of Mar 31, 2015
Common stock 3,500.0 - 3,500.0
Capital surplus 4,296.2 - 4,296.2
Retained earnings 2,049.9 +81.3 1,968.6
Treasury stock (1,299.9) - (1,299.9)
Total shareholders’ equity 8,546.2 +81.3 8,464.9
Total valuation and translation
adjustments2,709.8 (455.4) 3,165.3
Total net assets 11,256.0 (374.1) 11,630.2
Breakdown of net assets
Decreased due to total valuationand translation adjustments
Difference between dividends paid of ¥184.7bn and FY2016/3 3Q (Apr-Dec) net income of ¥266.0bn
(¥bn)

Copyright © 2016 JAPAN POST BANK CO., LTD. All Rights Reserved.
Yield on interest-earning assets (annualized)
0.88% (0.07) 0.95%2
Net interest margin (annualized) 0.69% (0.07) 0.76%2
Yield on interest-earning assets 0.88% 0.95%2
Interest rate on interest-bearing liabilities 0.19% 0.18%2
Management Indicators (2)
22
1 Core Capital/Total assets (as reported on B/S)2 FY2015/3
Increased despite the decrease in G&A expenses due to YoY decrease in gross operating profit
Reflects the redemption and replacementof high-yield assets invested in the pastto lower yield assets
Declined due to increase in foreign credit investment
(¥bn)
As of Dec 31, 2015 Difference(%pt) As of Mar 31, 2015
Capital adequacy ratio (Domestic standards) 27.93% (10.48) 38.42%
Total capital 8,540.5 8,274.0Total risk weighted assets 30,571.2 21,533.4
Leverage ratio (trial basis)1 4.10% +0.12 3.97%Core capital 8,540.5 8,274.0Total assets 208,149.0 208,179.3
ROE (annualized) 3.08% (0.11) 3.20%2
Net income (FY2016/3 3Q (Apr-Dec)) 266.0 369.42
Average of the beginning and ending balances of net assets 11,443.1 11,542.9
OHR 70.39% +2.20 68.19%2
General and administrative expenses 801.1 1,114.72
Gross operating profit 1,137.9 1,634.72
Copyright © 2016 JAPAN POST BANK CO., LTD. All Rights Reserved. 23
Our Goal
Super Regional & Super Global
Copyright © 2016 JAPAN POST BANK CO., LTD. All Rights Reserved. 24
Appendix
Copyright © 2016 JAPAN POST BANK CO., LTD. All Rights Reserved.
FY2011/3 FY2012/3 FY2013/3 FY2014/3 FY2015/3 FY2015/3 3Q(Apr-Dec)
FY2016/3 3Q(Apr-Dec)
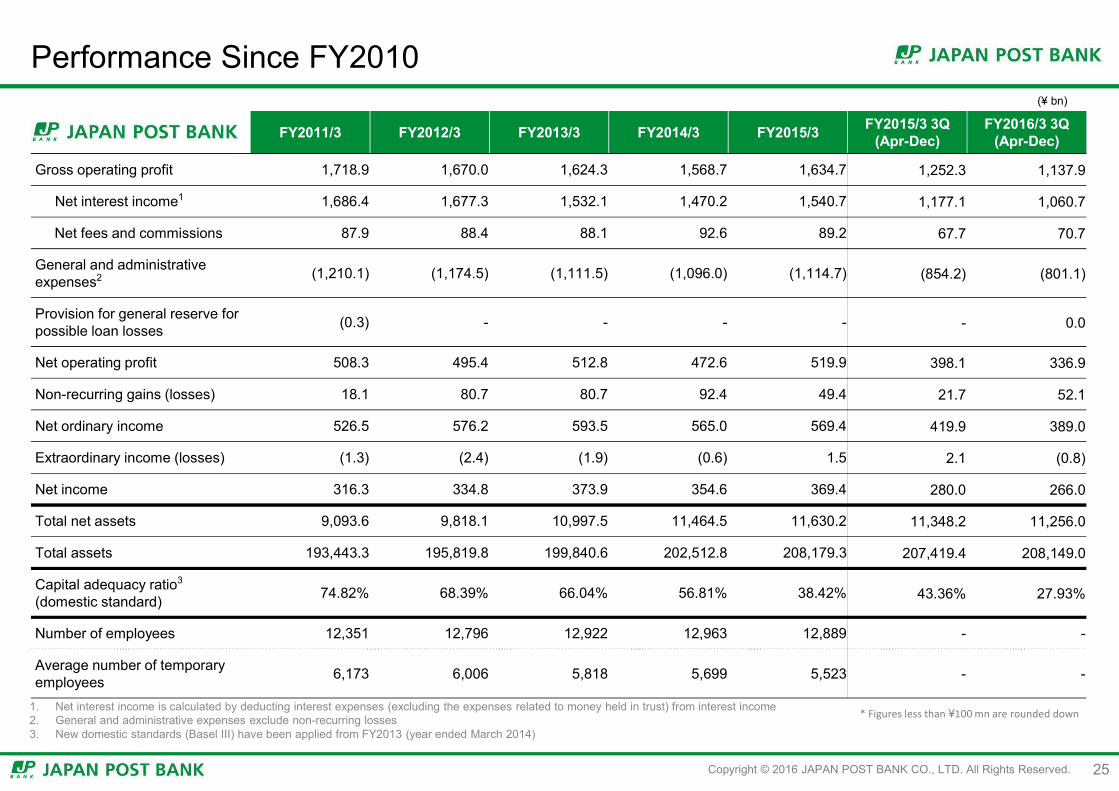
Gross operating profit 1,718.9 1,670.0 1,624.3 1,568.7 1,634.7 1,252.3 1,137.9
Net interest income1 1,686.4 1,677.3 1,532.1 1,470.2 1,540.7 1,177.1 1,060.7
Net fees and commissions 87.9 88.4 88.1 92.6 89.2 67.7 70.7
General and administrative expenses2 (1,210.1) (1,174.5) (1,111.5) (1,096.0) (1,114.7) (854.2) (801.1)
Provision for general reserve for possible loan losses (0.3) - - - - - 0.0
Net operating profit 508.3 495.4 512.8 472.6 519.9 398.1 336.9
Non-recurring gains (losses) 18.1 80.7 80.7 92.4 49.4 21.7 52.1
Net ordinary income 526.5 576.2 593.5 565.0 569.4 419.9 389.0
Extraordinary income (losses) (1.3) (2.4) (1.9) (0.6) 1.5 2.1 (0.8)
Net income 316.3 334.8 373.9 354.6 369.4 280.0 266.0
Total net assets 9,093.6 9,818.1 10,997.5 11,464.5 11,630.2 11,348.2 11,256.0
Total assets 193,443.3 195,819.8 199,840.6 202,512.8 208,179.3 207,419.4 208,149.0
Capital adequacy ratio3
(domestic standard) 74.82% 68.39% 66.04% 56.81% 38.42% 43.36% 27.93%
Number of employees 12,351 12,796 12,922 12,963 12,889 - -
Average number of temporary employees 6,173 6,006 5,818 5,699 5,523 - -
Performance Since FY2010
1. Net interest income is calculated by deducting interest expenses (excluding the expenses related to money held in trust) from interest income2. General and administrative expenses exclude non-recurring losses3. New domestic standards (Basel III) have been applied from FY2013 (year ended March 2014)
(¥ bn)
* Figures less than ¥100 mn are rounded down
25
Copyright © 2016 JAPAN POST BANK CO., LTD. All Rights Reserved. 26
<Disclaimer>
The forward-looking statements, including the forecasts and targets of Japan Post Bank Co., Ltd. (the “Bank”) , in these materials are based on information available and assumptions that the Bank has deemed to be reasonable. Actual business results may differ materially from those described in these materials due to a variety of factors including changes in interest rates and exchange rates, general market and economic conditions and other factors.