Embed Size (px)
Citation preview
DAIRYBASE ANALYSIS OF ORGANIC
DAIRY FARM PERFORMANCE
Dhananjay Apparao
Nicola Shadbolt
Institute for Food Nutrition and Human Health
Massey University
Esther Dijkstra
EcoAgriLogic for Organic Dairy and Pastoral Group

2 Grow Organic Dairy – DairyBase Analysis of Organic Dairy Farm Performance
TABLE OF CONTENTS
Introduction ............................................................................................................................................4
Physical Performance Analysis................................................................................................................6
Summary .............................................................................................................................................6
1. Milking Area ....................................................................................................................................9
2. Peak Cows Milked .........................................................................................................................10
3. Stocking Rate.................................................................................................................................12
4. Milk solids per Hectare .................................................................................................................15
5. Milk-Solids per Cow ......................................................................................................................17
6. 10 Day Peak Milk-Solids production per Cow ...............................................................................19
7. Average Milk-Solids production per Cow per Day ........................................................................21
8. Days in Milk per Cow.....................................................................................................................23
9. Pasture and Crop Eaten ................................................................................................................25
10. Total Feed Eaten .........................................................................................................................27
11. Feed Conversion Efficiency of Total Feed eaten.........................................................................30
12. Percent of Farm Harvested for Hay & Silage ..............................................................................32
13. Nitrogen Applied.........................................................................................................................34
14. Cows per Labour unit ..................................................................................................................36
15 Milk Solids per Labour unit ..........................................................................................................38
16. Average Bulk Somatic Cell Count (SCC).......................................................................................40
17.0 Lameness & Mastitis .................................................................................................................42
18. Empty Rate..................................................................................................................................44
19. Submission Rate (3 weeks) and In-calf rate (6 weeks)................................................................46
20. Calving Distribution.....................................................................................................................49
Financial Analysis ..................................................................................................................................53
Summary ...........................................................................................................................................53
1.0 Liquidity.......................................................................................................................................57
1A: The 2010-11 Season Assessment............................................................................................57
1B: A Farm-wise Assessment ........................................................................................................59
1C: A Year-wise Assessment .........................................................................................................60

3 Grow Organic Dairy – DairyBase Analysis of Organic Dairy Farm Performance
2.0 Profitability..................................................................................................................................63
2A: The 2010-11 Season Assessment............................................................................................63
2B: Farm-wise Assessment ...........................................................................................................68
2C: Year-wise Assessment.............................................................................................................74
3.0 Wealth.........................................................................................................................................78
3A: The 2010-11 Season Assessment............................................................................................78
3B: Farm-wise Assessment ...........................................................................................................80
3C: Year-wise Assessment.............................................................................................................82

4 Grow Organic Dairy – DairyBase Analysis of Organic Dairy Farm Performance
Introduction
The Grow Organic Dairy project identified and researched successful organic management
practices with the aim to lift productivity across the organic dairy sector and stimulate more
farmers to certified organic dairy production.
The project covered a 4 year period, and started in 2008. The Grow Organic Dairy project
was an initiative by the Organic Dairy and Pastoral Group and Massey University with
funding from Sustainable Farming Fund and DairyNZ.
This project brought a multi-disciplinary team together, consisting of leading organic dairy
farmers and scientists from Massey University. Collectively, the team determined the
research direction of the project, using experiential science methodology.
Nine organic dairy farms participated in the project. These farms were located across the
Waikato (6 farms), Taranaki (2 farms) and Manawatu (Massey Dairy Cattle Research Unit)
regions. All farms, selected for the Grow Organic Dairy project were certified organic, low-
input farms, comparable to system 1 and 2 farms.
The farms covered a range of soils and climate/rainfall and varied in size and stocking rate as
well as breeds: Friesian, Jersey and Crossbred.
During the first year, the Grow Organic Dairy project identified successful organic
management practices on each of the nine organic farms in four key areas: animal health,
pasture management, soils and soil fertility and farm management.
In subsequent years, a number of these successful management practices were quantified and
moved on from anecdotal evidence. The results of this research can be found on the website
of the Organic Dairy and Pastoral Group: www.organicpastoral.co.nz.
In the area of animal health, successful practices were identified and quantified in mastitis
management and rearing replacements without the use of worm drenches.
In the key area of soils, a series of field trials were conducted to research the trends in
nutrient status of soils on organic dairy farms and to identify products that will help organic
farmers increase soil nitrogen and phosphorus nutrition.
5 Grow Organic Dairy – DairyBase Analysis of Organic Dairy Farm Performance
DairyBase played an important role in the analysis of financial and physical performance of
the organic dairy farms in the Grow Organic Dairy project. Making farm data available to
the DairyBase database was a prerequisite for participating in the Grow Organic Dairy
project.
Organic farmers in general were not using DairyBase as a business tool. At the start of the
project in 2008, only one organic dairy farm of the nine selected for the Grow Organic Dairy
project was using DairyBase. During the course of the project DairyBase provided a
motivating factor for the farmers involved. As the participating organic farmers started
getting more in-depth figures, they rose to the challenge of trying to improve year after year.
It became a very healthy competitive environment. While the sample of farmers was
relatively small, the data provided enough information to make some general observations
about organic dairy farming.
This report analyses key measures and trends in physical and financial performance of the
nine organic dairy farms over 5 seasons, starting in 2006-07. It builds on analysis conducted
by two international student interns, Erica Bongers (Wageningen University, the Netherlands)
and Guillaume Lartigue (AgroParis Tech, France) under the supervision of Professor
Shadbolt. The physical performance analysis is presented first followed by the financial
performance with each section preceded by a summary of the main points of relevance.
6 Grow Organic Dairy – DairyBase Analysis of Organic Dairy Farm Performance
Physical Performance Analysis
Summary This report analyses the performance of farms participating in the GOD project for key
physical parameters from three different angles-
1) An Overall assessment of the 2010-11 season
2) A Farm-wise assessment across 5 years
3) A Year-wise assessment across farms
1. Overall assessment of 2010-11 season
In this analysis a comparison of physical performance of GOD project farms in 2010-11
season with the 5 year project average and also benchmark data for 2010-11 is made.
Additionally, the performance of each GOD project farm in 2010-11 is also presented and
comparisons amongst farms are made. The benchmark data for 2010-11 season was obtained
from Dairy Base and it consisted of the average physical performance of 47 comparable
conventional farms (North Island, Owner operator, Low input System 1 & 2 Farms).
There were 9 farms in the GOD project in 2010-11 and it appeared to be a reasonably good
season for most farms. Two farms (Farm 1 & 5) were larger in size than comparable
conventional farms (Benchmark). Yet the peak cows milked on all GOD project farms was
significantly less than the benchmark. The amount of pasture and crop grown was average,
but the amount of total feed supplied was highest in 2010-11. But it was still much lesser
than the benchmark. Though there was a drop in peak cow numbers and stocking rate, milk
solids/ha production was greater than that in 2009-10. Importantly the milk solids
production/ha of one of the farms (Farm 3) was greater than that of the benchmark.
Additionally, milk solids production /cow and average milk solids production per cow/day
was at its 5 year highest in 2010-11. However, average bulk SCC and empty rates were the
worst in 2010-11. Also labour intensity (cows/labour unit) was the lowest in 2010-11. Only
four farms applied nitrogen onto their pastures in 2010-11. Between farms, there was
considerable variation for most parameters in 2010-11. On the whole Farm 3 was the
appeared to be the best performing farm for most physical parameters in 2010-11; and

7 Grow Organic Dairy – DairyBase Analysis of Organic Dairy Farm Performance
importantly, the benchmark outperformed the GOD project farms for most the physical
parameters.
2. Farm-wise assessment across 5 years
A comparison of the average performance of each farm over the 5 year project duration is
presented in this dimension of the analysis. Most farms have been a part of the project for 5
years, but a couple have only been in the project for 4 years. For these two farms only 4 year
averages were calculated. Although Farm 2 is no longer participating in the project, the
average data from the three seasons it was part of project is presented. A 5 year benchmark
average is also presented as a point of reference/comparison.
Over the 5 year period there were considerable differences between farms for most physical
parameters. Although stocking rates were decreasing across farms, there were still clear
differences between farms. Importantly the Farm 3 and Farm 7 had higher average stocking
rates than the benchmark. Interestingly the farm with highest average stocking rate also had
the best average feed conversion efficiency. Another notable feature was the variation in
cows/labour unit between farms. Some farms had more than twice the number of cows/labour
unit than others. Almost all GOD project Farms had critical issues relating to (herd) fertility
and milk quality that needs addressing. Overall Farm 3, 4 and 7 were the best performing
farms. Farm 3 in particular, outperformed the benchmark for several key physical parameters.
Except for Farm 3, the benchmark’s performance was better than that of the GOD project
farms.
3. Year-wise assessment across farms
A comparison of the average performance of each GOD project year is presented in this
analysis. In 2010-11 and 2009-10, data from 9 farms was used in the calculation of averages
because farm 2 was not a part of the study. For 2008-09 and 2009-10 data from all 10 farms
in the project was used, while in 2006-07 only data from the 8 participating farms was used in
calculation of yearly averages.
Year on year differences for the GOD project were not as significant/substantial as
differences between farms. Apart from 2007-08 season, the general performance for each
season has been acceptable. Overall 2006-07 was the best season while 2007-08 was the
worst. During the 5 year period none of the farms have expanded and farm sizes have
remained more or less constant. However, farms have decreased their stocking rate which has

8 Grow Organic Dairy – DairyBase Analysis of Organic Dairy Farm Performance
resulted in a drop in herd sizes. This in turn has resulted in a reduction in milk solids
production per hectare but increase in milk solids production per cow over the years. Over the
5 year period amount of pasture and crop eaten has decreased while the amount of total feed
eaten has increased. This suggests that organic farms are feeding greater amounts of
supplements each year. The average bulk SCC showed a year on year decrease until 2009-10
season, but in 2010-11 it increase considerably. Empty rates have been steadily increasing
over the 5 years, indicating that fertility of cows is reducing.
A comparison of the yearly GOD project average was also made with corresponding
benchmark yearly averages. The benchmark data was obtained from dairy base and
comprised of comparable conventional farms (North Island, Owner operator, Low input
System 1 & 2 Farms). The sample size of the benchmark varied from year to year. It was
least in 2006-07 (n=39 farms) and highest in 2009-10 (n=64 farms). For almost all of the
physical parameters studied, the benchmark (comparable conventional farms) outperformed
the GOD project.

9 Grow Organic Dairy – DairyBase Analysis of Organic Dairy Farm Performance
1. Milking Area
Figure 1.1: Milking area – Overall assessment of 2010-11 season
The average size of the milking area for the GOD project was 76.6 ha in the 2010-11 season.
This is considerably lower than the benchmark (112.3 ha). It is also slightly lower than the 5
year average (79.2 ha) for the project. This is due to the exclusion of Farm 2 (132 ha) from
the study since 2009-10. Farm 5 was the largest (123 ha) while the Massey Farm (20.14 ha)
was the smallest in 2010-11 (Figure 1.1).
Figure 1.2: Milking area – Farm-wise assessment across 5 years
The 5 year average milking area of the GOD project (80.5 ha) was smaller than the
benchmark average (108.5 ha). Perhaps suggesting that organic farms tend be of smaller size
than comparable conventional farms. Over the 5 years, the Massey Farm (20.2 ha) followed

10 Grow Organic Dairy – DairyBase Analysis of Organic Dairy Farm Performance
by Farm 3 (58.2 ha) had the smallest average, while Farm 5 (121.6 ha) had the largest
average (Figure 1.2). Farm 2, which had an average milking area of 132 ha is no longer
participating in the project.
Figure 1.3: Milking area – Year-wise assessment across farms
There has not been much year on year variation in the size of the GOD project farms. Farms
were neither expanding, nor were they shrinking. The highest average milking area was 91 ha
in 2006-07 and the lowest was 75 ha in 2009-10 (Figure 1.3). The decrease in milk area is
mainly attributed to the exclusion of Farm 2 (132 ha) from the study since 2009-10. The
average size of benchmark farms has also not shown much variation over the 5 year period. It
was highest in 2010-11 (112.3 ha) and lowest in 2008-09 (100.9 ha). But for each of the 5
years, the average size of the benchmark farms was greater than that of GOD project (Figure
1.3).
2. Peak Cows Milked
The average number of peak cows milked in 2010-11 was 174. Once again this is
considerably less than the benchmark (339). It is also lesser than the 5 year average for all
farms (193). This too can be attributed to the exclusion of Farm 2 (289 cows) from the study
in 2010-11. Farm 1 milked the highest number of cows at peak (279), while the Massey Farm
milked the least (45) in 2010-11 (Figure 2.1).

11 Grow Organic Dairy – DairyBase Analysis of Organic Dairy Farm Performance
Figure 2.1: Peak Cows milked - Overall assessment of 2010-11 season
Figure 2.2: Peak Cows milked – Farm-wise assessment across 5 years
The five year average number of peak cows milked for the GOD project was 193. The
Massey Farm (46) followed by Farm 6 (137) had the lowest average, while Farm 1 (308) had
highest average (Figure 2.2). Across years, the average number of peak cows milked on the
benchmark farms (314 cows) was much higher than that of the GOD project. This is mainly
due to the larger farm size and higher stocking rates of the benchmark. An important
consequence of organic farms having a smaller farm and herd size is that they may not be
able to capture efficiencies that are associated with having (economies of) scale.

12 Grow Organic Dairy – DairyBase Analysis of Organic Dairy Farm Performance
Figure 2.3: Peak Cows milked- Year-wise assessment across farms
The average number of peak cows milked on GOD project farms was highest in 2006-07
(299 cows) and lowest in 2010-11 (174) (Figure 2.3). There appears to be a trend of year-on
year decrease in herd size (Figure 2.3). This is partly due to a reduction is stocking rates
while farm size remained more or less constant. Also, the exclusion of Farm 2 (275 cows in
2008-09) from the study has contributed towards the drop in average herd size, especially for
2009-10 and 2010-11 seasons. Importantly, the difference in average number of peak cows
milked between the GOD project and Benchmark has increased substantially from 2007-07
(difference of + 78 cows) to 2010-11 (difference of + 165 cows).
3. Stocking Rate
Figure 3.1: Stocking rate - Overall assessment of 2010-11 season
13 Grow Organic Dairy – DairyBase Analysis of Organic Dairy Farm Performance
The average stocking rate for the GOD project in 2010-11 was 2.29 cows/ha. This is lesser
than the benchmark (2.80 cows/ha) as well as the 5 year average for the GOD project (2.45
cows/ha). Farm 7 had the highest stocking rate (2.90 cows/ha), while Farm 5 has the lowest
(1.90 cows/ha) (Figure 3.1). The average stocking rate of the Massey Farm in 2010-11 was
2.23 cows/ha.
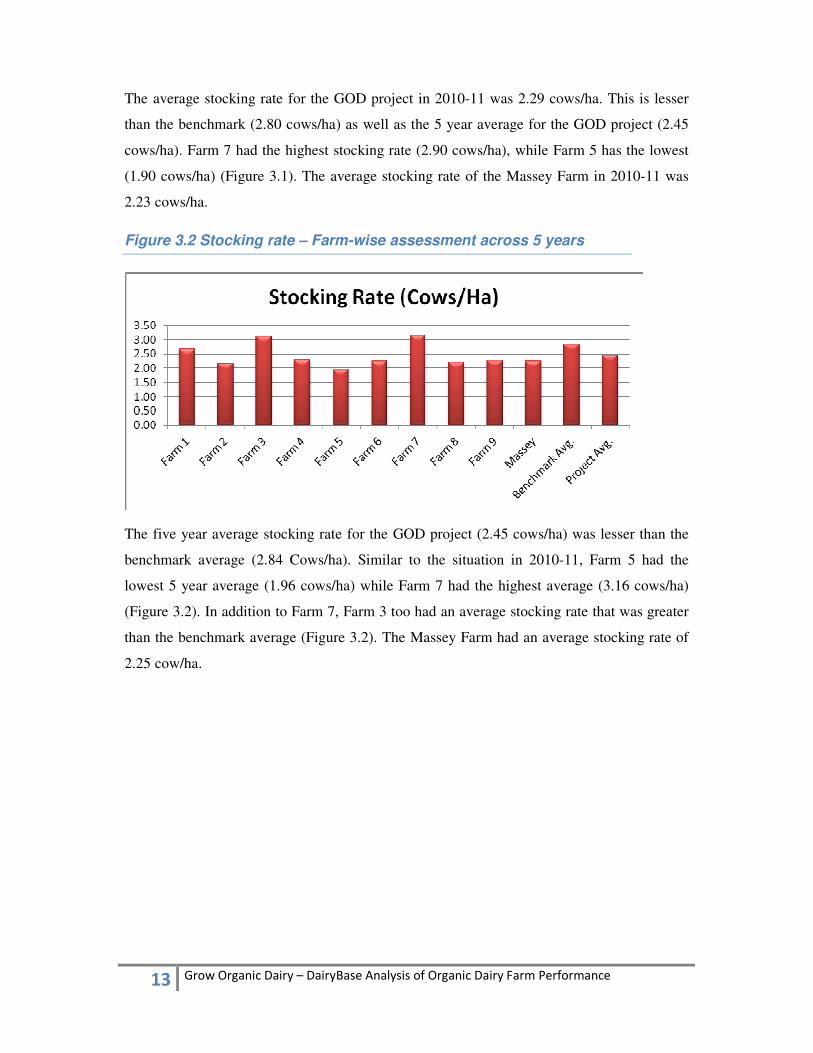
Figure 3.2 Stocking rate – Farm-wise assessment across 5 years
The five year average stocking rate for the GOD project (2.45 cows/ha) was lesser than the
benchmark average (2.84 Cows/ha). Similar to the situation in 2010-11, Farm 5 had the
lowest 5 year average (1.96 cows/ha) while Farm 7 had the highest average (3.16 cows/ha)
(Figure 3.2). In addition to Farm 7, Farm 3 too had an average stocking rate that was greater
than the benchmark average (Figure 3.2). The Massey Farm had an average stocking rate of
2.25 cow/ha.

14 Grow Organic Dairy – DairyBase Analysis of Organic Dairy Farm Performance
Figure 3.3 Stocking rate – Year-wise assessment across farms
The average stocking rate of the GOD project has also decreased over the 5 year period. It
was highest in 2006-07 (2.61 cows/ha) and lowest in 2010-11 (2.29 cows/ha) (Figure 3.3).
For each of the 5 years, the stocking rate of the benchmark was higher than that of the GOD
project. The difference was highest in 2010-11 (+ 0.51 cows/ha) and lowest in 2007-08 (+
0.08 cows/ha) (Figure 3.3). This perhaps suggests that organic farms tend to operate at lower
stocking rates that their conventional counterparts. Data also suggests that organic farms are
still in search of the optimum stocking rate for their system. Interestingly, average stock rates
for both the GOD project (2.45 cows/ha) and Benchmark (2.70 cows/ha) were identical in
2008-09 and 2009-10 (Figure 3.3).
There were significant differences in Stocking Rate between farms (F = 33.81, P < 0.05)
and also between years (F = 4.49, P < 0.05).

15 Grow Organic Dairy – DairyBase Analysis of Organic Dairy Farm Performance
4. Milk solids per Hectare
Figure 4.1 Milk solids/ha - Overall assessment of 2010-11 season
The average milk solids production per hectare for the GOD project was 725.6 kg in 2010-11.
This is much lower than the benchmark (868 kg) but only slightly lower than the 5 year
average (735.7 kg). Farm 3 had the highest (879 kg/ha) production, and was the only GOD
project farm to outperform the benchmark. In contrast Farm 5, which had the lowest
production (411 kg/ha) in 2010-11, produced less than half the milk solids/ha of the
benchmark (Figure 4.1). The Massey Farm recorded a production of 807 Kg/ha which (along
with Farm 4) was the third highest amongst the GOD project.
Figure 4.2: Milk-Solids/ha- Farm-wise assessment across 5 years
16 Grow Organic Dairy – DairyBase Analysis of Organic Dairy Farm Performance
The average milk solids production per hectare over the 5 year period for the GOD project
(735.7 Kg/ha) was considerably lower than the benchmark average (863.4 Kg/ha). Once
again, Farm 5 had the lowest average (474.8 Kg/ha) while Farm 3 had the highest average
(911.6 Kg/ha) (Figure 4.2). Importantly, Farm 3 and Farm 7 (866.2 Kg/ha) were two GOD
project farms that achieved an average MS/Ha production that was greater than the
benchmark. This is an important finding because it indicates that despite the farming
constraints, organic dairy farms are capable of outperforming their comparable conventional
counterparts. The 5 year average production of the Massey Farm (782 Kg/ha) was the 4th
highest amongst the GOD project.
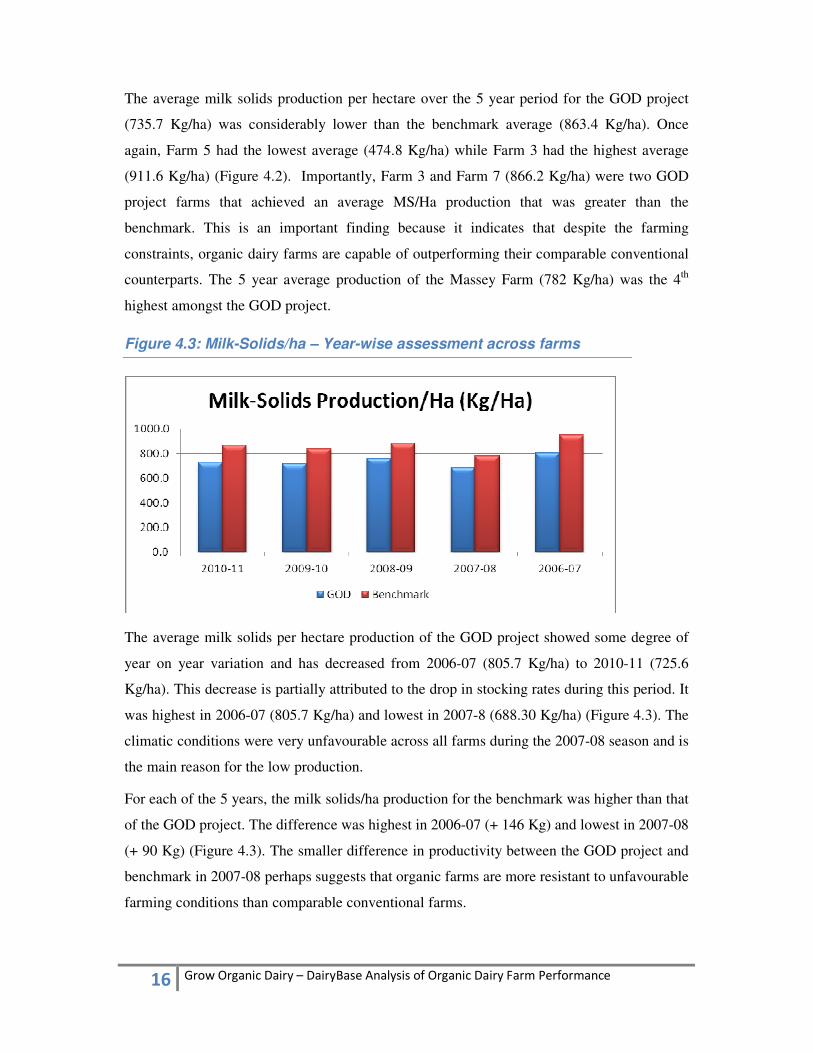
Figure 4.3: Milk-Solids/ha – Year-wise assessment across farms
The average milk solids per hectare production of the GOD project showed some degree of
year on year variation and has decreased from 2006-07 (805.7 Kg/ha) to 2010-11 (725.6
Kg/ha). This decrease is partially attributed to the drop in stocking rates during this period. It
was highest in 2006-07 (805.7 Kg/ha) and lowest in 2007-8 (688.30 Kg/ha) (Figure 4.3). The
climatic conditions were very unfavourable across all farms during the 2007-08 season and is
the main reason for the low production.
For each of the 5 years, the milk solids/ha production for the benchmark was higher than that
of the GOD project. The difference was highest in 2006-07 (+ 146 Kg) and lowest in 2007-08
(+ 90 Kg) (Figure 4.3). The smaller difference in productivity between the GOD project and
benchmark in 2007-08 perhaps suggests that organic farms are more resistant to unfavourable
farming conditions than comparable conventional farms.
17 Grow Organic Dairy – DairyBase Analysis of Organic Dairy Farm Performance
There were significant differences in milk solids/ha production between farms (F = 40.2,
P < 0.05) and also between years (F = 12.47, P < 0.05).
5. Milk-Solids per Cow
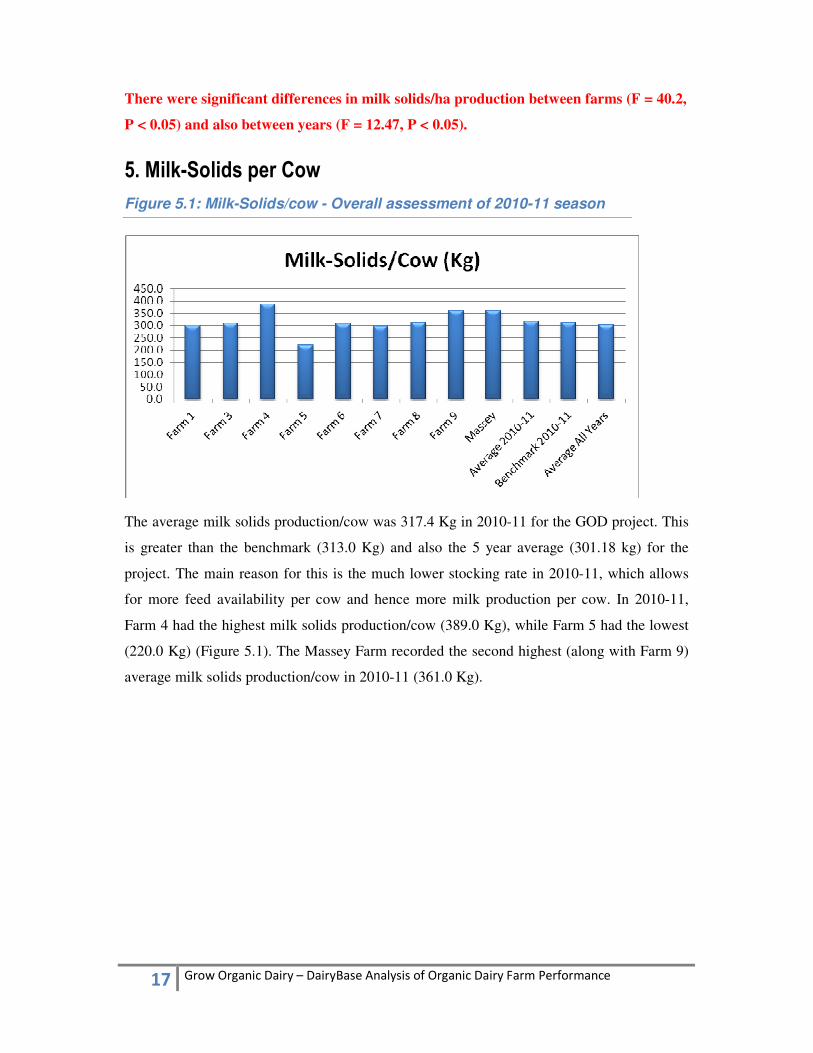
Figure 5.1: Milk-Solids/cow - Overall assessment of 2010-11 season
The average milk solids production/cow was 317.4 Kg in 2010-11 for the GOD project. This
is greater than the benchmark (313.0 Kg) and also the 5 year average (301.18 kg) for the
project. The main reason for this is the much lower stocking rate in 2010-11, which allows
for more feed availability per cow and hence more milk production per cow. In 2010-11,
Farm 4 had the highest milk solids production/cow (389.0 Kg), while Farm 5 had the lowest
(220.0 Kg) (Figure 5.1). The Massey Farm recorded the second highest (along with Farm 9)
average milk solids production/cow in 2010-11 (361.0 Kg).
18 Grow Organic Dairy – DairyBase Analysis of Organic Dairy Farm Performance
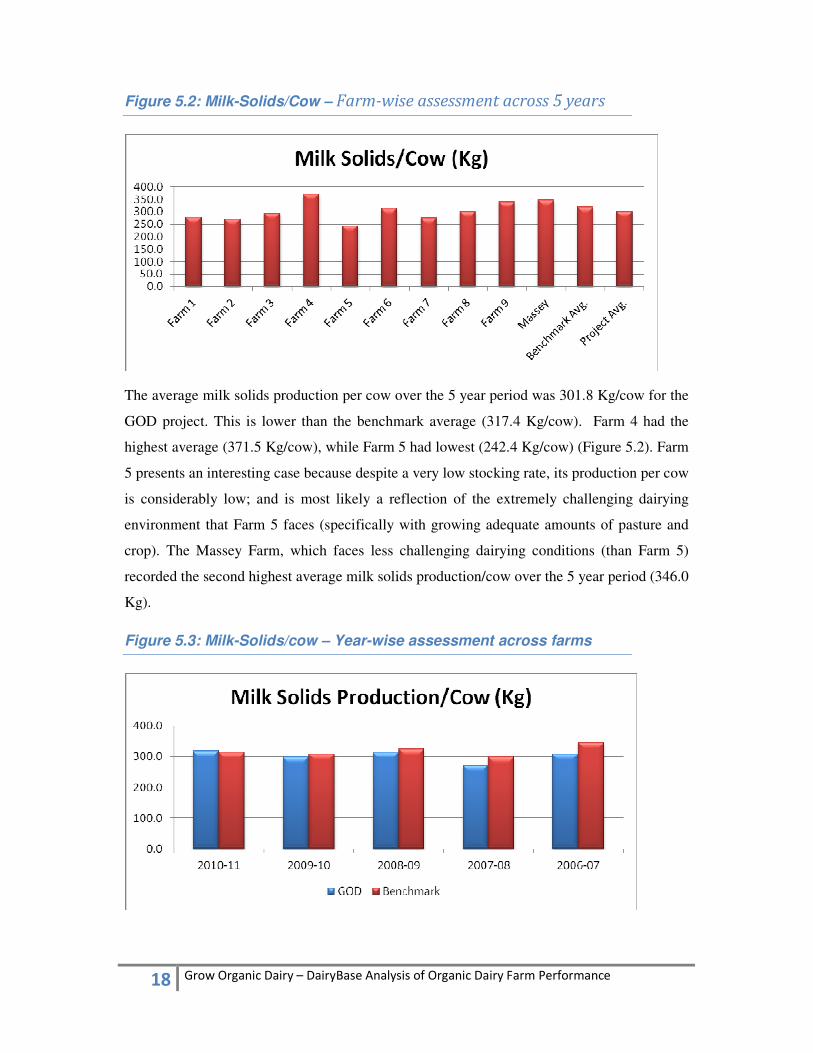
Figure 5.2: Milk-Solids/Cow – Farm-wise assessment across 5 years
The average milk solids production per cow over the 5 year period was 301.8 Kg/cow for the
GOD project. This is lower than the benchmark average (317.4 Kg/cow). Farm 4 had the
highest average (371.5 Kg/cow), while Farm 5 had lowest (242.4 Kg/cow) (Figure 5.2). Farm
5 presents an interesting case because despite a very low stocking rate, its production per cow
is considerably low; and is most likely a reflection of the extremely challenging dairying
environment that Farm 5 faces (specifically with growing adequate amounts of pasture and
crop). The Massey Farm, which faces less challenging dairying conditions (than Farm 5)
recorded the second highest average milk solids production/cow over the 5 year period (346.0
Kg).
Figure 5.3: Milk-Solids/cow – Year-wise assessment across farms
19 Grow Organic Dairy – DairyBase Analysis of Organic Dairy Farm Performance
The average year on year milk solids production per cow for the GOD project did not show
much variation. The highest milks solids production per cow was seen in 2010-11 (317.44
Kg) and lowest in 2007-08 (271.40 Kg) (Figure 5.3). This could be due to the decrease in
stocking rates in 2010-11 (which allows for more per cow feed availability) and unfavourable
farming conditions in 2007-08. Interestingly, although the benchmark had a higher stocking
rate than the GOD project, the milk solids production per cow was slightly greater than that
of the GOD project for 4 of the 5 years (Figure 5.3). The difference was highest in 2006-07
(+ 37 Kg) and lowest in 2010-11 (- 4 Kg).
Differences in milk solids production per cow between farms (F = 15.23, P < 0.05) and
also between years (F = 9.26, P < 0.05) were found to be significant.
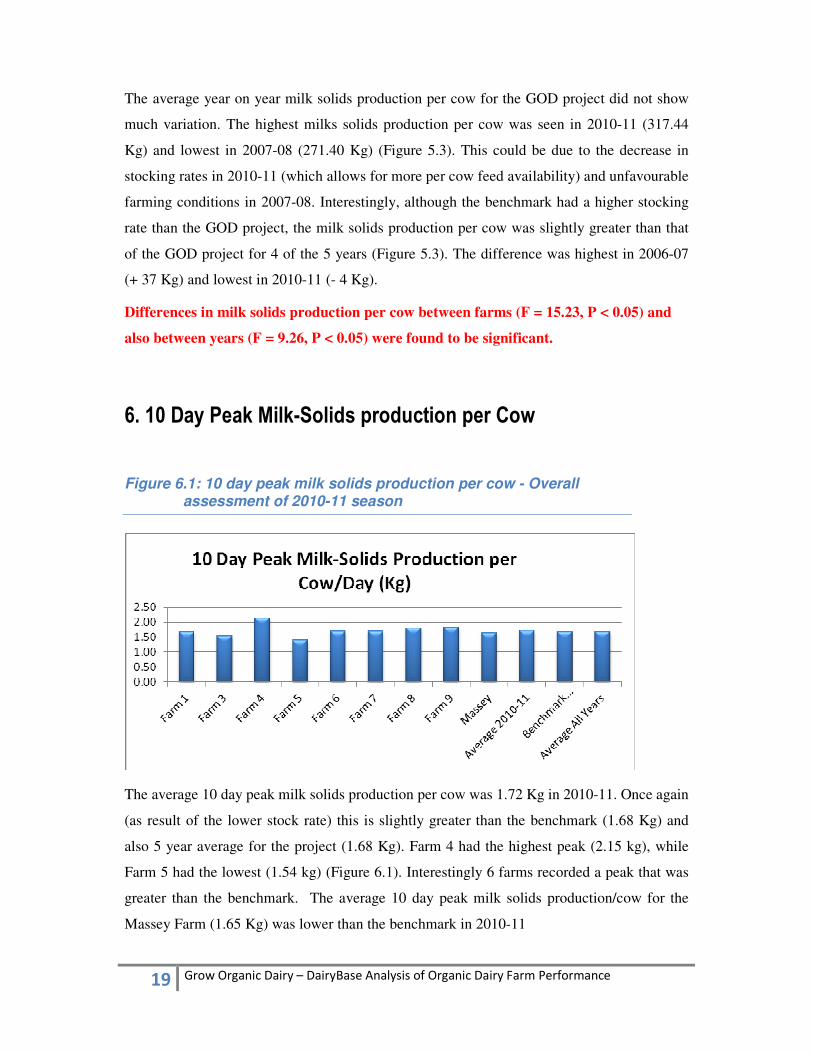
6. 10 Day Peak Milk-Solids production per Cow
Figure 6.1: 10 day peak milk solids production per cow - Overall assessment of 2010-11 season
The average 10 day peak milk solids production per cow was 1.72 Kg in 2010-11. Once again
(as result of the lower stock rate) this is slightly greater than the benchmark (1.68 Kg) and
also 5 year average for the project (1.68 Kg). Farm 4 had the highest peak (2.15 kg), while
Farm 5 had the lowest (1.54 kg) (Figure 6.1). Interestingly 6 farms recorded a peak that was
greater than the benchmark. The average 10 day peak milk solids production/cow for the
Massey Farm (1.65 Kg) was lower than the benchmark in 2010-11

20 Grow Organic Dairy – DairyBase Analysis of Organic Dairy Farm Performance
Figure 6.2: 10 day peak milk solids production per cow - Farm-wise
assessment across 5 years
The average 10 day peak milk solids production per cow per day over the 5 year project
period was 1.68 Kg for the GOD project. This is marginally lower than the benchmark
average (1.70 Kg). But 5 farms had a peak that was greater than the benchmark. Farm 4 had
the highest peak (2.19 Kg), while Farm 3 had the lowest (1.46 Kg) (Figure 6.2). The 5 year
average peak milk solids production per cow/day for the Massey Farm was 1.71 Kg.
Figure 6.3: 10 day peak milk solids production per cow - Year-wise assessment across farms
The average 10 day peak milk solids production for the GOD project showed some degree of
year on year differences. It appears that an increase in one year is followed by a decrease in
the next. The highest 10 day peak MS production per cow was seen in 2010-11 (1.72 Kg),
while the lowest peak (1.63 Kg) was seen in 2009-10 and 2007-08 (1.65 Kg) (Figure 6.3).

21 Grow Organic Dairy – DairyBase Analysis of Organic Dairy Farm Performance
The lower peak in 2009-10 is surprising given that conditions for dairying were much worse
and stocking rates were higher in 2007-08 season. The 10 day peak milk solids production
per cow of the benchmark was higher than that of the GOD project for 4 of the 5 years. But
the GOD project had a greater peak in 2010-11 (Figure 6.3). This is attributed to the much
lower stocking rate of the GOD project in 2010-11.
There were significant differences in the average 10 day peak milk solids
production/cow between farms (F = 13.7, P < 0.05). But the differences between years (F
= 2.24, P = 0.09) was not significant.
7. Average Milk-Solids production per Cow per Day
Figure 7.1: Average milk solids production per cow/day - Overall assessment of 2010-11 season
The average milk solids production per cow/day for the GOD project was 1.34 Kg in 2010-11
season. This is greater than the benchmark (1.30 Kg) and also 5 year average for the GOD
project (1.29 kg). Once again this is attributed towards the lower stocking rate in 2010-11. It
could also be argued that if DIM was lower in 2010-11, the difference could perhaps be even
greater. Farm 4 had the highest average milk solids production per cow (1.80 Kg), while
Farm 5 had the lowest (1.00 Kg) (Figure 7.1). The average milk solids production per
cow/day for the Massey Farm (1.47 Kg) was the third highest in 2010-11.

22 Grow Organic Dairy – DairyBase Analysis of Organic Dairy Farm Performance
Figure 7.2: Average milk solids production per cow/day- Farm-wise
assessment across 5 years
The average milk solids production per cow/day for the GOD project over the 5 year project
period was 1.29 Kg. This is lower than the benchmark average (1.34 Kg). But 4 farms
achieved an average milk solids production per cow/day that was greater than the benchmark.
Farm 4 had the highest average (1.73 Kg), while Farm 5 had the lowest (1.02 Kg) (Figure
7.2). The high levels obtained by Farm 4 could be attributed to a combination of factors that
include – overall better feed supply/availability, fewer average days in milk, and good feed
conversion efficiency. The average milk solids production per cow/day for the Massey Farm
was 1.44 Kg.
Figure 7.3: Average milk solids production per cow/day – Year-wise assessment across farms

23 Grow Organic Dairy – DairyBase Analysis of Organic Dairy Farm Performance
The average milk solids production per cow/day showed a lesser degree of year on year
variation. Also, although not very distinct, there does appear to be a trend towards a year on
year increase. The highest average milk solids production per cow per day was seen in 2010-
11 (1.33 Kg), while the lowest average was seen in 2007-8 (1.24 Kg) (Figure 7.3). The
average milk solids production per cow/day for the benchmark was greater than that of the
GOD project for 4 out of the 5 years. The difference was highest in 2006-07 (+ 0.15 Kg). But
in 2010-11, despite the much lower stocking rate, the average MS production/cow/day of the
GOD project was only marginally greater (+ 0.04 Kg) than the benchmark.
There were significant difference in average milk solids production per cow/day -
between farms (F = 26.5, P < 0.05), and also between years (F = 3.48, P < 0.05).
8. Days in Milk per Cow
Figure 8.1: Days in Milk per Cow - Overall assessment of 2010-11 season
The average days in milk per cow for the GOD project was 238 days in 2010-11. This is
slightly lesser than the benchmark (244 days), but marginally greater than the 5 year average
for the project (236 days). Farm 3 had the longest average lactation length (284 days), while
Farm 9 had the shortest (214 days) (Figure 8.1). The average days in milk per cow for the
Massey Farm was 244 days in 2010-11.
Figure 8.2: Days in Milk per Cow – Farm-wise assessment across 5
years
24 Grow Organic Dairy – DairyBase Analysis of Organic Dairy Farm Performance
The average days in milk for the GOD project over the 5 year period were 236 days. This is
slightly lesser than the benchmark average (240 days). Farm 3 had the longest average
lactation length (265 days), while Farm 4 had the shortest (216 days) (Figure 8.2). Farm 3 has
a unique production system that includes another organic farm as well as a large organic run-
off. Hence management options available for this farm are relatively greater. Also the
conditions for dairying are very favourable on this farm. This enables Farm 3 to have longer
lactation lengths. The average days in milk for the Massey Farm was 240 days.
Figure 8.3: Days in Milk per Cow – Year-wise assessment across farms
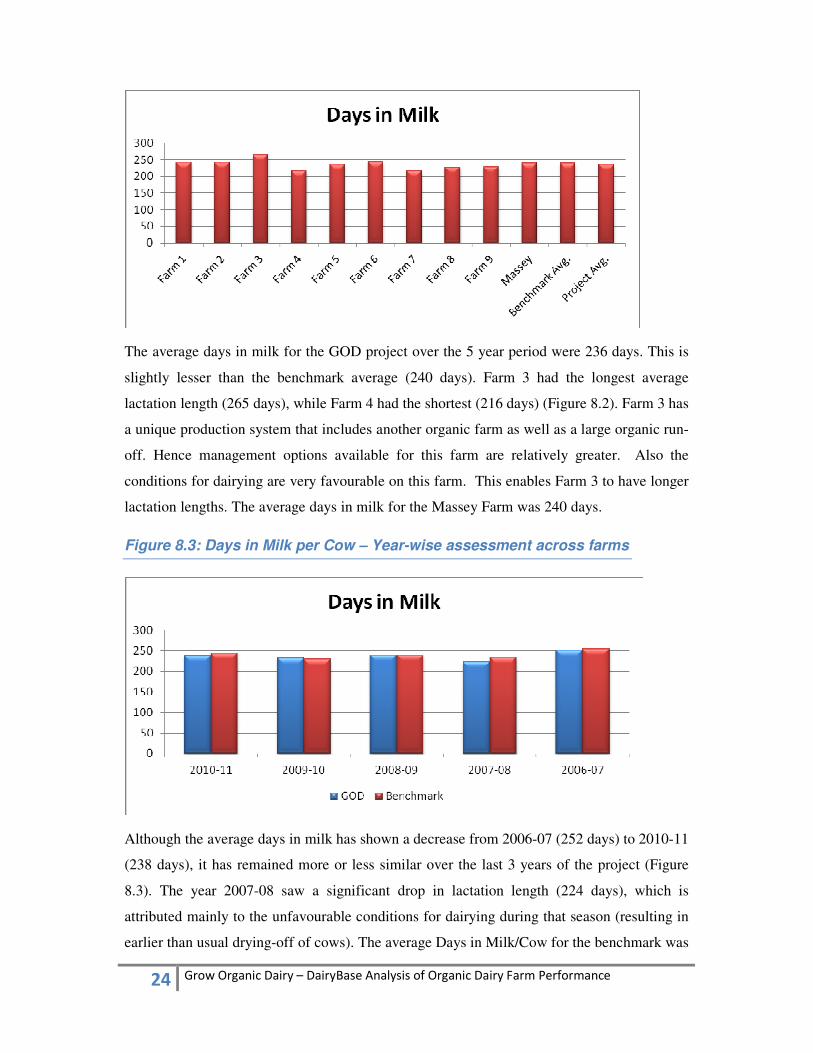
Although the average days in milk has shown a decrease from 2006-07 (252 days) to 2010-11
(238 days), it has remained more or less similar over the last 3 years of the project (Figure
8.3). The year 2007-08 saw a significant drop in lactation length (224 days), which is
attributed mainly to the unfavourable conditions for dairying during that season (resulting in
earlier than usual drying-off of cows). The average Days in Milk/Cow for the benchmark was

25 Grow Organic Dairy – DairyBase Analysis of Organic Dairy Farm Performance
greater than that of the GOD project for 3 out of the 5 years. But in 2009-10, the GOD project
on an average milked cows for 4 days longer than the benchmark. Interestingly, the average
DIM/cow in 2008-09 was identical for both GOD and Benchmark (239 days).
There were significant differences in average Days in Milk / Cow between farms (F=
2.59, P < 0.05), but there was no difference between years (F = 1.61, P = 0.19).
9. Pasture and Crop Eaten
Figure 9.1: Pasture and Crop eaten - Overall assessment of 2010-11 season
The average amount of pasture and crop eaten (t DM/ha) in 2010-11 was 10.38 T (Figure
9.1). This is much lower than the benchmark (11.70 T), indicating that organic farms are
grew considerably less grass & crop than comparable conventional dairy farms in 2010-11.
But it is marginally greater than the 5 year average for the project (10.29 T). Farm 3 had a
substantially higher (14.20 T) amount, while Farm 5 had a significantly lower amount (7.0 T)
(Figure 9.1). The amount of pasture & crop eaten on the Massey Farm was 10.40 T in 2010-
11.

26 Grow Organic Dairy – DairyBase Analysis of Organic Dairy Farm Performance
Figure 9.2: Pasture and Crop eaten - Farm-wise assessment across 5
years
The average amount of pasture and crop eaten (T DM/ha) for the GOD project over the 5
year project period (10.26 T) was lesser than the benchmark (11.32 T). Farm 3 had the
highest amount of average pasture and crop eaten (13.92 T) (Figure 9.2). Importantly, the
level achieved by Farm 3 was greater than the benchmark. This clearly indicates that the
conditions for pasture growth were very favourable on Farm 3. In contrast, Farm 5 had the
lowest amount (7.40 T) of pasture and crop eaten indicating conditions were very
unfavourable on this farm. The average amount of pasture & crop eaten for the Massey Farm
was quite low as well (9.80 T).
Figure 9.3: Pasture and Crop eaten - Year-wise assessment across farms
27 Grow Organic Dairy – DairyBase Analysis of Organic Dairy Farm Performance
The amount of pasture and crop eaten (t DM/ha) has decreased marginally form 2006-07
(10.58 t DM/ha) to 2010-11 (10.38 t DM/ha) (Figure 9.3). Indicating that (except for 2007-
08) conditions for pasture growth has not been too bad during the 5 year period. Since
organic farms have fewer tools to promote pasture growth (they cannot use fertilizers), this
drop is expected during transition. The year 2007-08 (9.72 t DM/ha) saw the highest drop due
to extremely unfavourable climatic conditions. The pasture and crop eaten for the benchmark
has been higher than that of the GOD project for each of the 5 years (Figure 9.3). ). Since
conventional farms have fewer restrictions or greater tools to promote pasture growth
(specifically the use of fertilizers), this difference is expected. The difference was highest in
2006-07 (+ 1.82 t DM/ha) and lowest in 2009-10 (+ 0.67 t DM/ha).
Differences in pasture and crop eaten between farms (F = 49.02, P < 0.05) and also
between years (F = 4.67, P < 0.05) was found to be significant.
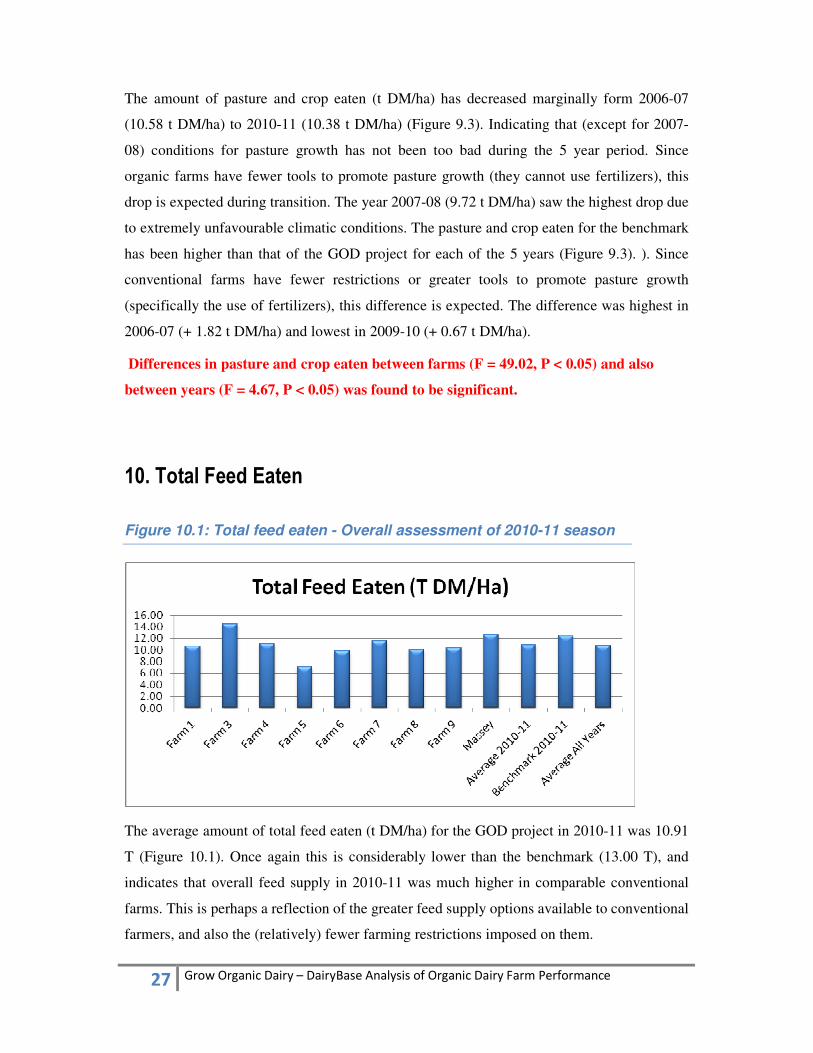
10. Total Feed Eaten
Figure 10.1: Total feed eaten - Overall assessment of 2010-11 season
The average amount of total feed eaten (t DM/ha) for the GOD project in 2010-11 was 10.91
T (Figure 10.1). Once again this is considerably lower than the benchmark (13.00 T), and
indicates that overall feed supply in 2010-11 was much higher in comparable conventional
farms. This is perhaps a reflection of the greater feed supply options available to conventional
farmers, and also the (relatively) fewer farming restrictions imposed on them.

28 Grow Organic Dairy – DairyBase Analysis of Organic Dairy Farm Performance
However the 2010-11 average is higher than 5 year average for the project (10.72 T). The
difference is due to better grass growth as well as greater levels of supplement feeding in
2010-11. Yet again Farm 3 had the highest (14.50 T) while Farm 5 had the least (7.10 T)
amount of total feed eaten (Figure 10.1).Interestingly, despite having an mediocre level of
pasture & crop growth (10.4 T DM/ha) in 2010-11, the amount of total feed eaten on the
Massey Farm (12.67 T DM/ha) was greater than the benchmark and second highest amongst
the GOD project farms. Indicating that the amount of supplements fed on the Massey Farm is
much greater than other GOD project farms and also comparable conventional farms.
Figure 10.2: Total feed eaten - Farm-wise assessment across 5 years
The average amount of total feed eaten (T DM/ha) for the GOD project over the 5 year
project period was (10.74 T) was lower than the benchmark average (12.20 T) (Figure 10.2).
Farm 3 had the highest amount of total feed eaten (14.38 T), while Farm 5 had the lowest
amount (7.46 T) (Figure 10.2).The high levels achieved by Farm 3 is mainly due to good
pasture and crop growth on this farm and not because of feeding large volumes of
supplement. Interestingly, although the Massey Farm had one of the lowest amounts of
pasture and crop eaten (9.80 t DM/ha), it had one of the highest amounts of total feed eaten
(11.60 t DM/ha). As in the case of 2010-11 season, this indicates that that Massey Farm feeds
(relatively) significant amount of supplements.
29 Grow Organic Dairy – DairyBase Analysis of Organic Dairy Farm Performance
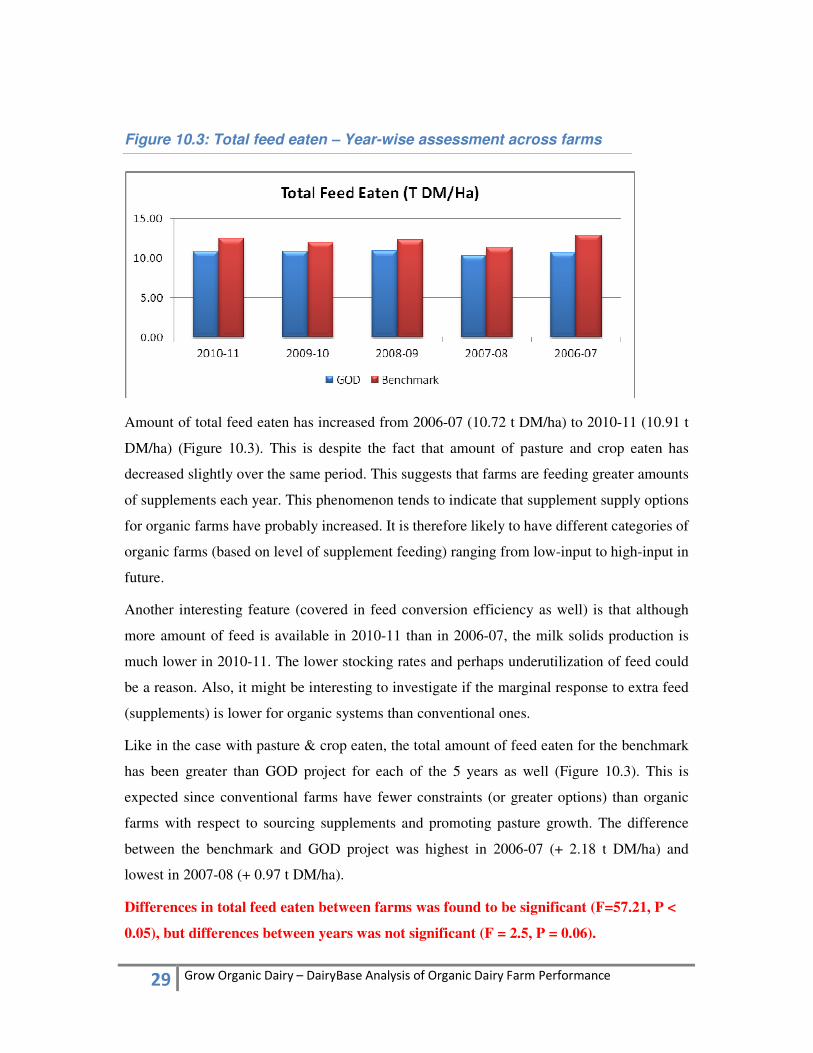
Figure 10.3: Total feed eaten – Year-wise assessment across farms
Amount of total feed eaten has increased from 2006-07 (10.72 t DM/ha) to 2010-11 (10.91 t
DM/ha) (Figure 10.3). This is despite the fact that amount of pasture and crop eaten has
decreased slightly over the same period. This suggests that farms are feeding greater amounts
of supplements each year. This phenomenon tends to indicate that supplement supply options
for organic farms have probably increased. It is therefore likely to have different categories of
organic farms (based on level of supplement feeding) ranging from low-input to high-input in
future.
Another interesting feature (covered in feed conversion efficiency as well) is that although
more amount of feed is available in 2010-11 than in 2006-07, the milk solids production is
much lower in 2010-11. The lower stocking rates and perhaps underutilization of feed could
be a reason. Also, it might be interesting to investigate if the marginal response to extra feed
(supplements) is lower for organic systems than conventional ones.
Like in the case with pasture & crop eaten, the total amount of feed eaten for the benchmark
has been greater than GOD project for each of the 5 years as well (Figure 10.3). This is
expected since conventional farms have fewer constraints (or greater options) than organic
farms with respect to sourcing supplements and promoting pasture growth. The difference
between the benchmark and GOD project was highest in 2006-07 (+ 2.18 t DM/ha) and
lowest in 2007-08 (+ 0.97 t DM/ha).
Differences in total feed eaten between farms was found to be significant (F=57.21, P <
0.05), but differences between years was not significant (F = 2.5, P = 0.06).
30 Grow Organic Dairy – DairyBase Analysis of Organic Dairy Farm Performance
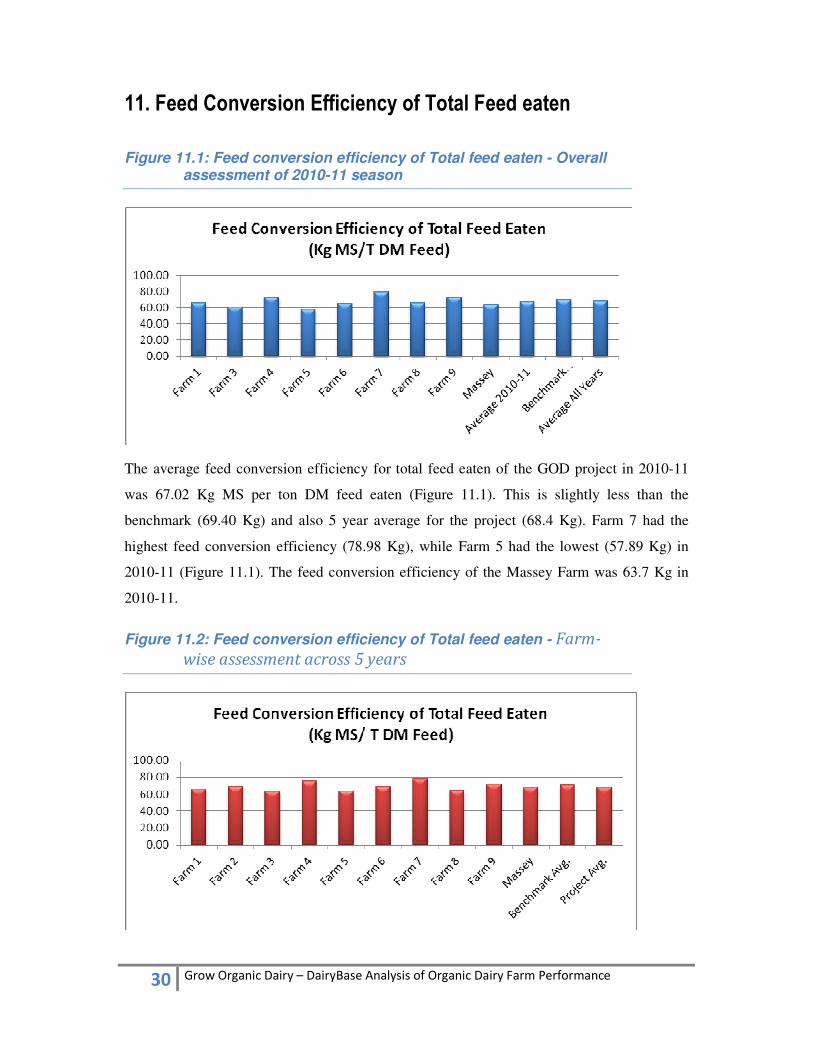
11. Feed Conversion Efficiency of Total Feed eaten
Figure 11.1: Feed conversion efficiency of Total feed eaten - Overall assessment of 2010-11 season
The average feed conversion efficiency for total feed eaten of the GOD project in 2010-11
was 67.02 Kg MS per ton DM feed eaten (Figure 11.1). This is slightly less than the
benchmark (69.40 Kg) and also 5 year average for the project (68.4 Kg). Farm 7 had the
highest feed conversion efficiency (78.98 Kg), while Farm 5 had the lowest (57.89 Kg) in
2010-11 (Figure 11.1). The feed conversion efficiency of the Massey Farm was 63.7 Kg in
2010-11.
Figure 11.2: Feed conversion efficiency of Total feed eaten - Farm-
wise assessment across 5 years
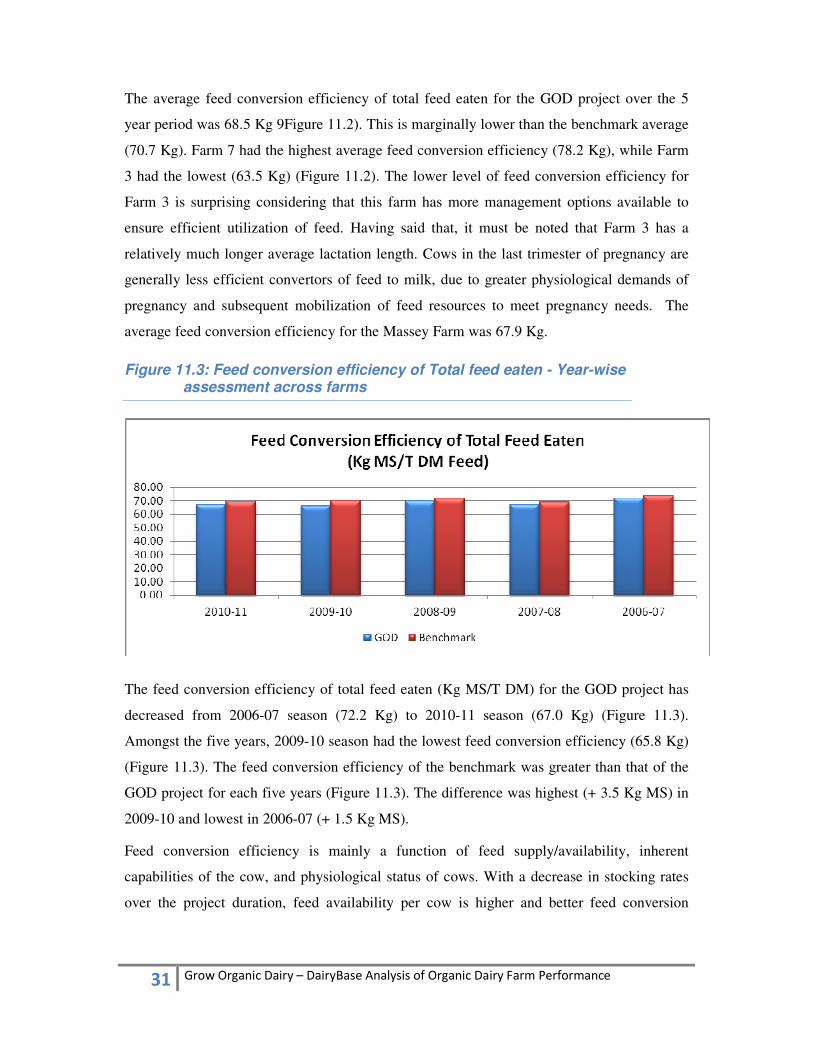
31 Grow Organic Dairy – DairyBase Analysis of Organic Dairy Farm Performance
The average feed conversion efficiency of total feed eaten for the GOD project over the 5
year period was 68.5 Kg 9Figure 11.2). This is marginally lower than the benchmark average
(70.7 Kg). Farm 7 had the highest average feed conversion efficiency (78.2 Kg), while Farm
3 had the lowest (63.5 Kg) (Figure 11.2). The lower level of feed conversion efficiency for
Farm 3 is surprising considering that this farm has more management options available to
ensure efficient utilization of feed. Having said that, it must be noted that Farm 3 has a
relatively much longer average lactation length. Cows in the last trimester of pregnancy are
generally less efficient convertors of feed to milk, due to greater physiological demands of
pregnancy and subsequent mobilization of feed resources to meet pregnancy needs. The
average feed conversion efficiency for the Massey Farm was 67.9 Kg.
Figure 11.3: Feed conversion efficiency of Total feed eaten - Year-wise assessment across farms
The feed conversion efficiency of total feed eaten (Kg MS/T DM) for the GOD project has
decreased from 2006-07 season (72.2 Kg) to 2010-11 season (67.0 Kg) (Figure 11.3).
Amongst the five years, 2009-10 season had the lowest feed conversion efficiency (65.8 Kg)
(Figure 11.3). The feed conversion efficiency of the benchmark was greater than that of the
GOD project for each five years (Figure 11.3). The difference was highest (+ 3.5 Kg MS) in
2009-10 and lowest in 2006-07 (+ 1.5 Kg MS).
Feed conversion efficiency is mainly a function of feed supply/availability, inherent
capabilities of the cow, and physiological status of cows. With a decrease in stocking rates
over the project duration, feed availability per cow is higher and better feed conversion

32 Grow Organic Dairy – DairyBase Analysis of Organic Dairy Farm Performance
efficiency is expected. However, it could also lead to oversupply of feed per cow (at specific
points in the season), resulting in underutilization (increased wastage) of feed.
Differences in feed conversion efficiency of total feed eaten between both farms (F =
7.52, P < 0.05) and seasons (F = 6.75, P < 0.05) was found to be significant.
12. Percent of Farm Harvested for Hay & Silage
Figure 12.1: Percent of Farm Harvested for Hay & Silage- Overall assessment of 2010-11 season
The percentage of farm harvested for making hay & silage by the GOD project was 24.3% in
2010-11 (Figure 12.1). This is greater than the benchmark figure (10%) and 5 year project
average (20.2%). Farm 9 had by the far the highest percentage of farm harvested for making
hay & silage (60%), while Farm 6 had lowest (9%). No hay or silage was made on the
Massey Farm in 2010-11.

33 Grow Organic Dairy – DairyBase Analysis of Organic Dairy Farm Performance
Figure 12.2: Percent of Farm Harvested for Hay & Silage- Farm-wise assessment across years
The average percentage of farm harvested for making hay & silage by the GOD project over
the 5 years was 20.2% (Figure 12.2). This is greater than the benchmark average (16.2%).
[Due to the constraints imposed on organic farming practices, the organic farms have fewer
(external) hay & silage supply options than conventional farms. It is therefore expected that
organic farms will utilize a relatively greater proportion of their (own) farms (in comparison
to conventional farms) for making hay & silage]. Amongst the GOD project farms, Farm 9
had the highest (35.2%) while Farm 1 had the lowest (6.2%) average percentage of farm
harvested for making hay & silage (Figure 12.2). Interestingly, no hay or silage was
harvested on the Massey Farm.
Figure 12.3: Percent of Farm Harvested for Hay & Silage- Year-wise assessment across farms

34 Grow Organic Dairy – DairyBase Analysis of Organic Dairy Farm Performance
Apart from a drop in 2009-10, the percentage of farm harvested as hay & silage for the GOD
project has increased year on year since 2006-07 (Figure 12.3). It was highest in 2010-11
(22.6%) and lowest in 2007-07 (15.8%). Importantly, apart from 2006-07, the GOD project
utilized a greater of percentage of farm for making hay & silage than the benchmark. The
difference was highest in 2010-11 (+ 12.6%) and lowest in 2006-07 (- 7.1%) (Figure 12.3).
These findings suggest that organics farms perhaps face greater challenges
(supply/availability, price, quality etc.) with respect to sourcing hay & silage from the market
than comparable conventional farms. As a result, organic farms have adapted to this
challenge by committing a greater proportion of their (own) farm towards the
harvesting/making of hay & silage.
13. Nitrogen Applied
Figure 13.1: Nitrogen Applied - Overall assessment of 2010-11 season
Only 4 of the GOD project farms applied Nitrogen on pastures in 2010-11 and the average
amount of nitrogen applied was 19.9 kg/ha (Figure 13.1). This is substantially lower than the
average amount applied by comparable conventional farms (118 kg/ha). Amongst the four
farms, Farm 4 applied the most amount of Nitrogen by a fair margin (84 kg/ha), while Farm 9
applied the least (23 kg/ha) (Figure 13.1). The two other farms that applied nitrogen were
Farm 7 (30 kg/ha) and Farm 8 (23 kg/ha).

35 Grow Organic Dairy – DairyBase Analysis of Organic Dairy Farm Performance
Figure 13.2: Nitrogen Applied – Farm-wise assessment across 5 years
The amount of nitrogen applied onto pastures has been quite low for all 5 years; and the
average amount of nitrogen applied over the 5 years varied considerably between farms. One
farm currently in the study (Farm 5) did not apply any nitrogen while three farms (Farm 1, 2
& 6) on an average applied less than 5 kg/ha per year over the 5 year period (Figure 13.2).
The highest (average) amount of nitrogen was applied by the Massey Farm (63.9 kg/ha)
followed by Farm 4 (45.7 kg/ha) (Figure 13.2). As expected, the average amount of nitrogen
applied by the GOD project (23.3 kg/ha) was considerably lower than the benchmark average
(100.4 kg/ha). The lower amount of nitrogen applied is thought to be one of the main reasons
for reduced pasture & crop growth on GOD project farms.
Figure 13.3: Nitrogen Applied – Year-wise assessment across farms

36 Grow Organic Dairy – DairyBase Analysis of Organic Dairy Farm Performance
The average amount of nitrogen applied by the GOD project showed a clear year on year
increase from 2006-07 season (0.67 Kg/ha) to 2009-10 season (44.83 Kg/ha), but it dropped
to 19.97 Kg/ha in 2010-11 season (Figure 13.3). As expected, for each of the 5 years the
amount of nitrogen applied on benchmark farms was considerably greater than the GOD
project. The difference varied from + 40.2 Kg/ha (2009-10) to + 118.3 Kg/ha (2006-07)
(Figure 13.3).
14. Cows per Labour unit
Figure 14.1: Cows per Labour unit - Overall assessment of 2010-11 season
In the 2010-11 season, the average number of cows/labour unit for the GOD project (112
cows) was lesser than the benchmark (154 cows) and 5 year project average (130 cows)
(Figure 14.1). The decrease in labour intensity can perhaps be explained by the reduction in
herd sizes across farms. Amongst farms, Farm 1 had by far the highest labour intensity (233
Cows/LU), while the Massey Farm (45 Cows/LU) had the lowest (Figure 14.1). Importantly,
except for Farm 1, the Cows/LU of all GOD project farms was lesser than the benchmark.
This is perhaps a reflection of the greater (whole farm) management challenges faced by
organic farms [which in turn results in having fewer cows per labour unit]. The low number
of cows per labour unit on the Massey Farm is a result of its structure (University owned) and
purpose (research/teaching oriented).

37 Grow Organic Dairy – DairyBase Analysis of Organic Dairy Farm Performance
Figure 14.2: Cows per Labour unit - Farm-wise assessment across 5
years
The average number of cows per labour unit for the GOD project over the 5 years (121
Cows/LU) was lesser than the benchmark average (142 Cows/LU) (Figure 14.2). The
variation/difference between farms was considerable. Farm 5 had the highest average (177
Cows/LU), while The Massey Farm had the lowest average (46 Cows/LU) (Figure 14.2).
Interestingly when compared with the 2010-11 figures, expect for Farm 1 & Farm 7, all the
other GOD project farms had a lower figure in 2010-11 than the 5 year average.
Figure 14.3: Cows per Labour unit – Year-wise assessment across farms
The cows per labour unit has shown slight year on year variation. But it was at its lowest in
2010-11 (112 Cows/LU), while it was its highest in 2006-07 (132 Cows/LU) (Figure 14.3).

38 Grow Organic Dairy – DairyBase Analysis of Organic Dairy Farm Performance
This drop could partly be due to the decrease in herd size for most GOD project farms. For
each of the 5 years, the benchmark had a greater labour intensity (Cows/labour unit) than the
GOD project (Figure 14.3). The difference was highest in 2010-11 (+ 42 Cows/LU) and
lowest in 2007-08 (+ 6 Cows/LU).
There was a significant difference in cows/labour unit between farms (F = 4.80, P <
0.05) but differences between years was not significant (F = 0.40, P =0.80).
15 Milk Solids per Labour unit
Figure 15.1: Milk solids per Labour unit - Overall assessment of 2010-11 season
The average Milk solids/Labour unit for the GOD project was 35,469 Kg in 2010-11 (Figure
15.1). This is considerably less than the benchmark (48,229 Kg), and slightly less than the 5
year average for the project (35,946 Kg). Once again Farm 1 had the highest milk solids
output per labour unit (69,526 Kg), and the Massey Farm had the lowest (16,252 kg) (Figure
15.1). Surprisingly, although Farm 4 had fewer Cows/LU than the benchmark, its milk solids
output per labour unit (54,466 Kg) was greater than the benchmark [due to the higher
productivity per cow of Farm 4].

39 Grow Organic Dairy – DairyBase Analysis of Organic Dairy Farm Performance
Figure 15.2: Milk solids per Labour unit - Farm-wise assessment across
5 years
The average milk solids production per labour unit for the GOD project over the 5 year study
period (35,646 kg) was lower than the benchmark (45,173 kg) (Figure 15.2). Farm 4 had the
highest average (54,281 kg), while the Massey Farm has the lowest average (15,849 kg)
(Figure 15.2). Interestingly, although Farm 5 had the highest average Cows/LU, the
challenging dairying environment it faces and resulting lower production has led to its
average milk solids output per labour unit (43,202 kg) being 4th
highest of the GOD project.
Figure 15.3: Milk solids per Labour unit - Year-wise assessment across farms
The milk solids production per labour unit has shown some year on year differences (Figure
15.3). It was highest in 2009-10 (41,533 kg) and lowest in 2007-08 (35, 625 kg) (Figure

40 Grow Organic Dairy – DairyBase Analysis of Organic Dairy Farm Performance
15.3). The drop in 2007-08 can be explained by the significant drop in milk production across
farms. While the increase in 2009-10 can be attributed to the increase in labour intensity
(more Cows/Labour unit). For each of the 5 years, the milk solids production/labour unit of
the benchmark was greater than that of the GOD project. The difference was greatest in 2010-
11 (+ 12,760 Kg MS/LU) and least in 2007-08 (+ 5,334 Kg MS/LU).
Once again differences between farms was significant (F = 5.04, P < 0.05), but
differences between years was not (F= 0.62, P = 0.64).
16. Average Bulk Somatic Cell Count (SCC)
Figure 16.1: Average bulk tank Somatic Cell Count- Overall assessment of 2010-11 season
The average bulk SCC for the GOD project in 2010-11 was 275,670 (Figure 16.1). This is
marginally lower than the 5 year average for the project (276,300), but substantially higher
than the recommended benchmark target figures (< 125,000). Farm 5 had the highest average
SCC (360,000/ml), while the Massey Farm 4 had the lowest (145,000/ml) (Figure 16.1). On
the whole, apart from the Massey farm, average bulk SCC for all farms was on the higher
side (> 250,000/ml). Clearly indicating that milk quality is a significant challenge that needs
to be controlled/solved for the organic farms.
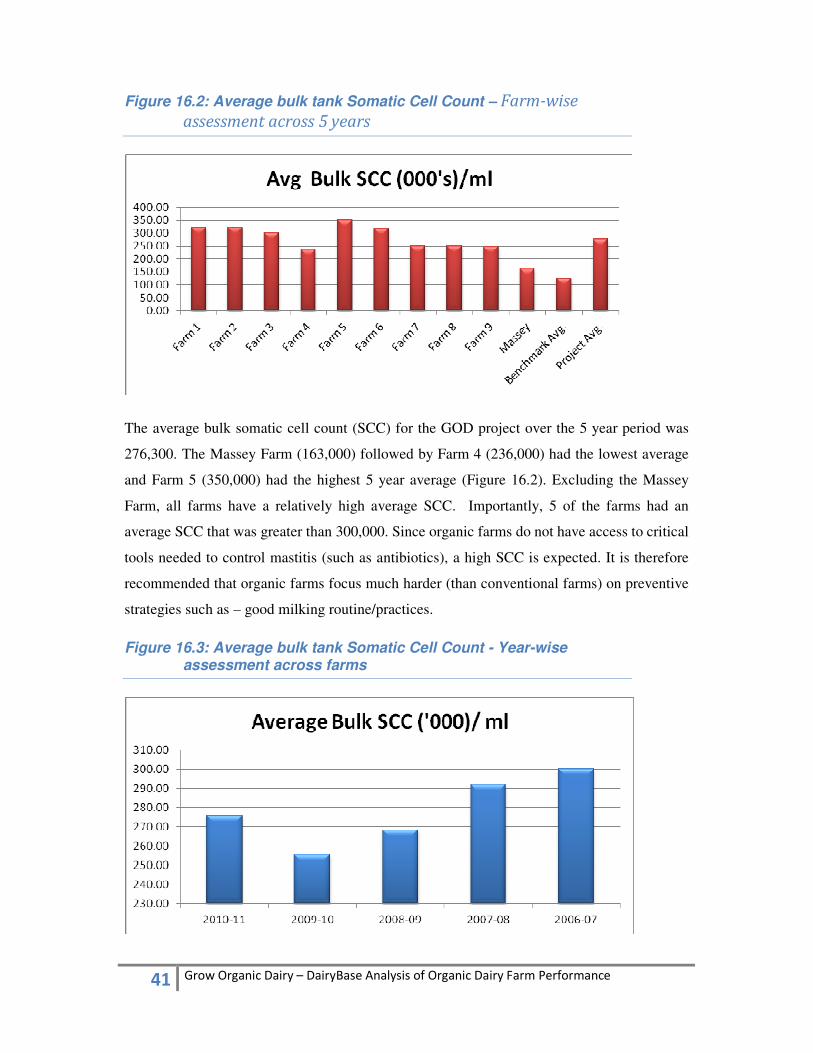
41 Grow Organic Dairy – DairyBase Analysis of Organic Dairy Farm Performance
Figure 16.2: Average bulk tank Somatic Cell Count – Farm-wise
assessment across 5 years
The average bulk somatic cell count (SCC) for the GOD project over the 5 year period was
276,300. The Massey Farm (163,000) followed by Farm 4 (236,000) had the lowest average
and Farm 5 (350,000) had the highest 5 year average (Figure 16.2). Excluding the Massey
Farm, all farms have a relatively high average SCC. Importantly, 5 of the farms had an
average SCC that was greater than 300,000. Since organic farms do not have access to critical
tools needed to control mastitis (such as antibiotics), a high SCC is expected. It is therefore
recommended that organic farms focus much harder (than conventional farms) on preventive
strategies such as – good milking routine/practices.
Figure 16.3: Average bulk tank Somatic Cell Count - Year-wise assessment across farms

42 Grow Organic Dairy – DairyBase Analysis of Organic Dairy Farm Performance
The average bulk SCC of the GOD project remained on the higher side (> 250,000/ml) for all
five years (Figure 16.3). However it showed a year on year decrease from 2006-07 (300,140)
to 2009-10 season (255,560) (Figure 16.3). But it increased once again in 2010-11 season
(275,670). Importantly, for each of the 5 years, the SCC of the GOD project has been
substantially greater than the recommended target value for benchmark farms (< 125,000).
However, a comparison with benchmark target value may not be ideal because organic farms
do not have access to critical tools (specifically antibiotics) needed for managing
mastitis/milk quality.
There was a significant difference in average bulk SCC between farms (F = 7.50, P <
0.05), but difference between years was not significant (F =0.74, P = 0.57).
17.0 Lameness & Mastitis
Figure 17.1: Lameness & Mastitis- an Overall Assessment of 2010-11 season
The average percentage of cows treated for lameness and clinical mastitis (1st 6 weeks of the
season) for the GOD project during 2010-11 was 5.3% and 6.8% respectively (Figure 17.1).
Farm 9 had the highest percentage of cows treated for lameness (18%) while Farm 3 had the
highest percentage of cows treated for clinical mastitis (18%). Interestingly the percentage of
cows treated for lameness on Farms 1, 3, 4, 5, & 7 were identical (3%) (Figure 17.1). The
recommended target for the percentage of cows treated for lameness & clinical mastitis on
the benchmark farms is 3% & 8% respectively.

43 Grow Organic Dairy – DairyBase Analysis of Organic Dairy Farm Performance
Figure 17.2: Lameness & Mastitis- Farm-wise assessment across years
Over the 5 year project period, the average percentage of cows treated for lameness and
mastitis in the GOD project was 6.9% and 7.8% respectively (Figure 17.2). Farm 2 (which is
no longer participating in the project) had the highest average percentage of cows treated for
both lameness (19.3%) and clinical mastitis (18.3%). Apart from Farm 2, the highest average
percentage of cows treated for lameness and clinical mastitis was on Farm 8 (9.4%) and Farm
3 (11.2%) respectively (Figure 17.2). While the farms with lowest average (for lameness &
clinical mastitis) were Farm 3 (2.4%) and the Massey Farm (3.2%) respectively.
Apart from Farm 3, all other GOD project farms had an average percentage of cows treated
for lameness that was greater than the recommended target value for the benchmark (3%).
However, 6 out the 10 GOD project farms had an average percentage of cows treated for
clinical mastitis that was lesser than the recommended benchmark target value (8%). Since
treatment options for clinical mastitis are quite limited for organic farms (cannot use
antibiotics), it is possible that mild-clinical cases remain untreated and animals with severe
cases get culled- leading to an under-estimation of the number of cows treated for clinical
mastitis. This seems quite likely especially because most of the organic farms in the GOD
project have a very high SCC (which generally strongly associated with incidence of clinical
mastitis).
44 Grow Organic Dairy – DairyBase Analysis of Organic Dairy Farm Performance
Figure 17.3: Lameness & Mastitis- A year-wise assessment across farms
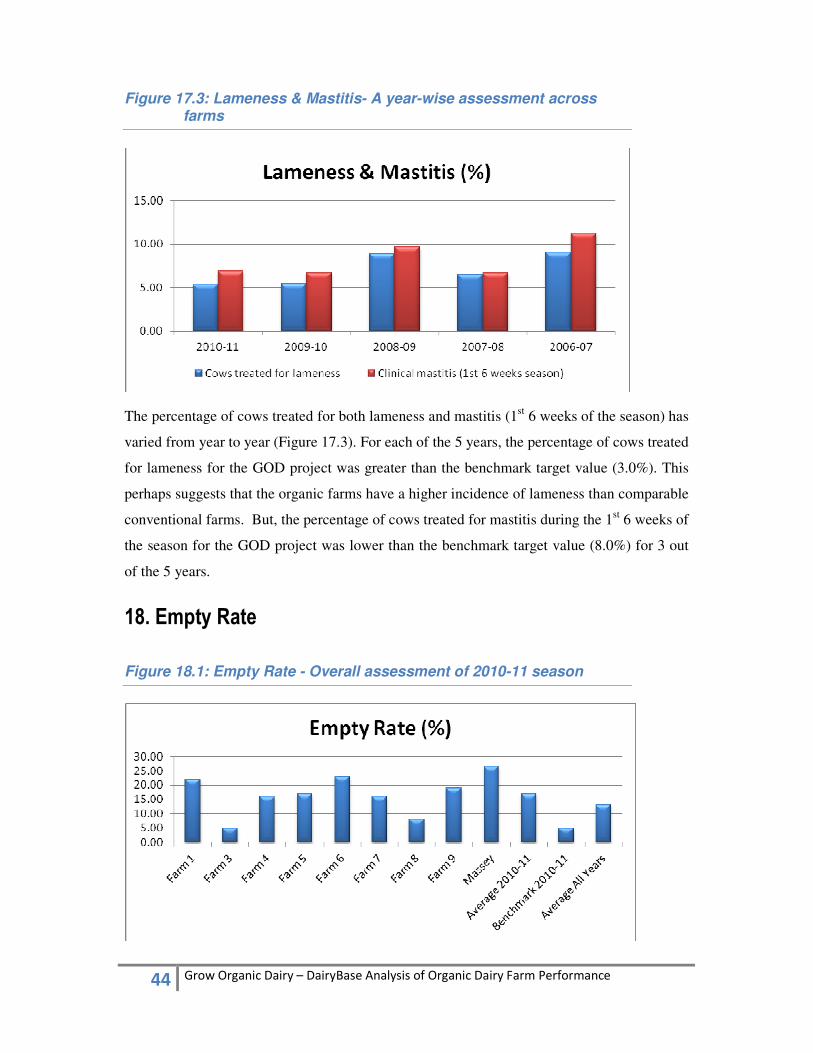
The percentage of cows treated for both lameness and mastitis (1st 6 weeks of the season) has
varied from year to year (Figure 17.3). For each of the 5 years, the percentage of cows treated
for lameness for the GOD project was greater than the benchmark target value (3.0%). This
perhaps suggests that the organic farms have a higher incidence of lameness than comparable
conventional farms. But, the percentage of cows treated for mastitis during the 1st 6 weeks of
the season for the GOD project was lower than the benchmark target value (8.0%) for 3 out
of the 5 years.
18. Empty Rate
Figure 18.1: Empty Rate - Overall assessment of 2010-11 season

45 Grow Organic Dairy – DairyBase Analysis of Organic Dairy Farm Performance
The average empty rate across GOD project farms was 16.9% in 2010-11 (Figure 18.1). This
is higher than the 5 year average for the project (13.1%) and recommended target for the
benchmark (5.0%). Farm 3 had the best empty rate (5%), while the Massey Farm had the
worst (26.6%) (Figure 18.1). Importantly, only 2 of the GOD project farms (Farm 3 & Farm
8) had an empty rate that was less than 10%. Clearly indicating that getting an acceptable
number of cows in-calf/pregnant is a significant challenge for most GOD project farms.
Figure 18.2: Empty Rate – Farm-wise assessment across 5 years
The average empty rate for the GOD project over the 5 year period was 13.1 % (Figure 18.2).
This is much higher than the recommended target for the benchmark farms (5.0%). Over the
5 years, (apart from Farm 2), Farm 8 had the lowest average empty rate (11.3%) while Farm
6 had the highest (17.1%) (Figure 18.2). The 5 year average empty rate of the Massey Farm
was considerably lower than its 2010-11 numbers. Apart from 2010-11 and 2008-09, the
empty rates on the Massey Farm have ranged been between 6% and 9%.

46 Grow Organic Dairy – DairyBase Analysis of Organic Dairy Farm Performance
Figure 18.3: Empty Rate - Year-wise assessment across farms
Apart from a minor the drop in 2007-08, the empty rates for the GOD project have increased
steadily from 2006-07 (11.18%) to 2010-11 season (16.95%) (Figure 18.3). This suggests that
the fertility of the cows/herd(s) has been decreasing. Importantly, the empty rates for the
GOD project has been more than twice that of the benchmark target value (5.0%) for each of
the 5 years. This is perhaps due to a poorer nutritional status of the GOD project cows as a
result of reduced total feed supply.
There was no significant difference in empty rates between farms (F =1.34, P = 0.26),
and also between years (F = 0.71, P = 0.59).
19. Submission Rate (3 weeks) and In-calf rate (6 weeks)
Figure 19.1: 3 Week Submission & 6 Week In-calf Rate – Overall assessment of 2010-11
47 Grow Organic Dairy – DairyBase Analysis of Organic Dairy Farm Performance
The average 3 week submission rate and 6 week in-calf rate of the GOD project in 2010-11
were 74.6% and 71.4% respectively (Figure 19.1). These were much lower than the
recommended targets for the benchmark (90% & 78%), but slightly higher than the 5 year
project average (72.9% & 65.8%). In the 2010-11 season, the Massey Farm had the best 3-
week submission rate (100%) while Farm 1 had the worst (49%). Data on the 6 week in-calf
rate was available from only 5 farms. Of these, Farm 8 had the best (85%) while Farm 9 had
the worst (59%) (Figure 19.1) [Farm 8 had one of the best empty rates while Farm 9 had one
of the worst].
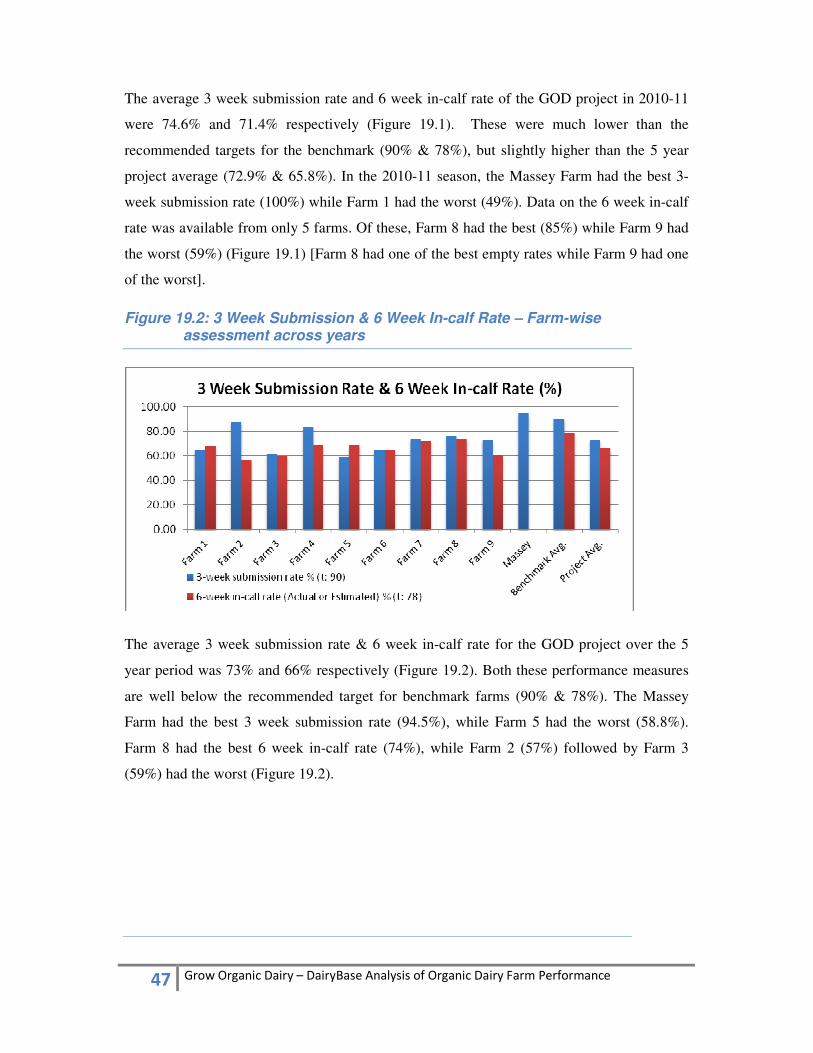
Figure 19.2: 3 Week Submission & 6 Week In-calf Rate – Farm-wise assessment across years
The average 3 week submission rate & 6 week in-calf rate for the GOD project over the 5
year period was 73% and 66% respectively (Figure 19.2). Both these performance measures
are well below the recommended target for benchmark farms (90% & 78%). The Massey
Farm had the best 3 week submission rate (94.5%), while Farm 5 had the worst (58.8%).
Farm 8 had the best 6 week in-calf rate (74%), while Farm 2 (57%) followed by Farm 3
(59%) had the worst (Figure 19.2).

48 Grow Organic Dairy – DairyBase Analysis of Organic Dairy Farm Performance
Figure 19.3: 3 Week Submission & 6 Week In-calf Rate – Year-wise assessment across farms
Over the 5 years, the 3 week submission rate has shown very slight year on year
variation, while the 6 week in-calf rate has shown a greater degree of variation
(Figure 19.3). For each of the 5 years, both the 3 week submission rate and 6 week
in-calf rate of the GOD project was much lower than the target value for the
benchmark farms (90% & 78% respectively). The 3 week submission rate & 6 week
in-calf rate was best in 2010-11 (74.6% & 71.4%) and worst in 2007-08 (70.9% &
54.0%) (Figure 19.3). The unfavourable dairying conditions in 2007-08 (leading to a
poorer nutritional status and increased stress on cows) are perhaps the reason for a
discouraging 3 week submission rate and 6 week in-calf rate. On the whole these
findings once again suggest that the reproductive health of the GOD project herds
needs to be improved considerably.
49 Grow Organic Dairy – DairyBase Analysis of Organic Dairy Farm Performance
20. Calving Distribution
Figure 20.1: Calving distribution – Overall assessment of 2010-11 season
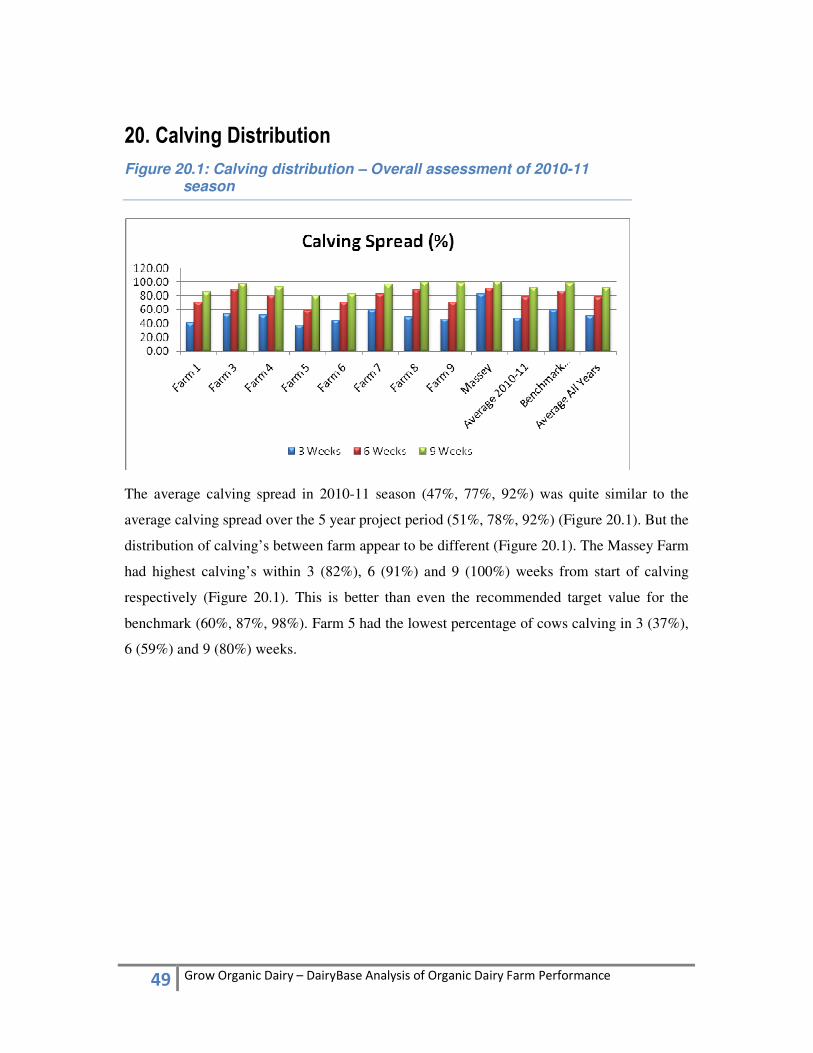
The average calving spread in 2010-11 season (47%, 77%, 92%) was quite similar to the
average calving spread over the 5 year project period (51%, 78%, 92%) (Figure 20.1). But the
distribution of calving’s between farm appear to be different (Figure 20.1). The Massey Farm
had highest calving’s within 3 (82%), 6 (91%) and 9 (100%) weeks from start of calving
respectively (Figure 20.1). This is better than even the recommended target value for the
benchmark (60%, 87%, 98%). Farm 5 had the lowest percentage of cows calving in 3 (37%),
6 (59%) and 9 (80%) weeks.
50 Grow Organic Dairy – DairyBase Analysis of Organic Dairy Farm Performance
Figure 20.2: Calving distribution – Farm-wise assessment across 5
years
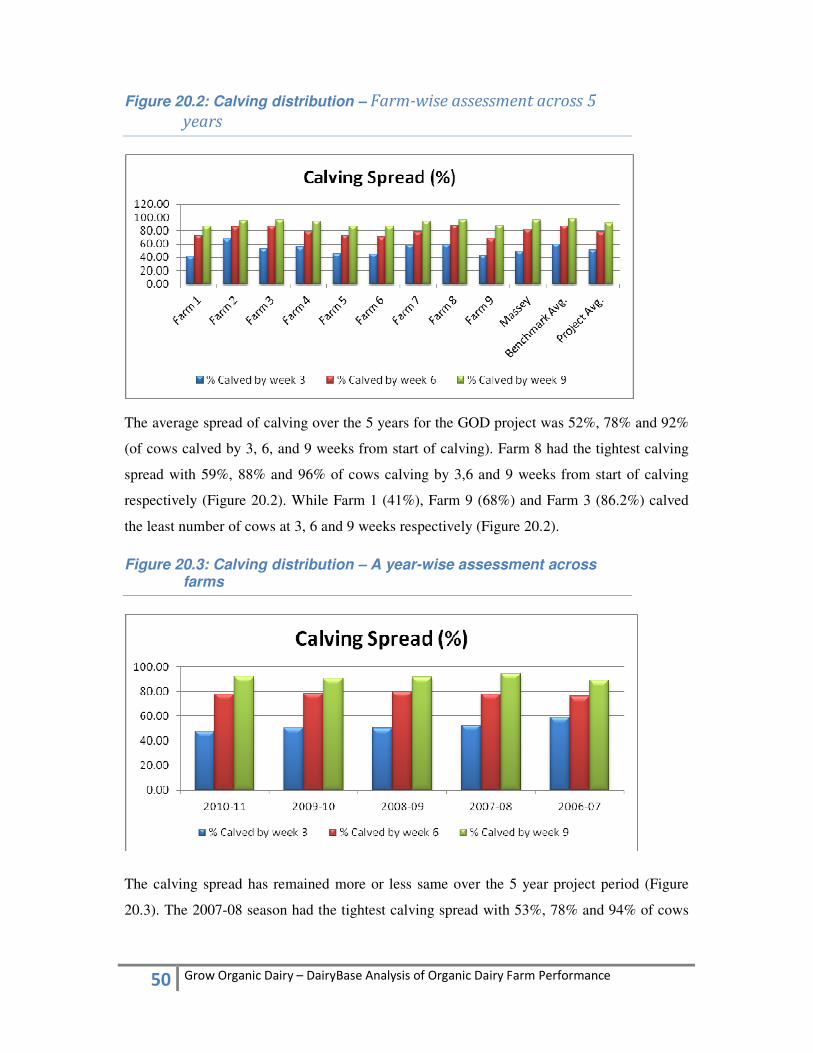
The average spread of calving over the 5 years for the GOD project was 52%, 78% and 92%
(of cows calved by 3, 6, and 9 weeks from start of calving). Farm 8 had the tightest calving
spread with 59%, 88% and 96% of cows calving by 3,6 and 9 weeks from start of calving
respectively (Figure 20.2). While Farm 1 (41%), Farm 9 (68%) and Farm 3 (86.2%) calved
the least number of cows at 3, 6 and 9 weeks respectively (Figure 20.2).
Figure 20.3: Calving distribution – A year-wise assessment across farms
The calving spread has remained more or less same over the 5 year project period (Figure
20.3). The 2007-08 season had the tightest calving spread with 53%, 78% and 94% of cows

51 Grow Organic Dairy – DairyBase Analysis of Organic Dairy Farm Performance
calving within 3,6, and 9 weeks of the start of calving respectively. But even in the 2007-08
season, the calving spread was not better than the benchmark target value (60%, 87%, 98%).

52 Grow Organic Dairy – DairyBase Analysis of Organic Dairy Farm Performance
Table 1.1 Summary Statistics of Key Physical Performance Parameters for 2010-11
season (all farms)
Benchmark S.
No
PARAMETER GOD
Project
Averag
e
(2010-
11)
ST
DEV.
(2010-
11)
MIN
(2010-
11)
MAX
(2010-
11)
GOD
Project 5
Year
Average
2010-
11
5 year
Average
1. Milking Area (ha) 76.63 32.53 20.14 123.00 79.24 112.30 108.00
2. Stocking Rate
(cows/ha)
2.29 0.34 1.90 2.90 2.45 2.80 2.72
3. MS/Ha (kg) 725.67 143.01 411.00 879.00 735.70 868 863.4
4. MS/Cow (kg) 317.44 49.17 220.00 389.00 301.83 313 317.4
5. Peak MS/Cow per
Day (kg)
1.72 0.22 1.40 2.15 1.68 1.68 1.70
6. Avg MS/Cow per
Day (kg)
1.33 0.28 1.00 1.80 1.29 1.30 1.34
7. DIM per Cow
(days)
238.00 22.99 214.00 284.00 236.00 244.00 240.00
8. Pasture +Crop
Eaten (t DM/ha)
10.38 1.84 7.00 14.20 10.26 11.40 11.32
9. Total Feed Eaten (t
DM/ha)
10.90 2.03 7.10 14.50 10.74 12.50 12.20
10.Feed Conversion
Efficiency (of
Total feed eaten)
67.08 6.95 57.89 78.98 68.45 69.44 70.71
11.Nitrogen
Applied/year
(kg/ha)
19.97 27.15 0.00 84.00 23.32 118.00 100.40
12.Percentage of Farm
Harvested for Hay
& Silage (%)
24.38 16.21 9.00 61.00 20.25 10.00 16.20
13.Submission rate @
3 weeks (%)
74.67 18.34 49.00 100.00 72.90 - -
14.% Calved in 3
weeks
47.88 13.40 37.00 82.20 51.26 - -
15.Empty Rate (%) 16.96 6.94 5.00 26.67 13.05 - -
16.Lameness (%) 5.40 4.86 3.00 18.00 6.94 - -
17.Average SCC
('000)
275.67 59.89 145.00 360.00 276.30 - -
18.Cows/Labour Unit 112.00 55.63 45.00 233.00 121.00 154.00 142.00
19.MS/Labour Unit
(kg)
35,469.0
0
17,822.0
8
16,252.
00
69,526.0
0
35,946.08 48,229.
00
45,173.00

53 Grow Organic Dairy – DairyBase Analysis of Organic Dairy Farm Performance
Financial Analysis
Summary This part of the report analyses the financial performance of the farms participating in
the Grow Organic Dairy (GOD) project for three key parameters- 1) Liquidity, 2)
Profitability and 3) Wealth. To achieve this, an analysis of each of these key financial
parameters is presented from three perspectives -
A) An overall assessment of the 2010-11 season
B) A Farm-wise assessment across 5 years
C) A Year-wise assessment across farms
Since Farm 2 was not participating in the GOD project anymore, it was excluded entirely
from this analysis. Furthermore, data from the Massey University Farm was not used in
calculating group averages. Instead it was provided as a point of reference/comparison
(in addition to the benchmark) wherever possible.
The benchmark data for each of the 5 years was obtained from Dairy Base and it
consisted of the average performance (for liquidity, profitability & wealth) of
comparable conventional dairy farms (North Island, Owner operator, System 1 & 2
Farms). The number of farms used by Dairy Base to calculate the benchmark varied
from year to year and ranged from 133 to 198.
4. Liquidity
An assessment of liquidity was performed using 5 sub-parameters – Net Cash Income,
Farm Working Expenses, Cash Operating Surplus, Discretionary Cash and Cash
Surplus/Deficit. For each of these sub-parameters comparisons were made - between
GOD projects farms for 2010-11 season, between farms over the 5 year project duration
and between years across the 8 farms studied. Since benchmark data on these
parameters were not available, comparisons with benchmark farms could not be made.
On the whole the financial performance in terms of liquidity was reasonably good for
the GOD project. In the 2010-11 season, Farm 9 had the highest Net Cash Income and
Farm 3 had the lowest Farm Working Expenses and highest Cash Operating Surplus. All
farms had a positive Discretionary Cash, and all but two farms had a Cash Surplus.
Across farms, over the 5 year project duration, the (average) liquidity position of Farm 9

54 Grow Organic Dairy – DairyBase Analysis of Organic Dairy Farm Performance
appeared to be the best. Only Farm 3 had a negative average Discretionary Cash; while
Farm 7 was the only one to have an average Cash Surplus that was negative (a Cash
Deficit).
Across years, the (average) liquidity position in 2010-11 and 2007-08 were the best;
while that in 2008-09 and 2006-07 were the worst. This is primarily because milk price
was highest in 2007-08 & 2010-11 and lowest in 2006-07 & 2008-09. The net cash
income has shown considerable year on year variation (reflecting the variation in milk
price and production), but the Farm Working Expenses has remained more or less the
same from 2007-08 onwards.
5. Profitability
The assessment of profitability was performed using 14 sub-parameters – Gross Farm
Revenue/ha, Operating Expenses/ha, Operating Profit/ha, Gross Farm Revenue/Kg MS,
Operating Expenses/Kg MS, Operating Profit/Kg MS, Operating Efficiency (Operating
Profit Margin), Capital Efficiency (Asset Turnover Ratio), Return on Equity (excluding
change in capital value), Total Return on Equity, Operating Return on Dairy Assets, Return
on Total Assets, Interest & Rent/Total Revenue and Interest & Rent/Kg MS.
For each of these sub-parameters comparisons were made - between the GOD projects
farms for 2010-11 season, between farms over the 5 year project duration and between
years across the 8 farms studied. Since benchmark data was available, comparisons
were also made with benchmark farms. On the whole, the profitability of GOD project
farms has been good. Importantly, for many of the profitability sub-parameters
assessed, the GOD project farms have performed better than the comparable
conventional benchmark farms.
In the 2010-11 season, the GOD project average was better than the benchmark for 8 of
the 14 sub-parameters assessed. Amongst farms, the profitability of Farm 3 was the best
while that of Farm 7 was the worst, for most the sub-parameters. Interestingly, Farm 3
and Farm 7 were the two best performing farms in terms of productivity (Kg MS/Ha) in
2010-11.
Across farms, over the 5 year period, the GOD project average was better than the
benchmark for 7 of the 14 sub-parameters assessed. All but two GOD project farms had
a higher average Operating Profit Margin than the benchmark; but only 2 farms had a
55 Grow Organic Dairy – DairyBase Analysis of Organic Dairy Farm Performance
higher Asset Turnover Ratio than the benchmark. Since organic farms adopt a
differentiation strategy to achieve a competitive advantage (as opposed to a cost
leadership strategy used by conventional farms), a higher operating profit margin
(operating efficiency) and lower asset turnover ratio (capital efficiency) than the
benchmark (conventional) farms is expected. On the whole Farm 3 and Farm 4 appear
to be the most profitable (Farm 9 also appears to be very profitable based on limited
data available). Importantly, Farm 3 and Farm 4 achieved the highest and third highest
average productivity (Kg MS/ha) respectively. In contrast, despite obtaining the second
highest average productivity (Kg MS/Ha), the profitability of Farm 7 has been one of the
lowest.
Across years, the 2007-08 season was by far the most profitable (except for debt
servicing capacity), followed by 2010-11. This is primarily because of a high milk price
(using Gross Farm Revenue/Kg MS as a proxy for milk price) for these two years. In
contrast, a low milk price in 2006-07 & 2008-09 ensured that these two years were the
least profitable. Interestingly, the 2007-08 season was clearly the worst in terms of
productivity (Kg MS/Ha), while productivity 2006-07 was by far the highest. A notable
feature across years is that Operating Expenses (both per Ha and per Kg MS) has
remained more or less the same each year from 2007-08 onwards.
6. Wealth
The assessment of wealth was performed using 7 sub-parameters – Growth in Equity in
Value, Growth in Equity in Percentage, Equity Growth from Profit, Equity Growth from
Capital, Closing Total Assets, Closing Total Liabilities and Debt to Assets Ratio. Once again,
for each of the 7 sub-parameters comparisons were made - between the GOD projects
farms for 2010-11 season, between farms over the 5 year project duration and between
years across the 8 farms studied. Comparisons were also made with benchmark farms
for the 4 sub-parameters for which benchmark data was available.
On the whole the financial performance in terms of wealth for the GOD project farms
appears to be quite good. In 2010-11, an average equity growth of 15.2% was achieved.
This is much higher than that obtained by the benchmark. It was highest for Farm 1 and
lowest for Farm 7. The highest equity growth from profit was achieved by Farm 8, while
the highest equity growth from capital was obtained by Farm 1. Although the average

56 Grow Organic Dairy – DairyBase Analysis of Organic Dairy Farm Performance
Debt to Assets Ratio was below 60%, it was greater than the benchmark and exceeded
100% for two of the 7 farms analysed.
Across farms, over the 5 year period the average equity growth of the GOD project was
8.3%; and 6 out of the 8 farms recorded a positive equity growth. However, only 5 out of
the 8 farms achieved a positive equity growth from profit; while 7 out of the 8 farms
obtained a positive equity growth form capital. The negative equity growth from profit
for three (Farm 3, 5 & 7) farms suggests that these farms are removing more funds from
the business than it earns. In the case of two of the farms (Farm 5 & 7), the negative
equity growth from profit was compensated by equity growth from capital gains.
Although Farm 3 achieved a positive equity growth from capital, it was not sufficient to
compensate for the negative equity growth from profit. The only farm to report a
negative equity growth from capital was Farm 1. The average Debt to Asset ratio for the
GOD project (52%) was much greater than the benchmark average. It was least for
Farm 6 and highest for Farm 3.
Across years, the highest equity growth was recorded in 2007-08 and lowest in 2008-
09. Over the 5 years, a positive equity growth from both profit and capital was observed
for 3 years.; and 2008-09 was the only year that had a negative equity growth from both
profit and capital. The highest equity growth from profit was seen in 2010-11, while the
highest equity growth from capital was seen in 2007-08. On the whole it was capital
gain (rather than profit) that drove equity growth of GOD project farms, suggesting very
little retention of profits by the farms. The negative equity growth in 2008-09 resulted
in an increase in the Debt to Assets ratio for the GOD project. Over the 5 years, it has
increased from being below 50% in 2006-07 to around 60% in 2010-11. It was highest
(little over 60%) in 2008-09.
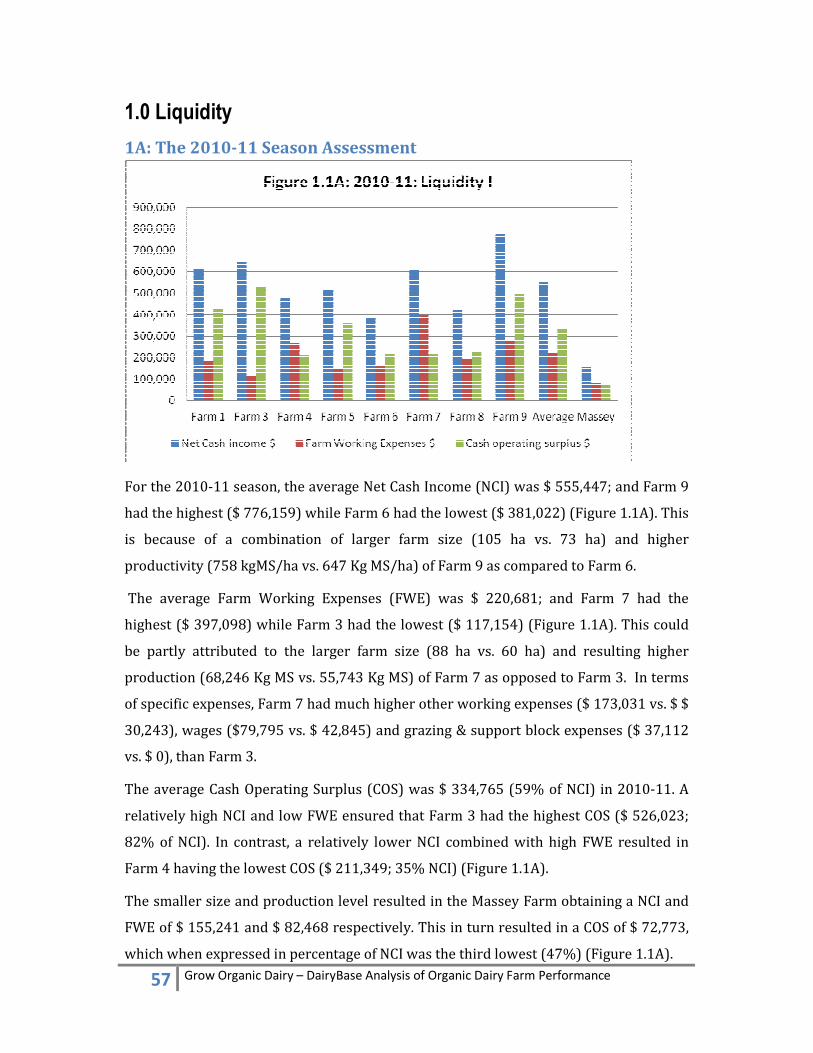
57 Grow Organic Dairy – DairyBase Analysis of Organic Dairy Farm Performance
1.0 Liquidity
1A: The 2010-11 Season Assessment
For the 2010-11 season, the average Net Cash Income (NCI) was $ 555,447; and Farm 9
had the highest ($ 776,159) while Farm 6 had the lowest ($ 381,022) (Figure 1.1A). This
is because of a combination of larger farm size (105 ha vs. 73 ha) and higher
productivity (758 kgMS/ha vs. 647 Kg MS/ha) of Farm 9 as compared to Farm 6.
The average Farm Working Expenses (FWE) was $ 220,681; and Farm 7 had the
highest ($ 397,098) while Farm 3 had the lowest ($ 117,154) (Figure 1.1A). This could
be partly attributed to the larger farm size (88 ha vs. 60 ha) and resulting higher
production (68,246 Kg MS vs. 55,743 Kg MS) of Farm 7 as opposed to Farm 3. In terms
of specific expenses, Farm 7 had much higher other working expenses ($ 173,031 vs. $ $
30,243), wages ($79,795 vs. $ 42,845) and grazing & support block expenses ($ 37,112
vs. $ 0), than Farm 3.
The average Cash Operating Surplus (COS) was $ 334,765 (59% of NCI) in 2010-11. A
relatively high NCI and low FWE ensured that Farm 3 had the highest COS ($ 526,023;
82% of NCI). In contrast, a relatively lower NCI combined with high FWE resulted in
Farm 4 having the lowest COS ($ 211,349; 35% NCI) (Figure 1.1A).
The smaller size and production level resulted in the Massey Farm obtaining a NCI and
FWE of $ 155,241 and $ 82,468 respectively. This in turn resulted in a COS of $ 72,773,
which when expressed in percentage of NCI was the third lowest (47%) (Figure 1.1A).
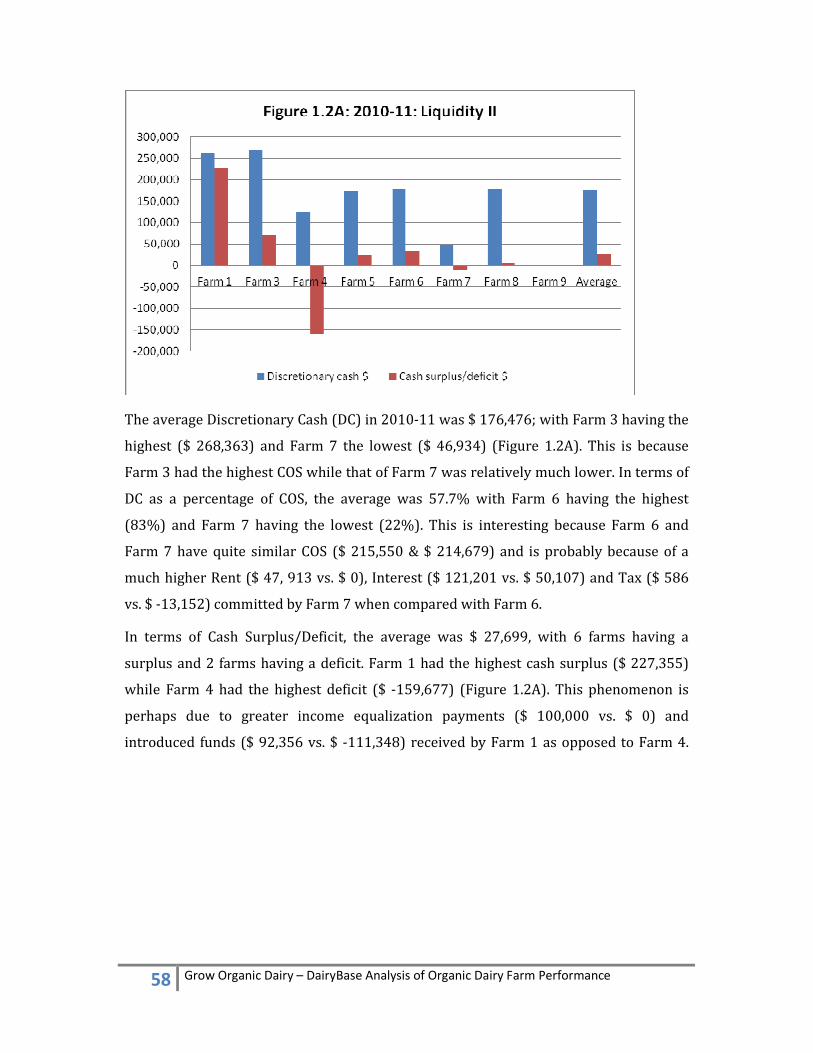
58 Grow Organic Dairy – DairyBase Analysis of Organic Dairy Farm Performance
The average Discretionary Cash (DC) in 2010-11 was $ 176,476; with Farm 3 having the
highest ($ 268,363) and Farm 7 the lowest ($ 46,934) (Figure 1.2A). This is because
Farm 3 had the highest COS while that of Farm 7 was relatively much lower. In terms of
DC as a percentage of COS, the average was 57.7% with Farm 6 having the highest
(83%) and Farm 7 having the lowest (22%). This is interesting because Farm 6 and
Farm 7 have quite similar COS ($ 215,550 & $ 214,679) and is probably because of a
much higher Rent ($ 47, 913 vs. $ 0), Interest ($ 121,201 vs. $ 50,107) and Tax ($ 586
vs. $ -13,152) committed by Farm 7 when compared with Farm 6.
In terms of Cash Surplus/Deficit, the average was $ 27,699, with 6 farms having a
surplus and 2 farms having a deficit. Farm 1 had the highest cash surplus ($ 227,355)
while Farm 4 had the highest deficit ($ -159,677) (Figure 1.2A). This phenomenon is
perhaps due to greater income equalization payments ($ 100,000 vs. $ 0) and
introduced funds ($ 92,356 vs. $ -111,348) received by Farm 1 as opposed to Farm 4.
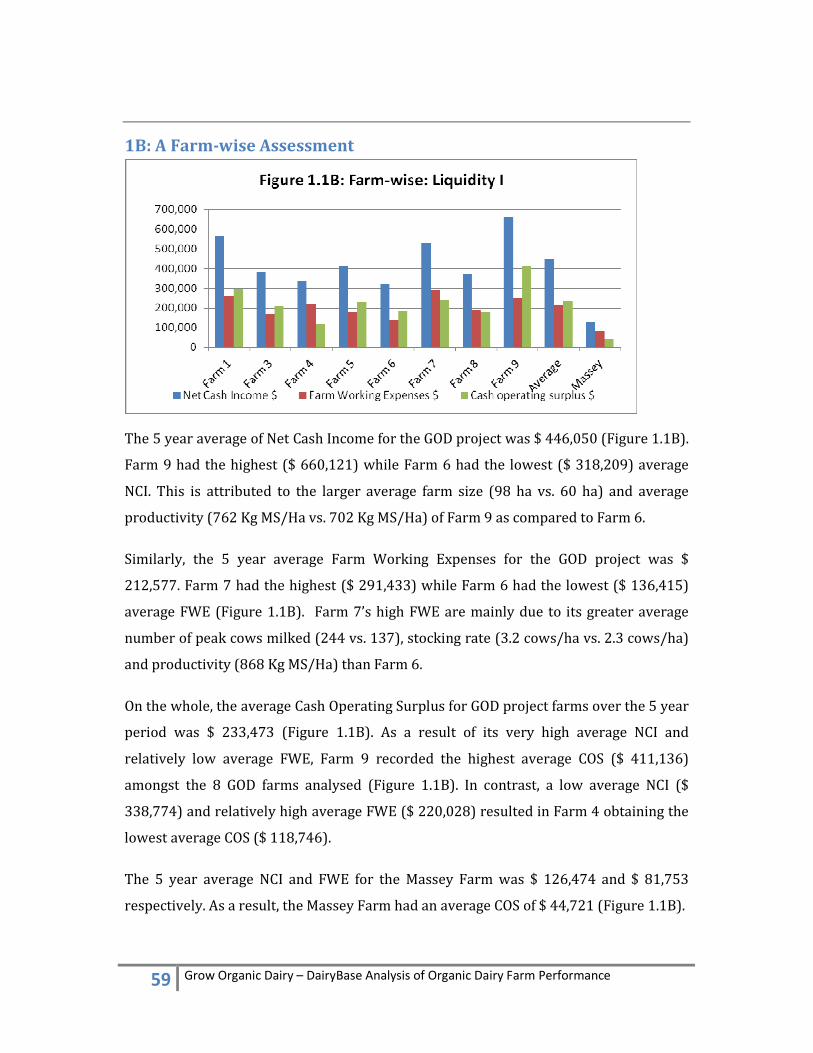
59 Grow Organic Dairy – DairyBase Analysis of Organic Dairy Farm Performance
1B: A Farm-wise Assessment
The 5 year average of Net Cash Income for the GOD project was $ 446,050 (Figure 1.1B).
Farm 9 had the highest ($ 660,121) while Farm 6 had the lowest ($ 318,209) average
NCI. This is attributed to the larger average farm size (98 ha vs. 60 ha) and average
productivity (762 Kg MS/Ha vs. 702 Kg MS/Ha) of Farm 9 as compared to Farm 6.
Similarly, the 5 year average Farm Working Expenses for the GOD project was $
212,577. Farm 7 had the highest ($ 291,433) while Farm 6 had the lowest ($ 136,415)
average FWE (Figure 1.1B). Farm 7’s high FWE are mainly due to its greater average
number of peak cows milked (244 vs. 137), stocking rate (3.2 cows/ha vs. 2.3 cows/ha)
and productivity (868 Kg MS/Ha) than Farm 6.
On the whole, the average Cash Operating Surplus for GOD project farms over the 5 year
period was $ 233,473 (Figure 1.1B). As a result of its very high average NCI and
relatively low average FWE, Farm 9 recorded the highest average COS ($ 411,136)
amongst the 8 GOD farms analysed (Figure 1.1B). In contrast, a low average NCI ($
338,774) and relatively high average FWE ($ 220,028) resulted in Farm 4 obtaining the
lowest average COS ($ 118,746).
The 5 year average NCI and FWE for the Massey Farm was $ 126,474 and $ 81,753
respectively. As a result, the Massey Farm had an average COS of $ 44,721 (Figure 1.1B).

60 Grow Organic Dairy – DairyBase Analysis of Organic Dairy Farm Performance
The 5 year average of Discretionary Cash and Cash Surplus for the GOD project was $
79,955 and $ 40,958 respectively (Figure 1.2B). Farm 3 had the lowest average DC ($ -
43,223) and Farm 7 had the lowest average CS ($ -28,364) (Figure 1.2B). Interestingly,
the average Cash Surplus for Farm 9 (and also Farm 3) is greater than the average
discretionary cash, suggesting significant amount of either (or both) introduced funds
or income equalization payments received.
1C: A Year-wise Assessment
Over the 5 year project duration, the average Net Cash Income of the GOD project has
increased by 115% from 2006-07 ($ 257,230) to 2010-11 ($ 555,447) (Figure 1.1C).
The NCI was greatest in 2010-11 and smallest in 2006-07(Figure 1.1C). The largest year
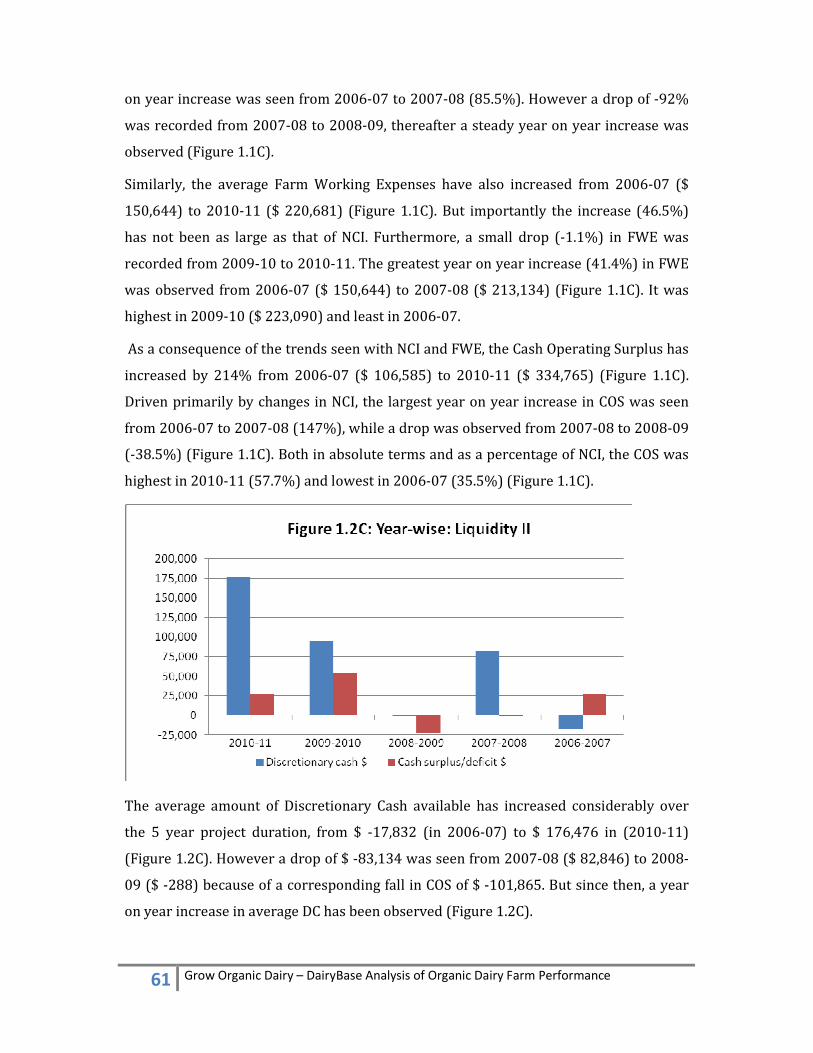
61 Grow Organic Dairy – DairyBase Analysis of Organic Dairy Farm Performance
on year increase was seen from 2006-07 to 2007-08 (85.5%). However a drop of -92%
was recorded from 2007-08 to 2008-09, thereafter a steady year on year increase was
observed (Figure 1.1C).
Similarly, the average Farm Working Expenses have also increased from 2006-07 ($
150,644) to 2010-11 ($ 220,681) (Figure 1.1C). But importantly the increase (46.5%)
has not been as large as that of NCI. Furthermore, a small drop (-1.1%) in FWE was
recorded from 2009-10 to 2010-11. The greatest year on year increase (41.4%) in FWE
was observed from 2006-07 ($ 150,644) to 2007-08 ($ 213,134) (Figure 1.1C). It was
highest in 2009-10 ($ 223,090) and least in 2006-07.
As a consequence of the trends seen with NCI and FWE, the Cash Operating Surplus has
increased by 214% from 2006-07 ($ 106,585) to 2010-11 ($ 334,765) (Figure 1.1C).
Driven primarily by changes in NCI, the largest year on year increase in COS was seen
from 2006-07 to 2007-08 (147%), while a drop was observed from 2007-08 to 2008-09
(-38.5%) (Figure 1.1C). Both in absolute terms and as a percentage of NCI, the COS was
highest in 2010-11 (57.7%) and lowest in 2006-07 (35.5%) (Figure 1.1C).
The average amount of Discretionary Cash available has increased considerably over
the 5 year project duration, from $ -17,832 (in 2006-07) to $ 176,476 in (2010-11)
(Figure 1.2C). However a drop of $ -83,134 was seen from 2007-08 ($ 82,846) to 2008-
09 ($ -288) because of a corresponding fall in COS of $ -101,865. But since then, a year
on year increase in average DC has been observed (Figure 1.2C).
62 Grow Organic Dairy – DairyBase Analysis of Organic Dairy Farm Performance
The average Cash Surplus/Deficit has varied from year to year with no clear trend
emerging (Figure 1.2C). The value in 2010-11 ($ 27,699) was marginally higher than
that in 2006-07 ($ 27,588). There were deficits in two consecutive years, 2007-08 ($ -
435) and 2008-09 ($ -21,371) and the highest surplus was observed in 2009-10 ($
54,432).

63 Grow Organic Dairy – DairyBase Analysis of Organic Dairy Farm Performance
2.0 Profitability
2A: The 2010-11 Season Assessment
For the 2010-11 season, the average Gross Farm Revenue on a per hectare basis
(GFR/ha) was $ 6577/ha for the GOD project, while that for the benchmark was $ 17
lesser ($ 6560/ha) (Figure 2.1A). Amongst GOD project farms, Farm 3 had the highest ($
9404/ha) and Farm 5 has the lowest ($ 4361) GFR/ha. Of the 8 farms analysed, 4 of the
Farms had a GFR that was higher than that of the benchmark. The GFR/ha for the
Massey farm ($ 7708/ha) was also greater than the benchmark.
In terms of expenses, the average Operating Expenses per hectare (OE/ha) of the GOD
project ($ 3664/ha) was lesser than the benchmark figure ($ 4199/ha) (Figure 2.1A).
Farm 1 had the least expenses ($ 2104/ha) while Farm 7 had the highest ($ 5884/ha). 5
out of the 8 farms had an OE/ha figure that was lower than the benchmark. But the
Massey farm had a marginally higher OE/ha ($ 4340) than the benchmark.
The average Operating Profit (OP) (or Economic Farm Surplus (EFS)) per hectare for
the GOD project ($ 2912/ha) was 19% higher than the benchmark figure ($
2361/ha)(Figure 2.1A). Farm 3 had the highest OP/ha ($ 6726/ha) by a fair margin,
while Farm 7 had the lowest ($ 1064/ha). Importantly, of the 8 farms analysed, 4 had an
OP/ha that was higher than the benchmark figure. As a result of its relatively high
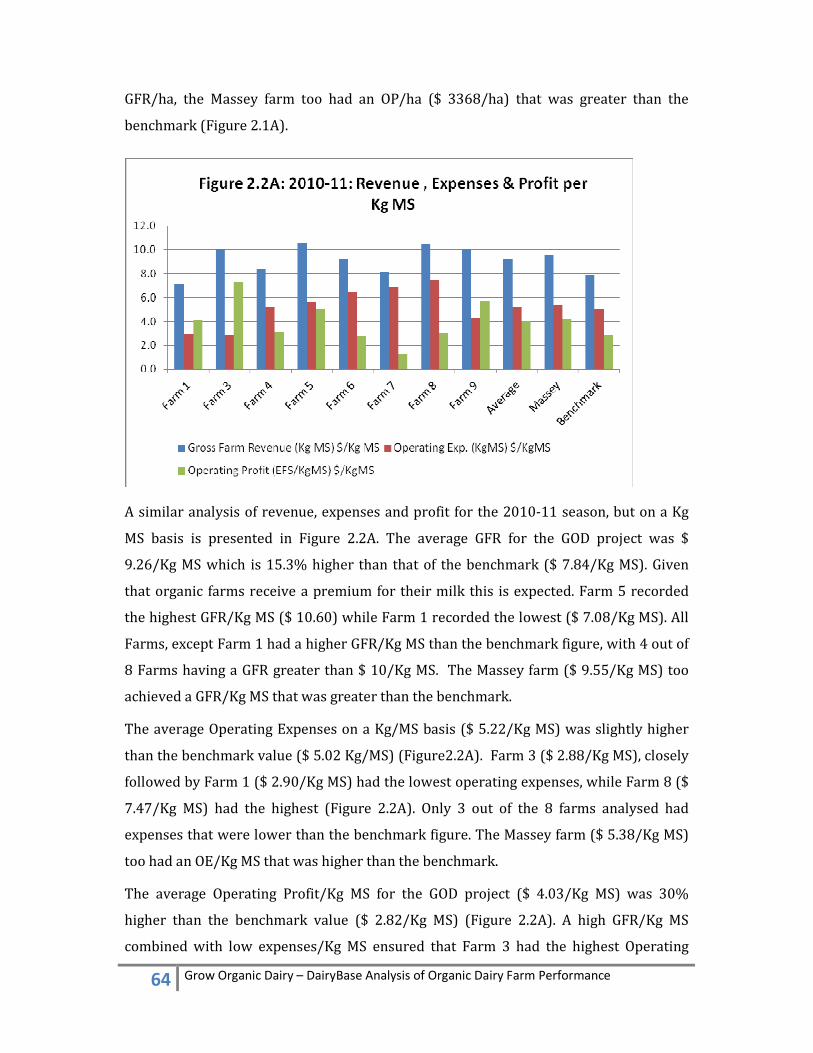
64 Grow Organic Dairy – DairyBase Analysis of Organic Dairy Farm Performance
GFR/ha, the Massey farm too had an OP/ha ($ 3368/ha) that was greater than the
benchmark (Figure 2.1A).
A similar analysis of revenue, expenses and profit for the 2010-11 season, but on a Kg
MS basis is presented in Figure 2.2A. The average GFR for the GOD project was $
9.26/Kg MS which is 15.3% higher than that of the benchmark ($ 7.84/Kg MS). Given
that organic farms receive a premium for their milk this is expected. Farm 5 recorded
the highest GFR/Kg MS ($ 10.60) while Farm 1 recorded the lowest ($ 7.08/Kg MS). All
Farms, except Farm 1 had a higher GFR/Kg MS than the benchmark figure, with 4 out of
8 Farms having a GFR greater than $ 10/Kg MS. The Massey farm ($ 9.55/Kg MS) too
achieved a GFR/Kg MS that was greater than the benchmark.
The average Operating Expenses on a Kg/MS basis ($ 5.22/Kg MS) was slightly higher
than the benchmark value ($ 5.02 Kg/MS) (Figure2.2A). Farm 3 ($ 2.88/Kg MS), closely
followed by Farm 1 ($ 2.90/Kg MS) had the lowest operating expenses, while Farm 8 ($
7.47/Kg MS) had the highest (Figure 2.2A). Only 3 out of the 8 farms analysed had
expenses that were lower than the benchmark figure. The Massey farm ($ 5.38/Kg MS)
too had an OE/Kg MS that was higher than the benchmark.
The average Operating Profit/Kg MS for the GOD project ($ 4.03/Kg MS) was 30%
higher than the benchmark value ($ 2.82/Kg MS) (Figure 2.2A). A high GFR/Kg MS
combined with low expenses/Kg MS ensured that Farm 3 had the highest Operating
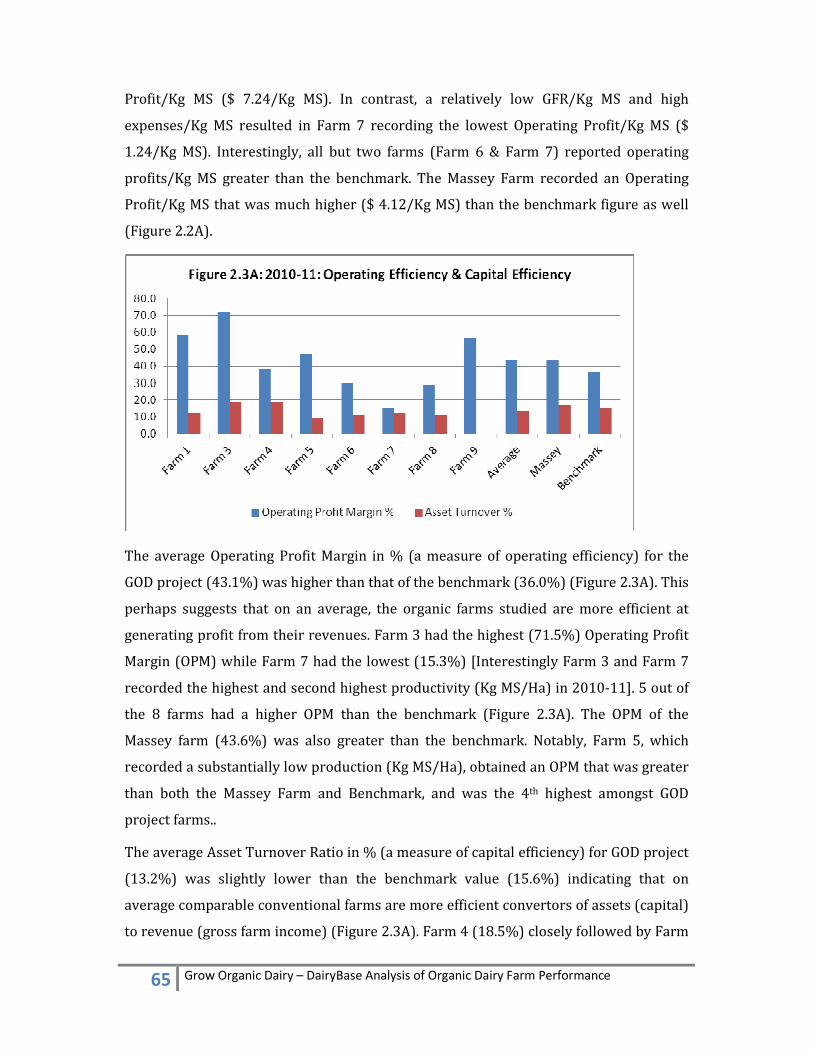
65 Grow Organic Dairy – DairyBase Analysis of Organic Dairy Farm Performance
Profit/Kg MS ($ 7.24/Kg MS). In contrast, a relatively low GFR/Kg MS and high
expenses/Kg MS resulted in Farm 7 recording the lowest Operating Profit/Kg MS ($
1.24/Kg MS). Interestingly, all but two farms (Farm 6 & Farm 7) reported operating
profits/Kg MS greater than the benchmark. The Massey Farm recorded an Operating
Profit/Kg MS that was much higher ($ 4.12/Kg MS) than the benchmark figure as well
(Figure 2.2A).
The average Operating Profit Margin in % (a measure of operating efficiency) for the
GOD project (43.1%) was higher than that of the benchmark (36.0%) (Figure 2.3A). This
perhaps suggests that on an average, the organic farms studied are more efficient at
generating profit from their revenues. Farm 3 had the highest (71.5%) Operating Profit
Margin (OPM) while Farm 7 had the lowest (15.3%) [Interestingly Farm 3 and Farm 7
recorded the highest and second highest productivity (Kg MS/Ha) in 2010-11]. 5 out of
the 8 farms had a higher OPM than the benchmark (Figure 2.3A). The OPM of the
Massey farm (43.6%) was also greater than the benchmark. Notably, Farm 5, which
recorded a substantially low production (Kg MS/Ha), obtained an OPM that was greater
than both the Massey Farm and Benchmark, and was the 4th highest amongst GOD
project farms..
The average Asset Turnover Ratio in % (a measure of capital efficiency) for GOD project
(13.2%) was slightly lower than the benchmark value (15.6%) indicating that on
average comparable conventional farms are more efficient convertors of assets (capital)
to revenue (gross farm income) (Figure 2.3A). Farm 4 (18.5%) closely followed by Farm

66 Grow Organic Dairy – DairyBase Analysis of Organic Dairy Farm Performance
3 (18.4%) had the highest Asset Turnover Ratio (ATR), while Farm 5 had the lowest
(8.7%) [Farm 3 and Farm 4 recorded the highest and 3rd highest productivity (Kg
MS/Ha, while Farm 5 recorded the lowest). Interestingly only 2 farms (Farm 3 & 4)
obtained a better ATR than the benchmark. Additionally, the Massey farm too achieved
an ATR (17.1%) that was greater than the benchmark (Figure 2.3A).
The average operating return on dairy assets for the GOD project (5.7%) was slightly
higher than that for benchmark farms (5.4%) (Figure 2.4A). Farm 3, by far had the
highest (13.2%) operating return on dairy assets while Farm 7 had the lowest (1.5%).
Only 3 farms (Farm 1, 3 & 4) and the Massey farm (7.5%) had an operating return on
dairy assets greater than the benchmark value.
Similarly, the average total return on assets for the GOD project (7.7%) was marginally
higher than that for the benchmark farms (7.3%) (Figure 2.4A). Once again Farm 3 had
the highest (15.9%) while Farm 7 had the lowest (3.7%); and 3 out of the 8 farms
studied (Farm 1, 3 & 4) had an total return on assets greater than the benchmark value
(Figure 2.4A).
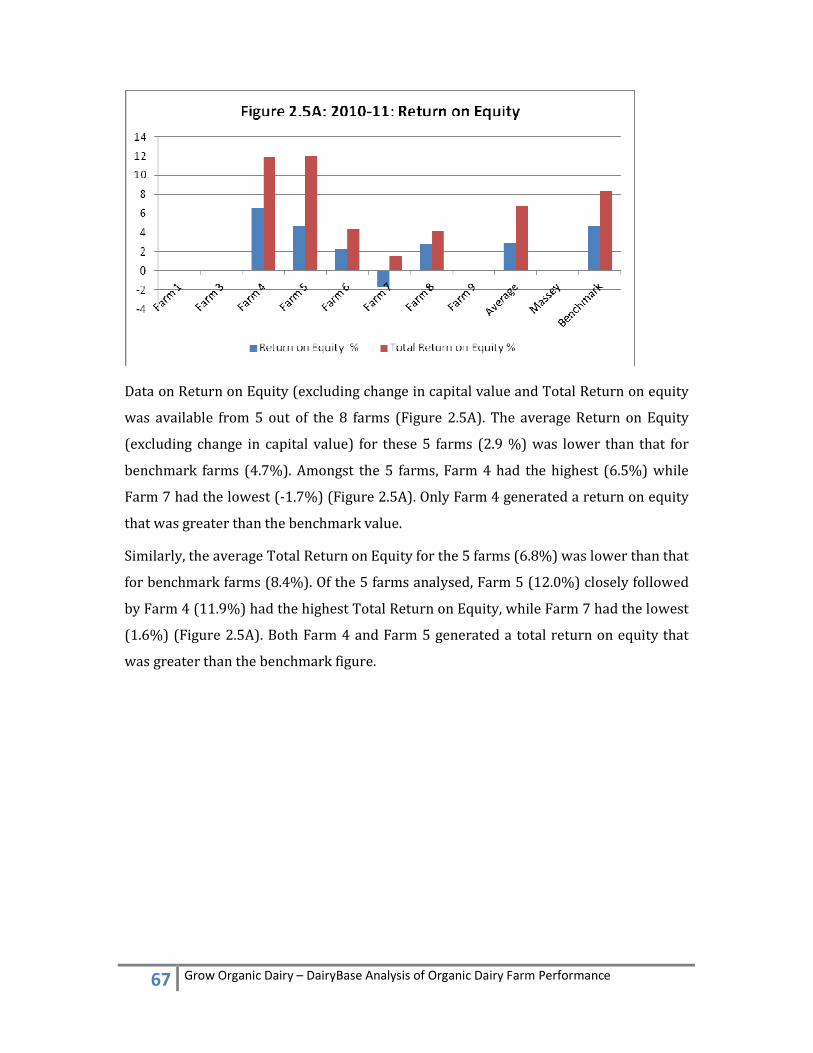
67 Grow Organic Dairy – DairyBase Analysis of Organic Dairy Farm Performance
Data on Return on Equity (excluding change in capital value and Total Return on equity
was available from 5 out of the 8 farms (Figure 2.5A). The average Return on Equity
(excluding change in capital value) for these 5 farms (2.9 %) was lower than that for
benchmark farms (4.7%). Amongst the 5 farms, Farm 4 had the highest (6.5%) while
Farm 7 had the lowest (-1.7%) (Figure 2.5A). Only Farm 4 generated a return on equity
that was greater than the benchmark value.
Similarly, the average Total Return on Equity for the 5 farms (6.8%) was lower than that
for benchmark farms (8.4%). Of the 5 farms analysed, Farm 5 (12.0%) closely followed
by Farm 4 (11.9%) had the highest Total Return on Equity, while Farm 7 had the lowest
(1.6%) (Figure 2.5A). Both Farm 4 and Farm 5 generated a total return on equity that
was greater than the benchmark figure.
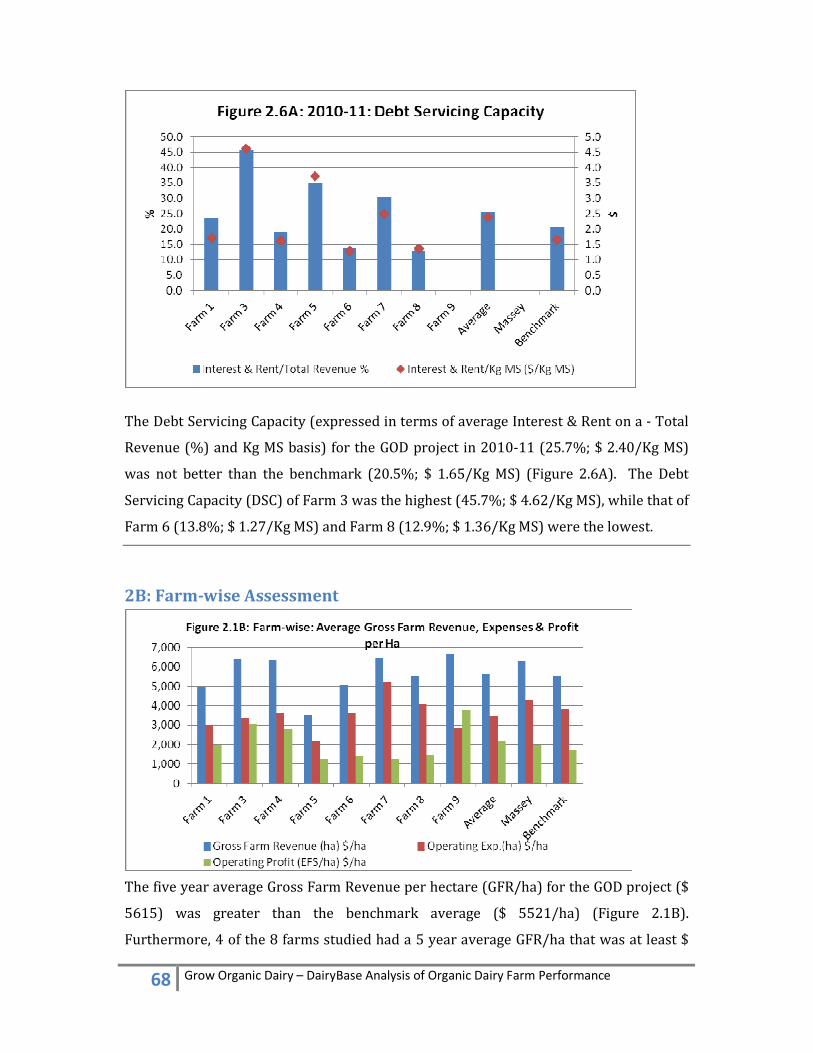
68 Grow Organic Dairy – DairyBase Analysis of Organic Dairy Farm Performance
The Debt Servicing Capacity (expressed in terms of average Interest & Rent on a - Total
Revenue (%) and Kg MS basis) for the GOD project in 2010-11 (25.7%; $ 2.40/Kg MS)
was not better than the benchmark (20.5%; $ 1.65/Kg MS) (Figure 2.6A). The Debt
Servicing Capacity (DSC) of Farm 3 was the highest (45.7%; $ 4.62/Kg MS), while that of
Farm 6 (13.8%; $ 1.27/Kg MS) and Farm 8 (12.9%; $ 1.36/Kg MS) were the lowest.
2B: Farm-wise Assessment
The five year average Gross Farm Revenue per hectare (GFR/ha) for the GOD project ($
5615) was greater than the benchmark average ($ 5521/ha) (Figure 2.1B).
Furthermore, 4 of the 8 farms studied had a 5 year average GFR/ha that was at least $

69 Grow Organic Dairy – DairyBase Analysis of Organic Dairy Farm Performance
850/ha greater than the benchmark average. The Massey farm too had a higher average
GFR/ha ($ 6279/ha) than the benchmark. These suggest that (with regards to revenue),
the higher milk price (or premium) compensated for the lower production of most of
the organic farms. Amongst the 8 farms, Farm 9 had the highest average GFR/ha ($
6643/ha) while Farm 5 had the lowest ($ 3498) (Figure 2.1B).
The five year average Operating Expenses per hectare (OE/ha) for the GOD project ($
3484/ha) was lesser than the benchmark average ($ 3839/ha) (Figure 2.1B).
Additionally, 6 of the 8 farms studied had an average OE/ha that were lesser than
benchmark average. Farm 7 had the highest average OE/ha ($ 5182) while Farm 5 had
the lowest ($ 2217). The average OE/ha of the Massey farm ($ 4288/ha) was higher
than the benchmark average (Figure 2.1B).
As a result of a higher average GFR/ha and lower average OE/ha, the average Operating
Profit per hectare (OP/ha) for the GOD project ($ 2134/ha) was 26.8% greater than the
benchmark average ($ 1682/ha) (Figure 2.1B). Moreover, 4 of the 8 farms studied had
an average OP/ha that was greater than the benchmark average. Farm 9 had the highest
average OP/ha ($ 3799/ha) while Farm 5 had the lowest ($ 1280/ha) (Figure 2.1B).
Although the Massey farm had a high average OE/ha, its average OP/ha ($ 1990/ha)
was greater than the benchmark average due to a high average GFR/ha.
The 5 year average Gross Farm Revenue (GFR) in terms of Kilograms Milk-solids (Kg
MS) for the GOD project ($ 7.73/Kg MS) was 18.6% greater than the benchmark average

70 Grow Organic Dairy – DairyBase Analysis of Organic Dairy Farm Performance
($ 6.51/Kg MS) (Figure 2.2B). As expected (due to a price premium paid for organic
milk), the average GFR/Kg MS of all 8 farms studied was greater than the benchmark
average. However, the distribution is interesting - Farm 9 had an average GFR/Kg MS ($
8.75/Kg MS) that was 33% greater than the benchmark average, whereas that of Farm 1
($ 6.93) was only marginally 5.9% greater (Figure 2.2B). The average GFR/Kg MS for
the Massey Farm ($ 8.03/Kg MS) was $ 1.49/Kg MS greater than the benchmark
average.
The 5 year average Operating Expenses/Kg MS for the GOD project ($ 4.84) was slightly
greater (6.9%) than that benchmark average ($ 4.53/Kg MS) (Figure 2.2B). Out of the 8
farms studied, 4 had an average OE/Kg MS that was lesser than the benchmark average.
Farm 7 ($6.10/Kg MS) had the highest average OE/Kg MS while Farm 3 had the lowest
($ 3.71/Kg MS) (Figure 2.2B). The average OE/Kg MS for the Massey farm ($ 5.39/Kg
MS) was higher than the benchmark average.
Due to a much greater average GFR/Kg MS and only slightly greater average OE/Kg MS
(as discussed above), the 5 year average Operating Profit/Kg MS for the GOD project ($
2.94/Kg MS) was higher than the benchmark average ($ 2.00/Kg MS) (Figure 2.2B).
Importantly, 7 out of the 8 farms studied had an average OP/Kg MS that was greater
than the benchmark average. Farm 9 achieved the highest average operating profit/Kg
MS ($ 4.97/Kg MS), while Farm 7 had the lowest ($ 1.52/Kg MS) (Figure 2.2B). The
average Operating Profit/Kg MS for the Massey farm ($ 2.64/Kg MS) was also greater
than the benchmark average.
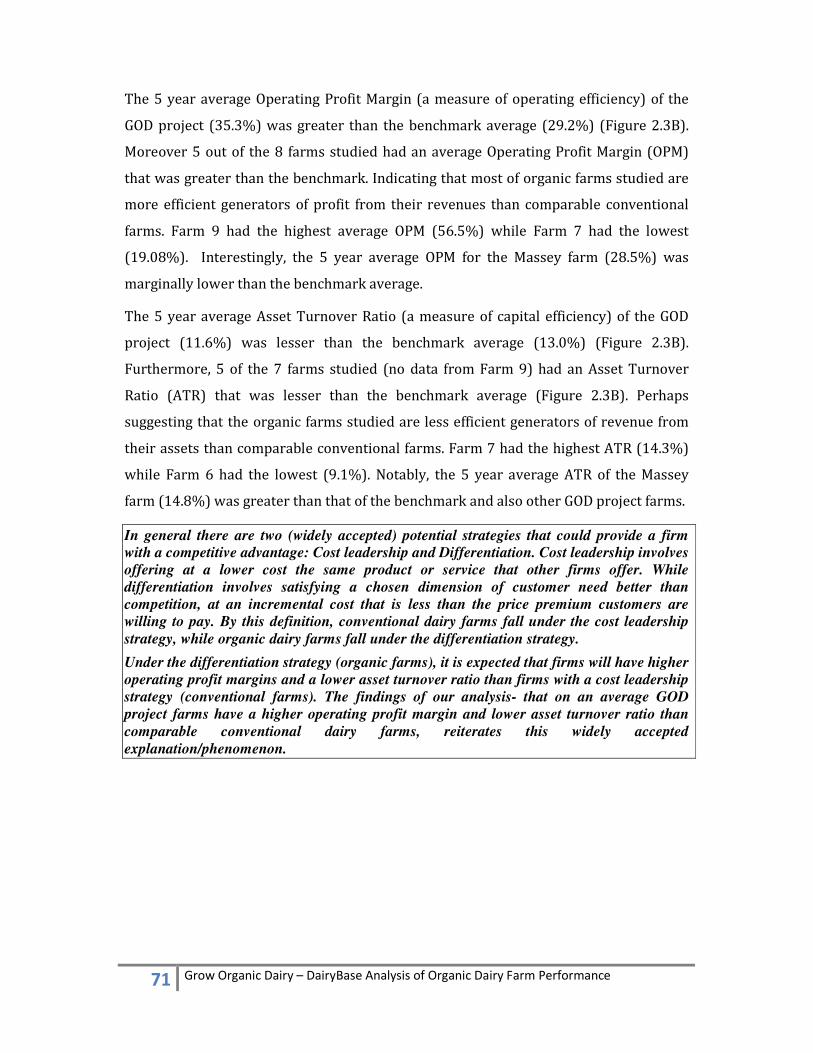
71 Grow Organic Dairy – DairyBase Analysis of Organic Dairy Farm Performance
The 5 year average Operating Profit Margin (a measure of operating efficiency) of the
GOD project (35.3%) was greater than the benchmark average (29.2%) (Figure 2.3B).
Moreover 5 out of the 8 farms studied had an average Operating Profit Margin (OPM)
that was greater than the benchmark. Indicating that most of organic farms studied are
more efficient generators of profit from their revenues than comparable conventional
farms. Farm 9 had the highest average OPM (56.5%) while Farm 7 had the lowest
(19.08%). Interestingly, the 5 year average OPM for the Massey farm (28.5%) was
marginally lower than the benchmark average.
The 5 year average Asset Turnover Ratio (a measure of capital efficiency) of the GOD
project (11.6%) was lesser than the benchmark average (13.0%) (Figure 2.3B).
Furthermore, 5 of the 7 farms studied (no data from Farm 9) had an Asset Turnover
Ratio (ATR) that was lesser than the benchmark average (Figure 2.3B). Perhaps
suggesting that the organic farms studied are less efficient generators of revenue from
their assets than comparable conventional farms. Farm 7 had the highest ATR (14.3%)
while Farm 6 had the lowest (9.1%). Notably, the 5 year average ATR of the Massey
farm (14.8%) was greater than that of the benchmark and also other GOD project farms.
In general there are two (widely accepted) potential strategies that could provide a firm
with a competitive advantage: Cost leadership and Differentiation. Cost leadership involves
offering at a lower cost the same product or service that other firms offer. While
differentiation involves satisfying a chosen dimension of customer need better than
competition, at an incremental cost that is less than the price premium customers are
willing to pay. By this definition, conventional dairy farms fall under the cost leadership
strategy, while organic dairy farms fall under the differentiation strategy.
Under the differentiation strategy (organic farms), it is expected that firms will have higher
operating profit margins and a lower asset turnover ratio than firms with a cost leadership
strategy (conventional farms). The findings of our analysis- that on an average GOD
project farms have a higher operating profit margin and lower asset turnover ratio than
comparable conventional dairy farms, reiterates this widely accepted
explanation/phenomenon.

72 Grow Organic Dairy – DairyBase Analysis of Organic Dairy Farm Performance
The 5 year average Operating Return (OR) on dairy assets for the GOD project (3.9%)
was marginally greater than the benchmark average (3.8%). However, 3 out of the 7
farms analysed had a considerably greater average OR on dairy assets than the
benchmark. Farm 3 had the highest (6.0%), while Farm 7 had the lowest (2.4%) average
OR on dairy assets (Figure 2.4B). The 5 year average OR on Dairy Assets for the Massey
farm (4.6%) was lower than the benchmark average.
The 5 year average Total Return (TR) on Assets of the GOD project (5.1%) was lesser
than the benchmark average (5.7%) (Figure 2.4B). However, 4 out the 7 farms analysed
had an average TR on Assets that was greater than the benchmark, with Farm 5
recording the highest (11.6%). Of the 3 farms that had a TR on assets that were lesser
than the benchmark, 2 farms had an average value that was negative (Figure 2.4B).
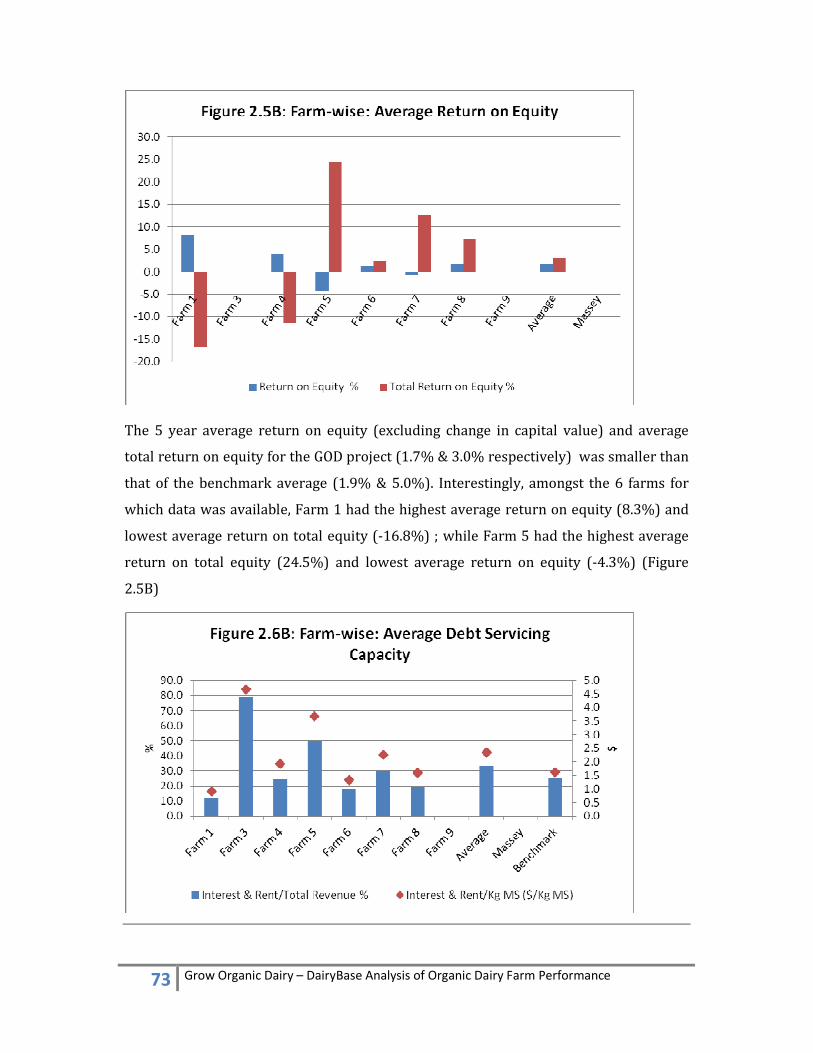
73 Grow Organic Dairy – DairyBase Analysis of Organic Dairy Farm Performance
The 5 year average return on equity (excluding change in capital value) and average
total return on equity for the GOD project (1.7% & 3.0% respectively) was smaller than
that of the benchmark average (1.9% & 5.0%). Interestingly, amongst the 6 farms for
which data was available, Farm 1 had the highest average return on equity (8.3%) and
lowest average return on total equity (-16.8%) ; while Farm 5 had the highest average
return on total equity (24.5%) and lowest average return on equity (-4.3%) (Figure
2.5B)

74 Grow Organic Dairy – DairyBase Analysis of Organic Dairy Farm Performance
The 5 year average Debt Servicing Capacity (expressed in terms of average Interest &
Rent on a - Total Revenue (%) and Kg MS basis) for the GOD project (33.3%; $ 2.34/kg
MS) was worse than the benchmark average (24.6%; $ 1.61/Kg MS). Amongst the 7
farms analysed, the average DSC of Farm 3 (79.1%; $ 4.66/Kg MS) was the highest,
while that of Farm 1 (12.5%; $ 0.91/Kg MS) was the lowest.
2C: Year-wise Assessment
Over the 5 year duration of the project, the average Gross Farm Revenue/ha increased
by 87% from 2006-07 ($ 3515/ha) to 2010-11 ($ 6576/ha). Apart from a substantial
increase in 2007-08 ($ 2989) followed by a drop in 2008-09 ($ - 1,918), steady year on
year increases have been observed. The year on year differences in GFR/ha is primarily
a reflection of the variability in milk price and milk production. The GFR/ha was highest
in 2010-11 and lowest in 2006-07 (Figure 2.1C).
Although average Operating Expenses/ha have increased by 37% from 2006-07 ($
2670/ha) to 2010-11 ($ 3664/ha), it has remained more or less the same from 2007-08
($ 3560/ha) onwards (Figure 2.1C). Indicating that the organic farmers participating in
the GOD project have achieved a good degree of consistency and control over their
operating expenses. It was highest in 2010-11 and lowest in 2006-07.
As a consequence of the trends observed with GFR/ha and OE/ha, Operating Profits/ha
have increased by 237% ($ 2050/ha) from 2006-07 ($ 862/ha) to 2010-11 ($ 2912/ha).

75 Grow Organic Dairy – DairyBase Analysis of Organic Dairy Farm Performance
Interestingly, the Operating Profit/ha in 2007-08 ($ 2944/ha) was marginally higher
than that in 2010-11, due to slightly lower operating expenses (Figure 2.1C).
When expressed in terms of Kilogram Milk Solids, the Gross Farm Revenue has
increased by 116% from 2006-07 ($ 4.28/Kg MS) to 2010-11 ($ 9.26/Kg MS), and it was
highest in 2007-08 ($ 9.30/Kg MS) (Figure 2.2C). During the same period, the increase
in Operating Expenses from 2006-07 ($ 3.23/Kg MS) to 2010-11 ($ 5.22/Kg MS) was
lesser (67%). As a consequence of these trends, the Operating Profit increased by 280%
from 2006-07 ($ 1.06/Kg MS) to 2010-11 ($ 4.03/Kg MS) (Figure 2.2C).

76 Grow Organic Dairy – DairyBase Analysis of Organic Dairy Farm Performance
The average Operating Profit margin for the GOD project increased from 21.7% (2006-
07) to 43.1% (2010-11), with the highest being achieved in 2007-08 (44.1%) (Figure
2.3C). Similarly, the Asset Turnover ratio too increased (by a smaller degree) from
2006-07 (8.5%) to 2010-11 (13.2%), with the highest ratio once again being recorded
in 2007-08 (13.7%) (Figure 2.3C). Although there was a significant drop in both
measures from 2007-08 to 2008-09, there has been a consistent year on year
improvement in both operating efficiency and capital efficiency since then.
The average Operating Return on dairy assets was highest in 2010-11 (5.8%). This is
nearly thrice what it was in 2006-07 (2.0%) and little over 4 times what it was in 2008-
09 (1.4%) (Figure 2.4C). However, the average Total Return on assets in 2010-11
(7.8%) was lower than what it was in 2006-07 (9.2%) (Figure 2.4C). The highest
average total return on assets was recorded in 2007-08 (14.6%) and lowest in 2008-09
($ - 5.3%). Once again, since 2008-09, a clear year on year improvement in operating
return on dairy assets and total return on assets is observed (Figure 2.4C).

77 Grow Organic Dairy – DairyBase Analysis of Organic Dairy Farm Performance
The average Return on Equity (excluding change in capital value) in 2010-11 (2.9%)
was greater than what it was in 2006-07 (-0.6%). During the 5 year project period, it
was at its highest in 2007-08 (3.0%) and lowest in 2008-09 (-1.3%) (Figure 2.5C). Since
the low in 2008-09 a steady year on year improvement is observed.
The average Total Return on Equity in 2010-11 (6.8%) was considerably lower than
what it was in 2006-07 (17.5%). It was highest in 2007-08 (29.0%) and lowest the
following year (-20.2%). Once again, since the substantial low in 2008-09, a significant
year on year improvement in TR on Equity is observed (Figure 2.5C).
The Debt Servicing Capacity of the GOD project (in terms of Interest & Rent as a
percentage of Total Revenue) has been below 50% for all 5 years. It was best in 2010-11
(25.1%) and worst in 2008-08 (45.5%). But in terms of Interest & Rent per Kg MS it was
best in 2006-07 ($ 1.56/Kg MS) and worst in 2007-08 ($ 2.68/Kg MS).

78 Grow Organic Dairy – DairyBase Analysis of Organic Dairy Farm Performance
3.0 Wealth
3A: The 2010-11 Season Assessment
For the 2010-11 season, the average Growth in Equity for the GOD project in
value and percentage terms was $ 150,910 and 15.2% respectively (Figure 3.1A).
This is greater than the Growth in Equity in percentage terms for benchmark
farms (8.7%) [No data on benchmark farms in value terms was available]. Farm
1 recorded the highest growth ($ 395,615; 62.1%) while Farm 7 had the lowest
growth ($ 20,351; (0.7%) (Figure 3.1A). No data was available for Farm 9.
The average Equity Growth for the GOD project from Profit and Capital was $
26,008 and $ 124,902 (Figure 3.2A). Farm 8 had the highest equity growth from
Profit ($ 95,205) while Farm 7 had the lowest ($ - 105,175). In terms of Equity
Growth from Capital, Farm 1 recorded the highest ($ 346,419) while Farm 4

79 Grow Organic Dairy – DairyBase Analysis of Organic Dairy Farm Performance
recorded the lowest ($ -22,072). Interestingly, the equity growth from profit
(retentions) was greater than that from capital for two (Farm 4 & 8) of the 7
farms analysed (Figure 3.2A).
In 2010-11, the average closing Total Assets ($ 4, 133,029) was greater than the
average closing Total Liabilities ($ 2,490,067) for the GOD project (Figure 3.3A).
However, the average debt to asset ratio (%) for the GOD project (57.6%) was
higher than that of the benchmark (40.7%). Farm 5 had the highest value of
closing total assets ($ 6,733,115), while Farm 4 had the lowest ($ 2,538,425)
(Figure 3.3A). In terms of closing total liabilities, Farm 1 had the highest ($
5,160,554) while Farm 8 had the lowest ($ 589,665). Interestingly, Total
Liabilities exceeded Total Assets for two (Farm 1 & 3) of the 7 farms analysed.
The debt to asset ratio of Farm 1 and Farm 3 were 104.9% and 113.6%
respectively [Notably, the Debt Servicing Capacity for Farm 1 & 3 was 23.6% &
45.7% in 2010-11]. The farms with the smallest debt to asset ratio were Farm 8
(15.2%) and Farm 6 (18.4%) respectively.
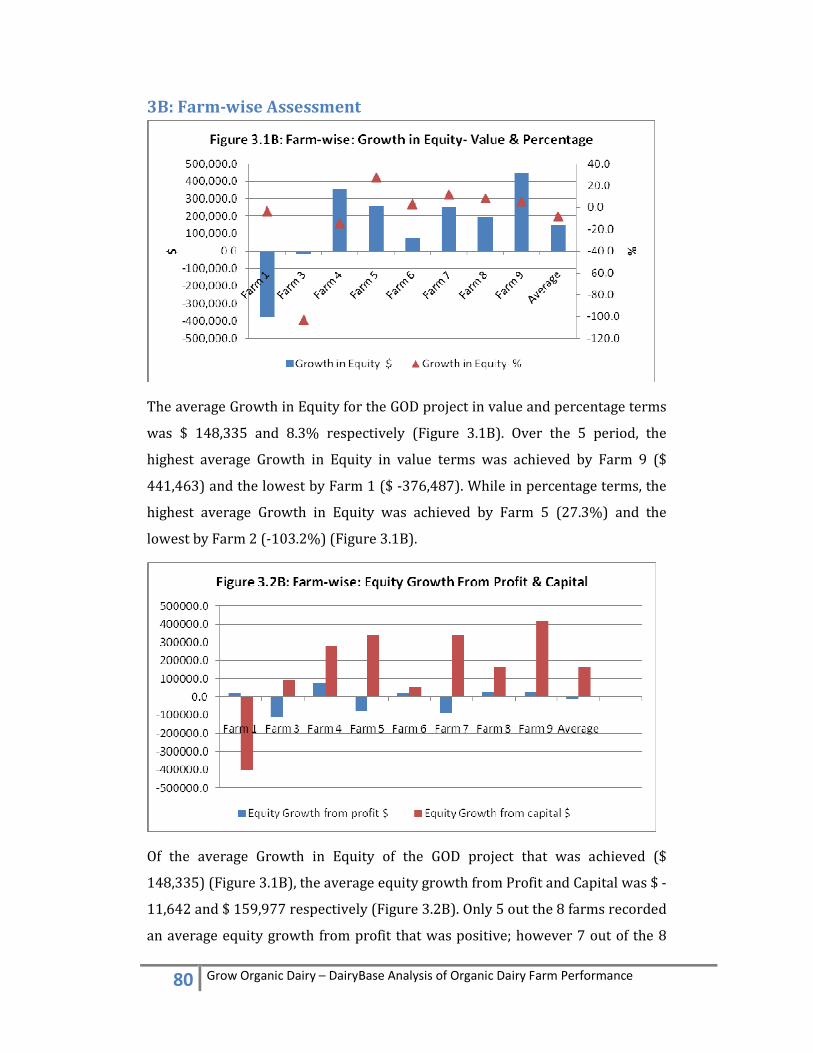
80 Grow Organic Dairy – DairyBase Analysis of Organic Dairy Farm Performance
3B: Farm-wise Assessment
The average Growth in Equity for the GOD project in value and percentage terms
was $ 148,335 and 8.3% respectively (Figure 3.1B). Over the 5 period, the
highest average Growth in Equity in value terms was achieved by Farm 9 ($
441,463) and the lowest by Farm 1 ($ -376,487). While in percentage terms, the
highest average Growth in Equity was achieved by Farm 5 (27.3%) and the
lowest by Farm 2 (-103.2%) (Figure 3.1B).
Of the average Growth in Equity of the GOD project that was achieved ($
148,335) (Figure 3.1B), the average equity growth from Profit and Capital was $ -
11,642 and $ 159,977 respectively (Figure 3.2B). Only 5 out the 8 farms recorded
an average equity growth from profit that was positive; however 7 out of the 8
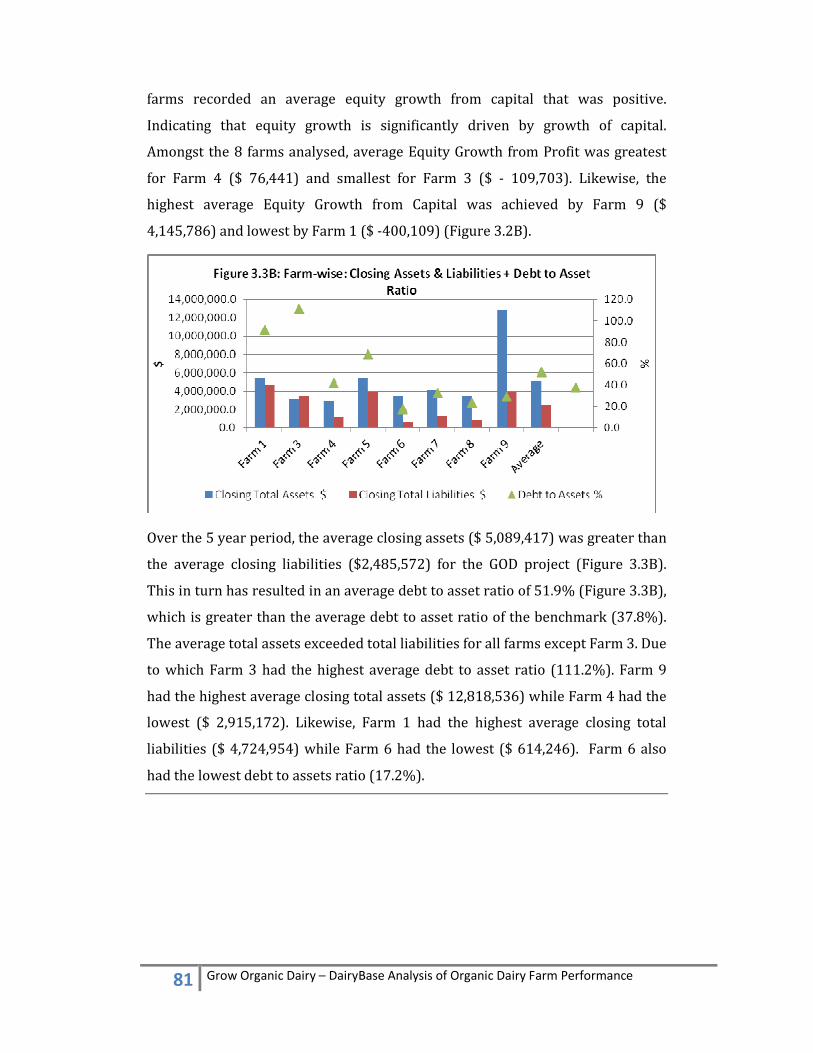
81 Grow Organic Dairy – DairyBase Analysis of Organic Dairy Farm Performance
farms recorded an average equity growth from capital that was positive.
Indicating that equity growth is significantly driven by growth of capital.
Amongst the 8 farms analysed, average Equity Growth from Profit was greatest
for Farm 4 ($ 76,441) and smallest for Farm 3 ($ - 109,703). Likewise, the
highest average Equity Growth from Capital was achieved by Farm 9 ($
4,145,786) and lowest by Farm 1 ($ -400,109) (Figure 3.2B).
Over the 5 year period, the average closing assets ($ 5,089,417) was greater than
the average closing liabilities ($2,485,572) for the GOD project (Figure 3.3B).
This in turn has resulted in an average debt to asset ratio of 51.9% (Figure 3.3B),
which is greater than the average debt to asset ratio of the benchmark (37.8%).
The average total assets exceeded total liabilities for all farms except Farm 3. Due
to which Farm 3 had the highest average debt to asset ratio (111.2%). Farm 9
had the highest average closing total assets ($ 12,818,536) while Farm 4 had the
lowest ($ 2,915,172). Likewise, Farm 1 had the highest average closing total
liabilities ($ 4,724,954) while Farm 6 had the lowest ($ 614,246). Farm 6 also
had the lowest debt to assets ratio (17.2%).

82 Grow Organic Dairy – DairyBase Analysis of Organic Dairy Farm Performance
3C: Year-wise Assessment
Over the 5 year period, the highest average year on year Growth in Equity both in
value and percentage terms was observed in 2007-08 ($ 604,546; 28.6%), while
the lowest (negative) growth was recorded in 2008-09 ($-545,283; -110.4%)
(Figure 3.1C). The growth achieved in 2010-11 ($ 150,910; 15.2%) was smaller
than that achieved in 2006-07 ($ 254,669; 21.8%) (Figure 3.1C). Importantly,
since the substantial drop in 2008-09, a clear year on year Growth in Equity was
observed.
During the 5 year period, the highest average Equity Growth from Profit was
achieved in 2010-11 ($ 26,008) and the highest average Equity Growth from
Capital was recorded in 2007-08 ($ 580,856%) (Figure 3.2C). For those two
years, the ratio of profit to capital contribution towards equity growth was 0.20

83 Grow Organic Dairy – DairyBase Analysis of Organic Dairy Farm Performance
and 0.04. Clearly suggesting that its capital (rather than profit) that drove equity
growth for the GOD project farms, and very little profit is retained by the farms.
Over the 5 year project period, the average Total Assets at closing was greater
than the average Total Liabilities at closing for each year. As a result the average
debt to assets ratio never exceeded the critical 100% mark. However, it has
increased from 2006-07 (43.3%) to 2010-11 (57.6%), with the highest being
60.8% (2008-09) (Figure 3.3C). The average total assets at closing were highest
in 2007-08 ($ 5,225,973) and lowest in 2006-07 ($ 3,211,842). While the average
total liabilities at closing were highest in 2008-09 ($ 2,477,988) and lowest in
2006-07 ($ 1,672,692) (Figure 3.3C).