Embed Size (px)
Citation preview

CIR1016
Dairy Manure Management: Strategies for Recycling Nutrients to Recover Fertilizer Value and Avoid Environmental Pollution 1
H.H. Van Horn, G.L. Newton, R.A. Nordstedt, E.C. French, G. Kidder, D.A. Graetz, and C.F. Chambliss2
1. This document is CIR1016, one of a series of the Animal Science Department, Florida Cooperative Extension Service, Institute of Food and Agricultural Sciences, University of Florida. Original publication date November 1990. Reviewed June 2003. Visit the EDIS Web Site at http://edis.ifas.ufl.edu.
2. H.H. Van Horn, professor, Dairy and Poultry Dept.; R.A. Nordstedt, professor, Agric. and Biological Engineering Dept.; E.C. French, associate professor, Agronomy Dept.; G. Kidder, professor, Soil and Water Science; D.A. Graetz, professor, Soil and Water Science Dept.; C.F. Chambliss, associate professor, Agronomy Dept., Cooperative Extension Service, Institute of Food and Agricultural Sciences, University of Florida, Gainesville, 32611. G.L. Newton, research scientist, Animal Science Dept, University of Georgia Coastal Plain Experiment Station, Tifton, GA.
The Institute of Food and Agricultural Sciences (IFAS) is an Equal Opportunity Institution authorized to provide research, educational information and other services only to individuals and institutions that function with non-discrimination with respect to race, creed, color, religion, age, disability, sex, sexual orientation, marital status, national origin, political opinions or affiliations. U.S. Department of Agriculture, Cooperative Extension Service, University of Florida, IFAS, Florida A. & M. University Cooperative Extension Program, and Boards of County Commissioners Cooperating. Larry Arrington, Dean
Introduction
Concerns regarding nutrient losses from the manure of large dairy herds to groundwater or surface runoff have been extremely acute in Florida. The most widely publicized concerns have been with phosphorus (P) contamination of Lake Okeechobee, probably washing off the farms in surface runoff during the summer rainy season. Also of concern are nitrogen (N) losses in the form of nitrate into the groundwater through the deep sandy soils of the Suwannee River basin.
Florida is not unique. All states are starting to monitor farms where large numbers of food-producing animals are maintained on small acreage. But regardless of farm size, maintenance of the environment and efficient utilization of nutrients should be a priority.
Nitrogen (N) and phosphorus (P) are the primary nutrients of concern. Manure N can be
converted to nitrates in the soil and potentially leach to groundwater. Manure P can potentially move with surface runoff, thus stimulating algae and aquatic plant growth leading to eutrophication of surface waters. Potassium (K) has not been of as much concern environmentally as N and P, but it is of equal concern in fertilizer management strategies. Also, K is important in assessing equivalent commercial fertilizer value of manure.
Manure nutrients and decaying organic matter are natural components of the environment that ultimately contribute to the production of more plant and animal tissue. Thus, concern about manure leakage is no different than concern about commercial fertilizer use. Manure is in fact a resource, based largely on its equivalence with commercial fertilizer, and should not be called a waste when it is recycled through new plant growth.
To use the resource value of manure effectively and to avoid excessive concentration of these
Archival copy: for current recommendations see http://edis.ifas.ufl.edu or your local extension office.

Dairy Manure Management: Strategies for Recycling Nutrients to Recover Fertilizer Value.... 2
nutrients at inappropriate points, it is helpful to budget nutrient flow through the total dairy farm system. If there is a problem concentration at some point, then corrective measures can be taken which are environmentally accountable. To do this, quantitative information is needed on nutrient flow through all segments of the system. Critical questions are:
1. How much of individual nutrients is excreted by dairy cows? (See page 2 .)
2. How does the manure management system affect nutrient flow and nutrient recoveries for fertilizer use? (See page 4.)
3. What is the potential nutrient removal by plants? (See page 7.)
4. How do you develop a manure nutrient budget? (See page 8.)
5. What steps help to document environmental accountability? (See page 14.)
This publication is designed to give background information and serve as a guide to dairy farmers and planners to help develop answers to these questions for an individual dairy farm.
Abbreviations: N = nitrogen, P = phosphorus, K = potassium, CP = crude protein, DM = dry matter, DMI = DM intake, Mcal = megacalorie of energy, NE
L = net energy for lactation, OM = organic
matter, TDN = total digestible nutrients.
How Much of Individual Nutrientsis Excreted by Dairy Cows?
Historically, the nutrient excretion standards most often used in the design of manure management systems were those of the American Society of Agricultural Engineers (ASAE, 1990). These standards are based on body weight of cows, however, they do not account for the large variation among dairies in nutrient excretion levels. The variation is caused by differing voluntary feed intake, differing supplemental levels, and differing amounts of nutrients harvested in the milk. Recent University of Florida experiments (Morse, 1989; Tomlinson et al., 1996) showed that N and P excretions by dairy
cows varied dramatically with level of N and P intakes. These data confirmed that excretion estimates for individual farms are best based on dietary intake of a nutrient minus the amount secreted into milk. Most dairy farms have accurate estimates of feed and milk and, thus, this method of predicting total excretion of minerals by dairy cows is used in this publication ( Table 1 ). In Table 1 , the following milk composition, typical of Holsteins, was used along with pounds of milk to determine recovery of fed nutrients in milk:
• Protein3.30% (N content .512%)
• Phosphorus (P)0.10%
• Calcium (Ca)0.12%
• Potassium (K)0.15%
• Magnesium (Mg)0.01%
• Sodium (Na)0.05%
• Chlorine (Cl)0.11%
Phosphorus excretion estimates in Table 1 illustrate that dietary P of 0.40%, 0.45%, or 0.60% causes changes in estimated annual excretion of actual P from 40 to 48 to 71 pounds per cow per year. Thus, dairy farmers have considerable control of mineral excretion because they control the mineral contents in the diets they feed. Feeding adequate P is important for animal health and performance. However, .40% of total diet dry matter is near the year-round estimated requirements for lactating cows (National Research Council -- NRC), more is recommended in early lactation. Although these data do not lead us to recommend lowering feeding levels for P below standard feeding recommendations (NRC), the data point out that future committees that develop NRC feeding standards need to review recommended feeding levels for P, N, and environmentally sensitive minerals. The objective is to minimize excretion of these nutrients and still maintain optimum animal performance.
Table 1 shows excretion estimates for N from two different diet formulation procedures proposed by NRC. One is for cows consuming diets formulated to supply NRC crude protein standards which require
Archival copy: for current recommendations see http://edis.ifas.ufl.edu or your local extension office.

Dairy Manure Management: Strategies for Recycling Nutrients to Recover Fertilizer Value.... 3
more crude protein to assure that true protein needs are met (NRC, high). The other (NRC, low) minimizes dietary N by providing minimal nonprotein N and ruminally degradable protein for optimum rumen microbial fermentation and provides for remaining animal requirements with ruminally undegraded protein. Numeric estimates of yearly N excreted by high-producing 1400 lb cows were 273 lbs N per cow per year when fed according to the NRC crude protein standards and 234 lbs N per cow per year when diet protein was formulated for minimum needs for undegraded and degraded protein. As with P, these data suggest that some diet control over N excretion is possible. Figure 1 shows graphically some of the daily excretion estimates in Table 1 .
Figure 1.
Although, yearly excretion estimates in Table 1 are based on diets designed to support higher milk production than many dairy farmers are currently achieving (20,000 lbs milk/cow annually), most dairies with lower milk production choose to feed as much protein as was used in this example (e.g., up to 17.5% crude protein of total diet dry matter for their high-producing group). Nutrient management plans usually should be based on current cow excretion estimates but, if expansion is planned, it may be helpful to estimate future needs as well, Figure 2 . To start, use current average production. For example, if the herd averages 50 lbs of milk per day for all milking cows year-round (with dry cows managed on a separate farm), or if the herd averages 50 lbs year-round for all cows milking and dry (with dry cows managed in the same manure management system), then use excretion estimates for cows producing 50 lbs milk ( Table 1 ). Then multiply the excretion estimates by the average excretion per day for cows currently producing 50 lbs of milk per day
by 365. These levels of production (50 lbs/day/cow) were near the average for all Florida dairy cows in 1996.
Figure 2.
Information in Table 1 can easily be extrapolated to any herd size by multiplying the number of cows by the appropriate factor. For example, a herd with 100 cows would excrete 100 times as much as the yearly excretion estimates in Table 1 (see Table 2 ).
As discussed in later sections, significant volatilization of the N will occur because it is easily converted to ammonia and lost to the air as gaseous ammonia. Thus, fertilizer values will be somewhat less than amounts originally excreted. Saving 50% of excreted N, which was the percentage used to estimate value in Table 2 , and saving all of the P and K is achievable, but most Florida systems retain less. Manure fertilizer values of $75/cow or more annually is possible ($86.55 per cow in the example in Table 2 ). Although the value of N, P, and K fertilizer nutrients in manure usually will not be as great as the total costs of the waste management system, recovered value reduces the net cost of waste handling. However, value will be realized only if the nutrients in dairy manure are used to displace the purchase of inorganic fertilizer nutrients. Data from Table 2 imply that dairy manure for fertilizer will contain: N -- 4.6 lbs actual N/ton wet manure (accepting 50% volatilization loss)
P -- 1.9 lbs actual P/ton wet manure (equivalent to 4.4 lbs P
2 O
5 )
K-- 6.0 lbs actual K/ton wet manure (equivalent to 7.2 lbs K
2 O)
Archival copy: for current recommendations see http://edis.ifas.ufl.edu or your local extension office.

Dairy Manure Management: Strategies for Recycling Nutrients to Recover Fertilizer Value.... 4
Total solids 11.6%
Manure composition changes as time passes after excretion. In addition to expected volatilization of N, liquids will drain from the solids, drying may occur, or the manure may be diluted with flushwater. Thus, the moisture content usually is quite different. It is important to take samples of manure or wastewater applied to cropland and have these samples analyzed at a commercial laboratory . The analysis should include total Kjeldahl N and not just nitrate N, since almost no nitrate form of N occurs in manures. Nitrification does not occur until after manure is incorporated into the soil.
The major forms of N in dairy manure are either organic N or urea N which is easily converted to ammonia and can be lost to the air as gaseous ammonia.
How Does the Manure Management System Affect Nutrient Flow?
After excretion by the cow, manure may be stored wet, stored after being allowed to dry, flushed with water to a lagoon or holding pond, spread fresh on land, or spread in some form at some later time. The longer the time in storage, the greater the potential for N losses to the air as ammonia. The greater the dilution with water, the greater the potential for nutrient losses to surface and groundwaters unless included as part of an irrigation program to distribute water and nutrients to growing crops. Few manure systems on farms actually collect all of the feces and urine at one location for application to one particular unit of land.
Separations or losses occur in many ways.
• Flushed manure from the milking parlor and feed barn may go through a sand trap and be pumped over a separator screen before irrigation of land with the effluent.
• Manure is dropped in different areas such as pasture, milking parlor, cooling barns, and the primary feeding area and some of these "separations" may not be collectible for land-spreading.
• Some gaseous loss of ammonia occurs (volatilization) which returns a variable, but often controllable, portion of the N to the air.
Other possibilities include some surface runoff and loss to the groundwater. Management practices must control all of these components so that surface runoff and losses of nutrients to the groundwater are minimized and do not cause violations of state water quality standards (Holloway et al., 1990).
The choice of a manure management system will depend on existing facilities. For example, if the existing buildings were designed for flushing, then a dry handling system would not be possible without major structural modifications. If a new dairy is being planned, then other factors can be considered. In both cases, changes in the system must be compatible with other management practices on the dairy. The manure nutrients must be spread in a way that recovers nutrients in harvested crops or be stockpiled in a way that will not pose environmental risks before being spread.
Regulatory requirements may influence the choice of a waste management system. For example, if surface runoff must be collected, stored, and dispersed on cropland, then a liquid handling system would be necessary. However, other components could still be handled as a solid or as a slurry.
Types of Manure Handling Systems
Manure management systems can be categorized in many ways, with options within each type of system. The types of systems can be outlined as follows:
• solid or conventional manure handling
• slurry manure handling
• liquid manure handling
• anaerobic lagoon
• removal of suspended solids
• composting
• combinations of the above
Archival copy: for current recommendations see http://edis.ifas.ufl.edu or your local extension office.

Dairy Manure Management: Strategies for Recycling Nutrients to Recover Fertilizer Value.... 5
Each system can be broken down into five major components:
• collection
• storage
• processing or treatment
• transport
• utilization
Solid manure. Conventional or solid manure handling systems are not common in Florida. Normally high rainfall and humidity make it difficult to keep manure dry enough to be handled with a front-end loader. Also, the warmer climate permits the use of water for flushing on a year-round basis, as well as the utilization of wastewater on cropland in multiple cropping systems. Use of water for flushing of manure also has low labor requirements and is a clean way to handle manure.
Solid manure handling must employ some type of dry scraping for collection, and every effort must be made to keep out excess water. The manure can be hauled and spread on cropland on a daily basis or the manure can be placed in storage. The storage facility will require a roof or a provision must be made for capturing any liquid leachate or runoff in a pit or lagoon. Normally there would not be any processing or treatment of the manure. Transportation would probably be in a conventional box manure spreader, and utilization would be on cropland.
In Florida, a dairy farm would rarely attempt to employ a solid manure handling system for all of the manure. However, much of the manure can be handled as a solid. In the design of new or modified facilities, it is recommended that provisions be made for both scraping and/or flushing, if possible.
Slurry manure. This is basically the mixture of excreted feces and urine with only enough water added to facilitate handling. This results in a solids content of greater than 5 % which is too wet to handle with a front-end loader but not dilute enough to handle in a conventional irrigation system. Storage could be in pits or in tanks either above or below ground. Transport would probably be in a tank truck
or wagon or in a flail spreader. Utilization would be on cropland. If knifing or soil injection of manure nutrients is desired, this is the system of choice.
Use of slurry requires purchase of a tank truck or wagon, special pumps that will handle the high solids content, and construction of storage tanks that may be quite expensive. Loading, transporting, and spreading the slurry also has a high labor requirement but the system can result in low nutrient losses.
Liquid manure handling. This usually involves flush tanks to move manure and thus dilutes manure to a solids content of less than 5 %. In most Florida dairy systems, the solids content is less than 2 % and can be handled in specially designed irrigation equipment. Required storage capacity depends on type of soils in the irrigation field, the storage time between irrigation applications, and the amount of stormwater runoff which the system must be capable of retaining. Some distinct advantages of this type of system are that it has low labor requirements and can result in relatively few nutrient losses when irrigation is frequent and growing crops are available to utilize the nutrients.
Anaerobic lagoon system. This system was the most popular type of manure handling system installed on Florida dairy farms during the 1970s and '80s. It actually is a specific type of liquid handling in which the flushed manure is directed into an anaerobic lagoon. The first stage of the lagoon system is designed with a constant liquid level to overflow into a second lagoon or pond designed for liquid storage capacity. Effluent from the storage pond must be dispersed on cropland through some type of irrigation system. Although seepage irrigation and sheet flows have been used for effluent dispersal, pivot irrigation systems are becoming much more popular because of their even distribution of the manure nutrients.
In addition to the effluent, sludge accumulates in the anaerobic lagoon which contains a significant amount of P and a small amount of the N. The amount of time before the lagoon fills with sludge to a point where it needs to be cleaned out varies depending on loading rates and design volume. Cleanout of smaller, more heavily loaded lagoons every 2 to 5 years is common while larger lagoons
Archival copy: for current recommendations see http://edis.ifas.ufl.edu or your local extension office.
Dairy Manure Management: Strategies for Recycling Nutrients to Recover Fertilizer Value.... 6
may function much longer before cleanout is necessary. Separation of larger manure solids is often done prior to the wastewater entering the lagoon in order to permit accommodation of manure from more cows or to extend the time until cleanout is necessary.
Removal of suspended solids from flushed manure. Moving manure from animal pens with flushed water is an easy and clean way to handle manure ( Figure 3 ). Variations of this method have been adopted across much of the United States in dairy, poultry, and swine operations. Separation of solids from flushed manure by some manner is potentially important in most of these systems for several reasons:
Figure 3.
• To remove large particles and sand that would plug or damage distribution nozzles in irrigation systems used to evenly spread the liquid over the cropping area.
• (null)
To reduce the biological loading on aerobic and anaerobic lagoons.
• To capture a fibrous product and some of the N and mineral nutrients which might be utilized in other products such as bedding for free stalls, part of the feed for cattle on maintenance diets, compost for potting material for plants, etc.
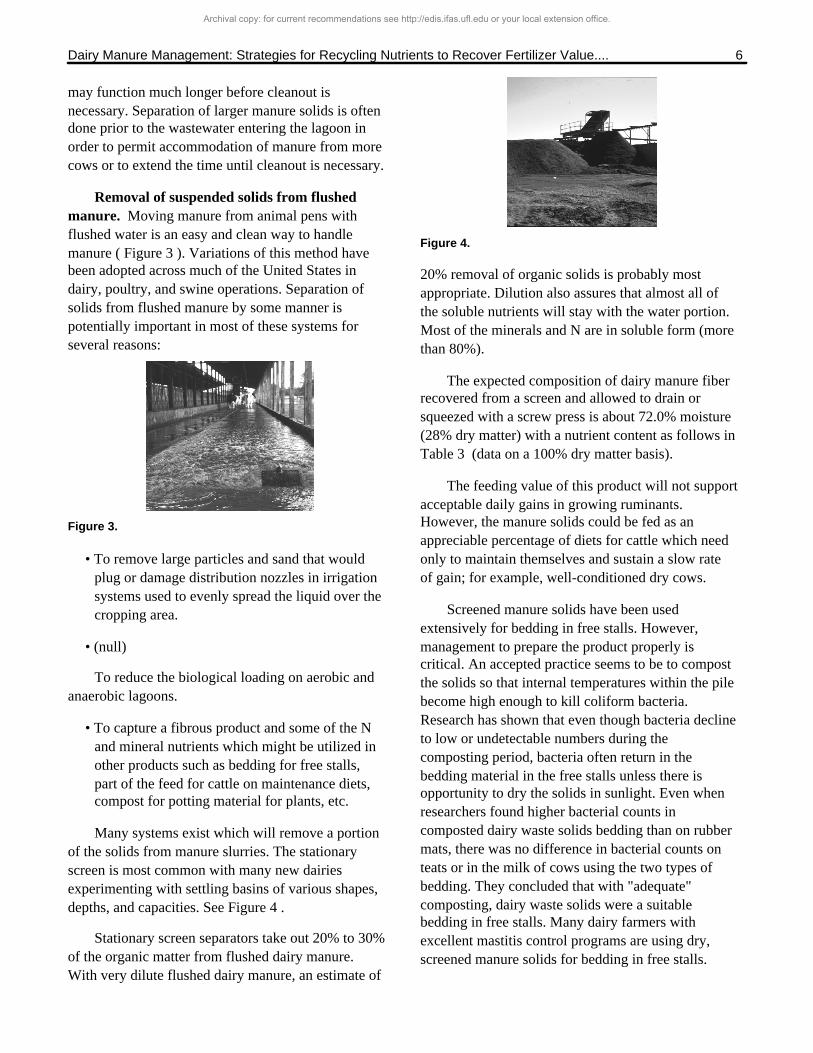
Many systems exist which will remove a portion of the solids from manure slurries. The stationary screen is most common with many new dairies experimenting with settling basins of various shapes, depths, and capacities. See Figure 4 .
Figure 4.
Stationary screen separators take out 20% to 30% of the organic matter from flushed dairy manure. With very dilute flushed dairy manure, an estimate of
20% removal of organic solids is probably most appropriate. Dilution also assures that almost all of the soluble nutrients will stay with the water portion. Most of the minerals and N are in soluble form (more than 80%).
The expected composition of dairy manure fiber recovered from a screen and allowed to drain or squeezed with a screw press is about 72.0% moisture (28% dry matter) with a nutrient content as follows in Table 3 (data on a 100% dry matter basis).
The feeding value of this product will not support acceptable daily gains in growing ruminants. However, the manure solids could be fed as an appreciable percentage of diets for cattle which need only to maintain themselves and sustain a slow rate of gain; for example, well-conditioned dry cows.
Screened manure solids have been used extensively for bedding in free stalls. However, management to prepare the product properly is critical. An accepted practice seems to be to compost the solids so that internal temperatures within the pile become high enough to kill coliform bacteria. Research has shown that even though bacteria decline to low or undetectable numbers during the composting period, bacteria often return in the bedding material in the free stalls unless there is opportunity to dry the solids in sunlight. Even when researchers found higher bacterial counts in composted dairy waste solids bedding than on rubber mats, there was no difference in bacterial counts on teats or in the milk of cows using the two types of bedding. They concluded that with "adequate" composting, dairy waste solids were a suitable bedding in free stalls. Many dairy farmers with excellent mastitis control programs are using dry, screened manure solids for bedding in free stalls.
Archival copy: for current recommendations see http://edis.ifas.ufl.edu or your local extension office.

Dairy Manure Management: Strategies for Recycling Nutrients to Recover Fertilizer Value.... 7
An alternative to removing solids from flushed manure with screening equipment is to design holding basins for gravity separation (settling basins). More solids can be removed with well-designed sedimentation basins (40 to 60% of total solids) than with stationary screens. The key is the detention time of the water carrying the solids. However, the sedimented solids have a much higher moisture content and are not as useful as screened solids if bedding for free stalls or composting is desired. Thus, land-spreading of these solids is the most likely method of disposal.
Composting
Composting systems have recently received much attention to facilitate exporting nutrients from dairy farms. A composting system is a modification of a conventional or solid manure handling system with the composting (treatment) process applied to the manure. Types of composting systems include windrow, bin, static pile, and aerated static pile. Major factors to be considered are the desired quality of the final product, space requirements, labor requirements, and availability of a diluent to mix with the raw waste. Before a composting system is initiated, careful attention must be given to a market or outlet for the composted manure. Do not assume that there will be a line of people waiting to buy the product. Composting is primarily an oxidative process which removes many odorous compounds. Also, some organic solids are converted to carbon dioxide thus reducing volume, and easily volatilized nitrogen is lost. However, the final product is stable and much less odorous than the initial manure. See Figure 5 .
Figure 5.
What is the Potential Nutrient Removal by Plants?
One generally accepted philosophy of land application of manures is that nutrients can be applied to land in amounts slightly above the level of the nutrients removed by the crops harvested. When animal numbers are high in relation to the amount of land readily available, we need to know the maximum application rates for given soil types and crops that can be efficiently utilized by different cropping systems. We also need to use cropping systems that will take up the maximum amount of environmentally sensitive nutrients such as N and P.
A long-term research project at Tifton, Georgia was designed to identify a maximum, environmentally safe application rate of manure nutrients when a triple-cropping system was used. Flushed dairy manure nutrients were applied through center-pivot irrigation. The cropping system included Tifton 44 bermudagrass in which corn was sod-planted for silage in spring and abruzzi rye was sod-seeded in fall. Harvests included rye for grazing from about Dec 1 until Feb 15, rye for silage about Mar 20 (corn planted the day following), corn for silage in mid-July, low-quality bermudagrass hay about 10 days later, and high quality bermuda-grass hay or grazing until rye was planted again about Nov 1.
In the Georgia experiment, large-particle manure solids were separated from the liquid with an inclined stainless steel separating screen (1.0 x 6.0 mm hole size) to facilitate irrigation of the effluent. The liquid portion was applied to the cropping area at four different rates. Actual dry matter and N yields of the three crops in their rotation in response to different rates of liquid manure application are shown in Table 5 . Harvests of all crops yielded 6.2 tons or more of dry matter per acre (12,400 lbs) with N-deficient application of 214 lb N/acre (Experiment 2) with yields plateauing at 12.5 to 13.0 tons of DM/acre with manure wastewater applications of 440 lb N/acre or more. Crop removals of N, however, continued to increase after DM yields plateaued because of luxury consumption of N, which increased CP and N concentrations of crops harvested.
Archival copy: for current recommendations see http://edis.ifas.ufl.edu or your local extension office.

Dairy Manure Management: Strategies for Recycling Nutrients to Recover Fertilizer Value.... 8
Phosphorus removals were not measured in Experiment 1 ( Table 5 ), but use of book-value composition estimates (NRC, 1989) would estimate 55 to 60 lbs P removal annually in the crops harvested. However, P removals measured in Experiment 2, and a few other experiments, suggest that P removals of 90 lb/acre or more are possible because of some luxury consumption of P. For example, P removals in year 2 of Experiment 2 were 49, 79, 89, and 93 lbs/acre in the 6.20, 9.82, 12.80, and 13.00 tons of DM harvested. Application rates were 46, 82, 129, and 180 lbs/acre (Newton et al., 1995).
Luxury consumption of P does not, however, occur to the extent that it does with N and K. Table 6 is provided to illustrate the expected range in N, P, and K composition in commonly grown forage crops and the effect that has on crop removals of those nutrients.
Other forage crops, even legumes, like alfalfa and perennial peanut, have been proposed as being good crops for consuming large quantities of manure nutrients. When free N is available in the soil to "scavenge," legumes take up soil N in preference to fixing N from the air. Giant elephantgrass, which has been used in field studies in Okeechobee County, Florida, gives the highest estimated P uptake. Although there may be potential for greater recovery of P in the enormous quantity of biomass harvested in giant elephantgrass than from other crops, the estimated digestible energy value of the harvested forage would be low.
The Georgia cropping system (bermudagrass-corn-rye) has great potential for Southern United States because: a large part of the harvest is corn silage, a high-energy forage that fits the feed needs of high producing cows; the bermudagrass forms a sod base and forage for harvest in the warm season; and rye utilizes a large amount of N during the winter season. A cropping system tested at the University of Florida that shows promise is based on perennial peanut, a higher quality (digestibility) base forage than bermudagrass. Perennial peanut, although not as high yielding as bermudagrass, will utilize applied N and, additionally, may offer potential as a legume to fix
some N if temporary soil deficiencies occur. The Florida research (French et al., 1995) evaluated a sod-based triple-cropping system (corn-perennial peanut-rye) and perennial peanut overseeded with rye in winter. These were compared with a triple-crop system of corn, forage sorghum, and rye. Results from the corn-perennial peanut-rye and the perennial peanut-rye systems are shown in Table 5 . Note that total dry matter harvests from the corn-perennial peanut-rye system were similar to those obtained with corn-bermudagrass-rye in the Georgia experiments but somewhat less N was removed, primarily due to lesser N in the winter rye crop. This was because of less dry matter yield and much less N content in the dry matter. Phosphorus removals on this system were 56 lb P/acre on all three N applications. The perennial peanut-rye system removed less dry matter but was an efficient scavenger of N, suggesting that some N-fixation from the legume may have taken place.
One of the major strengths of using flushed manure systems, along with irrigation, is that additional water can be applied along with fertilizer nutrients so that full response to added nutrients is possible.
How to Develop a Manure Nutrient Budget
After designing the essential components of the manure management system and estimating total manure nutrient excretion, the next step is to account for what happens to nutrients on the farm. If needed, alternatives can be developed to avoid nutrient leakage to the environment. This includes utilization of a cropping system and a land application system that are in nutrient balance. If land with an appropriate cropping system is available to utilize all nutrients, it is important to apply manure onto cropland soon after it is produced in order to recover the maximum amounts of N. Each cow produces manure with $75 or more in fertilizer value to be managed each year. If that resource can be managed to utilize the fertilizer value, the realized savings will pay a large part of the costs of manure management.
Most forage crops will accumulate N relative to availability (luxury consumption) if other major and
Archival copy: for current recommendations see http://edis.ifas.ufl.edu or your local extension office.

Dairy Manure Management: Strategies for Recycling Nutrients to Recover Fertilizer Value.... 9
minor plant nutrients, sunlight, moisture, and temperature are not limiting. Therefore, plant tissue N or harvested feed protein levels serve as practical indexes to volatilization and denitrification losses of N, although exact conversion factors have not been worked out. If crop protein levels are consistently near the low end of the ranges shown in Table 6 , and other factors are judged not to be limiting, volatilization and denitrification losses are likely greater than average, and perhaps somewhat more N can be applied without increasing negative environmental losses. On the other hand, if levels in crops consistently exceed the maximum of the ranges shown, the volatilization or denitrification losses may be overestimated and application rates may need to be reduced.
Perhaps the principles of nutrient budgets are visualized most easily as a nutrient cycle constructed to achieve environmental balance. Figure 7 illustrates a system balanced for N based on crop N removals with triple-cropping determined in the University of Georgia experiments at Tifton, GA discussed earlier ( Table 5 ). With denitrification losses of over 100 lbs/acre annually in these experiments (Newton et al., 1995), it can be concluded that applications of 650 to 700 lbs N/acre should be environmentally acceptable when accompanied by crop removals of 500 to 525 lbs.
Figure 7 utilizes crop removals of 510 lb N, denitrification losses of 100 lbs/acre, which is only partially offset by return of 15 lbs N/acre in rainfall, and surface and groundwater losses of 31 and 20 lbs/acre to arrive at application needs of 646 lbs/acre. The examples of 20 lbs N/acre passing to groundwater and 31 lbs/acre to surface water were selected as amounts that will give N levels in these waters that are below 10 parts per million nitrate N. These examples also demonstrate that food cycles must distribute some N in waters if fertility is high enough to produce desired yields of forage and food crops.
Using rather minimal volatilization loss estimates of ammonia within the manure management system and application of screened manure solids to other land led to a projection that 70% of excreted N would be recovered for
application to cropland, which would require managing 923 lbs of freshly excreted N (646/.70 = 923). We think 70% is about the best possible recovery of manure N for fertilizer. If the cows to be managed on this farm were producing 50 lbs of milk/day and being fed NRC Low N content( Table 1 ), their annual excretion of 219 lbs N (365 x .601 lbs N/day) would prorate to be manure from 4.2 cows (923/219 = 4.2). Their diets, which included the 510 lbs N in the forage produced and fed to the cows was supplemented with 817 lbs N in purchased supplements which was distributed to milk and weight gain.
The budget illustrated in Figure 7 is based on N. Thus, it assumes that in this location there is no environmental risk for surface runoff of P, which was applied in excess, or to allowing P to accumulate in the soil. If a P budget had been used, only manure from 2.3 cows could have been utilized in producing those crops which had a total removal of 90 lb P/acre. Supplemental commercial fertilizer N would be required when manure is applied on a P basis because the N to P ratios in various dairy manures are low.
The budget in Figure 7 was generated by selecting acreage available and expected crop production (nutrient removals) and then deciding how many cows could be used to supply the maximum manure application. Generally, nutrient budgets are started by determining the amount of manure obtained from your cows and then determining what you can do with it accountably. If manure nutrients are excessive relative to current utilization, crop production will have to be increased, manure nutrients exported off the farm, or the feeding inputs, the number of cows, or both will have to be reduced. Nutrient flows through manure management systems vary greatly in Florida. Four examples to illustrate some of the differences are shown in Table 7 and Table 8 . The manure excretions are for groups of 100 cows producing 70 pounds of milk per day for 365 days/year. It is assumed that dry cows are in another manure management area which is not budgeted here (see later pasture budget example). The example systems are:
1. Milking cows producing 70 lbs milk per day and fed diets based on "NRC High" standards for protein and .45% P (.846 lbs N and .138 lbs P
Archival copy: for current recommendations see http://edis.ifas.ufl.edu or your local extension office.

Dairy Manure Management: Strategies for Recycling Nutrients to Recover Fertilizer Value.... 10
Figure 7.
excretion/day, see Table 1 ) are confined in concrete lots so that all of the manure can be flushed into a holding pond for frequent irrigation of cultivated crops that remove 400 lbs N and 60 lbs P per acre. Solids are screened from the flushed manure to facilitate irrigation but are applied to the same land as the wastewater.
2. Milking cows are fed, confined, and managed as in System #1 except that all of the manure is flushed into a large anaerobic lagoon with the effluent from the second stage of the lagoon system used for frequent irrigation of cultivated crops.
3. Milking cows are producing and fed as in Systems 1 and 2 but are maintained in dirt lots over clay (which blocks leakage to groundwater) where 75% of manure is dropped; manure is scraped and hauled every 3 months. Twenty-five percent of the manure from milking parlor, holding areas, etc. is flushed to an anaerobic lagoon and managed as in System 2. Surface runoff water from dirt lots is intercepted and put
into the holding pond with the flushed water for irrigation.
4. Milking cows are producing and fed total amounts of nutrients as in Systems 1, 2, and 3 but are maintained on pastures where 75% of manure is dropped and managed so that cows rotate to a different pasture approximately monthly. Twenty-five percent of the manure from milking parlor, holding areas, and supplemental feed barn is flushed to an anaerobic lagoon and managed as in Systems 2 and 3.
Anaerobic lagoons (Systems 2, 3, and 4) which detain flush water for a much longer time than temporary holding ponds have been used extensively in Florida. Losses of N from lagoon systems where the effluent is applied through overhead irrigation would work out similar to the dirt lot (System 3) because the loss of N to volatilization is similar. The uncertain part with respect to lagoons is how much of the P and other minerals accumulate in the sludge at the bottom of the lagoon. In this example, it was
Archival copy: for current recommendations see http://edis.ifas.ufl.edu or your local extension office.

Dairy Manure Management: Strategies for Recycling Nutrients to Recover Fertilizer Value.... 11
estimated that 50% of the P and 10% of the N are complexed in the sludge (containing dead bacterial cells and precipitates) which needs to be periodically removed from the lagoon. Although lagoons reduce acreage needed for day-to-day P budgets, the P must be eventually distributed on acres needing P applications, for example every 3 to 10 years depending on the size of the lagoon. Finding suitable acreage on which to spread these nutrients may present a problem unless the sludge is spread on other farm land than that used for regular manure spreading.
In the four example manure management systems, these assumptions were made:
1. Manure is applied year after year to the same land at the same rates so that carryover of nutrients from previous applications, if any in semi-tropical climates such as Florida, can be assumed to be equal each year.
2. Assumed losses of N through volatilization were:
• 5% of N dropped on concrete before daily flushing or scraping,
• 15% of N from flushed manure being held only a short time before irrigation,
• 60% of N from flushed manure held in anaerobic lagoon before irrigation,
• 65% of N dropped in dirt lots for clean-up and spreading every 3 months,
• 65% of runoff from dirt lots which was estimated as 10% of N dropped on dirt,
• 20% in the field after land-spreading N from irrigation, and 60% of total N dropped in pasture.
1. Runoff from flushed concrete lots was captured in a holding pond for frequent irrigation. Runoff from dirt lots was captured in a separate holding pond which was also added to the irrigation but after longer time in storage.
2. Surface runoff losses of N and P from crop fields were assumed to be 5% of nutrients applied.
3. To account for normal and acceptable losses to groundwater, it was estimated that 20 lbs N/acre and 2 lbs P/acre/year pass into the groundwater with the water moving through the soil. Additionally, for N, it was assumed that 40 lbs N/acre were lost to the atmosphere annually by denitrification as nitrogen gas. These amounts were added to the estimated removal of N or P by the crops harvested and considered as agronomic application rate. Estimated removal of N was 400 lbs/acre for cropping systems and for pasture. For P, estimated removal was 60 lbs/acre for cropping systems and for pasture. For these removals from pasture, it is assumed that an intensively grazed summer forage is overseeded with rye, oats, or ryegrass for winter grazing. Although groundwater standards have not been set for P, it was assumed that 1.0 ppm P would be acceptable and that this level would be obtained from 2 lbs P/acre/year.
Table 7 shows N budgets generated from a computer spreadsheet for the four 100-cow groups managed according to the scenarios described previously and fed liberal dietary levels of N (NRC High, Table 1 ). Note that the N produced yearly by the cow groups flowed somewhat differently through the four hypothetical management systems. The predicted annual manure disposal acreage (excluding future acres for lagoon sludge) needed per 100 cows varied from 14.3 to 41.9 acres. Similarly, using P budgets in Table 8 , the manure disposal acreage needed varied from 38.6 to 77.5 acres. It is important to note that in the future an additional 40.6 acres per year will be needed to utilize P in the lagoon sludge from the system where 100% of manure goes through a anaerobic lagoon. Lesser acreage will be needed for sludge from other systems that utilize lagoons less extensively. However, these acres might very well be acres on another farm to which the sludge could be hauled, or the sludge could be sold to other farmers for fertilizer.
If the same cows had been fed to meet NRC Low standards and diets were .40% P, the acreage requirements would vary from 12.3 to 36.2 acres for N budgets and 32.1 to 64.6 acres for P budgets. Acreage comparisons are shown in Table 9 . NRC Low standards are based on diets formulated to meet:
Archival copy: for current recommendations see http://edis.ifas.ufl.edu or your local extension office.

Dairy Manure Management: Strategies for Recycling Nutrients to Recover Fertilizer Value.... 12
a) ruminally degradable protein needs and remaining protein requirements with digestible but ruminally undegradable protein; and b) minimum dietary P requirements, estimated to average .40% of diet dry matter over the year.
Regardless of the manure management system, more acres are needed to dispose of manure with plant removal of P as the application criterion than with plant removal of N. Level of feeding (level of production) also has a significant effect.
Many more scenarios are possible than those illustrated here, but these example systems show much of the expected variation due to differences in manure management systems. Because of the large variation from dairy to dairy in the systems used and in feeding and production levels, it is essential that each farm be permitted to develop its own budget for nutrient flow. The tables are presented only to help individuals make estimates which are appropriate for an individual farm.
Grazing Budgets
Total nutrient budgets for pasture conditions seldom show excessive nutrient applications unless excessive commercial fertilizer nutrients are applied in addition to manure or unless pastures become holding areas to accommodate a relatively large number of cattle being fed primarily from feed sources obtained off-site. Cattle cannot excrete more nutrients than they take in, at least for extended periods. However, problems in surface water quality can occur when cattle congregate in or near waterways. Pastures are commonly used in Florida for dry cows and heifers, usually with moderate concentrate supplementation to give desired weight gains. Examples of pasture N and P budgets for late pregnant, dry cows and for intensively grazed lactating cows follow.
The budget for dry cows was developed to find the carrying capacity and acceptable fertilization for 1.0 acre of an improved bermudagrass variety.
Pasture assumptions:
1.0 acre bermudagrass
10,000 lbs DM grazed, contains .565 Mcal NE L
/lb DM
@ 14% crude protein (2.24% N) = 224 lbs N grazed/acre
@ .27% P = 27 lbs P grazed/acre
Cows :
Late-pregnant (250 days pregnant), 1400-lb dry cows
Requirements (NRC, 1989), would be met with consumption of 23.6 lbs bermudagrass DM and 4.4 lbs concentrate (.75 Mcal NE
L /lb, 10% CP (1.6%
N), and .40% P). The 23.6 lbs bermudagrass and 4.4 lbs concentrate would supply .599 lb N and .0813 lb P.
@ 23.6 lbs/day, 10,000 lbs BG DM would supply 10,000/23.6 = 424 cow-days
Intake from forage and concentrate for 424 cow-days :
N = .599 lb/day x 424 days = 254 lb N
P = .0813 lb/day x 424 days = 34.5 lb P
Export = Conceptus + gain
For N = .62 lbs CP/day for each cow (from NRC, 1989) which @ 16% N = .10 lbs N/day = 42 lb N for 424 days
For P = .020 lbs P/day if cow and fetus gain is 2.2 lb/day (NRC 1996) = 8.5 lb P for 424 days.
Excretion for 424 days = intake - (conceptus + gain)
For N = 254 lb intake - 42 lb in conceptus plus gain = 212 lb excreted
For P = 34.5 lb intake - 8.5 lb in conceptus plus gain = 26.0 lb excreted
The 212 lbs N in manure reduces to 86 lbs if we assume the following: a) 50% volatilization of the 212 lbs N/acre (-106 lbs); b) modest denitrification losses (e.g.,-15 lbs/acre annually); c) N in rainfall (+15 lbs/acre annually); and d) surface and
Archival copy: for current recommendations see http://edis.ifas.ufl.edu or your local extension office.
Dairy Manure Management: Strategies for Recycling Nutrients to Recover Fertilizer Value.... 13
groundwater losses on pasture are only 10 lbs/acre each (-20 lbs total). The remaining 86 lbs must be supplemented with at least 138 lbs N in commercial fertilizer or through N fixation by legumes to supply the 224 lbs N in forage grazed.
For P, the conclusion is different. Even with the minimal dietary P utilized in this example (total diet dry matter contains only .29% P), the 26 lbs P excreted in manure almost equals the 27 lbs grazed. Thus, the only deficiencies of P that exist are due to minor losses to surface water and, possibly, to isolated areas within the pasture that did not receive an equal share of the manure P.
An intensive grazing example for lactating dairy cows was developed to estimate risk of N from manure leaching to the groundwater in the deep sandy soils in the Suwannee River basin. The dairy received permits for construction only after extensive planning, justification to environmental regulatory agencies, and public hearings (Fries, 1994). The primary concern in this region was the fear of manure N being converted to NO
3 - in the soil and leaching
through the deep sandy soils into the groundwater. Approval was granted because the estimated N budgets for the operation were environmentally acceptable and it was concluded that risk of appreciable N leaching from small daily loading of manure N from droppings in pastures was much less than from commercial N applications to produce corn, the primary crop previously grown on the land where the dairy was developed.
The dairy was planned for 1200 milking cows to be grazed year-round on 400 acres. Four, 300-cow groups, were to be managed on 100 acres which was to be divided into 14, 7.15-acre pastures of Coastal bermudagrass and overseeded with rye for winter pasture. Pastures were arranged under center pivot irrigation (fresh water only). A preliminary budget for a dairy of this type follows.
Pasture DMI assumptions :
20 lbs DMI/day per cow, 85% of days (15% dormant time estimated in fall)
14,000 lbs DM/acre seasonally grazed from irrigated bermudagrass (BG)
4,600 lbs DM/acre seasonally grazed from irrigated rye
Assumed pasture composition :
For BG, .16 CP x; .16 N/CP = .0256 N; .0035 P
For rye, .23 CP x; .16 N/CP = .0368 N; .0035 P
Manure N and P to pasture :
Daily N excretion/cow = .601 lb N and .107 lb P
(Table 1), it is estimated that .85 of this is dropped in pasture, .15 in milking parlor collected in anaerobic lagoon and managed separately.
(300 cows/100 acres x; .601 lb N/day) x; (365 d x; .85) = 55,938 lbs N/100 acres
@ 50% volatilization, manure fertilizer N equivalent applied = 280 lbs N/acre
(300 cows/100 acres x; .107 lbs P/day) x; (365 d x; .85) = 9960 lbs P/100 acres P applied = 99.6 lbs P/acre
Calculated N and P harvest (consumption)/ha :
For N, (14000 lbs BG x; .0256) + (4600 lbs rye x; .0368) = 528 lbs N
For P, (14000 lbs BG x; .0035) + (4600 lbs rye x; .0035) = 65 lbs P
In this intensive dairy grazing example, it is clear that budgets for N in grazing systems will require supplemental N either from commercial fertilizer or via N fixation by legumes to replenish pasture plant production needs. In the example, manure supplied 280 lbs N/acre with only 50% volatilization. More volatilization and less available N is likely. Plant removal needs were estimated at 528 lbs N. Thus, rather extensive N fertilization will be needed or the whole budget will fall apart due to insufficient N to produce the forage needed for the intake assumptions. If the forage isn't produced, more feed and N will be imported.
The case for P, however, shows that accumulation is likely (99.6 lbs P acre from manure
Archival copy: for current recommendations see http://edis.ifas.ufl.edu or your local extension office.
Dairy Manure Management: Strategies for Recycling Nutrients to Recover Fertilizer Value.... 14
versus 65 lbs/acre removal), even when no commercial fertilizer P is applied to the pastures.
All grazing examples for dry cows and heifers and intensive grazing examples for lactating cows will show the need for additional N fertilizer and that use of P fertilizers on pastures should be avoided after soil storage levels reach desired fertility levels.
Most Florida dairies that graze their lactating cows, however, probably are more similar to the example in System 4 ( Table 7 and Table 8 ) than the intensive dairy above. In System 4, the assumption was for 400 lbs of N to be grazed per acre (includes summer forage such as bermudagrass and winter rye). If the grazed forage selected by the cow had a year-round average of 18% crude protein which is 16% N, it would take almost 7 tons of DM grazed/acre to harvest 400 lbs N. If cows were grazing 90% of the year, the 19.1 pasture acres for 100 cows (System 4, Table 7 ) would supply only about 8.0 lbs DM per day per cow. These are reasonable consumption estimates, but the grazing intensity is not as high as the 20 lbs/cow daily planned in the intensive grazing dairy.
What Steps Help to Document Environmental Accountability?
Even with good management, there is potential for trouble spots or "leaks" in the manure system that might be judged as violations by regulatory agencies or as nuisances by citizens. After developing a manure nutrient management plan, dairy farmers should take precautionary steps to monitor and verify that their plan meets environmental standards. Helpful steps include:
Have a copy of the manure management plan available for review. This should include:
• Maps showing locations of barns, pastures, cropland, production wells, monitoring wells, etc.
• Engineering drawings of waste management system components. The nutrient management budget and recordkeeping system which details available land area, application rates on specific crops including nutrient analyses of manure and wastewater applied, amount of inorganic
fertilizer applied, yields and nutrient analyses of crops harvested, and quantities of manure nutrients sold or exported from the dairy farm.
• Obtain a water permit and install a water meter or meters to monitor water use.
• Install groundwater sampling wells and analyze samples regularly to monitor groundwater quality for use in deciding if changes are needed in some components of the manure management system.
If complaints are received about the dairy, the above documentation makes it easier to refute incorrect accusations. There will be increasing competition for water in the future and a valid water use permit will help to justify your claim for continued use of water. The installation of one or more water meters also will help tremendously by enabling better estimates of water used in flushing manures and applying wastewater to cropland. If fan and sprinkler cow cooling systems are installed, they require large volumes of water. The presence of a water meter can help in conservation efforts and to minimize costs associated with handling manure.
Selected References
• American Society of Agricultural Engineers. 1990. Manure production characteristics. Engineering Practices Subcommittee, ASAE Agric. Sanit. Waste Manag. Comm. ASAE Standard D384.1, Am. Soc. Agric. Eng., St. Joseph, MI.
• French, E. C., K. R. Woodard, D. A. Graetz, G. M. Prine, and H. H. Van Horn. 1995. A second year report on the use of dairy manure effluent in a Rhizoma (perennial) peanurt based cropping system for nutrient recovery and water quality enhancement. Pages 124 to 135 in Proc. Florida Dairy Production Conf., Dairy and Poultry Sci. Dept., Univ. Florida, Gainesville.
• Fries, F. T. 1994. Why we decided to build a new grazing dairy. Pages 73and 74 in Proc. 1994 Florida Dairy Production Conf. Dairy and Poultry Sci. Dept., Univ. Florida, Gainesville.
Archival copy: for current recommendations see http://edis.ifas.ufl.edu or your local extension office.

Dairy Manure Management: Strategies for Recycling Nutrients to Recover Fertilizer Value.... 15
• Holloway, M. P., A. B. Bottcher, and K. L. Campbell. 1990. BMPs for mitigating nitrate contamination of groundwater under North Florida dairies. Research grant report to Florida Department of Environmental Regulation, Tallahassee, FL 32399-2400.
• Johnson, J. C., G. L. Newton, and J. L. Butler. 1991. Recycling liquid dairy waste to sustain annual triple crop production of forages. Proc. Florida Dairy Production Conf., Dairy Science Dept., Univ. Fl. Coop. Ext., Gainesville, FL. 32611.
• Morse, D., H. H. Head, C. J. Wilcox, H. H. Van Horn, C. D. Hissem, and B. Harris, Jr. 1992. Effects of concentration of dietary phosphorus on amount and route of excretion. J. Dairy Sci. 75:3039-3049.
• Newton, G. L., J. C. Johnson, Jr., J. G. Davis, G. Vellidis, R. K. Hubbard, and R. Lowrance. 1995. Nutrient recoveries from varied year-round application of liquid dairy manure on sprayfields. Pages 113 to 123 in Proc. Florida Dairy Production Conf., Dairy and Poultry Sci. Dept., Univ. Florida, Gainesville.
• NRC. 1989. Nutrient Requirements of Dairy Cattle (6th Ed.). National Academy Press, Washington, DC.
• NRC. 1996. Nutrient Requirement of Beef Cattle (7th Ed.). National Academy Press, Washington, DC.
• Tomlinson, A. P., W. J. Powers, H. H. Van Horn, R. A. Nordstedt, and C. J. Wilcox. 1996. Dietary protein effects on nitrogen excretion and manure characteristics of lactating cows. Trans. ASAE 39(4):1441-1448.
• Van Horn, H. H., D. R. Bray, R. A. Nordstedt, R. A. Bucklin, A. B. Bottcher, R. N. Gallaher, C. G. Chambliss, and G. Kidder. 1993. Water budgets for Florida dairy farms. Extension Circular 1091, Florida Cooperative Extension Service, IFAS, University of Florida, Gainesville, FL 32611.
• Van Horn, H. H., G. L. Newton, and W. E. Kunkle. 1996. Ruminant nutrition from an environmental perspective: Factors affecting whole farm nutrient balance. J. Animal Sci. 74:3085-3105.
• Van Horn, H. H., A. C. Wilkie, W. J. Powers, and R. A. Nordstedt. 1994. Components of dairy manure management systems. J. Dairy Sci. 77:2008-2030.
Archival copy: for current recommendations see http://edis.ifas.ufl.edu or your local extension office.

Dairy Manure Management: Strategies for Recycling Nutrients to Recover Fertilizer Value.... 16
Table 1.
Table 1. Daily and yearly excretion estimates of various fractions and nutrients by 1400 lb Holstein cows.
Daily milk and DMI for:
40 days 130 days 135 days 60 days Total for year
Milk, lb/cow ==>= 100 70 50 Dry 20000
DMI, lb/cow ==>= 55.8 46.3 39.2 25.2 15099
Excretion for cow described in column above1
Fraction or nutrient Lb/day Lb/day Lb/day Lb/day Lb/yr/cow
Raw manure (feces + urine) 195.0 160.0 125.0 80.0 50450
Feces (wet) 125.0 100.0 75.0 45.0 30950
Urine 70 60 50 35 19500
Total solids (.33 DMI+urine DM) 21.5 18.0 15.2 9.9 5860
Water in manure 173.5 142.0 109.8 70.1 44590
Volatile solids (.83*TS) 18.0 15.0 12.7 8.2 4883
BOD, 5-day 2.87 2.40 2.02 1.32 781
COD, lb 19.8 16.5 13.9 9.1 5371
Total N, lb (NRC, low) .899 .727 .601 .364 234
Total N, lb (NRC, high) 1.030 .846 .698 .439 273
Urea+ammonia N (NRC, low) .408 .308 .249 .125 98
Urea+ammonia N (NRC, high) .500 .391 .319 .178 125
P lb (diet .40% P) .123 .115 .107 .101 40
P lb (diet .45% P) .151 .138 .126 .113 48
P lb (diet .60% P) .235 .208 .185 .151 71
K lb (diet .8% K) .296 .265 .239 .201 91
K lb (diet 1.2% K) .519 .450 .396 .302 151
Ca lb (diet .65% Ca) .242 .217 .195 .164 74
Ca lb (diet .90% Ca) .382 .333 .293 .227 112
Mg lb (diet .20% Mg) .102 .086 .073 .050 28
Mg lb (diet .35% Mg) .185 .155 .132 .088 51
Na lb (diet .35% Na) .145 .127 .112 .088 43
Cl lb (diet .55% Cl) .197 .178 .161 .138 611 Adapted from Van Horn et al. (1994). Crude protein percent of total diet dry matter for cows producing 100, 70, 50 lb milk/day and dry cows for "NRC, low" diets were 16.0
Archival copy: for current recommendations see http://edis.ifas.ufl.edu or your local extension office.

Dairy Manure Management: Strategies for Recycling Nutrients to Recover Fertilizer Value.... 17
Table 2.
Table 2. Annual manure production and nutrient value for 100 1400-lb cows.
Manure constituent Lbs/year/100 cows Probable value
Raw manure (feces + urine) 5,045,000Water in fresh manure 4,458,990
Total solids 586,000
Volatile solids 488,300BOD, 5-d, lb 78.130
COD, lb 537,100
Total N, lb (NRC, low) 23,400 $3,5101
P (diet dry matter .45% P) 4,800 $2,8801
K (diet dry matter 1.20% K) 15,100 $2,2651
TOTAL VALUE of N, P, and K $8,6551 Based on assumed values of $.30/lb N, $.60/lb P, and $.15/lb K; N recovered was 50% of excretion, thus, 50% volatilized.
Table 3.
Table 3. Nutrient content of dairy manure fiber (recovered from screens and drained).1
Nutrient % of DM
Ash 7.0 - 13.4
Nitrogen 1.0 - 1.6
Phosphorus .12 - .15
Potassium .16 - .22
NDF2 77.7 - 83.5
ADF3 50.0 - 60.0
ADL4 12.9 - 15.1
Cellulose (ADF - ADL) 35.4
Hemicellulose (NDF - ADF) 32.01Moisture content usually about 72.0% (dry matter, 28%). 2NDF = neutral detergent fiber3ADF = acid detergent fiber4ADL = acid detergent lignin
Archival copy: for current recommendations see http://edis.ifas.ufl.edu or your local extension office.

Dairy Manure Management: Strategies for Recycling Nutrients to Recover Fertilizer Value.... 18
Table 4.
Table 4. Nitrogen volatilization losses in handling and storage. 1
System Nitrogen Loss (percent)
Solid (losses before application)
Daily scrape and haul 15 - 35
Open lot 40 - 60
Liquid (losses during storage)
Anaerobic pit 15 - 30
Above ground storage 10 - 30
Earthen storage 20 - 40
Lagoon 70 - 80
Application (losses are % of that remaining after storage)
Broadcast (solid) 15 - 30
Broadcast (liquid) 10 - 25
Broadcast (solid, immediate incorporation)
1 - 5
Broadcast (liquid, immediate incorporation)
1 - 5
Knifing (liquid) 0 - 2
Sprinkler irrigation (liquid) 30 - 401Data taken from Structures and Environment Handbook, Midwest Plan Service, 1983
Table 5.
Table 5. Yields of forage dry matter and recycled N from crops fertilized with flushed manure through center pivot.
Estimated annualapplication of N Lbs/acre
Crop, Tons of dry matter or lbs N/acre
T-44bermuda Abruzzirye Corn silage Total
DM N DM N DM N DM N
Experiment 11, 2 Tons Lbs Tons Lbs Tons Lbs Tons Lbs
340 1.82 95 1.90 125 7.97 157 11.69 377
440 2.30 122 2.26 154 7.54 176 12.10 452
660 2.06 112 2.78 222 7.70 190 12.54 525
880 2.03 115 2.48 219 8.00 209 12.51 543
Experiment 23
214 3.35 91 1.07 47 1.78 44 6.20 182
Archival copy: for current recommendations see http://edis.ifas.ufl.edu or your local extension office.

Dairy Manure Management: Strategies for Recycling Nutrients to Recover Fertilizer Value.... 19
Table 5.
376 3.44 114 1.96 107 4.42 115 9.82 335
564 4.10 162 2.32 124 6.38 188 12.80 474
712 2.72 111 2.86 172 7.42 236 13.00 519
Perennialpeanut Rye Corn silage Total
DM N DM N DM N DM N
Experiment 34
360 2.2 100 1.8 57 7.7 186 11.7 343
530 2.1 98 2.0 77 8.7 205 12.8 380
670 1.9 86 2.0 91 8.1 212 12.4 389
Experiment 44
360 6.2 326 1.8 52 8.0 378
400 6.0 343 2.1 71 8.1 414
440 5.7 345 2.0 81 7.7 426
1Data from Johnson et al. (1991). Fibrous solids of flushed manure were removed with stationary manure solids separating screen before irrigation of wastewater to supply estimated annual application of N.2Mean bushels of grain/acres in silage were 175, 163, 161, and 169.3Data from Newton et al. (1995), 2-yr mean on new sprayfield site.4Data from French et al. (1995), 2-yr mean on new sprayfield site.
Archival copy: for current recommendations see http://edis.ifas.ufl.edu or your local extension office.

Dai
ry M
anur
e M
anag
emen
t: S
trat
egie
s fo
r R
ecyc
ling
Nut
rient
s to
Rec
over
Fer
tiliz
er V
alue
....
20
Tab
le 6
.
Tab
le 6
. E
stim
ated
ran
ge in
N, P
, and
K r
emov
als
in c
rops
at a
giv
en D
M y
ield
due
to v
aria
tion
in c
ompo
sitio
n.
Yie
lds(
ton
s/ac
re)1
N r
emo
vals
P r
emo
vals
K r
emo
vals
Cro
pW
etD
MC
P %
% o
f DM
lb/a
cre
% o
f DM
lb/a
cre
% o
f DM
lb/a
cre
Cor
n si
lage
18.0
6.0
9.0
to 1
3.0
1.4
to 2
.016
8 to
240
.22
to .4
726
to 5
71.
0 to
1.5
120
to 1
80
Rye
or
whe
at h
ayla
ge6.
03.
016
.0 to
21.
02.
6 to
3.3
156
to 1
98.2
3 to
.50
14 to
30
.7 to
1.5
42 to
90
Ber
mud
agra
ss h
ay6.
05.
011
.0 to
18.
01.
8 to
2.9
180
to 2
90.2
0 to
.34
20 to
34
1.3
to 2
.213
0 to
220
For
age
sorg
hum
sila
ge18
.06.
08.
0 to
12.
01.
3 to
1.9
156
to 2
28.2
2 to
.44
26 to
53
1.0
to 1
.512
0 to
180
Alfa
lfa h
ayla
ge10
.05.
018
.0 to
25.
02.
9 to
4.0
290
to 4
00.2
2 to
.49
22 to
49
1.5
to 2
.515
0 to
250
Per
enni
al p
eanu
t hay
lage
10.0
4.0
14.0
to 2
2.0
2.2
to 3
.517
6 to
280
.21
to .3
917
to 3
11.
5 to
2.2
120
to 1
76
1Ran
ges
obvi
ousl
y ex
ist i
n w
et w
eigh
t and
dry
mat
ter
(DM
) yi
elds
. Far
mer
s sh
ould
use
yie
ld h
isto
ries
to e
stim
ate
yiel
ds a
nd th
eir
own
com
posi
tion
hist
ory,
if k
now
n.
Archival copy: for current recommendations see http://edis.ifas.ufl.edu or your local extension office.

Dairy Manure Management: Strategies for Recycling Nutrients to Recover Fertilizer Value.... 21
Table 7.
Table 7. Manure worksheet for nitrogen: needed acreage for 100-cow group.
Category Diet N (NRC, high); System: Your Worksheet
1 2 3 4
MY=70 MY=70 MY=70 MY=70
Number of cows per group 100 100 100 100
Manure:
% to be flushed to holding pond 100 0 0 0
% to be flushed to anaerobic lagoon 0 100 25 25
% to be scraped from concrete daily 0 0 0 0
% scraped from dirt lot quarterly 0 0 75 0
% dropped in pasture 0 0 0 75
Lbs daily N excretion/cow 0.846 0.846 0.846 0.846
Lbs yearly N excretion/group 30879 30879 30879 30879
Lbs Lbs Lbs Lbs
Volatilized N on flush floors (5%) 1544 1544 386 386
N flushed for weekly irrigation 29335 0 0 0
N removed by solids separator screen 1574 0 0
N to holding pond--irrigation weekly 27761 0 0
Volatilized N from holding pond (15%) 4164 0 0
N irrigated from short-term holding 23597 0 0
N flushed to anaerobic lagoon 0 29335 7334 7334
N retained in sludge (10% of N) 0 2934 733 733
Volatilized N from lagoon (60%) 0 17601 4400 4400
N irrigated from lagoon--2nd stage 0 8801 2200 2200
N run- off from dirt lot (10% of original), held 0 0 2316 0
Volatilized N from dirt lot holding pond (65%) 0 0 1505 0
N irrigated from dirt lot holding pond 0 0 811 0
Total N applied through irrigation 23597 8801 3011 2200
Volatilized N during irrigation (20%) 4719 1760 602 440
Volatilized N on scraped floors (5%) 0 0 0 0
Volatilized N, pastures (60% of original) 0 0 0 13896
Volatilized N, dirt lot (65% after 10% runoff) 0 0 15054 0
Yearly lb N hauled on quarterly basis from dirt 0 0 5790 0
Volatilized N, land-spread from dirt lots (20%) 0 0 1158 0
Surface runoff (5% of crop applications) 1180 440 440 573
Irrigated N applied to plants 17697 6600 2258 1650
Screened solids, N applied to plants 1574 0 0 0
From Dirt lots, N applied to plants 4342
Archival copy: for current recommendations see http://edis.ifas.ufl.edu or your local extension office.

Dairy Manure Management: Strategies for Recycling Nutrients to Recover Fertilizer Value.... 22
Table 7.
Pasture N applied to plants 8801
Summary:
Total N in lagoon sludge 0 2934 733 733
Total N volatilized 10427 20905 23105 19122
Surface runoff 440
Summary: Total N applied to crops 19272 6600 6600 10451
Total N managed (= yearly excretion) 30879 30879 30879 30879
Percent of excreted applied annually as fertilizer
62% 21% 21% 34%
Annual $ value of fertilizer N and P applied $7340 $2512 $2516 $3980
Acres need/100 cows for manure for: acres acres acres acres
Irrigation if N/acre = 400 + 60 38.5 14.3 4.9 3.6
Scrapings from dirt lot, N/acre = 400 + 60 0 0 9.5 0
Screened solids, N/acre = 400 + 60 3.4 0 0 0
Pasture if N/acre = 400 + 60 0 0 0 19.1
Total acres needed annually, N basis 41.9 14.3 14.4 22.7
Future acres annualized for lagoon sludge 0 6.4 1.6 1.61Acres calculated by dividing nutrients applied to plants by estimated removal of 400 lbs N/yr for cultivated crops and pasture + 20 lbs/acre groundwater passage + 40 lbs/acre lost to denitrification.
Table 8.
Table 8. Manure worksheet for phosphorus: needed acreage for 100-cow groups.
P (.45% of diet): System: YourWorksheet1 2 3 4
Category MY = 70 MY = 70 MY = 70 MY = 70
Number of cows per group 100 100 100 100
% to be flushed to holding pond 100 0 0 0
% to be flushed to anaerobic lagoon 0 100 25 25
% to be scraped from concrete daily 0 0 0 0
% scraped from dirt lot quarterly 0 0 75 0
% dropped in pasture 0 0 0 75
Lbs daily P excretion / cow 0.138 0.138 0.138 0.138
Lbs yearly P excretion / group 5037 5037 5037 5037
Lbs Lbs Lbs Lbs
P flushed for weekly irrigation 5037 0 0 0
P removed by solids separator 394 0 0 0
P to holding pond--irrigation weekly 4643 0 0 0
Archival copy: for current recommendations see http://edis.ifas.ufl.edu or your local extension office.

Dairy Manure Management: Strategies for Recycling Nutrients to Recover Fertilizer Value.... 23
Table 8.
P irrigated from short-term holding 4643 0 0 0
P flushed to anaerobic lagoon 0 5037 1259 1259
P retained in sludge (50% of P) 0 2519 630 630
P irrigated from lagoon--2nd stage 0 2519 630 630
P runoff from dirt lot (20% of original) 0 0 756 0
P irrigated from dirt lot holding 0 0 756 0
Total P applied through irrigation 4643 2519 1385 630
Yearly lb P hauled daily from concrete 0 0 0 0
Yearly lb P hauled on quarterly basis from dirt 0 0 3022 0
Surface runoff (5% of crop applications) 232 126 220 220
Irrigated P applied to plants 4411 2393 1316 598
Screened solids, P applied to plants 394 0 0 0
From concrete, P applied to plants 0 0 0 0
From dirt lots, P applied to plants 0 0 2871 0
Pasture P applied to plants 0 0 0 3589
Summary:
Total P in lagoon sludge 0 2519 630 630
Surface runoff 232 126 220 220
P applied to crops 4805 2393 4187 4187
Total P managed (= yearly excretion) 5037 5037 5037 5037
Percent of excreted applied annually as fertilizer 95% 48% 83% 83%
Annual $ value of fertilizer P and N applied $8664 3416 $4495 $5647
Acres needed / 100 cows for manure for: acres acres acres acres
Irrigation if P / acre = 60 + 2 71.1 38.6 21.2 9.6
Scrapings from concrete, P / acre = 60+ 2 0 0 0 0
Scrapings from dirt lot, P / acre = 60+ 2 0 0 46.3 0
Screened solids, P / acre = 60 + 2 6.3 0 0 0
Pasture if P / acre = acre = 60+ 2 0 0 0 57.9
Total acres needed annually, P basis 77.5 38.6 67.5 67.5
Future acres annualize for lagoon sludge 40.6 10.2 10.21 Acres calculated by dividing nutrients available to plants by estimated removal of 60 lbs P / yr for cultivated crops and pasture + groundwater passage of 2 lbs/acre.
Archival copy: for current recommendations see http://edis.ifas.ufl.edu or your local extension office.

Dairy Manure Management: Strategies for Recycling Nutrients to Recover Fertilizer Value.... 24
Table 9.
Table 9. Acres needed per 100 cows with N or P criteria.
100-Cow Group N based P based
NRCLow NRCHigh .40%P .45%P
Milking cows:
100%, rapid irrigation
36.2 41.9 64.6 77.5
100%, anaerobic lagoon 1
12.3 14.3 32.1 38.6
25% lagoons, 75% dirt lots
12.3 14.4 56.2 67.5
25% lagoons, 75% pasture2
19.5 22.7 56.2 67.5
1 Future acres needed for annual application equivalent for lagoon sludge.
5.5 6.4 33.9 40.6
2 Future acres needed lagoon sludge for these systems where 25% of manure was flushed to anaerobic lagoons varied from annual acreage of 1.4 to 1.6 acres for N and 8.5 to 10.2 acres for P because of changes dietary N and P.
Archival copy: for current recommendations see http://edis.ifas.ufl.edu or your local extension office.