Embed Size (px)
Citation preview

OPPORTUNITIES IN DAIRY IN SOUTH-EAST ASIA
November 2014

OPPORTUNITIES FOR NEW ZEALAND DAIRY PRODUCTS IN SOUTH EAST ASIAPart of the New Zealand Government’s Food & Beverage Information Project;
Analysis completed Nov 2014; Released Mid 2015
www.foodandbeverage.govt.nz
iFAB 2015
THIS IS A SUMMARY DOCUMENT; NEW ZEALAND FIRMS SHOULD CONTACT CORIOLIS FOR ACCESS TO THE FULL REPORT

The Food and Beverage Information Project
The Food & Beverage Information Project is the first comprehensive overview of the state of New Zealand’s Food & Beverage (F&B) industry. Part of the Government’s Business Growth Agenda (BGA), it is an integrated programme of work focusing on the six key inputs businesses need to succeed, grow and add jobs; export markets, capital markets, innovation, skilled and safe workplaces, natural resources and infrastructure.
Essentially, the BGA Export Markets goal will require lifting the ratio of exports from today’s rate of 30% of GDP to 40% by 2025. This equates to doubling exports in real terms (or tripling exports in nominal non-inflation adjusted terms). This in turn equates to achieving a 7% per annum growth rate over the next twelve years.
This five-year project analyses the main sectors in F&B, including dairy, meat, seafood, produce, processed foods, and beverages, as well as providing an overview of how the industry is fairing in our major markets. It also conducts in-depth sector reviews on a rotating basis. The information is updated annually and feedback from users shows the project is acting as a vital tool for companies looking to expand and grow exports.
Why Food & Beverage?
The Food & Beverage industry is vitally important to the New Zealand economy. Food & Beverage accounts for 56% of our merchandise trade exports and one in five jobs across the wider value chain. In addition, F&B acts as a vital ambassador for the country, being in most cases the first exposure global consumers get to “Brand New Zealand.”
New Zealand’s F&B exports are growing strongly and the country’s export performance is strong and improving relative to peers. In the 15 years leading up to 2010, New Zealand's food and beverage exports grew at a compound annual rate of 7% per annum. So one way to look at the challenge is to ask – can we continue to grow our food & beverage exports at the same rate? To understand if this is possible we need to know what has been driving our success.
What is the purpose of the food and beverage information project?
The project pulls together the available information on the food and beverage industry into one place, in a form which is familiar and useful to business. The reports contain analysis and interpretation of trends and opportunities to materially assist with business strategy and government policy.
The information will be of vital use to businesses, investors, government, and research institutions as the industry expands and diversifies. This industry view will be very useful to government, enabling better dialogue and the opportunity to address issues collectively.
What benefit will this bring to businesses?
The Project will have many uses for businesses. These include:
– As a base of market intelligence to enable business to be much more targeted in their own market research
– Reviewing and informing offshore market development (including export and investment) strategies
– Assisting in identifying areas of innovation and R&D for the future
– Identifying strategic partners and collaborators– Enabling a company to benchmark performance with that
of its competitors– Monitoring industry activity– Gaining a better understanding of their own industry
sector– Identifying internal capability needs or external inputs
How will government use the reports?
This information will provide much greater insight into the industry, which is useful for a range of policy developments, from regulatory frameworks to investment in science and skills and facilitating access to international markets. In particular, a single source of factual information will enable government agencies to better coordinate their efforts across the system and be more responsive to addressing industry issues.
iFAB 2015

PROJECT OBJECTIVE & SCOPE
OBJECTIVE
This project seeks to provide strategic leadership and direction leading to the growth of New Zealand made packaged, consumer-ready dairy product exports.
The project focuses on retail dairy products in the South East Asia region. The research assesses six key markets in SE Asia (Thailand, Malaysia, Indonesia, Vietnam, the Philippines and Singapore) across seven key product groups (drinking milk, yoghurt, condensed/evaporated milk, cheese, butter/spreads, Infant food and ice cream.
SCOPE/OUT OF SCOPE
The research is market-focused, rather than from a New Zealand production perspective. The research focuses on branded retail products - products found on the shelves in SE Asian retail stores.
Firm level market share, particularly that of New Zealand firms was defined as out of scope.
For budget reasons, the research did not purchase and analyse item-level category scan data. While it touches on foodservice, it does not deeply analysethe sector, as there is no good “off-the-shelf” firm/brand data available. Industrial/ingredient use was out of scope, as “NZ Inc.” was assumed to have this under control.
This project uses data from a wide range of Euromonitor (www.euromonitor.com)
reports (multiple product categories across multiple countries). Euromonitor is an excellent source of consistent, high level data across global markets. This research does not present firm market shares across these markets or categories; please purchase this directly. Any organisation serious about exporting to these markets should become a Euromonitor subscriber.
4
LIMITATIONS
This report uses a range of information sources, both qualitative and quantitative.
The numbers in this report come from multiple sources. While we believe the data are directionally correct, we recognise the limitations in what information is available. In many cases different data sources disagree (e.g. Statistics New Zealand vs. FAO* vs. UN Comtrade). Many data sources incorporate estimates of industry experts.
As one example, in many cases, the value and/or volume recorded as exported by one country does not match the amount recorded as being received as imports by the counterparty [for understood reasons].
In addition, in some places, we have made our own clearly noted estimates.
Coriolis has not been asked to independently verify or audit the information or material provided to it by or on behalf of the Client or any of the data sources used in the project.
– The information contained in the report and any commentary has been compiled from information and material supplied by third party sources and publicly available information which may (in part) be inaccurate or incomplete.
– Coriolis makes no representation, warranty or guarantee, whether express or implied, as to the quality, accuracy, reliability, currency or completeness of the information provided in the report.
All trade data analysed in all sections of the F&B Information project are calculated and displayed in US$ (other than a few places where detailed data is not available). This is done for a range of reasons:
– It is the currency most used in international trade
– It allows for cross country comparisons (e.g. vs. Denmark)
– It removes the impact of NZD exchange rate variability
– It is more comprehensible to non-NZ audiences (e.g. foreign investors)
– It is the currency in which the United Nations collects and tabulates global trade data
The opinions expressed in this report represent those of the industry participants interviewed and the authors. These do not necessarily represent those of Coriolis Limited or the New Zealand Government.
This project was completed in November 2014.

This project is focused on consumer-ready dairy products sold at retail in South East Asia; it is not looking at ingredient dairy exports
5
SIMPLIFIED MODEL OF THE DAIRY CHAIN FROM FARM TO PLATE
Dairy farming
Agribusiness
Milk collection and primary dairy ingredient production
Milk collection & primary processing
Drinking milk products
Domestic consumer-readydairy products manufacturing
Butter/spreadable blends
Ice cream
Condensed/evaporated
Infant formula
Other specialty dairy based
Yoghurt
Cheese
South East Asia in-marketdairy products manufacturing
Other inputs
Packaging
Electricity/utilities
Other
Drinking milk products
Butter/spreadable blends
Ice cream
Condensed/evaporated
Infant formula
Other specialty dairy based
Yoghurt
Cheese
Industrial ingredients to non-dairy food manufacturing processes (e.g. baked goods)
Export Markets
Local New Zealand market
Retail
Foodservice
South East Asian market
Retail
Foodservice
INGREDIENT DAIRY EXPORTS
CONSUMER-READY DAIRY EXPORTS
Industrial ingredients to non-dairy food manufacturing processes (e.g. baked goods)
FOCUS OF RESEARCHConsumer-ready dairy products sold primarily at
retail in South East Asia
NOT THE FOCUS OF OUR RESEARCHIngredient dairy exports or domestic dairy
DOCUMENT STRUCTURE
SE Asia is an attractive market for New Zealand dairy firms
There are opportunities across all categories of the SE Asian dairy sector
Drinking milk products
Yoghurt
Condensed/evaporated
Cheese
Butter
Ice cream
Infant milk formula
6

South East Asia is the next logical market for New Zealand consumer-ready exporters with a strong presence in their home market (New Zealand, Australia and the Pacific Islands)
7
SSiittuuaattiioonn
South East Asia is a highly attractive market for New Zealand consumer-ready dairy exporters
– Next closest market after Australia– Population of 583m (more than all of Central and
South America) – Increasing wealth leading to increased demand for
imported food and beverages
South East Asia is a natural trading partner for New Zealand– Tropical environment unable to efficiently produce
dairy and many other temperate foodstuffs
New Zealand has a relatively strong presence in the region– Awareness by some consumers of New Zealand as a
quality supplier– Long term (100 year+) supply of dairy and meat– Particularly into former co-members of the British
Empire
Significant trade agreements in place or in development– AANZFTA1, 2010 (12 member) linkage in development– Malaysia NZ FTA, 2010– Thailand NZ, CEP, 2005– Singapore NZ CEP, 2001– TPP (In progress)
RReeccoommmmeennddeedd mmaarrkkeett eennttrryy ssttrraatteeggyy
Start in Singapore – High income country with rule-of-law that speaks
English– Only 5m people so “do-able” for New Zealand
manufacturing to scale-up to supply without major capital expenditure
– Modern supermarket sector consolidated into 3 chains– Commit to the market; treat as a “region of New
Zealand”; put salespeople in the market; regularly call on retailers; run promotions
– Central location that is a natural regional base and distribution hub
– Already imports proportionally a lot of F&B from New Zealand
Expand into Malaysia– Slightly larger population than Australia (28m people)– Already imports proportionally a lot of F&B from New
Zealand– Easily serviced from Singapore
Expand into other key markets in the region– Thailand, Indonesia, the Philippines and Viet Nam

South East Asian markets have similar cuisine with common building blocks; markets also face a similar set of issues
8
OVERVIEW OF KEY CHARACTERISTICS OF THE SOUTH EAST ASIAN FOOD & BEVERAGE MARKET ENVIRONMENT(2011
CCuuiissiinnee aanndd ccuullttuurree DDiissttrriibbuuttiioonn CCoommppeettiittiivvee eennvviirroonnmmeenntt
FFoooodd bbuuiillddiinngg bblloocckkss MMaarrkkeett cchhaarraacctteerriissttiiccss KKeeyy iimmppoorrtteedd tteemmppeerraattee ffooooddss aanndd bbeevveerraaggeess
- Rice- Tropical fruit (rambutan, durian, etc.)- Tropical/Asian vegetables- Chicken, seafood- Sauces (e.g. fish sauce)- Beer and local spirits
- Continuing strong presence of wet markets and fresh specialists
- Supermarket sector consolidated within markets but less so across markets
- Expenditure on foodservice/food away larger than retail food (i.e. “spend more in restaurants than in supermarkets”)
- European spirits (Brandy, Whisky, Gin)- Ingredient milk powder for local manufacturers to
turn into consumer dairy items (e.g. yoghurt drinks, infant formula)
- Apples- Beef
CCuullttuurraall && rreegguullaattoorryy cchhaarraacctteerriissttiiccss SSuuppppllyy cchhaaiinn iissssuueess KKeeyy ssuupppplliieerrss ooff tteemmppeerraattee ffooooddss aanndd bbeevveerraaggeess
- Religious limitations on protein consumption (Muslim peoples don’t eat pork and require meat to be halal)
- Multiple languages across region leading to requirement for packaging by country
- No common regional food standards or regulations- Muslim restrictions on alcohol consumption- Various degrees of alcohol intolerance (ALDH2
deficiency) within population (particularly those of East Asian origin)
- Markets somewhat bi-polar with world-class, best practice retailers (e.g. Tesco) alongside wet markets
- Modern supply chains developing in higher income countries with spread of chain supermarket operators
- Sophistication of supply chain more variable elsewhere
- Convoluted supply chain to support continuing significant role of numerous wet markets selling fresh meat, seafood, fruit and vegetables
- Australia- China- United States- Europe- New Zealand

New Zealand is effectively part of a wider South East Asian/Australasia super-region; regional trade blocks are deepening and merging
91. RCEP also includes India, China, South Korea & Japan; 2. TPP also includes Chile, Peru, USA, Canada, Mexico, Japan; 3. FTA Free Trade Agreement; CEP Closer Economic Partnership; Note: All 21 pacific island nations not shown or named; Source: Coriolis, MFAT,
MAP OF SOUTH EAST ASIA AND AUSTRALASIAN REGION2014
Myanmar
Philippines
Indonesia
Malaysia
Vietnam
Thailand
Singapore
Cambodia
Laos
PNG
Australia
New Zealand
Brunei
E. Timor
South-East Asia
AECASEAN Economic Community, 2015- 10 Nations - Forming Single market and
production base- Competitive Economic region
AU-NZ CERCloser Economic Relations, 1983- Free trade between AU & NZ
Single country deals
NZ-Malaysia FTA3, 2010NZ-Thailand CEP4, 2005NZ- Singapore CEP, 2001
AANZFTA ASEAN AU-NZ FTA, 2010
Super-regional deals
RCEP1
Regional Comprehensive Economic Partnership, negotiating
TPP2
Trans- Pacific Partnership, negotiating
Australasia

South East Asia has 22 times the population of Australasia and is forecast to experience faster GDP growth
252
30
65
5
90
101
7 15 0
51
5 24
SE Asia Australasia$158 $234
$1,283
$1,954
$901
$2,092
$302
$630
$370
$744
$276
$495
$146
$392
$250
$531
$124
$316
$37
$91
2014 2030
10Source: USDA ERS; World Bank; IMF; Coriolis analysis
POPULATION: SE ASIA VS. AUSTRALASIAPeople; m; 2014
REAL (INFLATION ADJUSTED) GDPUS$; 2010 real $; b; 2014a vs. 2030f
Indonesia
Malaysia
Thailand
Singapore
Vietnam
Philippines
LaoCambodia
Brunei
Myanmar
New ZealandAustralia
617m
28m
22x
Indonesia
Malaysia
Thailand
Singapore
Vietnam
Philippines
OtherMyanmar
New Zealand
Australia
5.4%
4.7%
4.5%
3.7%
6.4%
4.8%
5.8%6.0%
2.5%
2.7%
16y CAGR(14-30)
+$1,191b
+$328b
+$375b
+$219b
+$246b
+$281b
+$54b+$192b
+$76b
+$671b
16y ABS(14-30)
$3,847
$7,479

New Zealand has been active in the South East Asian regional dairy market for over 120 years
Country/Region Product Year of first recorded export Therefore in the market for…
Sumatra (now part of Indonesia) Butter/Cheese 1891 123 years
Straits Settlements (now Singapore & Malaysia) ButterCheeseMilk*
189218921904
122 years
Java (now part of Indonesia) Milk* 1902 112 years
Philippine Islands (now Philippines) CheeseButterMilk*
190219031904
112 years
Hong Kong CheeseMilk*Butter
190219021904
112 years
Siam (now Thailand) Butter 1904 110 years
11*Milk preserved by condensing or evaporating; Source: Historical New Zealand Department of Statistics annuals; Coriolis analysis
FIRST RECORDED NZ SHIPMENTS TO REGION1891-1904

New Zealand produces 63% of all raw milk in the SE Asia/Australasia super-region; New Zealand is the only regional producer significantly increasing production
New Zealand20,053 63%
Australia9,480 30% Thailand
1,064 3%
Indonesia1,018 3%
Vietnam 345 1%Malaysia 75 0%
Philippines 18 0%
-
5,000
10,000
15,000
20,000
1961
1964
1967
1970
1973
1976
1979
1982
1985
1988
1991
1994
1997
200
0
200
3
200
6
200
9
2012
12Source: UN FAO AgStat database; Coriolis analysis
RAW WHOLE FRESH MILK PRODUCTION VOLUMETonnes; 000; 2012
RAW WHOLE FRESH MILK PRODUCTION VOLUMETonnes; 000; 1961-2012
Indonesia
Malaysia
Thailand
VietnamPhilippines
New Zealand
Australia

New Zealand is the largest supplier of milk powder to South East Asia
New Zealand145
67%
Australia 33 15%
USA 7 3%
Canada 5 2%
Netherlands 6 3%
France 6 3%
Germany 2 1%Other
Europe 11 5%
Other 1 1%
13Note: Excludes inter-regional trade (e.g. Singapore to Malaysia); WMP (Unsweetened 040221 & Sweetened 040229); SMP (040210); 040229 includes some amount of bulk infant formula (IF) inseparable at source. Source: UN Comtrade database (custom job); Coriolis analysis
SE ASIA WHOLE MILK POWDER IMPORT VOLUME BY SOURCETonnes; 000; 2012
SE ASIA SKIM MILK POWDER IMPORT VOLUME BY SOURCETonnes; 000; 2012
New Zealand163
35%
Australia 84 18%
USA 119 26%
Canada 5 1%Netherlands 22
5%
France 17 4%Germany 18 4%
Other Europe34 7%
Other 2 0%
TOTAL = 217 (000) tonnes TOTAL = 463 (000) tonnes

New Zealand achieves a strong import share into South East Asia across most major dairy ingredients
82%
67%65% 64%
47%44% 42% 41%
36% 35% 33%30% 30%
27%22% 22%
9%5% 4% 2% 1%
14
Note: Includes inter-regional tradeSource: UN Comtrade database (custom job); Coriolis analysis
NEW ZEALAND SHARE OF TOTAL SE ASIAN REGIONAL IMPORT VOLUME: SELECT INGREDIENT DAIRY CODES% of tonnes; 2012

SE Asia is a large and growing market for New Zealand total dairy exports
$-
$500
$1,000
$1,500
$2,000
2002 2003 2004 2005 2006 2007 2008 2009 2010 2011 2012 2013
29.0%
30.9%
27.9%27.1%
29.5%30.8%
32.1%31.8%31.3%29.8%
27.3%27.1%
2002 2003 2004 2005 2006 2007 2008 2009 2010 2011 2012 2013
15Source: UN Comtrade database (custom job); Coriolis analysis
VALUE OF TOTAL NZ DAIRY EXPORTS TO SE ASIAUS$m; 2002-2013
NEW ZEALAND SHARE OF TOTAL REGIONAL DAIRY IMPORTS% of value; 2002-2013
11y CAGR(02-13)
13%

Leading firms in SE Asia are backwards integrating into New Zealand
16Source: Coriolis
INVESTMENTS BY DAIRY FIRMS WITH SIGNIFICANT OPERATIONS IN SE ASIA IN NEW ZEALANDAs of Nov 2014
Dairy blending & packing plantDrying plant
Hawke’s BayUHT plant JV
Acquired 2005Exited 2007
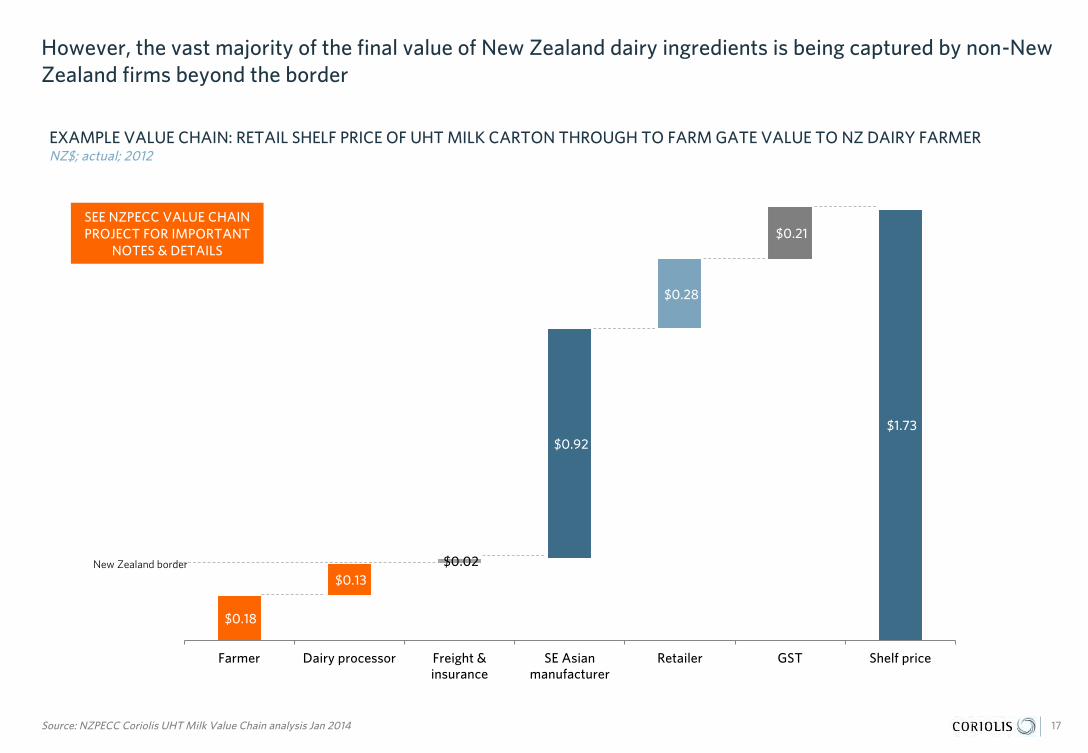
However, the vast majority of the final value of New Zealand dairy ingredients is being captured by non-New Zealand firms beyond the border
$0.18 $0.18 $0.18 $0.18 $0.18 $0.18
$0.13 $0.13 $0.13 $0.13 $0.13 $0.02 $0.02 $0.02
$0.92 $0.92 $0.92
$0.28 $0.28
$0.21
$1.73
Farmer Dairy processor Freight & insurance
SE Asian manufacturer
Retailer GST Shelf price
17Source: NZPECC Coriolis UHT Milk Value Chain analysis Jan 2014
EXAMPLE VALUE CHAIN: RETAIL SHELF PRICE OF UHT MILK CARTON THROUGH TO FARM GATE VALUE TO NZ DAIRY FARMER NZ$; actual; 2012
SEE NZPECC VALUE CHAIN PROJECT FOR IMPORTANT
NOTES & DETAILS
New Zealand border

DOCUMENT STRUCTURE
SE Asia is an attractive market for New Zealand dairy firms
There are opportunities across all categories of the SE Asian dairy sector
Drinking milk products
Yoghurt
Condensed/evaporated
Cheese
Butter
Ice cream
Infant milk formula
18

SE Asia is a growth region for dairy - all categories and markets are forecast to grow, albeit at varying rates
Drinking Milk Products Yoghurt
Cond./Evap. Milk Cheese
Butter/Spreadable
Infant Formula/Baby
Food
IceCream
Thailand 6% 7% 4% 6% 6% 6% 7%
Malaysia 5% 7% 4% 6% 5% 7% 4%
Singapore 4% 6% 2% 4% 3% 7% 5%
Indonesia 7% 9% 4% 10% 7% 7% 12%
Philippines 5% 5% 4% 4% 5% 5% 6%
Vietnam 14% 12% 7% 14% 12% 14% 16%
TOTAL 8% 8% 4% 7% 7% 8% 8%
19Source: Euromonitor; Coriolis analysis
5 YEAR FORECAST RETAIL DAIRY SALES GROWTH BY CATEGORY AND COUNTRYCAGR %; 2014-2018f
DOCUMENT STRUCTURE
SE Asia is an attractive market for New Zealand dairy firms
There are opportunities across all categories of the SE Asian dairy sector
Drinking milk products
Yoghurt
Condensed/evaporated
Cheese
Butter
Ice cream
Infant milk formula
20

Drinking milk products are a large and growing category in SE Asia where New Zealand provides much of the raw material
FOR AGAINST
- Powder and UHT products can be packed to final form in New Zealand
- Large category in SE Asia: US$5.9b
- Value growth forecast at 8% per annum (13-18)
- Significant per capita upside across all markets; particularly Indonesia, Philippines & Vietnam
- A major user of NZ dairy ingredients, particularly milk powder
- Reasonably fragmented beyond top two firms (Nestle & Friesland); consolidation opportunities going forward
- Region in long term transition to fresh/liquid with spread of refrigerators; “fresh” products must be produced in market
- Highly competitive with significantly more SKU on shelf and a wider range of competitors (than NZ domestic)
- Price competitive (e.g. UHT cheaper at retail vs. NZ)
- Despite domestic NZ “hype,” no clear demand for “Brand NZ” or New Zealand milk apparent on shelf in market
- Significantly more innovation going on in the category in SE Asia than in NZ; no clear technological/product leadership available to leverage
- Capital intensive nature of emerging/ongoing industry consolidation does not play to NZ strengths
- Lack of strong brands (e.g. Milo in flavoured powder drinks)
21

In total, drinking milk products account for more than a third of SE Asian dairy expenditure at retail (US$5.86b); unlike New Zealand or Japan, most SE Asian countries are more heavily weighted to dry drinking milk products; all markets are large and growing
Drinking milk products, $5,857 ,
35%
Other dairy$10,943
65%
Thailand, $1,545 , 24%
Malaysia$717 11%
Indonesia$1,642 25%
Vietnam$1,221 19%
Philippines$1,147 18% Singapore
$226 3%
22Source: Euromonitor; Coriolis analysis
SHARE OF TOTAL SE ASIA RETAIL DAIRY SALESUS$m; 2013
SE ASIA RETAIL DRINKING MILK SALES BY PRODUCTUS$m; 2013
Non-dairy milk$640 10%
Powder milk$1,546 24%
Flavoured powder drinks$1,393 21%
Flavoured milk drinks$1,173 18%
Fluid milk, $1,746 , 27%
SE ASIA DRINKING MILK SALES BY PRODUCT COUNTRYUS$m; 2013
14%
7%
6%
5%
5%
4%
Vietnam
Indonesia
Thailand
Philippines
Malaysia
Singapore
5Y FORECAST GROWTH RATE% CAGR; 13-18f
TOTALUS$16,800m TOTAL
Including non-dairyUS$6,498m
Ex-non-dairyUS$5,857m
Fluid(UHT & fresh)
45%Dry43%
TOTALUS$6,498m
Includes non-dairy

Product Example product Example IngredientsTypical products claims Typical usage in SE
Asia
Freshmilk
Milk Contains calciumSource of proteinLow fatHalalGMP/HACCP
Beverage
UHT milk
Milk From natural fresh milkLong lifeSkimmedAll natural goodnessNo preservativesRefrigerate after opening
Beverage
Flavouredfluid milk
Milk Solids, Sucrose, Permitted Stabiliser and Emulsifier, Calcium Carbonate, Permitted Flavouring, Strawberry Juice Concentrate, Vitamin C, Vitamin E, Nicotinamide, Calcium-D-Pantothenate, Pyridoxine (Vitamin B6), Thiamine (Vitamin B1), Permitted Colouring, Vitamin A, Vitamin K1, Vitamin D3
High calciumHigh proteinLow fatImprove bone strength
Beverage
Flavouredpowdered milk drinks
Protomalt Malt Extract (Contains Barley), Skimmed Milk, Sucrose, Cocoa, Palm Oil, Actigen-E (Dicalcium Phosphate, Magnesium Carbonate, Ascorbic Acid, Ferric Pyrophosphate, Nicotinamide, Calcium D-Pantothenate, Pyridoxine Hydrochloride, Thiamine Mononitrate, Riboflavin, D-Biotin), Disodium Phosphate, Vanillin and Cyanocobalamin
Rich in proteinEnergy food drinkRich in vitamins & minerals
Beverage
Powdered milk
Whole Milk Powder, Maltodextrin, Whey Powder, Lactose, Calcium Carbonate, Lecithin, Sodium Ascorbate, Ferric Pyrophosphate, Vitamin E Acetate, Calcium Pantothenate, Nicotinamide, Vitamin D3, Vitamin A Acetate, Pyridoxine Hydrochloride, Thiamine Hydrochloride
InstantFull creamHigh calciumLow fatHalal
Beverage
Milk is either sold as a fresh/UHT liquid or a reformulated product in many flavours and forms
23Source: various online shopping sites; various published articles; photo credit (fair use; complete product for illustrative purposes); Coriolis analysis
PRODUCT OVERVIEW: INGREDIENTS, CLAIMS AND USAGEExample; 2014

In all forms of milk, SE Asia has a wider range of brands on the shelf from a wider range of firms and companies than New Zealand
24Source: Countdown online (New Zealand); Tesco Malaysia online (Malaysia); photo credit (fair use; complete product for illustrative purposes); Coriolis analysis
EXAMPLE: MILK POWDER FOR ADULTS: TESCO (MALAYSIA) VS. COUNTDOWN (NEW ZEALAND)SKU; actual; Oct 2014
Singapore
New Zealand
+ three Tesco store brands

Category level SKU counts suggest SE Asia is highly competitive, with a much higher range density in almost every category
131
106
56
39
38
36
UHT Milk
UHT non-dairy
Fresh milk
Adult milk powder
Flavoured fresh milk
Flavoured powder milk
25Source: various online stores; Coriolis analysis
EXAMPLE: NUMBER OF SKU IN SELECT MILK CATEGORIES: TESCO LOTUS (THAILAND) VS. COUNTDOWN (NEW ZEALAND)SKU; actual; Oct 2014
19
22
34
9
33
37
THAILAND67m people
Total drinking milksales at retailUS$1,545m
NEW ZEALAND4m people
Total drinking milksales at retail
US$1,144m
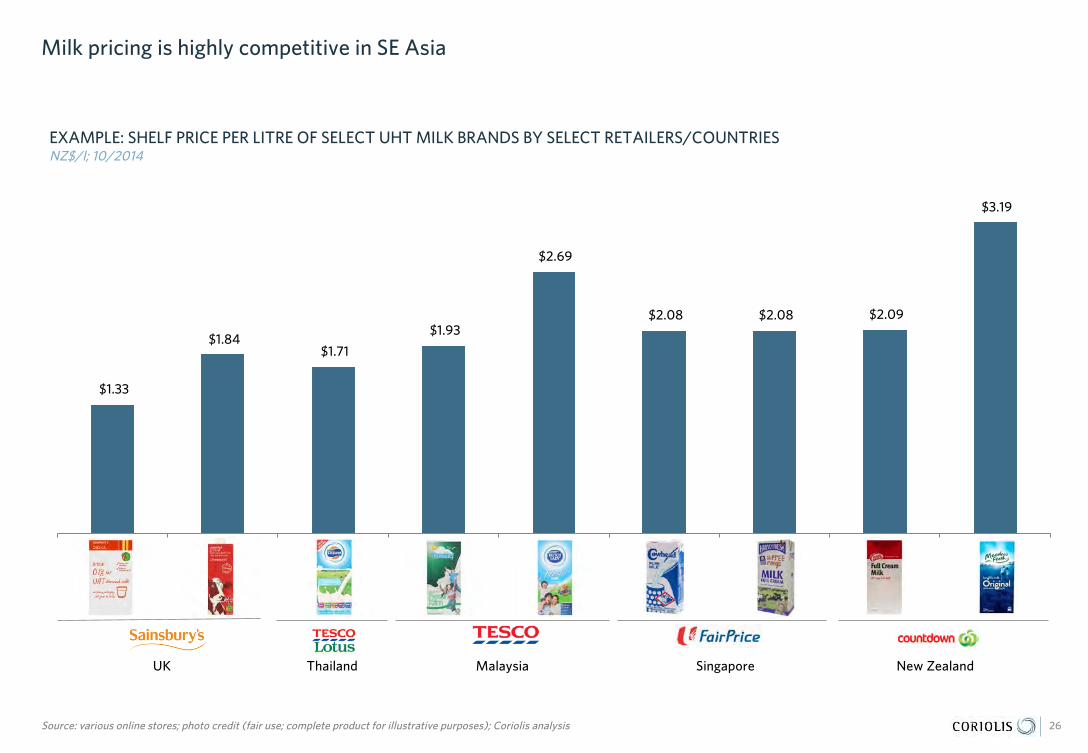
Milk pricing is highly competitive in SE Asia
$1.33
$1.84 $1.71
$1.93
$2.69
$2.08 $2.08 $2.09
$3.19
Basics Own Foremost Goodday Dutch Lady CH HF HB MF
26Source: various online stores; photo credit (fair use; complete product for illustrative purposes); Coriolis analysis
EXAMPLE: SHELF PRICE PER LITRE OF SELECT UHT MILK BRANDS BY SELECT RETAILERS/COUNTRIESNZ$/l; 10/2014
UK SingaporeMalaysiaThailand New Zealand

Observed in SE Asia region Observed in Anglo-Saxon markets (but not SEA)
Health
Indulgence
Convenience
Milk innovation primarily around wider health message - and most available innovation being implemented in SE Asia
27Source: various retailer sites; photo credit (fair use; complete product for illustrative purposes); Coriolis analysis
Bone/aging
Non-cow
Region-specific
Organic
A2Added Omega 3 & DHA
Added plant sterols, Omega 3 & 6
Lactose-free
Concentrate
Low fat
Bulk pack
Free range
Country-specific
Bagged/Low waste
Full cream
Reduced cholesterol
Flavoured
Vitamin fortified
Co-branded Café-branded
Non-dairy
Easy pour
High fibre

Country specific
Free rangegrass fed
Hormone/Antibiotic-free
Café branded
There were only very limited unoccupied positions available for new market entrants and niche players to create a point-of-difference
28Source: Coriolis analysis
Reduced cholesterol
Added Omega 3 &
DHA
Added plant sterols
A2
Non-cow
Regionspecific
Co-branded
Organic
Full cream Flavoured
Aged care
Bulkpack
Concentrate ResealableBagged
Low wasteEasy pour
Lactose-free Low fatVitamin fortified
“Pure”All natural
Highfibre
Observed in SE Asia region Observed in Anglo-Saxon markets (but not SEA) Potential unoccupied position(s)
Health
Indulgence
Convenience
Sheep/Goat

Regional production of whole fresh cow milk dominated by New Zealand and Australia; other countries are minor very minor producers
-
5,000
10,000
15,000
20,000
25,000
30,000
35,000
19611962196319641965196619671968196919701971197219731974197519761977197819791980198119821983198419851986198719881989199019911992199319941995199619971998199920
00
200
120
02
200
320
04
200
520
06
200
720
08
200
920
1020
1120
12
29
Note: Philippines shown (almost invisible) but not labeled for claritySource: UN FAO AgStat database; Coriolis analysis
SE ASIA & AUSTRALASIA REGIONAL TOTAL PRODUCTION VOLUME OF WHOLE FRESH COW MILK (RAW; ALL USES)Tonnes; 000; 1961-2012
ThailandMalaysia
Australia
IndonesiaVietnam
13%8%
1%
7%8%
+1,062+250
+3,203
+985+337
New Zealand 3% +14,836
51yCAGR
51yABS

DOCUMENT STRUCTURE
SE Asia is an attractive market for New Zealand dairy firms
There are opportunities across all categories of the SE Asian dairy sector
Drinking milk products
Yoghurt
Condensed/evaporated
Cheese
Butter
Ice cream
Infant milk formula
30
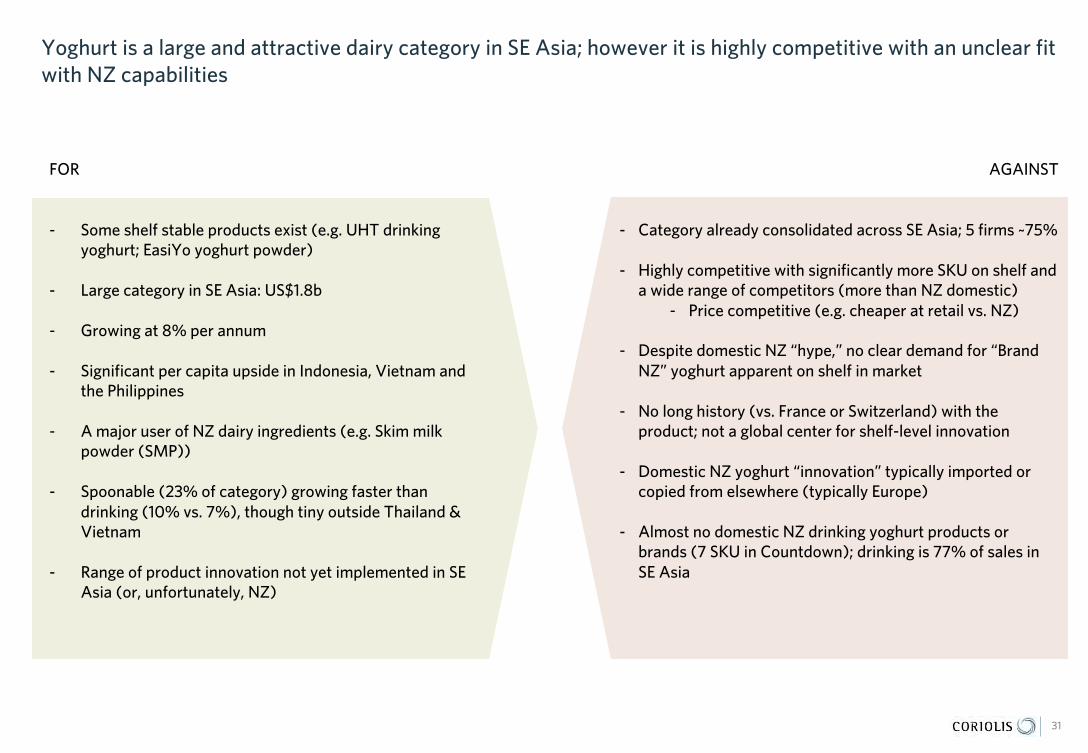
Yoghurt is a large and attractive dairy category in SE Asia; however it is highly competitive with an unclear fit with NZ capabilities
FOR AGAINST
- Some shelf stable products exist (e.g. UHT drinking yoghurt; EasiYo yoghurt powder)
- Large category in SE Asia: US$1.8b
- Growing at 8% per annum
- Significant per capita upside in Indonesia, Vietnam and the Philippines
- A major user of NZ dairy ingredients (e.g. Skim milk powder (SMP))
- Spoonable (23% of category) growing faster than drinking (10% vs. 7%), though tiny outside Thailand & Vietnam
- Range of product innovation not yet implemented in SE Asia (or, unfortunately, NZ)
- Category already consolidated across SE Asia; 5 firms ~75%
- Highly competitive with significantly more SKU on shelf and a wide range of competitors (more than NZ domestic)
- Price competitive (e.g. cheaper at retail vs. NZ)
- Despite domestic NZ “hype,” no clear demand for “Brand NZ” yoghurt apparent on shelf in market
- No long history (vs. France or Switzerland) with the product; not a global center for shelf-level innovation
- Domestic NZ yoghurt “innovation” typically imported or copied from elsewhere (typically Europe)
- Almost no domestic NZ drinking yoghurt products or brands (7 SKU in Countdown); drinking is 77% of sales in SE Asia
31

Yoghurt accounts for 11% of SE Asian dairy expenditure at retail (US$1,814m); more than three quarters of yoghurt sales are drinking (not spoonable)
Yoghurt, $1,814 , 11%
Other dairy$14,986
89%
32Source: Euromonitor; Coriolis analysis
SHARE OF TOTAL SE ASIA RETAIL DAIRY SALESUS$m; 2013
SHARE OF TOTAL SE ASIA RETAIL YOGHURT SALES BY FORMUS$m; 2013
SE ASIA RETAIL YOGHURT SALES BY COUNTRYUS$m; 2013
5Y FORECAST GROWTH RATE% CAGR; 13-18f
TOTALUS$16,800m
Spoonable$413 23%
Drinking$1,401 77%
TOTALUS$1,814m
Thailand, $670 , 37%
Malaysia$168 9%
Indonesia$401 22%
Vietnam$333 18%
Philippines$158 9%
Singapore$84 5%TOTAL
US$1,814m
12%
9%
7%
6%
6%
5%
Vietnam
Indonesia
Thailand
Malaysia
Singapore
Philippines

Product Example product Example IngredientsTypical products claims Typical usage in SE Asia
Drinking yoghurt
Water, Sucrose, Nata De Coco (Coconut Water, Acetobacter Aceti), Milk Solids, Strawberry Concentrate, Permitted Stabilisers, Permitted Flavouring, Citric Acid, Calcium Phosphate, Permitted Preservative, Permitted Colouring (E129) and Live Cultures (Streptococcus Thermophilus, Bifidobacterium BB-12, Lactobacillus Acidophilus LA-5, and Lactobacillus Delbruecki Subsp. Bulgaricus)
Low/no fatMade with fruit juiceHalal
Beverage
Cultured sour milk/yoghurt
Water, Fructose, Maltitol, Dried Skim Milk, Glucose, Flavouring, Live Lactobacillus CaseiShirota Strain
Halal Beverage
Spoonableyoghurt, plain
Pasteurised Skimmed Cows' Milk, Live Active Yoghurt Cultures (L. Bulgaricus, S. Thermophilus, L. Acidophilus, Bifidus, L. Casei)
SnackDessert
SE Asian consumers are drinking most of their yoghurt as a sweetened, formulated beverage
33Source: various online shopping sites; various published articles; Coriolis analysis
PRODUCT OVERVIEW: INGREDIENTS, CLAIMS AND USAGEExample; 2014

SE Asia has a wider range of brands on the shelf from a wider range of firms and companies than New Zealand, as this example from cultured, probiotic yoghurt drinks shows
34Source: Countdown online (New Zealand); Tesco Lotus online (Thailand); photo credit (fair use; complete product for illustrative purposes); Coriolis analysis
EXAMPLE: CULTURED, PROBIOTIC DRINKING YOGHURT: TESCO (MALAYSIA) VS. COUNTDOWN (NEW ZEALAND)SKU; actual; Oct 2014
Malaysia
New Zealand

Similar picture in drinking yoghurt
35Source: Countdown online (New Zealand); Tesco online (Malaysia); photo credit (fair use; complete product for illustrative purposes); Coriolis analysis
EXAMPLE: DRINKING YOGHURT: TESCO (MALAYSIA) VS. COUNTDOWN (NEW ZEALAND)SKU; actual; Oct 2014
Malaysia
New Zealand

Category level SKU counts suggest SE Asia is highly competitive in drinking, but retailers generally carry a much smaller range of spoonable
59
87
91
17
7
20
51
39
Tops Thailand
Tesco Malaysia
Tesco Thailand
CS Singapore
Countdown NZ
Vons USA
Tesco UK
Sainsbury UK
36Source: various online stores; Coriolis analysis
EXAMPLE: NUMBER OF SKU IN YOGHURT: SELECT RETAILERSSKU; actual; Oct 2014
38
72
122
123
167
319
360
378
DRINKING SPOONABLE
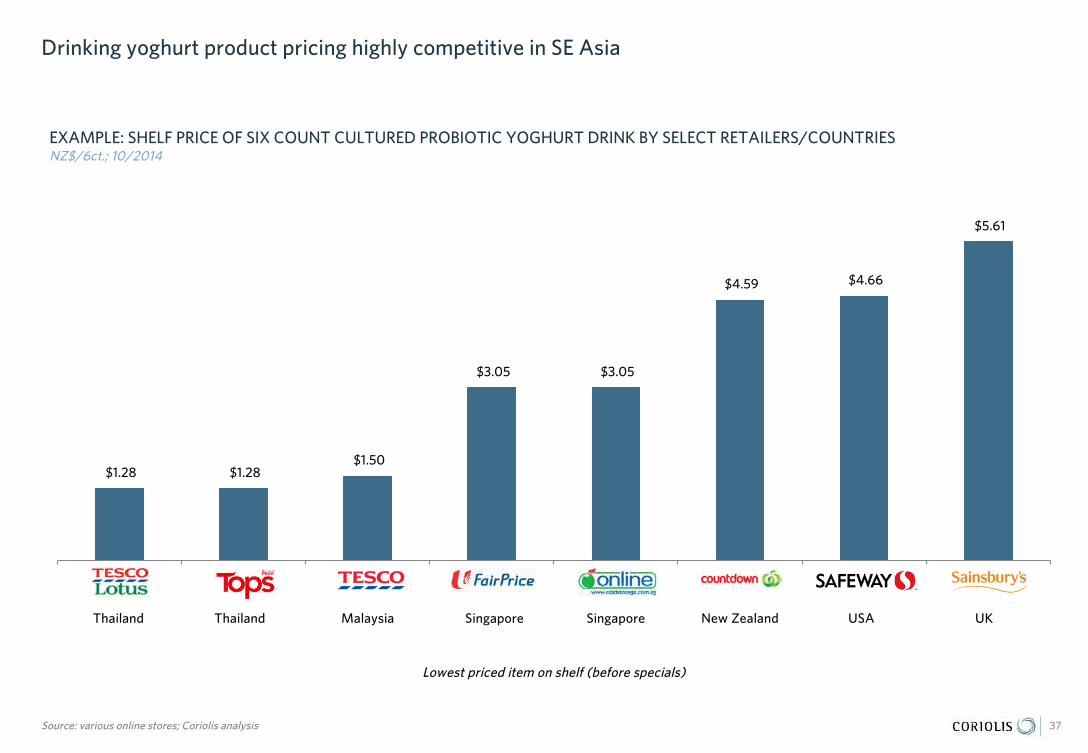
Drinking yoghurt product pricing highly competitive in SE Asia
$1.28 $1.28 $1.50
$3.05 $3.05
$4.59 $4.66
$5.61
Tesco TH Tops TH Tesco MY Fairprice Cold Storage Countdown Safeway Sainsbury
37Source: various online stores; Coriolis analysis
EXAMPLE: SHELF PRICE OF SIX COUNT CULTURED PROBIOTIC YOGHURT DRINK BY SELECT RETAILERS/COUNTRIESNZ$/6ct.; 10/2014
UKSingaporeMalaysiaThailand New ZealandThailand Singapore USA
Lowest priced item on shelf (before specials)

Product/category range expansion and innovation happening in SE Asian yoghurt category, but generally behind US/EU (as in New Zealand)
38Source: various retailer sites; photo credit (fair use; complete product for illustrative purposes); Coriolis analysis
Pouch/tube
No added sugar
Fruit layer
Multi-pack
Source ingredient
Cereal-top
Non-cow
Greek-style Corner/flip
Large pack
With cereal Branded flavour
Low fat
Natural
Non fat
Lassi type
Fromage frais
Honey-sweetened
Thick & CreamyCountry-specific
Pro-biotics
Lactose-free Non-dairy
Bone-health
Bircher
Honey layer
100 caloriesOrganic
Observed in SE Asia region Observed in Anglo-Saxon markets (but not SEA)
Health
Indulgence
Convenience

Greek style
Free rangegrass fed
Hormone/Antibiotic-free
Added cerealBranded flavour
There were only very limited unoccupied positions available for new market entrants and niche players to create a point-of-difference
39Source: Coriolis analysis
Lactose free
Organic
Low fat Bircher
Honey layer Corner/flip Cereal top
Bone-health claim
Country specific
Lassi type
Thick & creamy
Honey sweetened
Non fat
Multi-pack Large pack Pouch/tube
Fruit layer
No added sugar
Probiotics Natural Non-dairy
Named source region
ingredientNon-cow Fromage fraise
Observed in SE Asia region Observed in Anglo-Saxon markets (but not SEA) Potential unoccupied position(s)
Health
Indulgence
Convenience
Sheep/Goat

DOCUMENT STRUCTURE
SE Asia is an attractive market for New Zealand dairy firms
There are opportunities across all categories of the SE Asian dairy sector
Drinking milk products
Yoghurt
Condensed/evaporated
Cheese
Butter
Ice cream
Infant milk formula
40
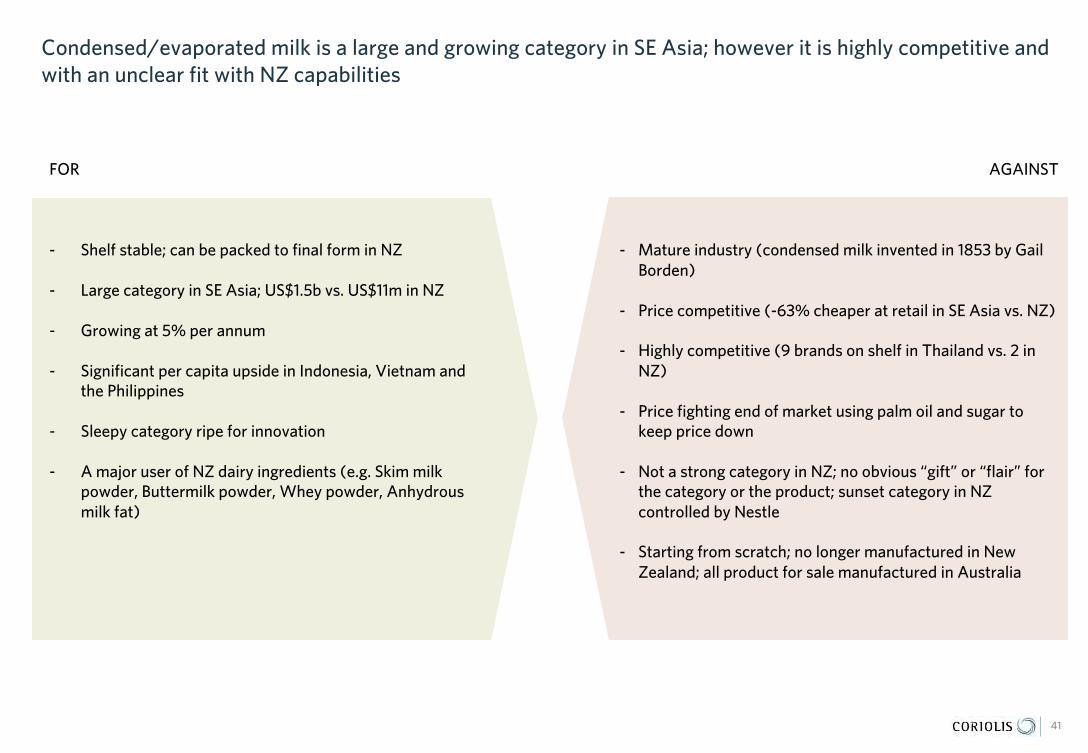
Condensed/evaporated milk is a large and growing category in SE Asia; however it is highly competitive and with an unclear fit with NZ capabilities
FOR AGAINST
- Shelf stable; can be packed to final form in NZ
- Large category in SE Asia; US$1.5b vs. US$11m in NZ
- Growing at 5% per annum
- Significant per capita upside in Indonesia, Vietnam and the Philippines
- Sleepy category ripe for innovation
- A major user of NZ dairy ingredients (e.g. Skim milk powder, Buttermilk powder, Whey powder, Anhydrous milk fat)
- Mature industry (condensed milk invented in 1853 by Gail Borden)
- Price competitive (-63% cheaper at retail in SE Asia vs. NZ)
- Highly competitive (9 brands on shelf in Thailand vs. 2 in NZ)
- Price fighting end of market using palm oil and sugar to keep price down
- Not a strong category in NZ; no obvious “gift” or “flair” for the category or the product; sunset category in NZ controlled by Nestle
- Starting from scratch; no longer manufactured in New Zealand; all product for sale manufactured in Australia
41

Cond/Evap Milk & Creamer, $1,491 ,
9%
Other dairy$15,309
91%
Convenience, $113 , 8%
Forecourt$16 1%
Hypermarket, $361 , 24%
Supermarket, $301 , 20%
Traditional grocery, $697 , 47%
Non-store$3/0%
Thailand, $364 , 24%
Malaysia$205 14%
Indonesia$458 31%
Vietnam$241 16% Philippines
$207 14%
Singapore$16 1%
Condensed/evaporated milk & creamer is a $1.5b category in SE Asia at retail, representing 9% of regional dairy spend; category showing moderate growth across all markets
42Source: Euromonitor; Coriolis analysis
SHARE OF TOTAL SE ASIA RETAIL DAIRY SALESUS$m; 2013
SE ASIA RETAIL COND./EVAP. MILK SALES BY CHANNELUS$m; 2013
SE ASIA RETAIL COND/EVAP SALES BY COUNTRYUS$m; 2013
5Y FORECAST GROWTH RATE% CAGR; 13-18f
TOTALUS$16,800m
TOTALUS$1,491m
TOTALUS$1,491m
7%
4%
4%
4%
4%
2%
Vietnam
Indonesia
Thailand
Malaysia
Philippines
Singapore

Products contain milk products and a range of other ingredients; wide ranging consumer usage, particularly of evaporated milk, however all are used in beverages (coffee & tea)
Product Example product
Example Ingredients Typical products claims Typical usage in SE Asia Example specific product usage
Evaporated milk
Milk Solids, Milk Fat, Permitted Stabilisers (Soya Lecithin), Stabiliser, Vitamin A Palmitate, Vitamin D3
High calciumHigh in Vitamin A & D3Full creamPremiumHalal
Baking, cooking & dessertsAdded to beveragesSubstitute for coconut milk Reconstituted into liquid milk
Egg custardRice puddingCakesCurries & kurmaCoffeeTea
Condensed milk
Sugar, Water, Milk Solid (Skim Milk Powder, Buttermilk Powder, Whey Powder), Anhydrous Milk Fat, Vitamin A Palmitate, Vitamin D3 and Vitamin B1 (Thiamine Hydrochloride
High calciumPremiumFull creamLow fatHalal
DessertsAdded to beverages
Oat porridgeSpread on breadCoffeeTea
Creamer(powder + liquid)
Sugars, Milk Solids, Palm Oil, Stabilisers, Vitamins (A, D3, B1)
Coffee creamerFor richer and creamier coffeeHalalNon-Dairy
Added to beverages CoffeeTeaCocoa
43Source: various online shopping sites; various published articles; Coriolis analysis
PRODUCT OVERVIEW: INGREDIENTS, CLAIMS AND USAGEExample; 2014

There are a wide range of products for sale in the market, from a wide range of suppliers and countries; none from New Zealand
44Source: Fair Price online (Singapore); photo credit (fair use; complete product for illustrative purposes); Coriolis analysis
EXAMPLE: RANGE OF PRODUCTS FOR SALE AT FAIR PRICE SINGAPOREOct 2014
EvaporatedMilk
CondensedMilk
DairyCreamer
400gMalaysia
395gSingapore
400gThailand
385gSingapore
385gSingapore
385gThailand
387gSingapore
387gSingapore
392gTBD
392gTBD
390gMalaysia
380gSingapore
388gThailand
380gSingapore
1kgSingapore450g
ThailandThailand
450gSingapore
RegionalGlobal brands Private Label

Unlike New Zealand, there are a wide range of brands and products; the category is not dominated by Nestle
Nestle Other brands Retailer brands
Thailand
New Zealand
45Source: Countdown online (New Zealand); Tesco Lotus online (Thailand); photo credit (fair use; complete product for illustrative purposes); Coriolis analysis
EXAMPLE: EVAPORATED/CONDENSED MILK RANGE: TESCO (THAILAND) VS. COUNTDOWN (NEW ZEALAND)SKU; actual; Oct 2014

6
12
3
6
6
11
7
9
5
4
2
4
1
11
14
4
7
5
8
5
3
6
8
37
22
26
8
9
4
7
77
2
1
NTUC Fairprice
Tesco
Tops
T Lotus
Wellcome
Parknshop
Sainsbury
Tesco
Safeway
Coles
Countdown
Asian markets have more brands and SKU’s on the shelf; USA a clear standout with strong creamer range, primarily non-dairy flavoured creamers
46SCM Sweetened condensed milk; Source: Grocery online stores; Coriolis
EXAMPLE: “OTHER DAIRY” STOCK KEEPING UNIT COUNTS BY SELECT COUNTRIESSKU’s; brands; Oct 2014
Evaporated Milk SCM
Creamer/Whitener
# of brandsStock Keeping Units (SKU’s)
8
12
15
18
9
10
3
6
8
1
5
Singapore
Thailand
Hong Kong
UK
USA
Australia
New Zealand
18
50
36
46
18
16
9
27
24
9
87
Dominated by non-dairy flavouredcreamers, virtually non-existent in Asia
Malaysia

Products are significantly cheaper at retail in SE Asia (and elsewhere) relative to New Zealand
$2.70 $2.70
$3.87 $3.87 $3.25 $3.25
$3.88 $4.05 $4.00 $4.57
$10.37 $10.37
47
Note: The NZ$ generally trades at parity to the S$; GBP uses NZ$2.01 exchange rate of Oct 2014Source: Countdown online (New Zealand); NTUC Fair Price online (Singapore); photo credit (fair use; complete product for illustrative purposes); Coriolis analysis
EXAMPLE: EVAPORATED MILK SHELF PRICE PER LITRE: SINGAPORE VS. NEW ZEALANDS$/NZ$ per litre; Oct 2014
UnweightedaverageS$3.83
Unweightedaverage
NZ$10.37
-63%
Price fighter products typically have more palm
oils and less dairy
UnweightedaverageS$3.83
United Kingdom Singapore
New Zealand

Product/category innovation limited relative to Anglo-Saxon markets
Observed in SE Asia region Observed in Anglo-Saxon markets (but not SEA)
Health
Indulgence
Convenience
48Source: various retailer sites; photo credit (fair use; complete product for illustrative purposes); Coriolis analysis
Low fat Reduced calorie
Resealable/pourer Easy pour
Wide and deep flavour range (e.g 50+ creamer flavours in USA: white chocolate mocha, Cinnabon, peppermint pattie, hazelnut and pecan, spiced pumpkin etc.)
Vitaminised High calcium Fat-free
Single serve
“all natural”
Tube Squeezy
“Fat free and sugar free”

Low fatAdded
vitaminsReducedcalorie
OrganicFree rangeGrass fed
Hormone/Antibiotic-free
100% dairySource region
specific
Easypour
Resealable
FlavoursSheep or goat
There are a number of unoccupied positions available for new market entrants and niche players to create a point-of-difference
49Source: various retailer sites; photo credit (fair use; complete product for illustrative purposes); Coriolis analysis
Fat-freeFat and sugar
freeAll natural
Tube Squeezy Single serve
Lactose-free
Observed in SE Asia region Observed in Anglo-Saxon markets (but not SEA) Potential unoccupied position(s)
Health
Indulgence
Convenience
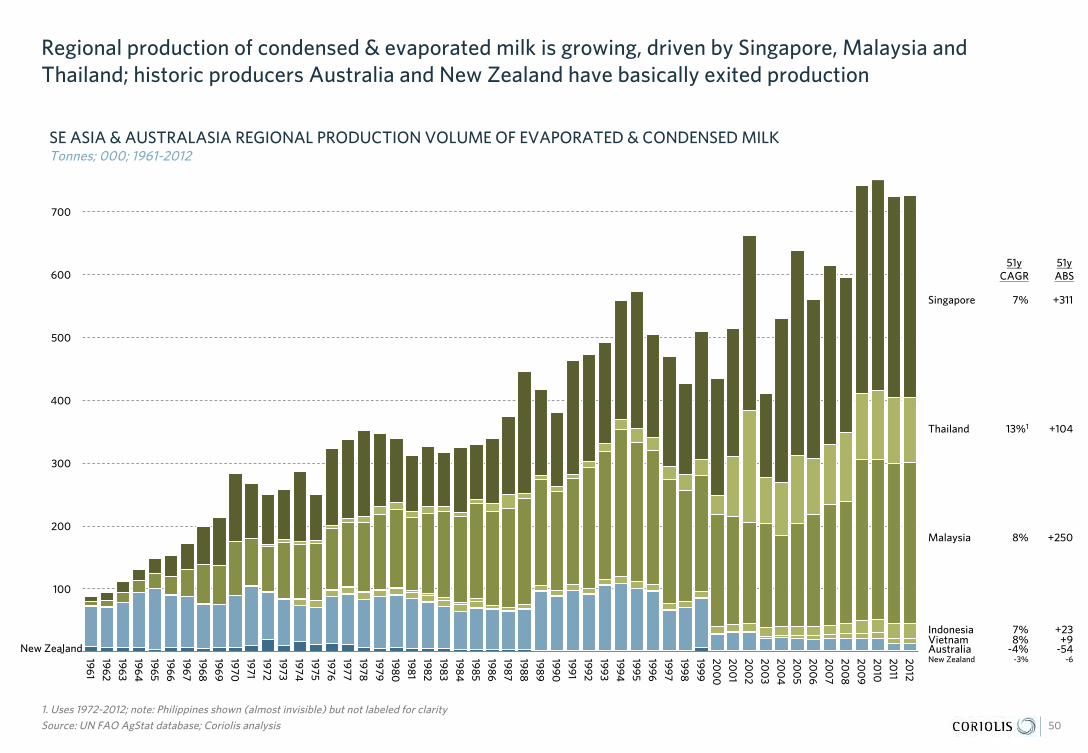
Regional production of condensed & evaporated milk is growing, driven by Singapore, Malaysia and Thailand; historic producers Australia and New Zealand have basically exited production
-
100
200
300
400
500
600
700
1961
1962
1963
1964
1965
1966
1967
1968
1969
1970
1971
1972
1973
1974
1975
1976
1977
1978
1979
1980
1981
1982
1983
1984
1985
1986
1987
1988
1989
1990
1991
1992
1993
1994
1995
1996
1997
1998
1999
200
0
200
1
200
2
200
3
200
4
200
5
200
6
200
7
200
8
200
9
2010
2011
2012
50
1. Uses 1972-2012; note: Philippines shown (almost invisible) but not labeled for claritySource: UN FAO AgStat database; Coriolis analysis
SE ASIA & AUSTRALASIA REGIONAL PRODUCTION VOLUME OF EVAPORATED & CONDENSED MILKTonnes; 000; 1961-2012
Singapore
Thailand
Malaysia
New Zealand Australia
IndonesiaVietnam
7%
13%1
8%
-4%
7%8%
+311
+104
+250
-54
+23+9
New Zealand -3% -6
51yCAGR
51yABS

DOCUMENT STRUCTURE
SE Asia is an attractive market for New Zealand dairy firms
There are opportunities across all categories of the SE Asian dairy sector
Drinking milk products
Yoghurt
Condensed/evaporated
Cheese
Butter
Ice cream
Infant milk formula
51
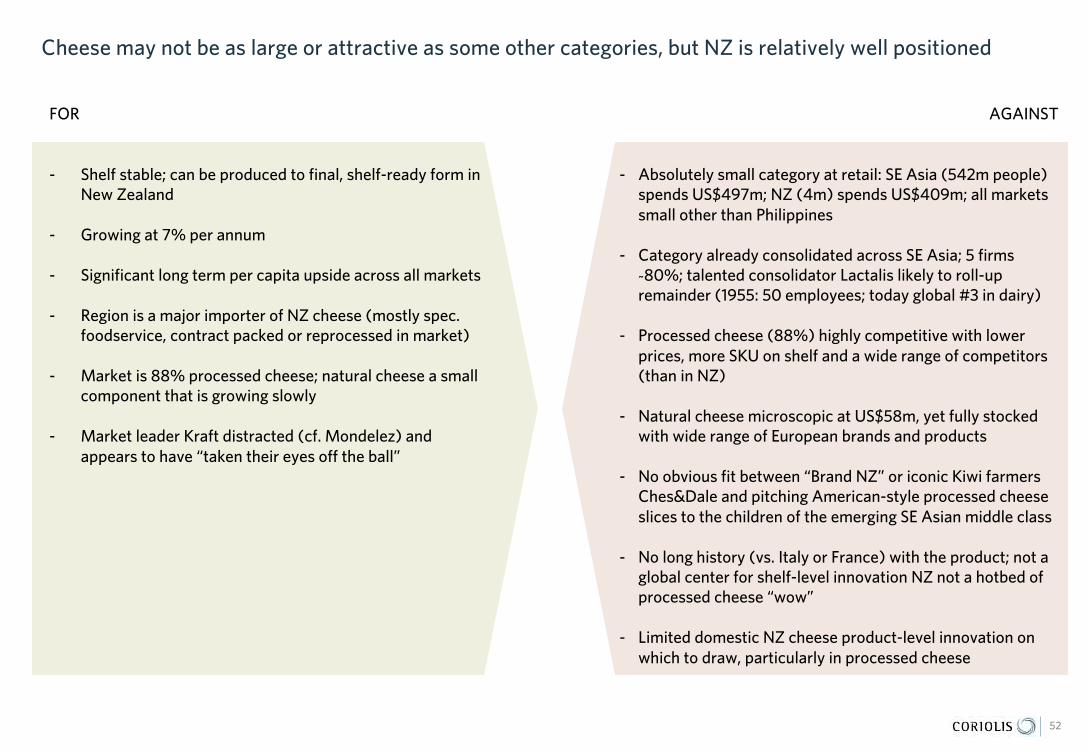
Cheese may not be as large or attractive as some other categories, but NZ is relatively well positioned
FOR AGAINST
- Shelf stable; can be produced to final, shelf-ready form in New Zealand
- Growing at 7% per annum
- Significant long term per capita upside across all markets
- Region is a major importer of NZ cheese (mostly spec. foodservice, contract packed or reprocessed in market)
- Market is 88% processed cheese; natural cheese a small component that is growing slowly
- Market leader Kraft distracted (cf. Mondelez) and appears to have “taken their eyes off the ball”
- Absolutely small category at retail: SE Asia (542m people) spends US$497m; NZ (4m) spends US$409m; all markets small other than Philippines
- Category already consolidated across SE Asia; 5 firms ~80%; talented consolidator Lactalis likely to roll-up remainder (1955: 50 employees; today global #3 in dairy)
- Processed cheese (88%) highly competitive with lower prices, more SKU on shelf and a wide range of competitors (than in NZ)
- Natural cheese microscopic at US$58m, yet fully stocked with wide range of European brands and products
- No obvious fit between “Brand NZ” or iconic Kiwi farmers Ches&Dale and pitching American-style processed cheese slices to the children of the emerging SE Asian middle class
- No long history (vs. Italy or France) with the product; not a global center for shelf-level innovation NZ not a hotbed of processed cheese “wow”
- Limited domestic NZ cheese product-level innovation on which to draw, particularly in processed cheese
52

Cheese is a relatively small (US$497m) category in SE Asia at retail; market is primarily (88%) processed; Philippines accounts for half the market; other markets quite small, though Vietnam and Indonesia stand out for growth
53Source: Euromonitor; Coriolis analysis
SHARE OF TOTAL SE ASIA RETAIL DAIRY SALESUS$m; 2013
SE ASIA RETAIL CHEESE SALES BY FORMUS$m; 2013
SE ASIA RETAIL CHEESE SALES BY COUNTRYUS$m; 2013
5Y FORECAST GROWTH RATE% CAGR; 13-18f
14%
10%
6%
6%
4%
4%
Vietnam
Indonesia
Thailand
Malaysia
Philippines
Singapore
Cheese$497 3%
Other dairy$16,303
97%
TOTALUS$16,800m
New Zealand4.3m people
US$409m (13)
vs.
SE Asia542m people
US$497m (13)Natural
$58 12%
Processed$440 88%
TOTALUS$497m
Thailand, $46 , 9%
Malaysia$28 6%
Indonesia$78 16%
Vietnam$51
10%
Philippines, $250 , 50%
Singapore $45 9%
TOTALUS$497m

Product Example product Example Ingredients Typical products claims Typical usage in SE AsiaExample specific product usage
Natural cheese
Pasteurised Cow's Milk, Salt, Lactic Culture, Microbial Rennet, P. Candidum
Made in… SnackDessert
On a cheeseboard
Natural cheese, shredded
Pasteurised Cow's Milk, Lactic Culture, Salt (1.6%), Microbial Rennet, COLOUR: Annatto (E160B), ANTI-CAKING: Potato Starch
Refrigerate after opening Topping Topping on pasta
Spreadable cheese
Rehydrated Skimmed Milk, Butter, Cheeses, Milk Proteins, Emulsifying Salts: Sodium Polyphosphates (E452), Citrates (E331), Diphosphates (E450), and Phosphates (E339), Salt, Acidity Regulator: Citric Acid (E330)
SpreadableAll natural60% less fat than butterHalal
SnackSpread
Snack for children
Processed cheese
Cheddar Cheese (Milk, Salt, Starter Cultures, Enzymes - Rennet), Water, Milk Solids, Emulsifiers (E339Ii, E339I, E341Iii), Acidity Regulator (E270, E331Iii), Salt, Preservative (E200), Natural Colour(E160B)
High calciumReduced fatValue packHalal100% AustralianSliced
Snack Snack for children
“Natural cheese” typically has a shorter list of ingredients than “processed cheese”; both are used primarily by consumers as a snacking product in SE Asia
54Source: various online shopping sites; various published articles; Coriolis analysis
PRODUCT OVERVIEW: INGREDIENTS, CLAIMS AND USAGEExample; 2014

SE Asia has a wider range of brands on the shelf from a wider range of firms and companies than New Zealand
55Source: Countdown online (New Zealand); Tesco Lotus online (Thailand); photo credit (fair use; complete product for illustrative purposes); Coriolis analysis
EXAMPLE: SLICED PROCESSED CHEESE: TESCO (MALAYSIA) VS. COUNTDOWN (NEW ZEALAND)SKU; actual; Oct 2014
Malaysia
New Zealand

The total range of cheese carried by retailers in SE Asia is lower than in Anglo-Saxon countries, driven primarily by lower natural/specialty cheese ranges
432
376
356
331
177
136
129
100
TUK
SUK
CNZ
CAU
CS
HK
TL
TM
56Source: various online stores; Coriolis analysis
EXAMPLE: TOTAL CHEESE STOCK KEEPING UNIT COUNTS BY SELECT RETAILERS/COUNTRIESSKU’s; brands; Oct 2014
Singapore
Thailand
Hong Kong
UK
Australia
New Zealand
Malaysia

Processed cheese pricing is highly competitive in SE Asia
$12.24
$15.30 $15.68
$18.06
$16.42
$18.53 $18.53
$16.60
$19.80 $20.15
Sainsbury Dairylea Fairprice Kraft Anchor Kraft Anchor Signature Mainland Chesdale
57Source: various online stores; photo credit (fair use; complete product for illustrative purposes); Coriolis analysis
EXAMPLE: SHELF PRICE PER KILOGRAM OF SELECT SLICED PROCESSED CHEESE BRANDS BY SELECT RETAILERS/COUNTRIESNZ$/kg; 10/2014
UK Singapore Malaysia Thailand New Zealand Hong Kong

Observed in SE Asia region Observed in Anglo-Saxon markets (but not SEA)
Health
Indulgence
Convenience
Product/category range expansion and innovation robust in SE Asian cheese category – though typically imported from another region
58Source: various retailer sites; photo credit (fair use; complete product for illustrative purposes); Coriolis analysis
Aerosol
Light
Shredded
Non-cow
Breaded portions
Smoked
Meal kit “Barrel aged”
Shaker
Cheese board Branded flavour
Lactose-freeOrganic
Portions
Low fat
Resealable Pre-sliced
Flavoured
Easy pour Squeezable
Specific use
Full fat
Bulk wheel
Value pack
Aged
Assorted
Kids pack Spreadable
“Candy cheese”
Low salt
Region-specific

Meal kit
Free rangegrass fed
Hormone/Antibiotic-free
Branded flavour
Non-cow
There were only very limited unoccupied positions available for new market entrants and niche players to create a point-of-difference
59Source: Coriolis analysis
All naturalOrganic Light Reduced salt
“Barrel aged”
Spreadable
Breaded portions
Cheese board
Lactose-free
Assorted
Flavours
“Candy cheese”
Bulk wheel
Low fat
Aged
Shredded
Pre-sliced
Portions
Value-pack
Resealable
Kids pack
Shaker
Squeezable
Aerosol Easy pour
Full fat
Observed in SE Asia region Observed in Anglo-Saxon markets (but not SEA) Potential unoccupied position(s)
Health
Indulgence
Convenience
Country/region
specific
Sheep/Goat

DOCUMENT STRUCTURE
SE Asia is an attractive market for New Zealand dairy firms
There are opportunities across all categories of the SE Asian dairy sector
Drinking milk products
Yoghurt
Condensed/evaporated
Cheese
Butter
Ice cream
Infant milk formula
60

Butter, and the wider spreadable oil/fat category, is highly competitive, particularly at the price end of the market; however New Zealand has a strong position on which to build
FOR AGAINST
- Butter is a pure import not produced in region; New Zealand is a major global producer with growing volume
- Semi-shelf stable; can be packed to final form in NZ
- Pure butter is a premium product with a unique flavourprofile that sells at a significant premium to margarine
- Butter/vegetable oil blends give the ability to moderate price relative to margarine
- European brands setting a high pricing umbrella in pure butter
- Not major consumers of either pure butter or spreadable blends; primarily used in cooking
- Japan suggests limited long-term upside
- Highly competitive category- Premium European brands- Price competitive Australian supply- Low cost local fat blends (palm, coconut, soy)
- Potential to be squeezed between global category leader (Unilever) and a wide array of low cost, local fat producers
- Cooking use price constrained by the price of substitutes (palm oil and palm margarines) which is significantly lower
61

Butter$275 5%
Spreadable oils & fats $276 5%
Margarine$398 8%
Vegetable & seed oil
$4,357 82%
Butter is a relatively small (US$275m) category in SE Asia; part of wider oils & fats super-category, where it forms 5% of value; Indonesia and Philippines stand out for total market size; Vietnam for growth
62Source: Euromonitor; Coriolis analysis
SE ASIA RETAIL SPREADABLE FAT SALES BY COUNTRYUS$m; 2013
5Y FORECAST GROWTH RATE% CAGR; 13-18f
12%
7%
6%
5%
5%
3%
Vietnam
Indonesia
Thailand
Philippines
Malaysia
Singapore
% TOTAL SEA RETAIL DAIRY SALESUS$m; 2013
% SEA OIL & FAT $ BY FORM% US$M; 2013
Thailand, $60 , 6%
Malaysia$72 8%
Indonesia$468 50%
Vietnam$88 9%
Philippines, $241 , 25%
Singapore $21 2%
TOTALUS$949m
Butter$275 2%Other dairy
$16,525 98%
TOTALUS$16,800m
Spreadable Fat $94918%
TOTALUS$5,306m
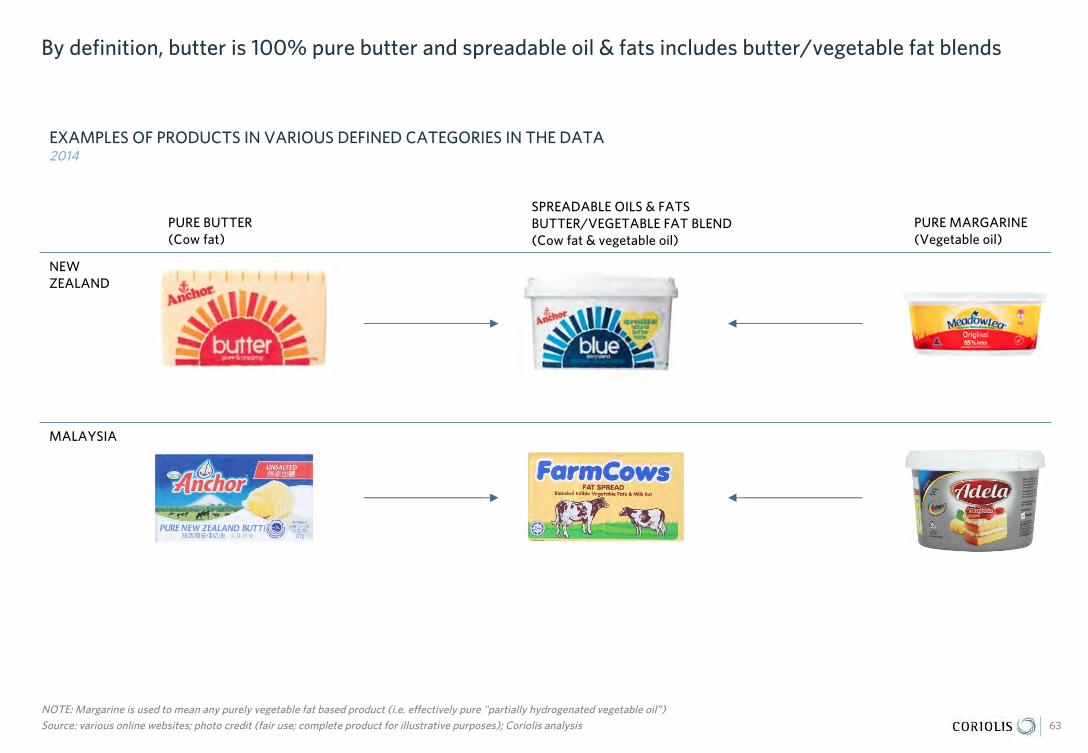
By definition, butter is 100% pure butter and spreadable oil & fats includes butter/vegetable fat blends
63
NOTE: Margarine is used to mean any purely vegetable fat based product (i.e. effectively pure "partially hydrogenated vegetable oil”)Source: various online websites; photo credit (fair use; complete product for illustrative purposes); Coriolis analysis
EXAMPLES OF PRODUCTS IN VARIOUS DEFINED CATEGORIES IN THE DATA2014
PURE BUTTER(Cow fat)
SPREADABLE OILS & FATSBUTTER/VEGETABLE FAT BLEND(Cow fat & vegetable oil)
NEW ZEALAND
MALAYSIA
PURE MARGARINE(Vegetable oil)

Product Example product Example Ingredients Typical products claims Typical usage in SE Asia Example specific product usage
Purebutter
Pasteurised Cream (Min 80% Milk Fat), Water, Salt
CreamyPure creameryUnsalted/saltedLow saltSpreadableHalal
Ingredient in baking, cooking, sauces etc.Non-stick oil/fat for fryingSpread (on toast)
- Cakes & pastry- Spread on toast and pancakes- Fry onions at beginning of
cooking
Spreadable butter
Butter, water, canola oil, salt Spreadable
Blend Palm Oil, Palm Kernel Oil, Milk Fat, Milk Product, Salt, Soya Lecithin, Contains Permitted Emulsifier, Flavourings and Colouring (Beta Carotene)
HalalTransfat-free
Margarine Vegetable Oils (65%) (Containing 52% Canola & Sunflower Oil), Water, Milk Solids, Salt, Emulsifiers (E471, E322 (Soya Lecithin)), Preservative (E202), Acidity Regulator (E270), Colour(E160A), Vitamin A & D, Flavour
HalalTransfat-freeVegetarian
Products vary in terms of butter content
64Source: various online shopping sites; various published articles; Coriolis analysis
PRODUCT OVERVIEW: INGREDIENTS, CLAIMS AND USAGEExample; 2014

Butter sells at a significant premium to margarine – up to ten times as much per kilogram; butter/margarine blends have intermediate pricing between the two
$1.55
$4.26
$6.65 $8.51 $8.56
$16.21
$21.30
$25.76
$40.35
Tesco 1kg Adela 1kg Farm Cows Buttercup Daisy Anchor Ballantyne spreadable
Lurpak SCS pack
65Source: various online websites; photo credit (fair use; complete product for illustrative purposes); Coriolis analysis
EXAMPLE: RETAIL SHELF PRICE PER KILOGRAM OF SELECT BUTTER/SPREADABLE OILS & FATS/MARGARINE IN TESCO MALAYSIANZ$/kg; 11/2014
10.5x 2.4x 1.9x

There are a wide range of different butter brands available in SE Asia, as this example from Thailand shows
Thailand
New Zealand
66Source: Countdown online (New Zealand); Tesco Lotus online (Thailand); photo credit (fair use; complete product for illustrative purposes); Coriolis analysis
EXAMPLE: BLOCK BUTTER RANGE: TESCO LOTUS (THAILAND) VS. COUNTDOWN (NEW ZEALAND)SKU; actual; Oct 2014

SE Asian retail shelves appear well stocked with a wide range of SKU, particularly when considered proportional to per capita expenditure
29
22
18
19
16
22
17
12
11
20
26
16
16
6
7
4
6
7
7
1
4
4
1
1
2
1
1
1
1
TUK
SUK
CAU
SUS
TL
HK
CS
TM
CNZ Block Spread Portion Flavour
67Source: various online stores; Coriolis analysis
EXAMPLE: BUTTER STOCK KEEPING UNIT COUNTS BY SELECT COUNTRIESSKU’s; brands; Oct 2014
Singapore
Thailand
Hong Kong
UK
USA
Australia
New Zealand
Malaysia
50
49
36
35
30
30
26
23
19
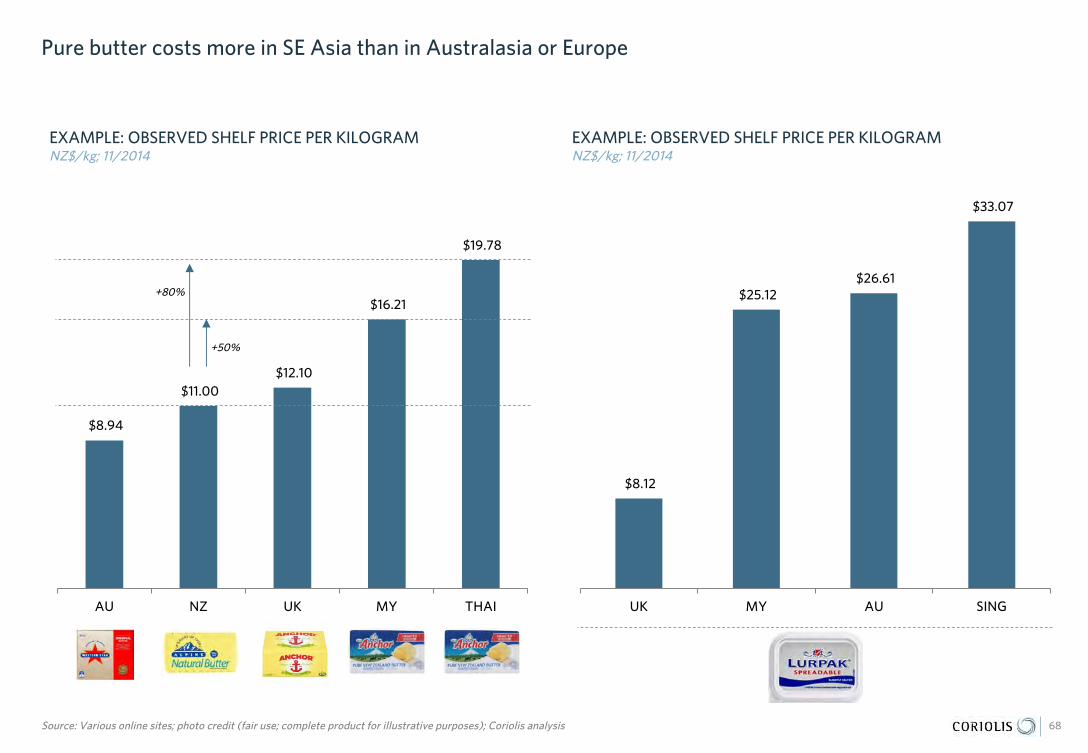
Pure butter costs more in SE Asia than in Australasia or Europe
$8.94
$11.00 $12.10
$16.21
$19.78
AU NZ UK MY THAI
$8.12
$25.12 $26.61
$33.07
UK MY AU SING
68Source: Various online sites; photo credit (fair use; complete product for illustrative purposes); Coriolis analysis
EXAMPLE: OBSERVED SHELF PRICE PER KILOGRAMNZ$/kg; 11/2014
EXAMPLE: OBSERVED SHELF PRICE PER KILOGRAMNZ$/kg; 11/2014
+50%
+80%

$1.68 $1.68 $1.88 $1.96
$1.56 $1.74
$2.04 $2.25
$2.06 $2.27 $2.32 $2.32
$2.48 $2.48
$2.78 $2.78
$4.16
European brands are achieving a price premium in Asia
69
1. Source unclear; Note: Exchange rate as at Oct 2014Source: Countdown online (New Zealand); NTUC Fair Price online (Singapore); photo credit (fair use; complete product for illustrative purposes); Coriolis analysis
EXAMPLE: RETAIL PRICE PER 100G OF BLOCK BUTTER BY SOURCE COUNTRY AT COLD STORAGE SINGAPORENZ$ per 100g; Oct 2014
Denmark France Australia New Zealand
Singapore1

Product/category range expansion and innovation limited relative to Anglo-Saxon markets
Observed in SE Asia region Observed in Anglo-Saxon markets (but not SEA)
Health
Indulgence
Convenience
70Source: various retailer sites; photo credit (fair use; complete product for illustrative purposes); Coriolis analysis
Whipped
“Lighter” “Salt reduced”
Portions
Non-cow
Region specificFlavoured
Sweetened
Sticks
“Sea salt”
Organic
Lactose-free

Flavours
Free rangegrass fed
Hormone/Antibiotic-free
Non-cow(sheep)
Non-cow(goat)
Ingredient specific (sea
salt)
There are a number of unoccupied positions available for new market entrants and niche players to create a point-of-difference; the lack of a strong health position stands out as an opportunity
71Source: Coriolis analysis
All natural
Sliced/Portioned
OrganicLighter
Reduced salt
Resealable Tube Squeezy
Sweetened
Whipped
Region specific
Boutique
Lactose-free
Breed-specific
Observed in SE Asia region Observed in Anglo-Saxon markets (but not SEA) Potential unoccupied position(s)
Health
Indulgence
Convenience

New Zealand and Australia are the only countries in SE Asia & Australasia that produce butter; all other import all raw materials or finished product
-
100
200
300
400
500
600
700
1961
1962
1963
1964
1965
1966
1967
1968
1969
1970
1971
1972
1973
1974
1975
1976
1977
1978
1979
1980
1981
1982
1983
1984
1985
1986
1987
1988
1989
1990
1991
1992
1993
1994
1995
1996
1997
1998
1999
200
0
200
1
200
2
200
3
200
4
200
5
200
6
200
7
200
8
200
9
2010
2011
2012
72
1. Uses 1972-2012; note: Philippines shown (almost invisible) but not labeled for claritySource: UN FAO AgStat database; Coriolis analysis
SE ASIA & AUSTRALASIA REGIONAL PRODUCTION VOLUME OF COW BUTTERTonnes; 000; 1961-2012 NNoo rreeppoorrtteedd pprroodduuccttiioonn
SingaporeThailandMalayisaIndonesiaVietnam
Australia -1% -62
New Zealand 2% +276
DOCUMENT STRUCTURE
SE Asia is an attractive market for New Zealand dairy firms
There are opportunities across all categories of the SE Asian dairy sector
Drinking milk products
Yoghurt
Condensed/evaporated
Cheese
Butter
Ice cream
Infant milk formula
73

Ice cream is dominated by Unilever and Nestle; any attempt to build a position at this late point needs to “Think Different”
FOR AGAINST
- Relatively large category overall at US$1.3b spread across all markets
- Growing at 8% per annum; double digit growth in Vietnam and Indonesia
- Per capita upside across all markets, particularly Philippines, Vietnam and Indonesia
- Significant user of New Zealand dairy ingredients (e.g. reconstituted skim milk, milk solids)
- SE Asian region underserved in terms of innovation, particularly in takehome, relative to Western markets
- Potential to leverage Emerald Foods/New Zealand Natural (700 outlets in 22 countries) foodservice play back into retail
- Product is semi-perishable and requires excellent cold chain management all the way to final point-of-sale or quality deteriorates rapidly (e.g. icing/refreezing)
- Category is highly consolidated & competitive- dominated by Unilever with 50% followed by Nestle
at 18%; both control impulse retail through freezer ownership & distribution logistics
- wide range of smaller regional firms
- Majority (60%) of the market in impulse stick products which are defensible through production/process technology; NZ has almost no track record in this space
- Take home tubs is the logical segment for NZ play but…- A smaller segment growing more slowly- market favours small quantities of super-premium
for immediate consumption or that can fit in small freezers, not large NZ-size tubs
- segment is well stocked with global firms, with few available unoccupied positions
74

Take home$521 40%
Impulse$786 60%
Ice cream, $1,310 , 8%
Other dairy$15,490
92%
Ice cream is a US$1,310m category in SE Asia at retail; almost two thirds of ice cream sales are “impulse” novelty stick products; robust sales of ice cream occur across all markets; Vietnam and Indonesia achieving double digit growth; Vietnam stands out as under-developed
75Source: Euromonitor; Coriolis analysis
SE ASIA RETAIL ICE CREAM SALES BY COUNTRYUS$m; 2013
5Y FORECAST GROWTH RATE% CAGR; 13-18f
TOTALUS$16,800m
TOTALUS$1,310
16%
12%
7%
6%
5%
4%
Vietnam
Indonesia
Thailand
Philippines
Singapore
MalaysiaThailand, $365 ,
28%
Malaysia$186 14%
Indonesia$332 25%
Vietnam$88 7%
Philippines$235 18% Singapore $104
8%
TOTALUS$1,310m
Convenience, $209 , 16%
Forecourt$38 3%
Hypermarket, $215 , 16%
Supermarket, $301 , 23%
Chemist/Other non-food, $1
, 0%
Traditional grocery
$544 42%
Non-store $2 0% Modern
Trade58%
TOTALUS$1,310m
TOTALUS$1,310m
% TOTAL SEA RETAIL DAIRY SALESUS$m; 2013
% SEA ICE CREAM $ BY FORM% US$M; 2013
SEA RETAIL ICE CREAM $ BY CHANNELUS$m; 2013

The ice cream category includes products that use a range of ingredients: dairy based, water based, fruit based and other non-dairy ingredients
76Source: various online shopping sites; company websites; Coriolis analysis
PRODUCT EXAMPLES IN CATEGORIES2014
ICE CREAMDAIRY BASED
WATER BASED“ICE LOLLIES”
Water, reconstituted fruit juice, sugar, dextrose, citric acid, stabiliser,
flavourings, colourants
Cream, liquid sugar, skim milk, water, sugar, etc.
Must contain 10% milk fat to be called Ice Cream
OTHERNON-DAIRY
Almond Coconut

The category covers three main sizes
Product Example product Example Ingredients Typical products claims Typical usage in SE Asia
Tub (101ml -2L)
Cream, liquid sugar, skim milk, water, sugar, cocoa, wheat flour, cocoa powder, soybean oil, egg yolks, cane sugar, eggs, guar gum, salt, carrageenan, vanilla extract, malted barley flour, sodium bicarbonate
Family packTransfat-freeHalalNatural ingredientsCreamy
DessertFamily treat
Noveltymulti-packs(minis)
Reconstituted skim milk, milk solids, sugar, vegetable oil, water, wheat flour, glucose fructose, cocoa, milk chocolate, potato starch, emulsifier, vegetable gum, salt, flavours, egg white
Transfat-freeHalal
Kids treatFamily treat
Novelty/individual
Water, reconstituted fruit juice, sugar, dextrose, citric acid, stabiliser, flavourings, colourants
HalalTransfat-free
Single occasionTreat Snack
77Source: various online shopping sites; company websites; Coriolis analysis
PRODUCT OVERVIEW: INGREDIENTS, CLAIMS AND USAGEExample; 2014

21
55
2
17
42
225
76
39
19
66
22
57
138
14
Coldstorage Sing
Tesco Malaysia
T Lotus
pns
tesco UK
Safeway
cd
500+ grams
101-500 grams
40
57
21
57
92
192
76
13
7
88
4
0
13
multipack
novelty
At retail pack sizes are skewed towards smaller tubs/pottles and multipacks
78Source: Grocery online stores; Coriolis
EXAMPLE: ICE CREAM STOCK KEEPING UNIT COUNTS BY WEIGHT BY SELECT COUNTRIESSKU’s; Oct 2014
Singapore
Thailand
Hong Kong
UK
USA
New Zealand
Malaysia

$4.60
$3.00 $2.90 $2.70
$1.80 $1.70
$0.90
lotus - ThaiCD -NZpns HKColds Singtesco malsafeway USAtesco UK
Ice cream is competitively priced in Asia at the bulk cheaper end of the market
79
Note: exchange rate as at Oct 2014Source: online retailers; photo credit (fair use; complete product for illustrative purposes); Coriolis analysis
EXAMPLE: CHEAPEST VANILLA ICE CREAM ON SHELFNZ$ per 1L; Oct 2014
UK SingaporeMalaysia New ZealandUSA Singapore Thailand
Larger pack size not available in
Lotus; Smaller pack size has higher
price/kilo

$35.72
$31.08
$25.48
$21.28
$16.32
$11.80
LotusCSMalay tescoPNSTesco UKSafeway USA
However, premium brands are achieving a significant price premium in Asia
80
Note: exchange rate as at Oct 2014Source: Online retailers; photo credit (fair use; complete product for illustrative purposes); Coriolis analysis
EXAMPLE: PRICE OF 473/500G VANILLA HAAGEN-DAZ BY SELECT COUNTRIES NZ$ per 1L; Oct 2014
UK SingaporeMalaysiaUSA ThailandHong Kong
Average $23.61
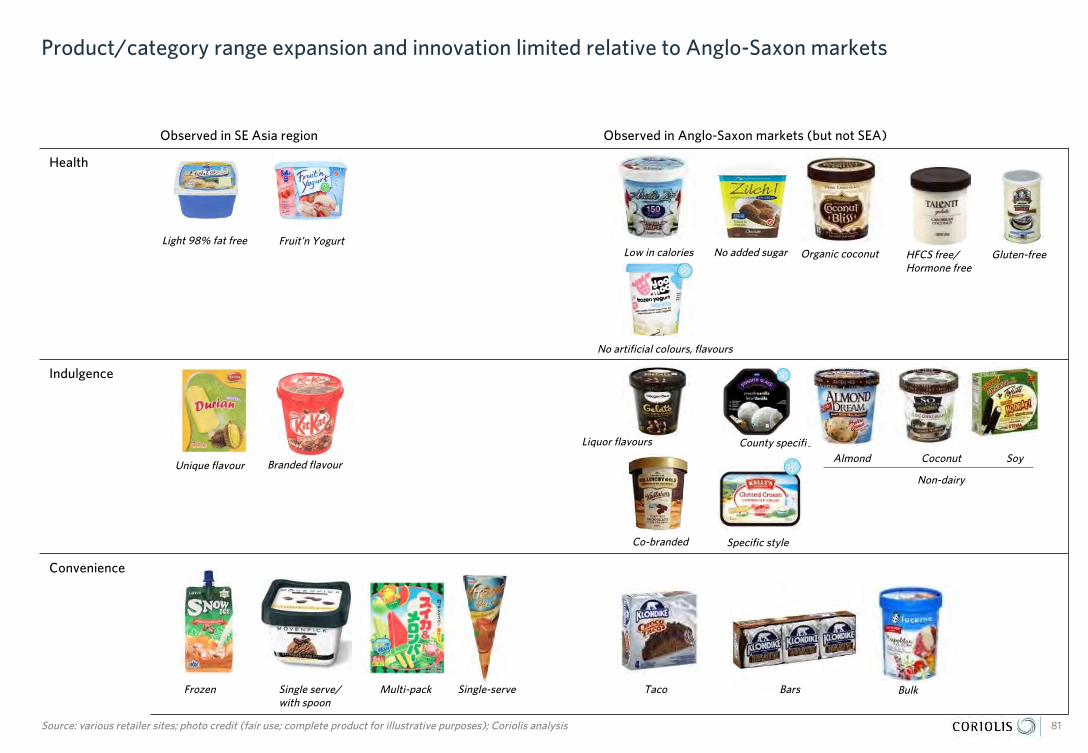
Product/category range expansion and innovation limited relative to Anglo-Saxon markets
Observed in SE Asia region Observed in Anglo-Saxon markets (but not SEA)
Health
Indulgence
Convenience
81Source: various retailer sites; photo credit (fair use; complete product for illustrative purposes); Coriolis analysis
Low in caloriesLight 98% fat free
Frozen
Liquor flavours
HFCS free/Hormone free
County specific
No artificial colours, flavours
No added sugar
Single serve/with spoon
Multi-pack
Branded flavourUnique flavour
Single-serve
Almond
Organic coconut
Coconut Soy
Non-dairy
Co-branded
Gluten-free
Taco Bars
Fruit’n Yogurt
Specific style
Bulk

Flavours
Free rangegrass fed
Non-cow(sheep)
Non-dairy(coconut)
Ingredient specific (sea
salt)
There are limited niche positions available in Ice cream
82Source: Coriolis analysis
All natural
Sliced/Portioned
OrganicNo fat
Reduced salt
Bulk
Country specific
Boutique
Lactose-free
Breed-specific
Sugar free
HFCS free Gluten free Hormone free
Spoon included
Premium
Multi-pack
Observed in SE Asia region Observed in Anglo-Saxon markets (but not SEA) Potential unoccupied position(s)
Health
Indulgence
Convenience
Low fat
DOCUMENT STRUCTURE
SE Asia is an attractive market for New Zealand dairy firms
There are opportunities across all categories of the SE Asian dairy sector
Drinking milk products
Yoghurt
Condensed/evaporated
Cheese
Butter
Ice cream
Infant milk formula
83

Baby milk is a large and growing category in SE Asia; however New Zealand will struggle to improve currently weak performance at retail
FOR AGAINST
- Shelf stable; can be packed to final form in NZ
- Very large category in SE Asia at US$5.9b
- Projected to grow at 8% per annum going forward
- Significant per capita upside in Vietnam, Indonesia, Philippines and Thailand
- A major user of NZ dairy ingredients (e.g. lactose, milk powder, whey)
- Opportunities in less controlled/less emotive/less profitable growing up milk (GUMP)
- Strong endorsement of New Zealand as a production location for the wider Asia evidenced in multiple large investments in local production
- Westland, Synlait and others making base powder
- Very highly consolidated regionally (and globally)- Top 5 firms 82%; regionals only factor in 2 markets- All top four global firms present- Danone rumoured targeting Mead Johnson
- Highly competitive – huge range of brands, sub-brands, products and pack sizes; easily 8-10 times the competitive intensity of domestic NZ market
- Despite domestic hype, no clearly revealed demand for “NZ infant formula” in SE Asia (this is not China)
- Not a strong category in NZ; no strong domestic base of product flair or innovation on which to draw
- No current capacity to compete in specialised and/or medical powders due to lack of defensible R&D in space (e.g. Mead Johnson BCAD for infants with “maple syrup urine disease”)
84

Milk formula, $5,480 , 33%
Other dairy$11,320
67%
Milk formula is a US$5.5b category in SE Asia at retail (or a third of dairy spend); Indonesia is the largest single market at $2,339m, followed by Vietnam ($922m), Thailand ($804m) and Philippines ($789m); Malaysia and Singapore smaller markets
85Source: Euromonitor; Coriolis analysis
SHARE OF TOTAL SE ASIA RETAIL DAIRY SALESUS$m; 2013
SE ASIA RETAIL MILK FORMULA SALES BY CHANNELUS$m; 2013
SE ASIA RETAIL MILK FORMULA SALES BY COUNTRYUS$m; 2013
5Y FORECAST GROWTH RATE% CAGR; 13-18f
TOTALUS$16,800m
TOTALUS$5,480
14%
7%
7%
7%
6%
5%
Vietnam
Indonesia
Malaysia
Singapore
Thailand
Philippines
Thailand, $804 , 15%Malaysia
$462 8%
Indonesia$2,339 43%
Vietnam$922 17%
Philippines$789 14% Singapore $165
3%TOTAL
US$5,480m
Convenience, $357 , 7%
Forecourt$17 0%
Hypermarket, $1,039 , 19%
Supermarket, $1,154 , 21%Chemist/Other
non-food, $1,093 , 20%
Traditional grocery$1,800 33%
Non-store $22 0% ModernTrade66%
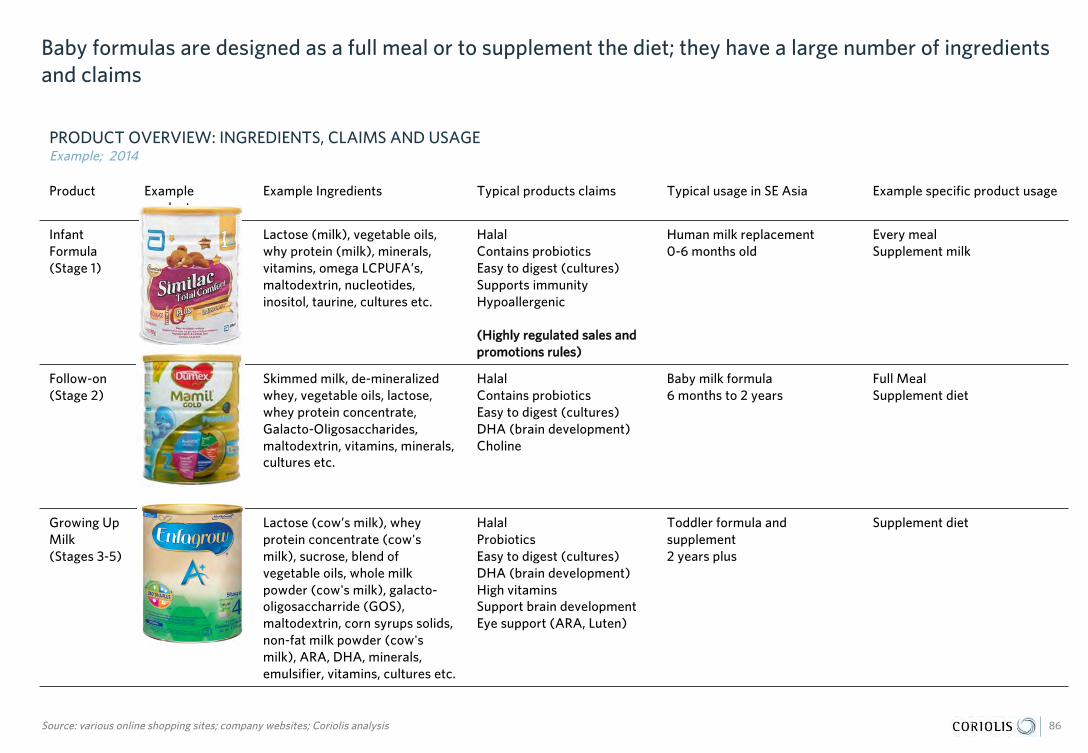
Baby formulas are designed as a full meal or to supplement the diet; they have a large number of ingredients and claims
Product Example product
Example Ingredients Typical products claims Typical usage in SE Asia Example specific product usage
Infant Formula (Stage 1)
Lactose (milk), vegetable oils, why protein (milk), minerals, vitamins, omega LCPUFA’s, maltodextrin, nucleotides,inositol, taurine, cultures etc.
HalalContains probioticsEasy to digest (cultures)Supports immunityHypoallergenic
((HHiigghhllyy rreegguullaatteedd ssaalleess aanndd pprroommoottiioonnss rruulleess))
Human milk replacement0-6 months old
Every mealSupplement milk
Follow-on(Stage 2)
Skimmed milk, de-mineralized whey, vegetable oils, lactose, whey protein concentrate, Galacto-Oligosaccharides, maltodextrin, vitamins, minerals, cultures etc.
HalalContains probioticsEasy to digest (cultures)DHA (brain development)Choline
Baby milk formula6 months to 2 years
Full MealSupplement diet
Growing Up Milk (Stages 3-5)
Lactose (cow’s milk), whey protein concentrate (cow's milk), sucrose, blend of vegetable oils, whole milk powder (cow's milk), galacto-oligosaccharride (GOS), maltodextrin, corn syrups solids,non-fat milk powder (cow's milk), ARA, DHA, minerals, emulsifier, vitamins, cultures etc.
HalalProbioticsEasy to digest (cultures)DHA (brain development)High vitaminsSupport brain developmentEye support (ARA, Luten)
Toddler formula and supplement2 years plus
Supplement diet
86Source: various online shopping sites; company websites; Coriolis analysis
PRODUCT OVERVIEW: INGREDIENTS, CLAIMS AND USAGEExample; 2014

Powdered milk is a highly competitive market, with a large number of products on the shelf
87Source: Tesco online (Malaysia); photo credit (fair use; complete product for illustrative purposes); Coriolis analysis
EXAMPLE: RANGE OF POWDERED BABY PRODUCTS FOR SALE AT TESCO MALAYSIA Oct 2014
Infant Formula(IF)
Follow-On(FO)
Growing Up Milk Powder(GUMP)
Global brands
Specialty 0-12 months

40
42
43
5
11
19
22
28
20
20
21
30
32
53
3
9
22
21
2
12
12
61
144
69
114
9
20
17
17
4
15
12
NTUC Fairprice
Tesco
Tops
T Lotus
Wellcome
Parknshop
Sainsbury
Tesco
Safeway
Coles
Countdown
Asian markets have significantly more brands and SKU’s on the shelf than Western countries
88Note: Singapore law does not allow for any online sales of IF; Source: Grocery online stores; Coriolis
EXAMPLE: “OTHER DAIRY” STOCK KEEPING UNIT COUNTS BY SELECT COUNTRIESSKU’s; brands; Oct 2014
Infant
Follow-on GUMP
# of brands
14
23
17
16
8
9
4
4
7
7
9
Singapore
Thailand
Hong Kong
UK
USA
Australia
New Zealand
82
214
143
210
17
58
40
60
34
Many sub-brands of Global Multinationals (Nestle/Wyeth, Danone, Abbott, Mead
Johnson, Bayer, Friesland Campina
Malaysia
47
44

The global firms use multiple brands in Asia across price points
89Source: Tops Thailand; photo credit (fair use; complete product for illustrative purposes); Coriolis analysis
EXAMPLE: SECOND STAGE/FOLLOW-ON MILK SHELF PRICE PER LITRE IN THAILAND Converted to NZ$ per litre; Oct 2014
Price fighter Medium priced Premium/Specialty

Each category, in this case “Stage 2: Follow-on milk” cover a range of price points
$14.92 $15.59 $16.92
$16.07 $16.90
$25.91 $27.36
$28.47
$14.27 $14.67 $15.27
$22.71 $23.73
$24.75 $25.22 $26.33
$31.84 $33.27
$14.11
$17.92 $19.31 $19.85
$32.29 $33.16 $33.75 $34.11
$31.26 $32.23
$34.88 $36.11
$26.00
$38.25
$40.25
90Source: Tops online; Coriolis analysis
EXAMPLE: SECOND STAGE/FOLLOW-ON MILK SHELF PRICE PER LITRE IN TOPS THAILAND Converted to NZ$ per litre; Oct 2014
Price-fighters
Mid-range
Premium
Super-premium
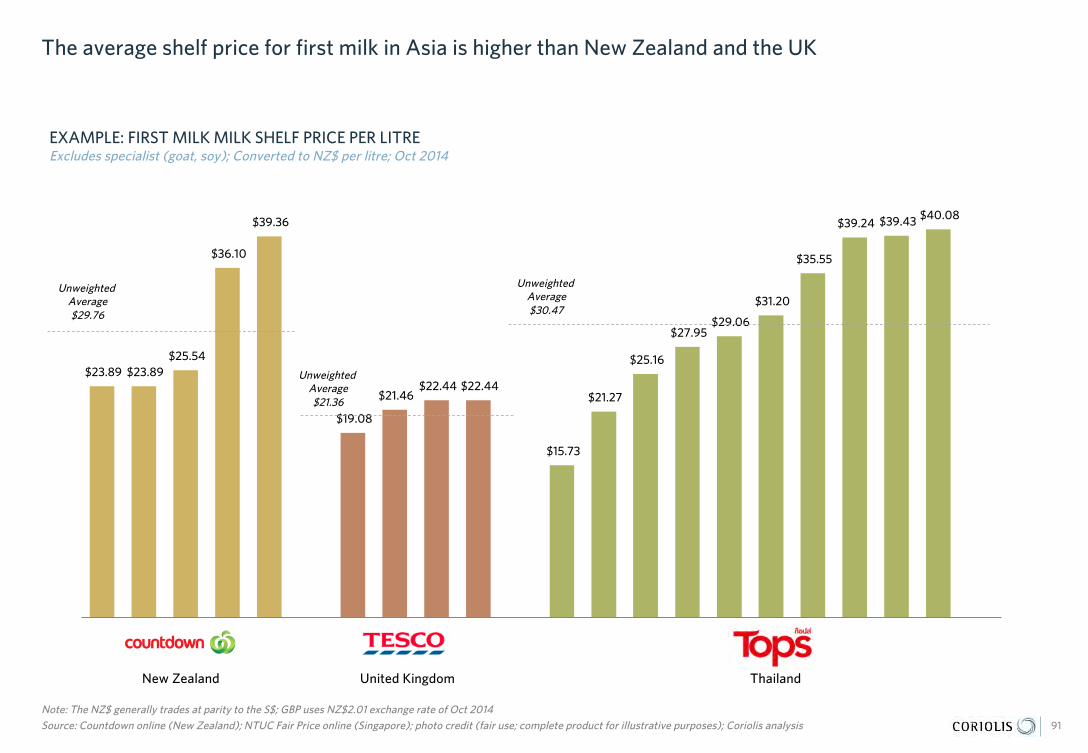
The average shelf price for first milk in Asia is higher than New Zealand and the UK
$23.89 $23.89 $25.54
$36.10
$39.36
$19.08
$21.46 $22.44 $22.44
$15.73
$21.27
$25.16
$27.95 $29.06
$31.20
$35.55
$39.24 $39.43 $40.08
91
Note: The NZ$ generally trades at parity to the S$; GBP uses NZ$2.01 exchange rate of Oct 2014Source: Countdown online (New Zealand); NTUC Fair Price online (Singapore); photo credit (fair use; complete product for illustrative purposes); Coriolis analysis
EXAMPLE: FIRST MILK MILK SHELF PRICE PER LITREExcludes specialist (goat, soy); Converted to NZ$ per litre; Oct 2014
UnweightedAverage$30.47
UnweightedAverage$29.76
UnweightedAverage$21.36
United Kingdom ThailandNew Zealand

Product/category innovation limited relative to Anglo-Saxon markets
In SE Asia region In Anglo-Saxon markets
Health
Indulgence
Convenience
92Source: various retailer sites; photo credit (fair use; complete product for illustrative purposes); Coriolis analysis
Comfort
Extra Hungry
Organic
RTD single serve RTD 6 packs (plastic) Stick packsRTD 4 packs (tetrapak)
Goat
Tablets (dosage)

Observed in SE Asia region Observed in Anglo-Saxon markets (but not SEA) Potential unoccupied position(s)
Health
Indulgence
Convenience
OrganicFree rangeGrass fed
Hormone/Antibiotic-free
Source region specific
Resealable
Soy
There are a number of unoccupied positions available for new market entrants and niche players to create a point-of-difference
93Source: various retailer sites; photo credit (fair use; complete product for illustrative purposes); Coriolis analysis
Ready to drink
Sheep milkGoat

Coriolis is a boutique management consultingfirm that focuses on food, consumerpackaged goods, retailing and foodservice.
Coriolis advises clients on strategy,operations, organization, and mergers andacquisitions. We develop practical, fact-based insights grounded in the real world thatguide our clients decisions and actions.Founded in 1999, Coriolis is based inAuckland, New Zealand and works onprojects across the Asia Pacific region.
WHAT WE DO
We help our clients assemble the factsneeded to guide their big decisions. We makepractical recommendations. Whereappropriate, we work with them to makechange happen.
HOW WE DO IT
Our style is practical and down-to-earth. Wetry to put ourselves in our clients’ shoes andfocus on actions. We listen hard, but we aresuspicious of the consensus. We provide anexternal, objective perspective. We are happyto link our fees to results.
WHO WE WORK WITH
We only work with a select group of clientswe trust. We build long term relationshipswith our clients and more than 80% of ourwork comes from existing clients. Our clientstrust our experience, advice and integrity.
CORIOLIS LIMITEDPO BOX 90-509AUCKLAND, NEW ZEALANDT: +64 9 623 1848www.coriolisresearch.com
ABOUT OUR SERVICES
Typical assignments for clients include…
FIRM STRATEGY & OPERATIONSWe help clients develop their own strategy forgrowing sales and profits. We have a strong biastowards growth driven by new products, newchannels and new markets.
MARKET ENTRYWe help clients identify which countries are themost attractive – from a consumer, a competitionand a channel point-of-view. Following this weassist in developing a plan for market entry andgrowth.
VALUE CREATIONWe help clients create value through revenuegrowth and cost reduction.
TARGET IDENTIFICATIONWe help clients identify high potential acquisitiontargets by profiling industries, screeningcompanies and devising a plan to approach targets.
DUE DILIGENCEWe help organisations make better decisions byperforming consumer and market-focused duediligence and assessing performance improvementopportunities.
EXPERT WITNESSWe provide expert witness support to clients inlegal cases and insurance claims. We assist withapplications under competition/fair trade laws andregulations.
READ MORE ON OUR WEBSITE.


![Untitled-3 [ ] · PDF fileThis year 4th edition of Dairy Livestock & Poultry Expo Asia had also Agri Asia ... HONDA SIEL POWER PRODUCTS LIMITED IACCI ... BARODA ORGANIC PAVILLION -](https://img.pdfslide.us/doc/110x75/5a70c6837f8b9ac0538c50bd/untitled-3-wwwdlpexpocomwwwdlpexpocompost-show-report-dlpexpo-asiapdfpdf.jpg)