Embed Size (px)
Citation preview
Daimler AG. Estados Financieros Consolidados.1T 2015
6
Business development Ongoing moderate expansion of world economy The world economy seems to have continued the rather moderate expansion of the previous months in the first quarter of 2015. Although the dynamism of the US economy is likely to have been rather weaker for weather reasons, the fundamental conditions there for solid growth remain intact. In the European Monetary Union, lower energy prices, rising real incomes and the depreciation of the euro have had a positive impact on business and consumer sentiment in the first months of the year. As a result, the economy of the euro zone seems to have continued to revive despite the uncertainty in connection with Greece. However, economic developments in some emerging markets are a concern, above all Russia and Brazil, with reces-sive tendencies tending to worsen during the first quarter. In China, the weakening of economic growth seems to have continued, but it probably remained within the range targeted by the government. In view of the ongoing expansive actions of most central banks, especially in Europe and Japan, stock markets made some gains, in some cases quite substantial ones. As expected, the euro tended to be significantly weaker in the first quarter. Worldwide demand for cars continued its moderate expan-sion in the first quarter. Once again, the Chinese and the US markets were the main growth drivers. Market growth in China continued at a lively pace of close to 10%. The US market also grew at a strong rate of nearly 6%; however, this partially reflects the rather weak first quarter of the previous year due to the weather in that period. In addition to China and the United States, the ongoing recovery of the Western European market also made a significant contribution to the worldwide growth. Demand for cars in that region was 9% higher than in the prior-year period. All of the region’s major individual markets record-ed significant growth, so the positive market trend was broadly based. The development of demand was less favorable in Japan, where the anticipated market correction occurred: The sharp contraction of minus 18% is mainly the result of the boost in demand ahead of last year’s increase in value-added tax. The car markets of the major emerging economies other than China once again developed disparately. There was a moderate increase in demand in India. But car sales in Russia slumped by approximately 35% due to very weak demand in the volume segment, and a weakening of demand is meanwhile apparent also in the premium segment.
Demand for medium- and heavy-duty trucks was still very mixed at the beginning of the year. The North American market continued to be robust with strong expansion of nearly 20% in Classes 6 to 8. Positive tendencies were apparent also in the European market. In line with the improving economy, new registrations were approximately 10% higher than in the first quarter of last year. The situation was completely different in Brazil, where the economic weakness was reflected by a drastic contraction of the truck market of nearly 40%. The Japanese market for light-, medium- and heavy-duty trucks developed positively, however. Sales nearly reached the high level of the prior-year period. The Indonesian market developed well below expectations, however. Despite rather better economic condi-tions, the truck market contracted substantially by about 30% compared with the first quarter of 2014. The Indian market for medium- and heavy-duty trucks remained on a course of recov-ery from a low level. The severe recession in Russia was reflect-ed in the demand for trucks. According to recent estimates, the market probably contracted by a significant double-digit rate. The drop in demand for trucks in China, the world’s biggest market, was of a similar magnitude. The main reason for the distinct market weakness there was the introduction of the new CN4 emission standards (similar to Euro IV). Demand for vans in Western Europe continued to grow, with a 10% increase in market volume for medium-sized and large vans. Demand for small vans increased by 7%. The US market for large vans also continued its strong expansion with a plus of 17%. But due to unfavorable economic conditions, the market for large vans in Latin America contracted sharply. In the first quarter of 2015, the bus market in Western Europe expanded compared with the weak prior-year period by 15%. As a result of the difficult economic situation, the Brazilian market remained significantly below its prior-year level with a decrease of approximately 20%. First-quarter unit sales significantly above prior-year level In the first quarter of 2015, Daimler sold 641,600 cars and commercial vehicles worldwide, which is 13% more than in the same period of last year.
Interim Management Report. Unit sales significantly above prior-year level at 641,600 units Revenue up by 16% to €34.2 billion Group EBIT of €2,906 million (Q1 2014: €1,787 million) Net profit of €2,050 million (Q1 2014: €1,086 million) Free cash flow of industrial business of €2.3 billion (Q1 2014: €0.7 billion) Significant growth in unit sales and revenue anticipated for full-year 2015 Group EBIT from ongoing business expected to be significantly higher than in 2014
C | Interim Management Report
7
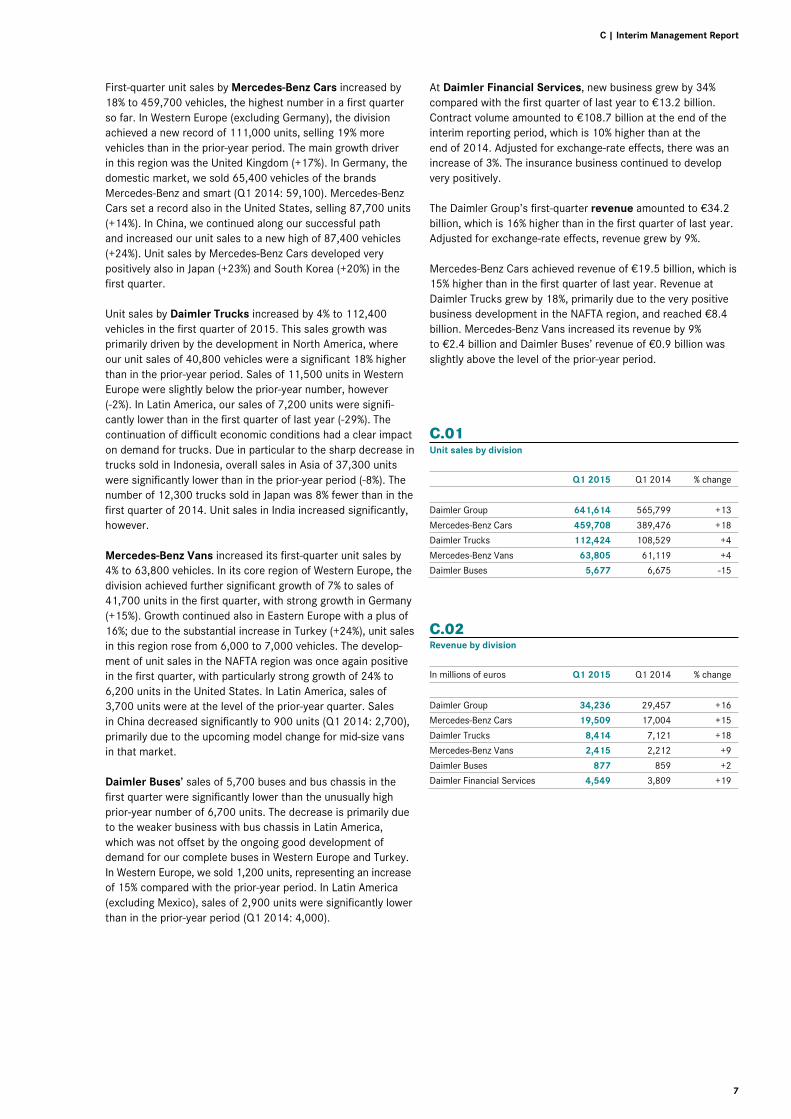
First-quarter unit sales by Mercedes-Benz Cars increased by 18% to 459,700 vehicles, the highest number in a first quarter so far. In Western Europe (excluding Germany), the division achieved a new record of 111,000 units, selling 19% more vehicles than in the prior-year period. The main growth driver in this region was the United Kingdom (+17%). In Germany, the domestic market, we sold 65,400 vehicles of the brands Mercedes-Benz and smart (Q1 2014: 59,100). Mercedes-Benz Cars set a record also in the United States, selling 87,700 units (+14%). In China, we continued along our successful path and increased our unit sales to a new high of 87,400 vehicles (+24%). Unit sales by Mercedes-Benz Cars developed very positively also in Japan (+23%) and South Korea (+20%) in the first quarter. Unit sales by Daimler Trucks increased by 4% to 112,400 vehicles in the first quarter of 2015. This sales growth was primarily driven by the development in North America, where our unit sales of 40,800 vehicles were a significant 18% higher than in the prior-year period. Sales of 11,500 units in Western Europe were slightly below the prior-year number, however (-2%). In Latin America, our sales of 7,200 units were signifi-cantly lower than in the first quarter of last year (-29%). The continuation of difficult economic conditions had a clear impact on demand for trucks. Due in particular to the sharp decrease in trucks sold in Indonesia, overall sales in Asia of 37,300 units were significantly lower than in the prior-year period (-8%). The number of 12,300 trucks sold in Japan was 8% fewer than in the first quarter of 2014. Unit sales in India increased significantly, however. Mercedes-Benz Vans increased its first-quarter unit sales by 4% to 63,800 vehicles. In its core region of Western Europe, the division achieved further significant growth of 7% to sales of 41,700 units in the first quarter, with strong growth in Germany (+15%). Growth continued also in Eastern Europe with a plus of 16%; due to the substantial increase in Turkey (+24%), unit sales in this region rose from 6,000 to 7,000 vehicles. The develop-ment of unit sales in the NAFTA region was once again positive in the first quarter, with particularly strong growth of 24% to 6,200 units in the United States. In Latin America, sales of 3,700 units were at the level of the prior-year quarter. Sales in China decreased significantly to 900 units (Q1 2014: 2,700), primarily due to the upcoming model change for mid-size vans in that market. Daimler Buses’ sales of 5,700 buses and bus chassis in the first quarter were significantly lower than the unusually high prior-year number of 6,700 units. The decrease is primarily due to the weaker business with bus chassis in Latin America, which was not offset by the ongoing good development of demand for our complete buses in Western Europe and Turkey. In Western Europe, we sold 1,200 units, representing an increase of 15% compared with the prior-year period. In Latin America (excluding Mexico), sales of 2,900 units were significantly lower than in the prior-year period (Q1 2014: 4,000).
At Daimler Financial Services, new business grew by 34% compared with the first quarter of last year to €13.2 billion. Contract volume amounted to €108.7 billion at the end of the interim reporting period, which is 10% higher than at the end of 2014. Adjusted for exchange-rate effects, there was an increase of 3%. The insurance business continued to develop very positively. The Daimler Group’s first-quarter revenue amounted to €34.2 billion, which is 16% higher than in the first quarter of last year. Adjusted for exchange-rate effects, revenue grew by 9%. Mercedes-Benz Cars achieved revenue of €19.5 billion, which is 15% higher than in the first quarter of last year. Revenue at Daimler Trucks grew by 18%, primarily due to the very positive business development in the NAFTA region, and reached €8.4 billion. Mercedes-Benz Vans increased its revenue by 9% to €2.4 billion and Daimler Buses’ revenue of €0.9 billion was slightly above the level of the prior-year period. C.01 Unit sales by division
Q1 2015 Q1 2014 % change
Daimler Group 641,614 565,799 +13
Mercedes-Benz Cars 459,708 389,476 +18
Daimler Trucks 112,424 108,529 +4
Mercedes-Benz Vans 63,805 61,119 +4
Daimler Buses 5,677 6,675 -15
C.02 Revenue by division
In millions of euros Q1 2015 Q1 2014 % change
Daimler Group 34,236 29,457 +16
Mercedes-Benz Cars 19,509 17,004 +15
Daimler Trucks 8,414 7,121 +18
Mercedes-Benz Vans 2,415 2,212 +9
Daimler Buses 877 859 +2
Daimler Financial Services 4,549 3,809 +19

8
Profitability The Daimler Group achieved first-quarter EBIT of €2,906 million, which is significantly higher than the figure for the prior-year period (Q1 2014: €1,787 million). C.03 Mercedes-Benz Cars primarily contributed to the increase in earnings. The development of the division’s earnings was mainly the result of further growth in unit sales in all regions. Earnings significantly increased also at Daimler Trucks and Mercedes-Benz Vans. Due to market conditions, Daimler Buses did not match its very high earnings of the prior-year period. Daimler Financial Services’ earnings increased primarily due to the higher contract volume. Changes in exchange rates had a positive impact on operating profit. C.03 EBIT by segment
In millions of euros Q1 2015 Q1 2014 % change
Mercedes-Benz Cars 1,841 1,183 +56
Daimler Trucks 472 341 +38
Mercedes-Benz Vans 215 123 +75
Daimler Buses 34 53 -36
Daimler Financial Services 409 397 +3
Reconciliation -65 -310 .
Daimler Group 2,906 1,787 +63
C.04 Special items affecting EBIT
In millions of euros Q1 2015 Q1 2014
Mercedes-Benz Cars
Restructuring of sales organization in Germany -20 -
Relocation of headquarters of MBUSA -20 -
Sale of real estate in the United States +87 -
Daimler Trucks
Workforce adjustments -5 -5
Sale of Atlantis Foundries -55 -
Restructuring of sales organization in Germany -4 -
Mercedes-Benz Vans
Restructuring of sales organization in Germany -4 -
Relocation of headquarters of MBUSA -2 -
Daimler Buses
Business repositioning - -1
Restructuring of sales organization in Germany -1 -
Reconciliation
Measurement of put option for RRPSH - -118
Hedge of Tesla share price - -161
Furthermore, the special items shown in table C.04 affected EBIT in the first quarter of 2015 and 2014. Earnings in the first quarter of 2014 were affected by expenses in connection with hedging of the Tesla Motors Inc. (Tesla) share price and the remeasurement of the put option on shares in Rolls-Royce Power Systems Holding GmbH (RRPSH). First-quarter EBIT of the Mercedes-Benz Cars division of €1,841 million was significantly higher than the figure for the prior-year period of €1,183 million. The division’s return on sales was 9.4% (Q1 2014: 7.0%). C.03 The development of earnings primarily reflects the growth in unit sales in all regions. Strong contributions came from the new C-Class and the expanded range of compact cars. Mercedes-Benz Cars achieved earnings growth also as a result of better pricing. In addition, efficiency actions had a positive impact on EBIT. However, the development of earnings featured a changed regional structure of unit sales, due for example to the higher proportion of cars produced locally in China. Furthermore, earnings were affected by expenses for the enhancement of products’ attractiveness, capacity expansion, advance expenditure for new technologies and vehicles, and exchange-rate changes. Furthermore, effects of the relocation of the headquarters of Mercedes-Benz USA, LLC and from the sale of real estate in the United States are included in EBIT. All automotive divisions were also affected by the restructur-ing of the Group’s own sales organization in Germany. In this context, we refer to the information provided in Note 4 of the Notes to the Consolidated Financial Statements. Daimler Trucks’ EBIT of €472 million was significantly higher than in the prior-year period (Q1 2014: €341 million). The division’s return on sales amounted to 5.6% (Q1 2014: 4.8%).
C.03 There were positive effects on the development of earnings in particular from increased unit sales in the NAFTA region and foreign exchange rates. The realization of further efficiencies and the settlement of a healthcare plan in the United States also had a positive impact on earnings. Negative effects on the earnings posted by Daimler Trucks resulted above all from lower unit sales in Latin America and Indonesia, higher warranty costs and expenditure for capacity expansion. In addition, there were expenses from the measurement at fair value of Atlantis Foundries (Pty.) Ltd., the sale of which was decided upon in late February. EBIT was reduced also by workforce actions in the context of the ongoing optimization programs in Brazil. Mercedes-Benz Vans achieved a significantly higher EBIT of €215 million in the first quarter of 2015 (Q1 2014: €123 million). The division’s return on sales increased to 8.9% from 5.6% in the prior-year period. C.03 First-quarter unit sales, revenue and earnings were influenced by a very positive product mix. This was additionally driven by the good development of demand in Europe and the NAFTA region, as well as by improved efficiency. There were negative effects on the development of earnings from changes in exchange rates.
C | Interim Management Report
9
Daimler Buses’ first-quarter EBIT amounted to €34 million, but was due to market conditions below the very high prior-year level of €53 million. The division’s return on sales was 3.9% (Q1 2014: 6.2%). C.03 Earnings were significantly reduced by the economic situation in Brazil and the resulting decrease in demand for bus chassis. High demand for our complete buses, a positive product mix in Western Europe and positive exchange-rate effects partially offset the lower unit sales in Latin America. In the first quarter of 2015, the Daimler Financial Services division achieved earnings of €409 million and thus surpassed the prior-year figure (Q1 2014: €397 million). C.03 This was mainly the result of strong growth in contract volume in all regions, as well as positive exchange-rate effects. There were opposing effects from expenditure for the expansion of business activities. The reconciliation of the divisions’ EBIT to Group EBIT comprises gains and/or losses at the corporate level and the effects on earnings of eliminating intra-group transactions between the divisions. Other items at the corporate level resulted in an expense of €80 million (Q1 2014: €314 million). The first quarter of 2014 included an expense of €161 million from hedging the price of Tesla shares and an expense of €118 million from exercising the put option on the shares held in RRPSH. The elimination of intra-group transactions resulted in income of €15 million in the first quarter of 2015 (Q1 2014: €4 million). Net interest expense amounted to €103 million (Q1 2014: €135 million). Expenses in connection with pension and healthcare benefit obligations were slightly below the prior-year level. Other interest result improved due in particular to the successive expiry of refinancing at high interest rates. The expense of €751 million entered under income-tax expense increased by only €187 million compared with the first quarter of last year despite a substantial increase in profit before income taxes. This primarily reflects the tax benefits applicable in the year 2015 in connection with the tax assess-ment of previous years. Net profit for the first quarter of 2015 amounts to €2,050 million (Q1 2014: €1,086 million). Net profit of €87 million is attributable to non-controlling interests (Q1 2014: €59 million). Net profit attributable to the shareholders of Daimler AG amounts to €1,963 million (Q1 2014: €1,027 million), repre-senting earnings per share of €1.83 (Q1 2014: €0.96). The calculation of earnings per share (basic) is based on an average number of outstanding shares of 1,069.8 million (Q1 2014: 1,069.8 million).
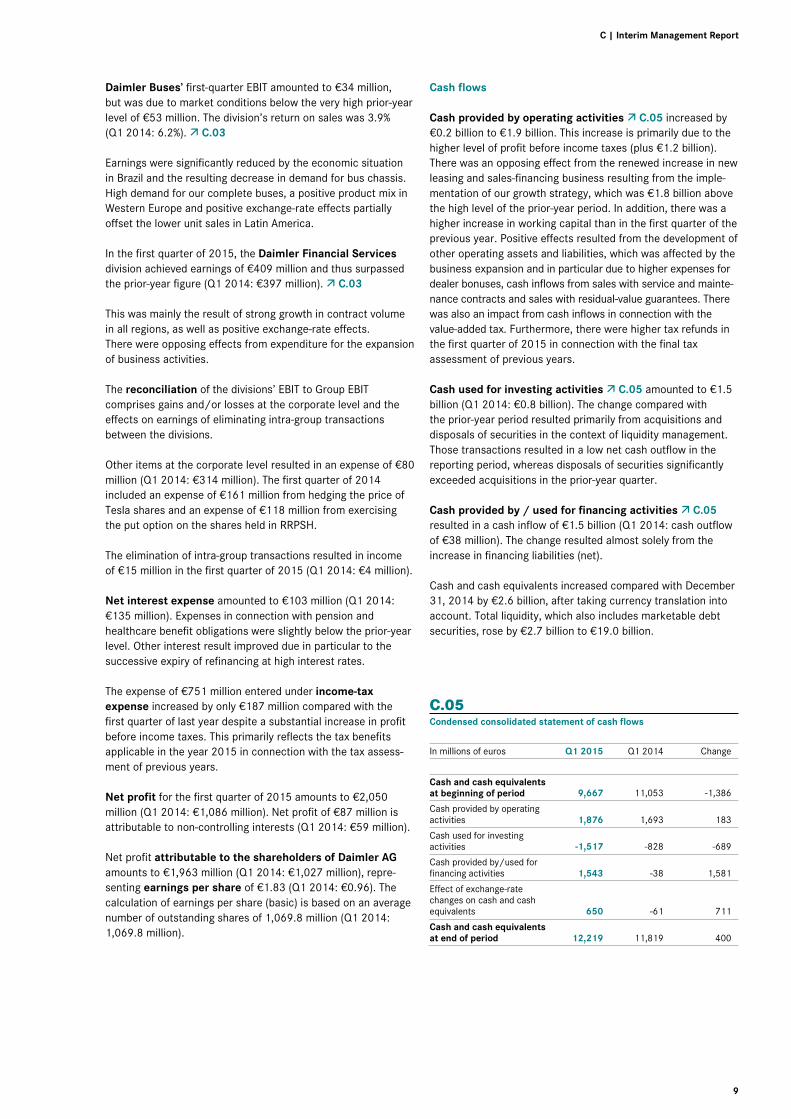
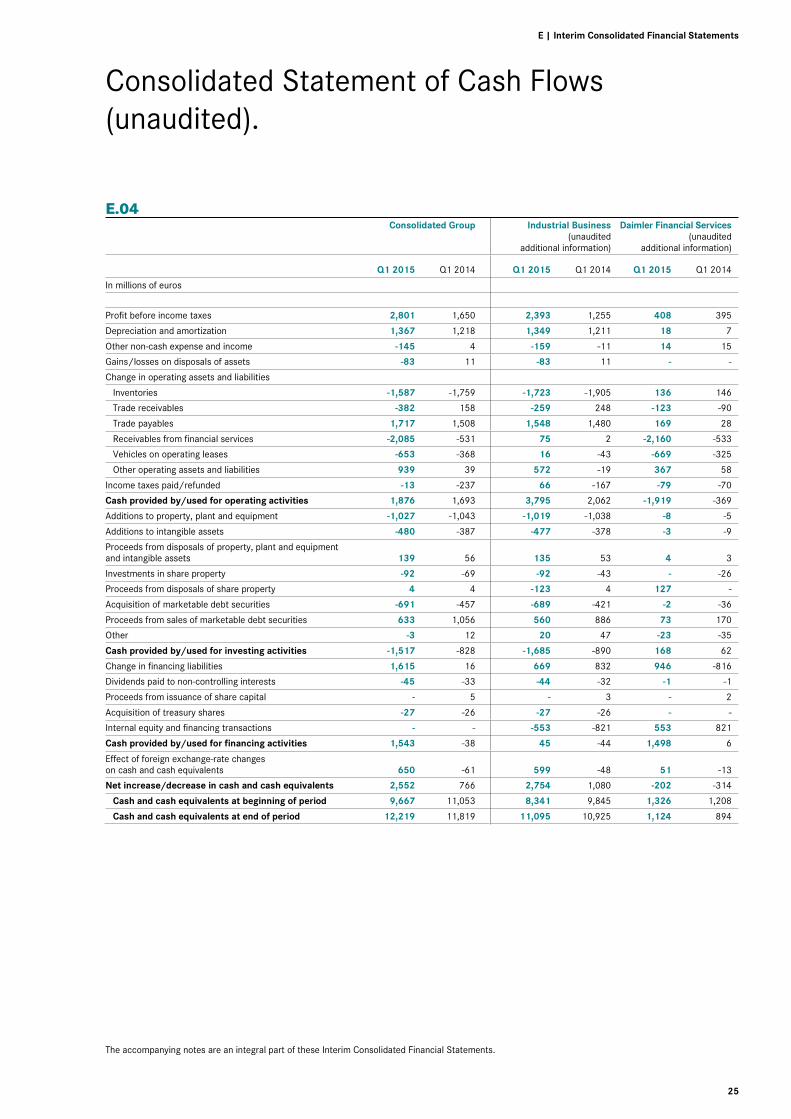
Cash flows Cash provided by operating activities C.05 increased by €0.2 billion to €1.9 billion. This increase is primarily due to the higher level of profit before income taxes (plus €1.2 billion). There was an opposing effect from the renewed increase in new leasing and sales-financing business resulting from the imple-mentation of our growth strategy, which was €1.8 billion above the high level of the prior-year period. In addition, there was a higher increase in working capital than in the first quarter of the previous year. Positive effects resulted from the development of other operating assets and liabilities, which was affected by the business expansion and in particular due to higher expenses for dealer bonuses, cash inflows from sales with service and mainte-nance contracts and sales with residual-value guarantees. There was also an impact from cash inflows in connection with the value-added tax. Furthermore, there were higher tax refunds in the first quarter of 2015 in connection with the final tax assessment of previous years. Cash used for investing activities C.05 amounted to €1.5 billion (Q1 2014: €0.8 billion). The change compared with the prior-year period resulted primarily from acquisitions and disposals of securities in the context of liquidity management. Those transactions resulted in a low net cash outflow in the reporting period, whereas disposals of securities significantly exceeded acquisitions in the prior-year quarter. Cash provided by / used for financing activities C.05 resulted in a cash inflow of €1.5 billion (Q1 2014: cash outflow of €38 million). The change resulted almost solely from the increase in financing liabilities (net). Cash and cash equivalents increased compared with December 31, 2014 by €2.6 billion, after taking currency translation into account. Total liquidity, which also includes marketable debt securities, rose by €2.7 billion to €19.0 billion. C.05 Condensed consolidated statement of cash flows
In millions of euros Q1 2015 Q1 2014 Change
Cash and cash equivalents at beginning of period 9,667 11,053 -1,386
Cash provided by operating activities 1,876 1,693 183
Cash used for investing activities -1,517 -828 -689
Cash provided by/used for financing activities 1,543 -38 1,581
Effect of exchange-rate changes on cash and cash equivalents 650 -61 711
Cash and cash equivalents at end of period 12,219 11,819 400

10
C.06 Free cash flow of the industrial business
In millions of euros Q1 2015 Q1 2014 Change
Cash provided by operating activities 3,795 2,062 1,733
Cash used for investing activities -1,685 -890 -795
Change in marketable debt securities 129 -465 594
Other adjustments 53 -13 66
Free cash flow of the industrial business 2,292 694 1,598
C.07 Net liquidity of the industrial business
In millions of euros Mar. 31,
2015 Dec. 31,
2014 Change
Cash and cash equivalents 11,095 8,341 2,754
Marketable debt securities 5,316 5,156 160
Liquidity 16,411 13,497 2,914
Financing liabilities 3,751 3,193 558
Market valuation and currency hedges for financing liabilities 360 263 97
Financing liabilities (nominal) 4,111 3,456 655
Net liquidity 20,522 16,953 3,569
C.08 Net debt of the Daimler Group
In millions of euros Mar. 31,
2015 Dec. 31,
2014 Change
Cash and cash equivalents 12,219 9,667 2,552
Marketable debt securities 6,751 6,634 117
Liquidity 18,970 16,301 2,669
Financing liabilities -93,764 -86,689 -7,075
Market valuation and currency hedges for financing liabilities 352 270 82
Financing liabilities (nominal) -93,412 -86,419 -6,993
Net debt -74,442 -70,118 -4,324
C.09 Benchmark emissions
Issuer Volume Month of
emission Maturity
Daimler Finance North America $250 million Mar. 2015 Mar. 2017
Daimler Finance North America $1,500 million Mar. 2015 Mar. 2018
Daimler Finance North America $1,250 million Mar. 2015 Mar. 2020
The parameter used by Daimler to measure the financial capa-bility of the Group’s industrial business is the free cash flow of the industrial business C.06, which is derived from the reported cash flows from operating and investing activities. The cash flows from the acquisition and sale of marketable debt securities included in cash flows from investing activities are deducted, as those securities are allocated to liquidity and changes in them are thus not a part of the free cash flow. Other adjustments relate to additions to property, plant and equipment that are allocated to the Group as their beneficial owner due to the form of their underlying lease contracts. Furthermore, effects from the financing of dealerships within the Group are adjusted. In addition, the calculation of the free cash flow includes those cash flows to be shown under cash pro-vided by financing activities in connection with the acquisition or sale of interests in subsidiaries without the loss of control. The free cash flow amounted to €2.3 billion in the first quarter of 2015. The positive profit contributions of the industrial business were offset by the increase in working capital, defined as the net change in inventories, trade receivables and trade payables, in a total amount of €0.4 billion. The positive development of other operating assets and liabilities was related to the business expan-sion and is primarily due to payments received from sales with service and maintenance contracts and sales with residual-value guarantees. The assessment of value-added tax also resulted in cash inflows. Cash outflows resulted from the high investments in property, plant and equipment and intangible assets, and reduced the free cash flow of the industrial business. The increase in free cash flow of €1.6 billion was mainly due to higher profit contributions from the automotive divisions. The effect of the increase in working capital was more than offset by the positive development of other operating assets and liabilities. There was also a positive impact from higher income-tax refunds from the final tax assessment of previous years. The net liquidity of the industrial business C.07 is calculat-ed as the total amount as shown in the statement of financial position of cash, cash equivalents and marketable debt securities included in liquidity management, less the currency-hedged nominal amounts of financing liabilities. To the extent that the Group’s internal refinancing of the finan-cial services business is provided by the companies of the industrial business, this amount is deducted in the calculation of the net debt of the industrial business. The Group’s internal refinancing was of a higher volume than the financing liabilities originally taken on in the industrial business due to the application of the industrial business’s own financial resources. This resulted in a positive value for the financing liabilities of the industrial business, thus increasing net liquidity, so the net liquidity of the industrial business exceeds the gross liquidity presented here.
C | Interim Management Report
11
Compared with December 31, 2014, the net liquidity of the industrial business increased from €17.0 billion to €20.5 billion. The increase mainly reflects the free cash flow of €2.3 billion and positive exchange-rate effects. Net debt at Group level, which primarily results from refinancing the leasing and sales financing business, increased by €4.3 billion to €74.4 billion compared to December 31, 2014.
C.08 The Daimler Group once again utilized attractive conditions in the international money and capital markets in the first quarter of 2015 for refinancing. In the first quarter of 2015, Daimler had a cash inflow of €4.1 billion from the issuance of bonds (Q1 2014: €4.4 billion). The redemption of bonds resulted in cash outflows of €2.6 billion (Q1 2014: €3.3 billion). A large proportion of the emission volume was carried out in the form of a so-called benchmark bond. In early March, Daimler Finance North America LLC issued bonds in a transaction in the US capital market with maturities of two, three and five years and a total volume of $3.0 billion. C.09 In addition to the emissions shown in the table, multiple smaller emissions were undertaken in various countries and currencies. In January for example, a bond was issued by Daimler AG in the context of the Euro Medium Term Note (EMTN) program with a volume of £250 million. Furthermore, in January and April 2015, asset-backed securities (ABS) transactions were conducted in the United States with volumes of approximately $2.0 billion and $1.0 billion respectively.
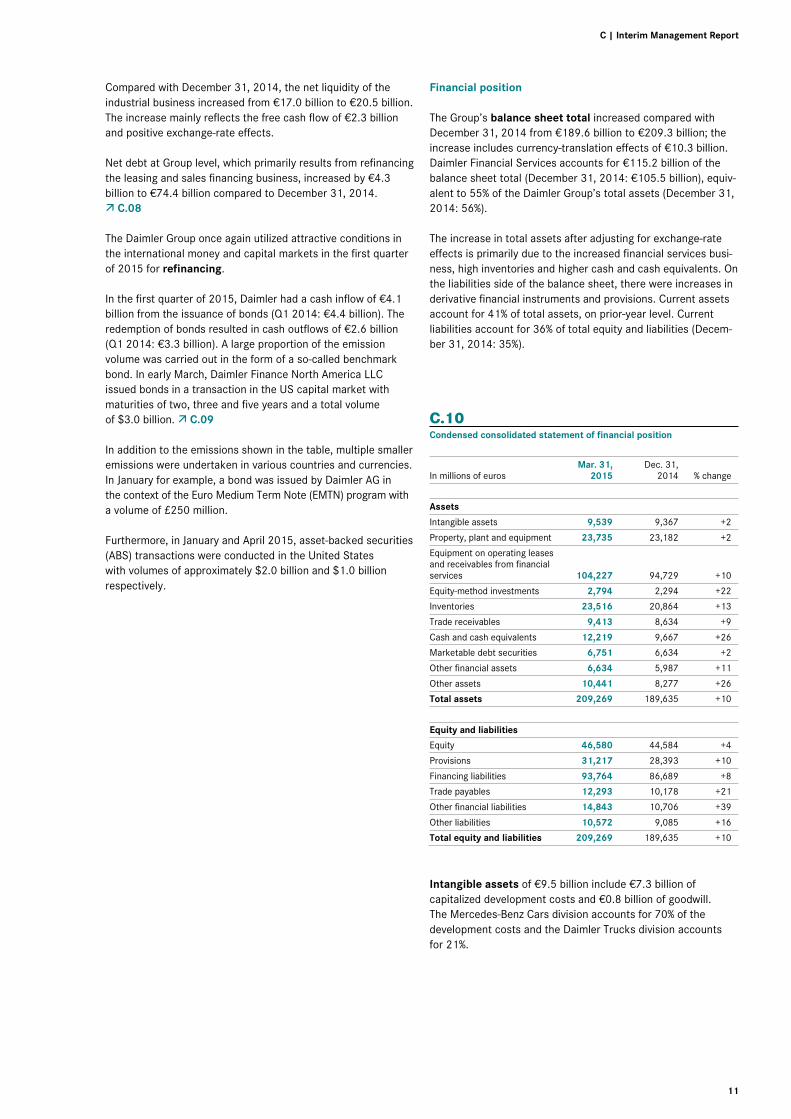
Financial position The Group’s balance sheet total increased compared with December 31, 2014 from €189.6 billion to €209.3 billion; the increase includes currency-translation effects of €10.3 billion. Daimler Financial Services accounts for €115.2 billion of the balance sheet total (December 31, 2014: €105.5 billion), equiv-alent to 55% of the Daimler Group’s total assets (December 31, 2014: 56%). The increase in total assets after adjusting for exchange-rate effects is primarily due to the increased financial services busi-ness, high inventories and higher cash and cash equivalents. On the liabilities side of the balance sheet, there were increases in derivative financial instruments and provisions. Current assets account for 41% of total assets, on prior-year level. Current liabilities account for 36% of total equity and liabilities (Decem-ber 31, 2014: 35%). C.10 Condensed consolidated statement of financial position
In millions of euros Mar. 31,
2015 Dec. 31,
2014 % change
Assets
Intangible assets 9,539 9,367 +2
Property, plant and equipment 23,735 23,182 +2
Equipment on operating leases and receivables from financial services 104,227 94,729 +10
Equity-method investments 2,794 2,294 +22
Inventories 23,516 20,864 +13
Trade receivables 9,413 8,634 +9
Cash and cash equivalents 12,219 9,667 +26
Marketable debt securities 6,751 6,634 +2
Other financial assets 6,634 5,987 +11
Other assets 10,441 8,277 +26
Total assets 209,269 189,635 +10
Equity and liabilities
Equity 46,580 44,584 +4
Provisions 31,217 28,393 +10
Financing liabilities 93,764 86,689 +8
Trade payables 12,293 10,178 +21
Other financial liabilities 14,843 10,706 +39
Other liabilities 10,572 9,085 +16
Total equity and liabilities 209,269 189,635 +10
Intangible assets of €9.5 billion include €7.3 billion of capitalized development costs and €0.8 billion of goodwill. The Mercedes-Benz Cars division accounts for 70% of the development costs and the Daimler Trucks division accounts for 21%.

12
Property, plant and equipment increased to €23.7 billion (December 31, 2014: €23.2 billion). In the first quarter of 2015, a total of €1.0 billion was invested for new products and tech-nologies, the expansion of production capacities and moderni-zation, primarily at our production and assembly sites. The sites in Germany accounted for investment in property, plant and equipment of €0.8 billion (Q1 2014: €0.8 billion). Most of the increase in property, plant and equipment was caused by the effects of currency translation. Equipment on operating leases and receivables from financial services increased to €104.2 billion (December 31, 2014: €94.7 billion). €6.7 billion of the increase is the result of currency translation. The increase after adjusting for exchange-rate effects reflects the increased new business at Daimler Financial Services, especially in the United States and China. Those assets’ share of total assets of 50% is at the level of year-end 2014. Equity-method investments of €2.8 billion (December 31, 2014: €2.3 billion) mainly comprise the carrying amounts of our equity interests in Beijing Benz Automotive Co., Ltd. (BBAC) and BAIC Motor Corporation Ltd. in the area of cars, and in Beijing Foton Daimler Automotive Co., Ltd. and Kamaz OAO in the truck business. The increase reflects the effects of currency trans-lation as well as the positive earnings from the investments, in particular from BBAC. Inventories increased from €20.9 billion to €23.5 billion, equivalent to 11% of total assets, as at year-end 2014. Apart from exchange-rate effects of €1.1 billion, the increase reflects the continued growth and the continuation of the model offen-sive. This led to higher stocks of new vehicles, especially at the Mercedes-Benz Cars division. Trade receivables increased by €0.8 billion to €9.4 billion. The Mercedes-Benz Cars division accounts for 46% of these receivables and the Daimler Trucks division accounts for 33%. Cash and cash equivalents increased compared with the end of the year 2014 by €2.6 billion to €12.2 billion. Adjusted for exchange-rate effects, the increase amounted to €1.9 billion. Marketable debt securities increased compared with December 31, 2014 from €6.6 billion to €6.8 billion. These assets include the debt instruments that are allocated to liquidity, most of which are publicly traded. They generally have an external rating of A or better. Other financial assets increased by €0.6 billion to €6.6 billion. They mainly comprise investments – in Renault and Nissan for example – and derivative financial instruments, as well as loans and other receivables due from third parties. The change reflects the positive development of listed equity instruments. Other assets of €10.4 billion (December 31, 2014: €8.3 billion) primarily comprise deferred tax assets and tax refund claims. The increase in deferred tax assets primarily relates to non-profit effects from derivative financial instruments as well as from pensions and similar obligations.
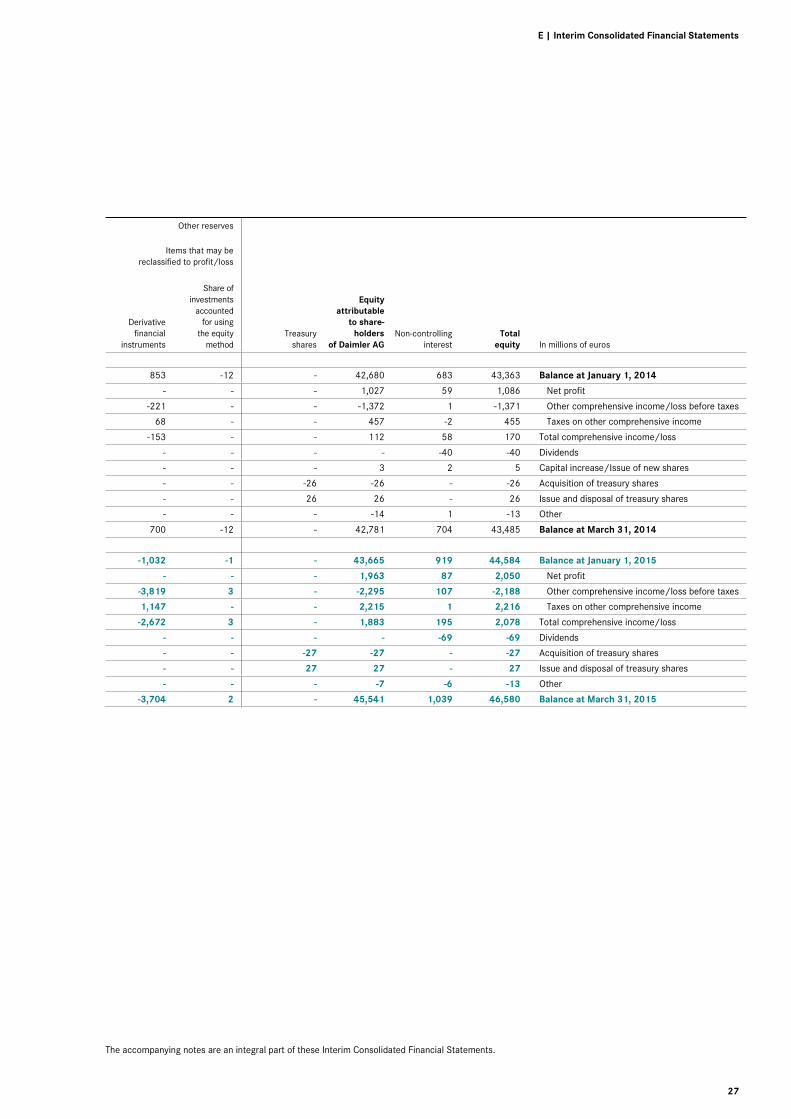
The Group’s equity increased compared with December 31, 2014 from €44.6 billion to €46.6 billion. Equity attributable to the shareholders of Daimler AG increased to €45.5 billion (December 31, 2014: €43.7 billion). The increase is primarily a reflection of currency translation (plus €2.7 billion) and from the valuation of investments in Renault and Nissan (plus €0.5 billion). The net profit of €2.1 billion was offset by the remeas-urement of derivative financial instruments (minus €2.7 billion). In addition, actuarial losses from defined-benefit pension plans (minus €0.6 billion) affected retained earnings. This includes positive effects related to the tax assessment of previous years of €0.4 billion. Compared with the increase in equity of 4%, the balance sheet total increased disproportionately by 10%. Due to the effects described above, the Group’s equity ratio of 21.0% was lower than at the end of 2014 (22.1%); the equity ratio for the industrial business was 37.7% (end of 2014: 40.8%). The equity ratios are adjusted for the dividend payment for the year 2014. Provisions increased to €31.2 billion (December 31, 2014: €28.4 billion); as a proportion of the balance sheet total, they amounted to 15%, which is the same as the prior-year level. The effects of currency translation account for €0.8 billion of the increase in provisions. They primarily comprise provisions for pensions and similar obligations of €14.8 billion (end of 2014: €12.8 billion), which mainly consist of the difference between the present value of defined benefit pension obligations of €33.0 billion (end of 2014: €30.1 billion) and the fair value of the pension plan assets applied to finance those obligations of €19.5 billion (end of 2014: €18.6 billion). The fall in discount rates, especially for the German plans from 1.9% at December 31, 2014 to 1.5% at March 31, 2015, led to an increase in the present value of the defined benefit pension obligations. Provi-sions also relate to liabilities from income taxes of €1.8 billion (end of 2014: €1.6 billion), from product warranties of €5.2 billion (end of 2014: €5.0 billion) and from personnel and social costs of €3.9 billion (end of 2014: €3.9 billion), as well as other provisions of €5.5 billion (end of 2014: €5.1 billion). Financing liabilities of €93.8 billion were above the level of December 31, 2014 (€86.7 billion). As well as currency effects of €4.6 billion, the increase primarily reflects the refinancing of the growing leasing and sales-financing business. 51% of the financing liabilities are accounted for by bonds, 26% by liabilities to financial institutions, 11% by deposits in the direct banking business, and 8% by liabilities from ABS transactions. Trade payables increased to €12.3 billion (December 31, 2014: €10.2 billion), primarily due to the higher volume of business. The Mercedes-Benz Cars division accounts for 61% of those payables and the Daimler Trucks division accounts for 27%.
C | Interim Management Report
13
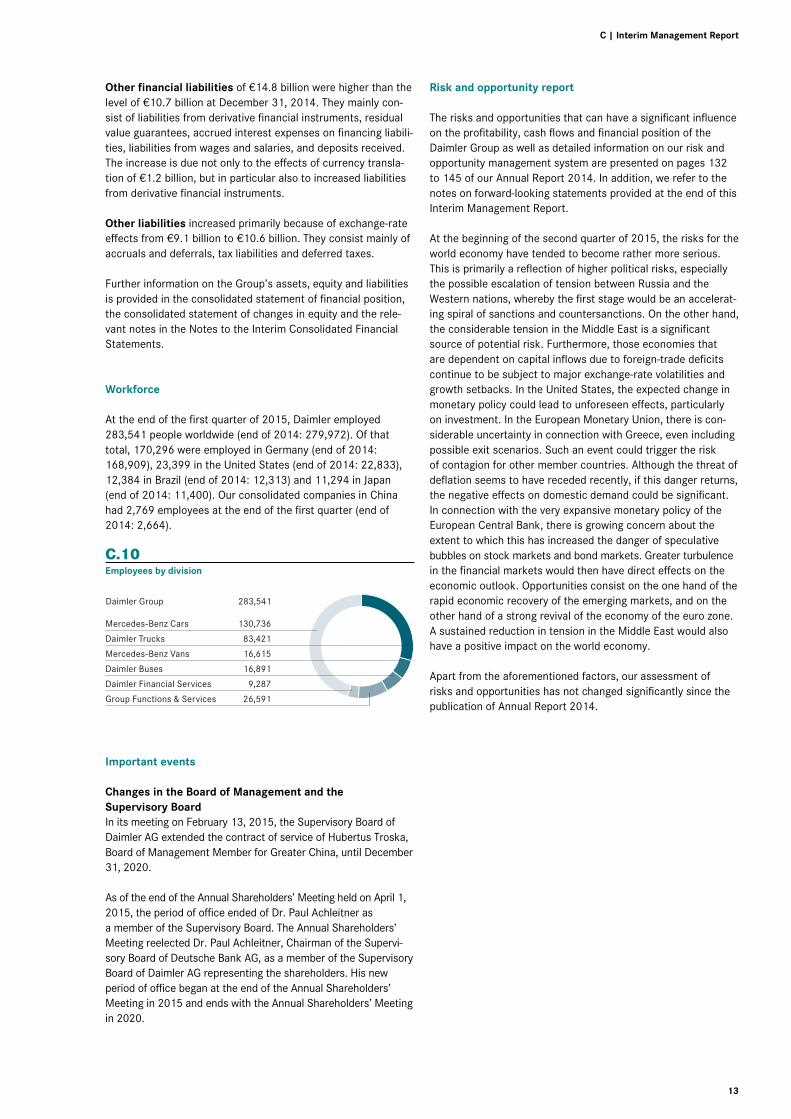
Other financial liabilities of €14.8 billion were higher than the level of €10.7 billion at December 31, 2014. They mainly con-sist of liabilities from derivative financial instruments, residual value guarantees, accrued interest expenses on financing liabili-ties, liabilities from wages and salaries, and deposits received. The increase is due not only to the effects of currency transla-tion of €1.2 billion, but in particular also to increased liabilities from derivative financial instruments. Other liabilities increased primarily because of exchange-rate effects from €9.1 billion to €10.6 billion. They consist mainly of accruals and deferrals, tax liabilities and deferred taxes. Further information on the Group’s assets, equity and liabilities is provided in the consolidated statement of financial position, the consolidated statement of changes in equity and the rele-vant notes in the Notes to the Interim Consolidated Financial Statements. Workforce At the end of the first quarter of 2015, Daimler employed 283,541 people worldwide (end of 2014: 279,972). Of that total, 170,296 were employed in Germany (end of 2014: 168,909), 23,399 in the United States (end of 2014: 22,833), 12,384 in Brazil (end of 2014: 12,313) and 11,294 in Japan (end of 2014: 11,400). Our consolidated companies in China had 2,769 employees at the end of the first quarter (end of 2014: 2,664). C.10 Employees by division
Important events Changes in the Board of Management and the Supervisory Board In its meeting on February 13, 2015, the Supervisory Board of Daimler AG extended the contract of service of Hubertus Troska, Board of Management Member for Greater China, until December 31, 2020. As of the end of the Annual Shareholders’ Meeting held on April 1, 2015, the period of office ended of Dr. Paul Achleitner as a member of the Supervisory Board. The Annual Shareholders’ Meeting reelected Dr. Paul Achleitner, Chairman of the Supervi-sory Board of Deutsche Bank AG, as a member of the Supervisory Board of Daimler AG representing the shareholders. His new period of office began at the end of the Annual Shareholders’ Meeting in 2015 and ends with the Annual Shareholders’ Meeting in 2020.
Risk and opportunity report The risks and opportunities that can have a significant influence on the profitability, cash flows and financial position of the Daimler Group as well as detailed information on our risk and opportunity management system are presented on pages 132 to 145 of our Annual Report 2014. In addition, we refer to the notes on forward-looking statements provided at the end of this Interim Management Report. At the beginning of the second quarter of 2015, the risks for the world economy have tended to become rather more serious. This is primarily a reflection of higher political risks, especially the possible escalation of tension between Russia and the Western nations, whereby the first stage would be an accelerat-ing spiral of sanctions and countersanctions. On the other hand, the considerable tension in the Middle East is a significant source of potential risk. Furthermore, those economies that are dependent on capital inflows due to foreign-trade deficits continue to be subject to major exchange-rate volatilities and growth setbacks. In the United States, the expected change in monetary policy could lead to unforeseen effects, particularly on investment. In the European Monetary Union, there is con-siderable uncertainty in connection with Greece, even including possible exit scenarios. Such an event could trigger the risk of contagion for other member countries. Although the threat of deflation seems to have receded recently, if this danger returns, the negative effects on domestic demand could be significant. In connection with the very expansive monetary policy of the European Central Bank, there is growing concern about the extent to which this has increased the danger of speculative bubbles on stock markets and bond markets. Greater turbulence in the financial markets would then have direct effects on the economic outlook. Opportunities consist on the one hand of the rapid economic recovery of the emerging markets, and on the other hand of a strong revival of the economy of the euro zone. A sustained reduction in tension in the Middle East would also have a positive impact on the world economy. Apart from the aforementioned factors, our assessment of risks and opportunities has not changed significantly since the publication of Annual Report 2014.
Mercedes-Benz Cars 130,736
Daimler Trucks 83,421
Mercedes-Benz Vans 16,615
Daimler Buses 16,891
Daimler Financial Services 9,287
Group Functions & Services 26,591
Daimler Group 283,541
14
Outlook At the beginning of the second quarter, there are still good pro-spects that the world economy will continue its expansion. But in view of the substantial decrease in the price of crude oil, the ongoing supportive monetary-policy actions by major central banks and very low inflation rates, the momentum of the world economy remains rather moderate, with an expected growth rate of just under 3%. This has less to do with the industrialized countries, which should achieve growth in gross domestic prod-uct of just over 2% this year. The moderate speed of expansion of the world economy is primarily due to the weak development of the emerging markets, which are likely to lose another half a percentage point of growth this year compared with 2014. Within the industrialized countries, above all the US economy should continue to deliver important growth impetus. In view of solid improvements in the labor market and rising real incomes, significant growth in private consumption is to be expected. Although a departure from the present zero-interest policy seems likely this summer, most analysts assume that it will take place rather smoothly with no perceptible impact on domestic demand. For the European Monetary Union, the available leading indicators suggest that lower energy prices, the weaker euro and the expansive measures taken by the European Central Bank will increasingly have positive effects. After growth of less than one percent in 2014, a rate of about 1.5% seems feasibly for the region in 2015. In Japan, the disappointing year 2014 should be followed this year by growth in gross domestic prod-uct of approximately 1%. The ongoing development in China is crucial for the world economy. But although we assume that the country’s overall growth rate will continue to fall, we also still expect the political decision makers to succeed in restructuring the economy without an excessive slowdown. The economic development of the South American economies will remain ex-tremely difficult. After a disappointing start to the year, it must be assumed that gross domestic product will contract, especial-ly in Brazil. But economic prospects are unfavorable for the coming quarters also in other South American countries. The economic downturn is likely to be the most severe this year in Russia, where a deep recession is now expected. Overall, we anticipate growth of the world economy in the magnitude of 3% this year. The biggest risks for the still rather fragile global economy come from the geopolitical side. In line with the continuation of moderate economic dynamism, worldwide demand for cars is expected to increase by about 3% in 2015. Demand in China, the world’s biggest car market, should grow again significantly and make by far the biggest contribution to global growth. The US market should also show solid development. Although total unit sales have meanwhile returned to the pre-crisis level and are thus close to market saturation, slight growth is to be expected once again in 2015.
With a market volume of up to 17 million units, more cars and light trucks will probably be sold than since 2005. In Western Europe, an ongoing demand revival is to be expected, whereby the initial situation of the individual markets continues to differ significantly. The market of the United Kingdom should grow again significantly from its already high level, but growth in France is likely to be restrained in relation to the comparatively weak prior-year level. In the German car market, moderate expansion and total sales of just over three million units are anticipated. The Japanese market has been at an artificially high level for several years as a result of various special effects. For the year 2015, a correction is therefore expected with a lower level of demand. The picture for the major emerging markets excluding China remains varied in 2015. A recovery of demand for cars is anticipated in India. In Russia, however, a drastic fall in car sales must be assumed due to the country’s severe economic crisis. As there have been increasing signs of weaker demand also for premium automobiles, a substantial decrease in unit sales must be expected also in this segment. In the worldwide market for medium- and heavy-duty trucks, another drop in demand is expected in 2015 following last year’s significant decrease. Furthermore, the situation will remain varied from one region to another. The NAFTA region once again promises to have the most positive development. The main economic indicators there suggest that the truck market will remain favorable with demand likely to increase by 10-15%. The economic prospects for the European market have bright-ened since the beginning of the year, so we now anticipate market growth of 5-10%. Market conditions in Brazil have dete-riorated significantly once again. Starting from a low level, we must now assume that demand will fall again substantially by approximately 30%. The Japanese market for light-, medium- and heavy-duty trucks appears to be relatively robust despite the sluggish economy, so we anticipate a market volume in 2015 in the magnitude of the previous year. But following a very weak start to the year in Indonesia, we must assume that demand there will be about 20% lower than in 2014. The deep recession in Russia will continue to affect the market, so demand is likely to strongly fall once again. But a significant market recovery is anticipated in India, thanks to the slightly improved economic prospects there. Demand for trucks in China is currently under pressure due to the introduction of the CN4 emissions standards (similar to Euro IV). We therefore expect the market to contract significantly compared with its prior-year level.

C | Interim Management Report
15
We assume that the market for medium-sized and large vans in Europe will grow slightly in 2015, as will the market for small vans. Significant growth is anticipated in the US market for large vans. In Latin America, we expect significant contraction in the market for large vans. In China, we foresee demand at the level of the previous year in the market we address there. We anticipate a market volume for buses in Europe in 2015 that is slightly above the very low level of the previous year. In Brazil, demand for buses is likely to decrease again significantly this year. On the basis of the divisions’ planning, Daimler, expects its total unit sales to increase significantly in 2015. Mercedes-Benz Cars is continuing last year’s success in 2015 and is further strengthening its market position. After the best-ever first quarter, we intend to achieve significant growth in unit sales once again in full-year 2015, thus setting a new record for unit sales. Major contributions will come from the C-Class sedan and wagon models. As the year progresses, we will contin-ue our product offensive and thus create impetus for additional growth. A total of eight new or upgraded car models will be launched in 2015. This started with the Mercedes-Maybach S-Class in February, the first product of the new sub-brand. It was followed in March by the Mercedes-AMG GT and the CLA Shoot-ing Brake, which complements the successful family of compact cars with its unique design. The focus in the second half of the year will be on the new SUV models as important growth drivers. In July, we will have the launch of the new GLE coupe, which already had its world premiere in Detroit this January. Four more models will come onto the market by the end of the year, including two SUVs. With these vehicles, Mercedes-Benz will meet the still-rising demand for premium SUVs, thus facili-tating further growth. The two smart models will also contribute to a significant increase in unit sales; they will be available in all key markets this year and can also be ordered with the twinamic double-clutch transmission. Daimler Trucks anticipates a significant increase in unit sales in the year 2015. In Western Europe, we expect growing investment activity, accompanied by rising demand for trucks to replace older models. Unit sales in this region should therefore be higher than in the previous year. In Turkey, we anticipate a significant number of purchases being brought forward to the year 2015 because of the coming introduction of Euro VI emis-sion standards in 2016. The economic situation in Brazil has further exacerbated in recent months. The political situation and unfavorable financing conditions are crippling investment activity, so we have to anticipate significant falls in unit sales. For the NAFTA region, we assume that our unit sales will once again significantly surpass the prior-year figure, in line with the expected market development. The new and successful prod-ucts should safeguard our market leadership in this region. In Asia, we anticipate unit sales at about the same level as in 2014. The further expansion of our dealer network should allow significant growth in unit sales in India. Furthermore, the ex-panded range of FUSO vehicles from Chennai should stimulate
additional sales growth outside India. In Indonesia, demand for trucks in the first quarter was once again significantly below the prior-year level following last year’s decrease. We therefore do not yet expect a reversal of the weaker market trend in the full year. In Japan, we assume that unit sales will be of the same magnitude as the high prior-year level. Mercedes-Benz Vans plans to achieve significant growth in unit sales in 2015. Above all in Europe, our core market, we anticipate significant increases in sales of medium-sized and large vans. This development is likely to be primarily driven by the new Vito for commercial use and the V-Class multipurpose vehicle for private use. Both those models are now fully available following their launch in 2014. In the context of our “Mercedes-Benz Vans goes global” strategy for the division, we will launch the Vito also in North and South America this year, stimulating additional demand there. We aim to achieve further growth in those markets also with the Sprinter, which we will produce also in North America in the future. Daimler Buses assumes that it will be able to defend its mar-ket leadership in its core markets for buses above 8 tons with innovative and high-quality new products. For the year 2015, we now anticipate a significant decrease in total unit sales. We expect unit sales to fall significantly in Latin America, accompa-nied by a stable development in Europe and rising unit sales in Mexico. Daimler Financial Services anticipates significant growth in both new business and contract volume in the year 2015. This will result from the growth offensives of the automotive divisions, the specific targeting of younger customers, the expansion of business especially in Asia, and the further devel-opment of our online sales channels. We will also systematically expand our range of mobility services.

16
We assume that the Daimler Group’s revenue will increase significantly in 2015. In regional terms, we anticipate the strongest growth in Asia and North America, but our business volumes should expand also in the other regions. On the basis of the anticipated market development and the planning of our divisions, we assume that EBIT from the ongoing business will increase significantly in 2015. For the individual divisions, we aim to achieve the following EBIT targets from the ongoing business in full-year 2015: – Mercedes-Benz Cars: significantly above the prior-year level, – Daimler Trucks: significantly above the prior-year level, – Mercedes-Benz Vans: significantly above the prior-year level, – Daimler Buses: significantly below the prior-year level, and – Daimler Financial Services: slightly above the prior-year level. The anticipated development of earnings in the automotive divi-sions will have a positive impact on the free cash flow of the industrial business in 2015. When comparing with 2014, it is necessary to consider that the free cash flow from the industrial business in that year was influenced by the sale of our shares in Rolls-Royce Power Systems Holding GmbH and Tesla, as well as by the extraordinary contribution to the German pension plan assets and the settlement of a healthcare plan in North America. In the year 2015, we expect a free cash flow from the indus-trial business in a significantly higher amount than the dividend payment in 2015 of €2.6 billion. As we will slightly increase our investment in property, plant and equipment and significantly increase our research and development spending, we assume, however, that the free cash flow of the industrial business will be significantly lower than in 2014 (€5.5 billion). Against the backdrop of the development in the first quarter, from today’s perspective, we are aiming for the upper end of this bandwidth. Due to the generally very favorable business development that we expect for 2015, production volumes will continue rising. At the same time, the efficiency-enhancing measures we have implemented at all divisions in recent years will now take full effect. The medium- and long-term programs for structural im-provements of our business processes should facilitate further efficiency progress. We therefore assume that the number of employees worldwide will increase only slightly.
Forward-looking statements: This document contains forward-looking statements that reflect our current views about future events. The words “anticipate,” “assume,” “believe,” “es-timate,” “expect,” “intend,” “may,” ”can,” “could,” “plan,” “project,” “should” and similar expressions are used to identify forward-looking statements. These statements are subject to many risks and uncertainties, including an adverse development of global economic conditions, in particular a decline of demand in our most important markets; a worsening of the sovereign-debt crisis in the euro zone; an increase in political tension in Eastern Europe; a deterioration of our refinancing possibilities on the credit and financial mar-kets; events of force majeure including natural disasters, acts of terrorism, political unrest, industrial accidents and their effects on our sales, purchas-ing, production or financial services activities; changes in currency exchange rates; a shift in consumer preferences towards smaller, lower-margin vehi-cles; a possible lack of acceptance of our products or services which limits our ability to achieve prices and adequately utilize our production capacities; price increases for fuel or raw materials; disruption of production due to shortages of materials, labor strikes or supplier insolvencies; a decline in resale prices of used vehicles; the effective implementation of cost-reduction and efficiency-optimization measures; the business outlook for companies in which we hold a significant equity interest; the successful implementation of strategic cooperations and joint ventures; changes in laws, regulations and government policies, particularly those relating to vehicle emissions, fuel economy and safety; the resolution of pending government investigations and the conclusion of pending or threatened future legal proceedings; and other risks and uncertainties, some of which we describe under the heading “Risk and Opportunity Report” in the current Annual Report. If any of these risks and uncertainties materializes or if the assumptions underlying any of our forward-looking statements prove to be incorrect, the actual results may be materially different from those we express or imply by such statements. We do not intend or assume any obligation to update these forward-looking statements since they are based solely on the circumstances at the date of publication.
22
The accompanying notes are an integral part of these Interim Consolidated Financial Statements.
E.01
Consolidated Group
Industrial Business (unaudited
additional information)
Daimler Financial Services (unaudited
additional information)
Q1 2015 Q1 2014 Q1 2015 Q1 2014 Q1 2015 Q1 2014
In millions of euros
Revenue 34,236 29,457 29,687 25,648 4,549 3,809
Cost of sales -26,706 -23,045 -22,852 -19,861 -3,854 -3,184
Gross profit 7,530 6,412 6,835 5,787 695 625
Selling expenses -2,920 -2,675 -2,791 -2,567 -129 -108
General administrative expenses -909 -752 -736 -631 -173 -121
Research and non-capitalized development costs -1,126 -1,076 -1,126 -1,076 - -
Other operating income 455 305 433 295 22 10
Other operating expense -116 -86 -111 -81 -5 -5
Profit/loss on equity-method investments, net 148 22 149 25 -1 -3
Other financial expense, net -158 -365 -158 -364 - -1
Interest income 51 34 51 34 - -
Interest expense -154 -169 -153 -167 -1 -2
Profit before income taxes1 2,801 1,650 2,393 1,255 408 395
Income taxes -751 -564 -617 -430 -134 -134
Net profit 2,050 1,086 1,776 825 274 261
thereof profit attributable to non-controlling interests 87 59
thereof profit attributable to shareholders of Daimler AG 1,963 1,027
Earnings per share (in euros) for profit attributable to shareholders of Daimler AG
Basic 1.83 0.96
Diluted 1.83 0.96
1 The reconciliation of Group EBIT to profit before income taxes is presented in Note 19.
Consolidated Statement of Income (unaudited).
E | Interim Consolidated Financial Statements
23
The accompanying notes are an integral part of these Interim Consolidated Financial Statements.
E.02 Consolidated Group Q1 2015 Q1 2014
In millions of euros
Net profit 2,050 1,086
Unrealized gains/losses on currency translation 2,741 -73
Unrealized gains/losses on financial assets available for sale 529 163
Unrealized gains/losses on derivative financial instruments -2,676 -146
Unrealized gains/losses on investments accounted for using the equity method 3 -
Items that may be reclassified to profit/loss 597 -56
Actuarial gains/losses from pensions and similar obligations -569 -860
Items that will not be reclassified to profit/loss -569 -860
Other comprehensive income/loss, net of taxes 28 -916
thereof income/loss attributable to non-controlling interest, after taxes 108 -1
thereof income/loss attributable to shareholders of Daimler AG, after taxes -80 -915
Total comprehensive income/loss 2,078 170
thereof income/loss attributable to non-controlling interests 195 58
thereof income/loss attributable to shareholders of Daimler AG 1,883 112
Consolidated Statement of Comprehensive Income/Loss (unaudited).
24
The accompanying notes are an integral part of these Interim Consolidated Financial Statements.
E.03
Consolidated Group
Industrial Business (unaudited
additional information)
Daimler Financial Services (unaudited
additional information)
March 31,
2015 Dec. 31,
2014 March 31,
2015 Dec. 31,
2014 March 31,
2015 Dec. 31,
2014
In millions of euros
Assets
Intangible assets 9,539 9,367 9,371 9,202 168 165
Property, plant and equipment 23,735 23,182 23,673 23,125 62 57
Equipment on operating leases 35,980 33,050 14,808 14,374 21,172 18,676
Equity-method investments 2,794 2,294 2,765 2,264 29 30
Receivables from financial services 38,892 34,910 -47 -49 38,939 34,959
Marketable debt securities 1,320 1,374 6 6 1,314 1,368
Other financial assets 4,419 3,634 -472 -1,140 4,891 4,774
Deferred tax assets 6,060 4,124 5,503 3,610 557 514
Other assets 515 555 -2,184 -2,178 2,699 2,733
Total non-current assets 123,254 112,490 53,423 49,214 69,831 63,276
Inventories 23,516 20,864 22,762 20,004 754 860
Trade receivables 9,413 8,634 8,427 7,824 986 810
Receivables from financial services 29,355 26,769 -21 -25 29,376 26,794
Cash and cash equivalents 12,219 9,667 11,095 8,341 1,124 1,326
Marketable debt securities 5,431 5,260 5,310 5,150 121 110
Other financial assets 2,215 2,353 -7,861 -7,099 10,076 9,452
Other assets 3,866 3,598 972 772 2,894 2,826
Total current assets 86,015 77,145 40,684 34,967 45,331 42,178
Total assets 209,269 189,635 94,107 84,181 115,162 105,454
Equity and liabilities
Share capital 3,070 3,070
Capital reserves 11,899 11,906
Retained earnings 29,881 28,487
Other reserves 691 202
Equity attributable to shareholders of Daimler AG 45,541 43,665
Non-controlling interests 1,039 919
Total equity 46,580 44,584 38,114 36,967 8,466 7,617
Provisions for pensions and similar obligations 14,798 12,806 14,587 12,630 211 176
Provisions for income taxes 843 851 843 850 - 1
Provisions for other risks 7,026 6,712 6,896 6,590 130 122
Financing liabilities 54,400 50,399 11,587 10,325 42,813 40,074
Other financial liabilities 3,772 2,644 3,280 2,231 492 413
Deferred tax liabilities 1,505 1,070 -1,564 -1,618 3,069 2,688
Deferred income 3,988 3,581 3,478 3,101 510 480
Other liabilities 12 14 10 14 2 -
Total non-current liabilities 86,344 78,077 39,117 34,123 47,227 43,954
Trade payables 12,293 10,178 11,781 9,852 512 326
Provisions for income taxes 953 757 874 679 79 78
Provisions for other risks 7,597 7,267 7,134 6,830 463 437
Financing liabilities 39,364 36,290 -15,338 -13,518 54,702 49,808
Other financial liabilities 11,071 8,062 8,911 6,198 2,160 1,864
Deferred income 2,734 2,413 1,891 1,674 843 739
Other liabilities 2,333 2,007 1,623 1,376 710 631
Total current liabilities 76,345 66,974 16,876 13,091 59,469 53,883
Total equity and liabilities 209,269 189,635 94,107 84,181 115,162 105,454
Consolidated Statement of Financial Position (unaudited).
E | Interim Consolidated Financial Statements
25
The accompanying notes are an integral part of these Interim Consolidated Financial Statements.
E.04
Consolidated Group
Industrial Business (unaudited
additional information)
Daimler Financial Services (unaudited
additional information)
Q1 2015 Q1 2014 Q1 2015 Q1 2014 Q1 2015 Q1 2014
In millions of euros
Profit before income taxes 2,801 1,650 2,393 1,255 408 395
Depreciation and amortization 1,367 1,218 1,349 1,211 18 7
Other non-cash expense and income -145 4 -159 -11 14 15
Gains/losses on disposals of assets -83 11 -83 11 - -
Change in operating assets and liabilities
Inventories -1,587 -1,759 -1,723 -1,905 136 146
Trade receivables -382 158 -259 248 -123 -90
Trade payables 1,717 1,508 1,548 1,480 169 28
Receivables from financial services -2,085 -531 75 2 -2,160 -533
Vehicles on operating leases -653 -368 16 -43 -669 -325
Other operating assets and liabilities 939 39 572 -19 367 58
Income taxes paid/refunded -13 -237 66 -167 -79 -70
Cash provided by/used for operating activities 1,876 1,693 3,795 2,062 -1,919 -369
Additions to property, plant and equipment -1,027 -1,043 -1,019 -1,038 -8 -5
Additions to intangible assets -480 -387 -477 -378 -3 -9
Proceeds from disposals of property, plant and equipment and intangible assets 139 56 135 53 4 3
Investments in share property -92 -69 -92 -43 - -26
Proceeds from disposals of share property 4 4 -123 4 127 -
Acquisition of marketable debt securities -691 -457 -689 -421 -2 -36
Proceeds from sales of marketable debt securities 633 1,056 560 886 73 170
Other -3 12 20 47 -23 -35
Cash provided by/used for investing activities -1,517 -828 -1,685 -890 168 62
Change in financing liabilities 1,615 16 669 832 946 -816
Dividends paid to non-controlling interests -45 -33 -44 -32 -1 -1
Proceeds from issuance of share capital - 5 - 3 - 2
Acquisition of treasury shares -27 -26 -27 -26 - -
Internal equity and financing transactions - - -553 -821 553 821
Cash provided by/used for financing activities 1,543 -38 45 -44 1,498 6
Effect of foreign exchange-rate changes on cash and cash equivalents 650 -61 599 -48 51 -13
Net increase/decrease in cash and cash equivalents 2,552 766 2,754 1,080 -202 -314
Cash and cash equivalents at beginning of period 9,667 11,053 8,341 9,845 1,326 1,208
Cash and cash equivalents at end of period 12,219 11,819 11,095 10,925 1,124 894
Consolidated Statement of Cash Flows (unaudited).

26
The accompanying notes are an integral part of these Interim Consolidated Financial Statements.
E.05
In millions of euros Share
capital Capital
reserves Retained earnings
Currency translation
Financial assets
availablefor sale
Balance at January 1, 2014 3,069 11,850 27,628 -969 261
Net profit - - 1,027 - -
Other comprehensive income/loss before taxes - - -1,248 -65 162
Taxes on other comprehensive income - - 388 - 1
Total comprehensive income/loss - - 167 -65 163
Dividends - - - - -
Capital increase/Issue of new shares 1 2 - - -
Acquisition of treasury shares - - - - -
Issue and disposal of treasury shares - - - - -
Other - -14 - - -
Balance at March 31, 2014 3,070 11,838 27,795 -1,034 424
Balance at January 1, 2015 3,070 11,906 28,487 775 460
Net profit - - 1,963 - -
Other comprehensive income/loss before taxes - - -1,640 2,629 532
Taxes on other comprehensive income - - 1,071 - -3
Total comprehensive income/loss - - 1,394 2,629 529
Dividends - - - - -
Acquisition of treasury shares - - - -
Issue and disposal of treasury shares - - - - -
Other - -7 - - -
Balance at March 31, 2015 3,070 11,899 29,881 3,404 989
Consolidated Statement of Changes in Equity (unaudited).
E | Interim Consolidated Financial Statements
27
The accompanying notes are an integral part of these Interim Consolidated Financial Statements.
Other reserves
Items that may be
reclassified to profit/loss
Derivative financial
instruments
Share of
investments accounted for using
the equity method
Treasury shares
Equity attributable
to share-holders
of Daimler AG Non-controlling
interest Total
equity In millions of euros
853 -12 - 42,680 683 43,363 Balance at January 1, 2014
- - - 1,027 59 1,086 Net profit
-221 - - -1,372 1 -1,371 Other comprehensive income/loss before taxes
68 - - 457 -2 455 Taxes on other comprehensive income
-153 - - 112 58 170 Total comprehensive income/loss
- - - - -40 -40 Dividends
- - - 3 2 5 Capital increase/Issue of new shares
- - -26 -26 - -26 Acquisition of treasury shares
- - 26 26 - 26 Issue and disposal of treasury shares
- - - -14 1 -13 Other
700 -12 - 42,781 704 43,485 Balance at March 31, 2014
-1,032 -1 - 43,665 919 44,584 Balance at January 1, 2015
- - - 1,963 87 2,050 Net profit
-3,819 3 - -2,295 107 -2,188 Other comprehensive income/loss before taxes
1,147 - - 2,215 1 2,216 Taxes on other comprehensive income
-2,672 3 - 1,883 195 2,078 Total comprehensive income/loss
- - - - -69 -69 Dividends
- - -27 -27 - -27 Acquisition of treasury shares
- - 27 27 - 27 Issue and disposal of treasury shares
- - - -7 -6 -13 Other
-3,704 2 - 45,541 1,039 46,580 Balance at March 31, 2015

28
1. Presentation of the Interim Consolidated Financial Statements
General. These condensed unaudited interim consolidated financial statements (interim financial statements) of Daimler AG and its subsidiaries (“Daimler” or “the Group”) have been prepared in accordance with Section 37x Subsection 3 of the German Securities Trading Act (WpHG) and with International Accounting Standard (IAS) 34 Interim Financial Reporting. The interim financial statements comply with the International Financial Reporting Standards (IFRS) as endorsed by the European Union. Daimler AG is a stock corporation organized under the laws of the Federal Republic of Germany. Daimler AG is entered in the Commercial Register of the Stuttgart District Court under No. HRB 19360 and its registered office is located at Mercedesstraße 137, 70327 Stuttgart, Germany. The interim financial statements of the Group are presented in euros (€). Unless otherwise stated, all amounts are stated in millions of euros. All figures shown are rounded in accordance with standard business rounding principles. All significant intercompany accounts and transactions have been eliminated. In the opinion of the management, the interim financial statements reflect all adjustments (i.e. normal recurring adjustments) necessary for a fair presentation of the profitability, liquidity and capital resources, and financial posi-tion of the Group. Operating results for the interim periods pre-sented are not necessarily indicative of the results that may be expected for any future period or for the full fiscal year. The interim financial statements should be read in conjunction with the December 31, 2014 audited and published IFRS consolidat-ed financial statements and notes thereto. The accounting poli-cies applied by the Group in these interim financial statements basically correspond with those applied for the consolidated financial statements for the year ended December 31, 2014. In order to support the distribution of certain products manu-factured by Daimler, sales financing, including leasing alterna-tives, is made available to the Group’s customers. Accordingly, the Group’s consolidated financial statements are also signifi-cantly influenced by the activities of its financial services busi-ness. To enhance readers’ understanding of the Group’s profit-ability, liquidity and capital resources and its financial position, the accompanying interim consolidated financial statements also present information with respect to the Group’s industrial business and Daimler Financial Services’ business activities. Such information, however, is not required by IFRS and is not
intended to, and does not represent the separate IFRS profita-bility, liquidity and capital resources and the financial position of the Group’s industrial business or Daimler Financial Services business activities. Eliminations of the effects of transactions between the industrial business and Daimler Financial Services have generally been allocated to the industrial business. Preparation of interim financial statements in conformity with IFRS requires management to make estimates, assessments and assumptions which can affect the amounts and reporting of assets and liabilities, the reporting of contingent assets and liabilities as at the end of the reporting period and the amounts of income and expense reported for the period. Actual amounts can differ from those estimates. Changes in the estimates, assessments and assumptions can have a material impact on the interim consolidated financial statements. 2. Significant disposals of equity investments
Atlantis Foundries. At the end of February 2015, Daimler decided to sell its shares in Atlantis Foundries (Pty.) Ltd. to Neue Halberg-Guss GmbH. The transaction is expected to be closed in the first half of 2015. The remeasurement of the assets and liabilities of Atlantis Foundries resulting from the classification as assets held for sale led to an impairment loss of €55 million as of March 31, 2015, which was allocated to the Daimler Trucks segment. Due to the minor significance for the Daimler Group’s profitability, liquidity and capital resources and its financial position, the disposal of these assets and liabilities is not presented separately in the consolidated statement of financial position. RRPSH. In the first quarter of 2014, the Board of Management and the Supervisory Board of Daimler AG decided to sell the 50% equity interest in Rolls-Royce Power Systems Holding GmbH (RRPSH) to the partner Rolls-Royce Holdings plc (Rolls-Royce). For that purpose, Daimler exercised a put option on its stake in RRPSH that had been agreed upon with Rolls-Royce in 2011. The transaction was closed in the third quarter of 2014. The measurement of the put option resulted in an expense of €118 million in the first quarter of 2014.
See Note 11 for further information on RRPSH.
Notes to the Interim Consolidated Financial Statements (unaudited).

E | Interim Consolidated Financial Statements
29
3. Revenue
Revenue at Group level is comprised as follows:
E.06Revenue Q1 2015 Q1 2014
In millions of euros
Revenue from the sale of goods 29,745 25,718
Revenue from the rental and leasing business 3,468 2,882
Interest from the financial services business at Daimler Financial Services 911 749
Revenue from the provision of other services 112 108
34,236 29,457
4. Functional costs
Optimization programs. Measures and programs with implementation costs that materially impacted the EBIT of the segments are briefly described below. In the course of the organizational focus on the divisions, Daimler started a restructuring program for its sales organiza-tion in Germany in 2014. Selected sales-and-service centers and outlets are being combined into car and commercial-vehicle outlets in order to steadily increase the profitability of Daimler’s own dealer activities in the highly competitive German market. In addition, the restructuring program includes the plan to sell selected operations of the Group’s current sales network, pri-marily by the end of 2015. Due to their minor impact on the Group’s profitability, liquidity and capital resources and financial position, the assets and liabilities held for sale are not pre-sented separately in the consolidated statement of financial position. At December 31, 2014, this disposal group’s assets amounted to €300 million and its liabilities amounted to €27 million. Due to the partial sale of the disposal group, its remaining assets amounted to €270 million at March 31, 2015. It no longer had any liabilities. In the first quarter of 2015, Daimler recorded expenses of €29 million. For these restructur-ing measures, the Group anticipates negative effects on earn-ings of up to €0.5 billion in 2015 and 2016. This program affects all automotive segments, but mainly the Mercedes-Benz Cars segment. Moreover, in January 2013, Daimler Trucks announced work-force adjustments as part of its goal of increasing its profitabil-ity by stronger utilization of efficiencies. In Brazil, a voluntary redundancy program launched in the administrative area in the first quarter of 2013 was continued in April 2014 mostly in the productive area, leading to a reduction of approximately 2,500 jobs as of March 31, 2015. These workforce adjustments also affected Daimler Buses to a small extent.
In addition, in non-productive areas of Daimler Trucks in Germany, a program based on socially acceptable voluntary measures ran between May 2013 and December 2014 leading to a reduction of approximately 600 jobs as of December 31, 2014. The Group anticipates expenses of up to €50 million in 2015 for the optimization program at Daimler Trucks. Table E.07 shows the expenses related to the optimization programs which affected the EBIT of the segments. The cash outflows associated with the implementation of the programs are also shown.
E.07Optimization programs
Q1 2015 Q1 2014
In millions of euros
Mercedes-Benz Cars
EBIT -20 -
Cash flow -4 -
Daimler Trucks
EBIT -9 -5
Cash flow -37 -64
Mercedes-Benz Vans
EBIT -4 -
Cash flow -1 -
Daimler Buses
EBIT -1 -1
Cash flow - -9

30
The provisions recognized for the optimization programs are shown in Table E.08.
E.08Provisions for optimization programs
March 31,
2015 Dec. 31,
2014In millions of euros
Mercedes-Benz Cars 17 -
Daimler Trucks 5 6
Mercedes-Benz Vans 4 -
Daimler Buses 1 13
The expenses listed in table E.07 primarily relate to person-nel measures and are included in the line items within the consolidated statement of income as shown in table E.09.
E.09Income and expenses associated with optimization programs
Q1 2015 Q1 2014
In millions of euros
Cost of sales -5 -3
Selling expenses -32 -
General administrative expenses - -3
Other operating income 3 -
-34 -6
Cash effects resulting from the optimization programs are mainly expected until 2017.
5. Other operating income
Table E.10 shows the components of other operating income.
E.10Other operating income
Q1 2015 Q1 2014
In millions of euros
Income from costs recharged to third parties 226 173
Gains on sales of property, plant and equipment 95 20
Government grants and subsidies 15 20
Rental income, not relating to sales financing 15 14
Reimbursements under insurance policies 7 5
Other miscellaneous income 97 73
455 305
Gains on sales of property, plant and equipment include gains from the sale of real-estate properties in the United States of €87 million.
6. Other financial income/expense, net
Table E.11 shows the components of other financial income/expense, net.
E.11Other financial income/expense, net
Q1 2015 Q1 2014
In millions of euros
Expense from compounding of provisions and effects of changes in discount rates1 -112 -66 Miscellaneous other financial income/expense, net -46 -299
-158 -365
1 Excluding the expense from compounding provisions for pensions and similar obligations.
In 2014, expenses of €161 million from hedging the share price of Tesla Motors, Inc. (Tesla) and of €118 million from the meas-urement of the RRPSH put option are included in miscellaneous other financial income/expense, net.

E | Interim Consolidated Financial Statements
31
7. Interest income and interest expense
Interest income and interest expense are comprised as follows:
E.12Interest income and expense Q1 2015 Q1 2014
In millions of euros
Interest income
Net interest income on the net assets of defined benefit pension plans 1 .
Interest and similar income 50 34
51 34
Interest expense
Net interest expense on the net obligation from defined benefit pension plans -81 -84
Interest and similar expense -73 -85
-154 -169
8. Intangible assets Intangible assets are comprised as follows:
E.13Intangible assets
March 31, 2015
Dec. 31,2014
In millions of euros
Goodwill 753 740
Development costs 7,348 7,245
Other intangible assets 1,438 1,382
9,539 9,367
9. Property, plant and equipment Property, plant and equipment are comprised as follows:
E.14Property, plant and equipment
March 31,
2015 Dec. 31,
2014In millions of euros
Land, leasehold improvements and buildings including buildings on land owned by others 7,213 6,942
Technical equipment and machinery 8,255 8,120
Other equipment, factory and office equipment 5,887 5,609
Advance payments relating to plant and equipment and construction in progress 2,380 2,511
23,735 23,182
10. Equipment on operating leases
At March 31, 2015, the carrying amount of equipment on oper-ating leases amounted to €35,980 million (December 31, 2014: €33,050 million). In the three months ended March 31, 2015, additions and disposals amounted to €4,632 million and €2,499 million respectively (2014: €3,762 million and €2,307 million). Depreciation for the first quarter of 2015 was €1,480 million (2014: €1,114 million). Other changes primarily include the effects of currency translation.

32
11. Equity-method investments
Table E.15 shows the carrying amounts and profits/losses from equity-method investments.
Table E.16 presents key figures on interests in associated companies accounted for using the equity method in the Group’s consolidated financial statements.
E.15Summarized carrying amounts and profits/losses from equity-method investments
Associated companies
Jointventures
Jointoperations Subsidiaries Total
In millions of euros
At March 31, 2015
Equity investment1 2,258 488 47 1 2,794
Equity result1 (Q1 2015) 159 -12 1 - 148
At December 31, 2014
Equity investment1 1,795 448 44 7 2,294
Equity result 1 (Q1 2014) 36 -15 1 - 22 1 Including investor-level adjustments.
E.16
Key figures on interests in associated companies accounted for using the equity method
RRPSH BBAC BAIC Motor2 Kamaz3 Others Total
In millions of euros
At March 31, 2015
Equity interest (in %) - 49.0 10.1 15.0 - -
Equity investment1 - 1,162 818 87 191 2,258
Equity result1 (Q1 2015) - 117 41 2 -1 159
At December 31, 2014
Equity interest (in %) - 49.0 10.1 15.0 - -
Equity investment1 - 852 686 71 186 1,795
Equity result1 (Q1 2014) 13 29 2 -3 -5 36
1 Including investor-level adjustments. 2 Earnings of BAIC Motor Corporation Ltd. (BAIC Motor) are included in Daimler’s consolidated financial statements with a three month time lag.
BAIC Motor’s figures are unaudited and based on local GAAP. The investment in BAIC Motor was acquired in November 2013. Therefore Daimler’s proportionate share in the earnings of BAIC Motor for the first quarter of 2014 relates to the earnings of BAIC Motor for the month of December 2013.
3 Kamaz OAO BBAC. In the first quarter of 2015, a capital increase of €72 million took place at Beijing Benz Automotive Co., Ltd. (BBAC). Daimler plans to contribute additional equity of €0.3 billion according to its shareholding ratio to BBAC in 2015.
RRPSH. In March 2014, Daimler decided to sell its 50% equity interest in the joint venture RRPSH to its partner Rolls-Royce. To do so, Daimler exercised a put option on its stake in RRPSH that was agreed upon with Rolls-Royce in 2011. The transaction was closed in the third quarter of 2014.

E | Interim Consolidated Financial Statements
33
12. Receivables from financial services
Receivables from financial services are shown in the following table:
E.17
Receivables from financial services March 31, 2015 December 31, 2014 Current Non-current Total Current Non-current Total
In millions of euros
Sales financing with customers 10,904 25,672 36,576 10,307 22,852 33,159
Sales financing with dealers 13,619 2,454 16,073 11,786 2,203 13,989
Finance-lease contracts 5,280 11,329 16,609 5,084 10,368 15,452
Gross carrying amount 29,803 39,455 69,258 27,177 35,423 62,600
Allowances for doubtful accounts -448 -563 -1,011 -408 -513 -921
Net carrying amount 29,355 38,892 68,247 26,769 34,910 61,679
At March 31, 2015, finance-lease contracts included non-automotive assets from contracts of the financial services business with third parties (leveraged leases) in the amount of €345 million (December 31, 2014: € 365 million).
Within the context of the ongoing concentration on the automo-tive business, Daimler Financial Services sold a non-automotive asset that was subject to a finance-lease contract in the first quarter of 2014. This resulted in a total cash inflow of €69 million. The pre-tax income from this transaction amounted to €45 million in the first quarter of 2014 and was allocated to the EBIT of the Daimler Financial Services segment. 13. Inventories
Inventories are comprised as follows:
E.18Inventories
March 31,
2015 Dec. 31,
2014In millions of euros
Raw materials and manufacturing supplies 2,711 2,409
Work in progress 3,423 2,936
Finished goods, parts and products held for resale 17,258 15,412
Advance payments to suppliers 124 107
23,516 20,864

34
14. Equity
Approved capital. The Annual Shareholders’ Meeting held on April 9, 2014 authorized the Board of Management, with the consent of the Supervisory Board, to increase the share capital of Daimler AG in the period until April 8, 2019 by a total of €1.0 billion in one lump sum or by separate partial amounts at different times by issuing new, registered no par value shares in exchange for cash and/or non-cash contributions (Approved Capital 2014). Among other things, the Board of Management was authorized, with the consent of the Supervisory Board, to exclude shareholders’ subscription rights under certain condi-tions and within defined limits. Conditional capital. By resolution adopted at the Annual Shareholders’ Meeting on April 1, 2015, the Board of Manage-ment, with the consent of the Supervisory Board, was author-ized to issue bearer and/or registered convertible bonds and/or bonds with warrants or a combination of these instru-ments (“bonds”) with a total face value of up to €10.0 billion and a maturity of no more than ten years, until March 31, 2020. The Board of Management is allowed to grant the holders of these bonds conversion rights or warrant rights for new regis-tered no-par-value shares in Daimler AG with an allocable por-tion of the share capital of up to €500 million in accordance with the details defined in the terms and conditions of the bonds. The bonds can be issued for cash or non-cash payment, including interest in other companies. The conditions can stipu-late obligatory conversions and options of the bonds. The bonds can be issued once or several times, wholly or in installments or simultaneously in various tranches and also by affiliated com-panies of Daimler AG, in accordance with Sections 15 ff of the German Stock Corporation Act (AktG). The Board of Manage-ment was also authorized, under certain specified conditions and within defined limitations and with the consent of the Supervisory Board, to exclude shareholders’ subscription rights for the bonds.
In order to redeem the bonds issued under the aforementioned resolution, the Annual Shareholders’ Meeting held on April 1, 2015 passed a resolution to increase the share capital condi-tionally by up to €500 million (Conditional Capital 2015). The Conditional Capital 2010 was cancelled.
Treasury shares. By resolution of the Annual Shareholders’ Meeting on April 1, 2015 Daimler AG was authorized until March 31, 2020 to acquire treasury shares up to 10% of the share capital for all legally permissible purposes. Among other things, the treasury shares may be used, under exclusion of the shareholders’ rights to subscribe to the Company’s treasury shares, to acquire companies and/or interest in companies, or may be sold to third parties for cash, whereby the transaction price must not be materially below the stock price at the date of the transaction. In addition, the Board of Management was authorized, with the consent of the Supervisory Board, to ex-clude the shareholders’ rights to subscribe to the Company’s treasury shares in additional defined cases. Treasury shares can also be canceled. Up to 5% of the share capital, Daimler AG was also authorized to acquire treasury shares using derivatives (put or call options, forwards or a combination of these financial instruments), whereby the terms of the derivatives may not exceed 18 months and must be terminated on March 31, 2020 at the latest.
The resolution adopted by the Annual Shareholders’ Meeting on April 14, 2010 that authorized Daimler AG to acquire treasury shares, including the resolution of the same Annual Sharehold-ers’ Meeting to use derivatives to acquire treasury shares, was terminated when the new authorization took effect. Employee share purchase plan. In the first quarter of 2015, 0.3 million (2014: 0.4 million) Daimler shares were purchased and reissued to employees in connection with employee share purchase plans. Dividend. The Annual Shareholders’ Meeting held on April 1, 2015 authorized Daimler to pay a dividend of €2,621 million (€2.45 per share) from the distributable profit of Daimler AG (separate financial statements) for the year 2014 (2014: €2,407 million and €2.25 per share). The dividend was paid out on April 2, 2015. 15. Pensions and similar obligations
Pension cost. The components of pension cost included in the consolidated statement of income are as shown in table
E.19. Contributions by the employer to plan assets. In the three months ended March 31, 2015, contributions by Daimler to the Group’s pension plans were €28 million (2014: €37 million). Other post-employment benefits. In May 2014, Daimler Trucks North America LLC and the United Auto Workers union (UAW) entered into an agreement to settle a healthcare plan as part of a collective bargaining agreement. As a result of this agreement, the obligation to the active eligible employees was settled in the fourth quarter of 2014. The transfer of the obliga-tion to the retirees became legally binding with expiration of the deadline for notices of appeal at the end of January 2015. This transaction resulted in a cash outflow of €63 million and income of €49 million in the first quarter of 2015; the income is included in the EBIT of the Daimler Trucks segment.
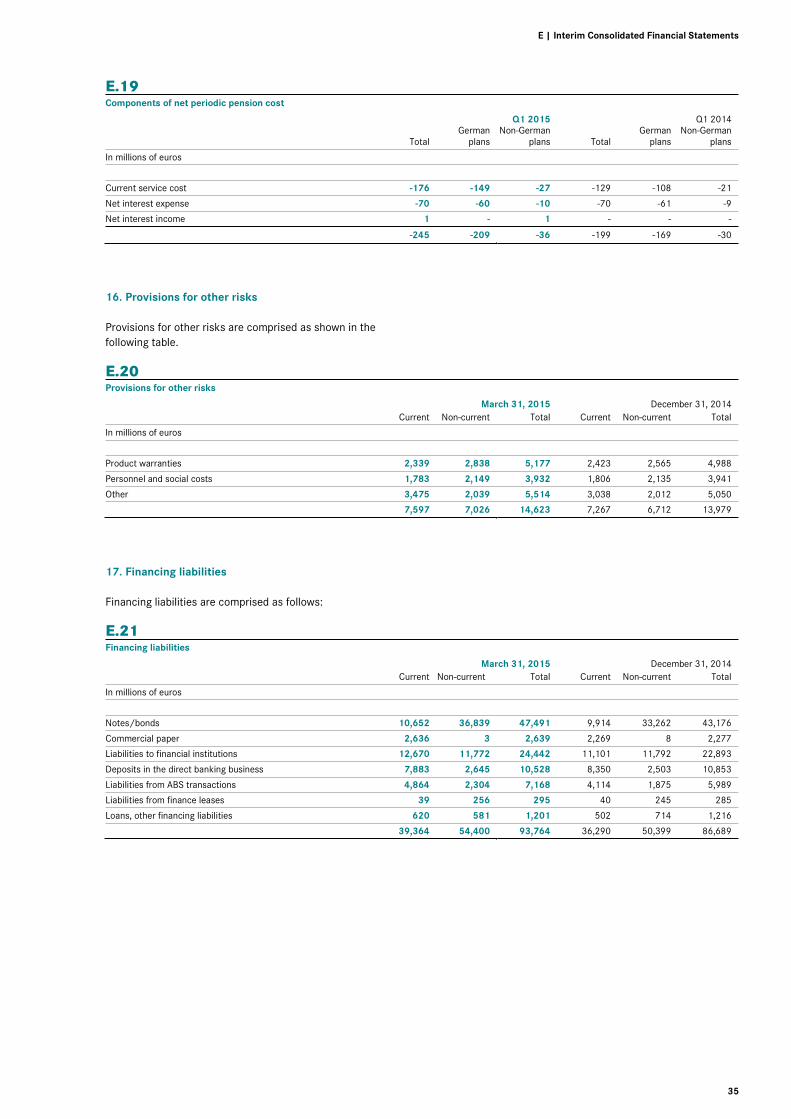
E | Interim Consolidated Financial Statements
35
E.19Components of net periodic pension cost Q1 2015 Q1 2014
Total German
plans Non-German
plans Total German
plans Non-German
plans
In millions of euros
Current service cost -176 -149 -27 -129 -108 -21
Net interest expense -70 -60 -10 -70 -61 -9
Net interest income 1 - 1 - - -
-245 -209 -36 -199 -169 -30
16. Provisions for other risks
Provisions for other risks are comprised as shown in the following table.
E.20Provisions for other risks March 31, 2015 December 31, 2014 Current Non-current Total Current Non-current Total
In millions of euros
Product warranties 2,339 2,838 5,177 2,423 2,565 4,988
Personnel and social costs 1,783 2,149 3,932 1,806 2,135 3,941
Other 3,475 2,039 5,514 3,038 2,012 5,050
7,597 7,026 14,623 7,267 6,712 13,979
17. Financing liabilities
Financing liabilities are comprised as follows:
E.21Financing liabilities March 31, 2015 December 31, 2014 Current Non-current Total Current Non-current Total
In millions of euros
Notes/bonds 10,652 36,839 47,491 9,914 33,262 43,176
Commercial paper 2,636 3 2,639 2,269 8 2,277
Liabilities to financial institutions 12,670 11,772 24,442 11,101 11,792 22,893
Deposits in the direct banking business 7,883 2,645 10,528 8,350 2,503 10,853
Liabilities from ABS transactions 4,864 2,304 7,168 4,114 1,875 5,989
Liabilities from finance leases 39 256 295 40 245 285
Loans, other financing liabilities 620 581 1,201 502 714 1,216
39,364 54,400 93,764 36,290 50,399 86,689
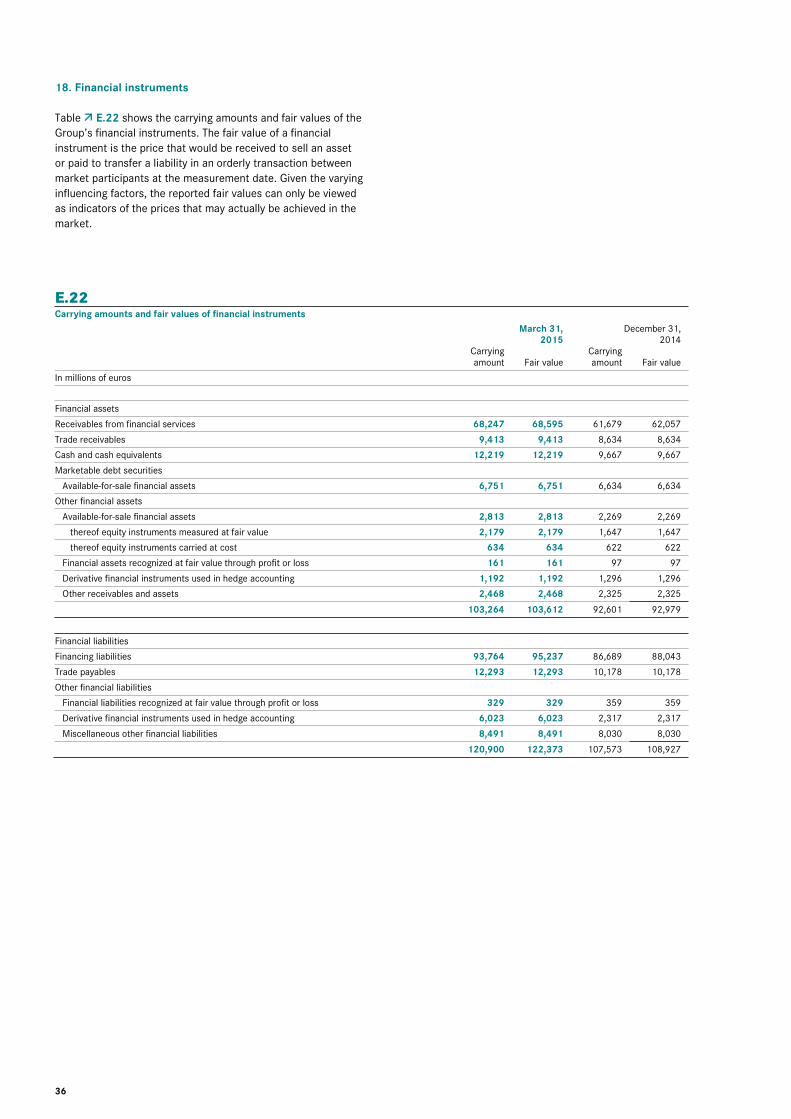
36
18. Financial instruments
Table E.22 shows the carrying amounts and fair values of the Group’s financial instruments. The fair value of a financial instrument is the price that would be received to sell an asset or paid to transfer a liability in an orderly transaction between market participants at the measurement date. Given the varying influencing factors, the reported fair values can only be viewed as indicators of the prices that may actually be achieved in the market.
E.22Carrying amounts and fair values of financial instruments
March 31,
2015 December 31,
2014
Carrying amount Fair value
Carrying amount Fair value
In millions of euros
Financial assets
Receivables from financial services 68,247 68,595 61,679 62,057
Trade receivables 9,413 9,413 8,634 8,634
Cash and cash equivalents 12,219 12,219 9,667 9,667
Marketable debt securities
Available-for-sale financial assets 6,751 6,751 6,634 6,634
Other financial assets
Available-for-sale financial assets 2,813 2,813 2,269 2,269
thereof equity instruments measured at fair value 2,179 2,179 1,647 1,647
thereof equity instruments carried at cost 634 634 622 622
Financial assets recognized at fair value through profit or loss 161 161 97 97
Derivative financial instruments used in hedge accounting 1,192 1,192 1,296 1,296
Other receivables and assets 2,468 2,468 2,325 2,325
103,264 103,612 92,601 92,979
Financial liabilities
Financing liabilities 93,764 95,237 86,689 88,043
Trade payables 12,293 12,293 10,178 10,178
Other financial liabilities
Financial liabilities recognized at fair value through profit or loss 329 329 359 359
Derivative financial instruments used in hedge accounting 6,023 6,023 2,317 2,317
Miscellaneous other financial liabilities 8,491 8,491 8,030 8,030 120,900 122,373 107,573 108,927
E | Interim Consolidated Financial Statements
37
The fair values of financial instruments were calculated on the basis of market information available on the balance sheet date. The following methods and premises were used:
Marketable debt securities and other financial assets. Financial assets available-for-sale include: - debt and equity instruments measured at fair value; these
instruments were measured using quoted market prices at March 31. Otherwise, the fair value measurement of these debt and equity instruments is based on inputs that are either directly or indirectly observable on active markets. Equity instruments measured at fair value predominantly comprise the investments in Nissan Motor Co., Ltd. (Nissan) and Renault SA (Renault).
- equity interests measured at cost; fair values could not be determined for these financial instruments because no stock exchange or market prices are available. These equity inter-ests comprise investments in non-listed companies for which no objective evidence existed at the balance sheet date that these assets were impaired and whose fair values cannot be determined with sufficient reliability. It is assumed that the fair values approximate the carrying amounts. Daimler does not intend to sell the equity interests which are presented as of March 31, 2015.
Financial assets recognized at fair value through profit or loss include derivative financial instruments not used in hedge accounting. These financial instruments as well as derivative financial instruments used in hedge accounting comprise: - derivative currency hedging contracts; the fair values of cross
currency interest rate swaps are determined on the basis of the discounted estimated future cash flows using market interest rates appropriate to the remaining terms of the finan-cial instruments. The valuation of currency forwards is based on market quotes of forward curves; currency options were measured using price quotations or option pricing models using market data.
- derivative interest rate hedging contracts; the fair values of interest rate hedging instruments (e.g. interest rate swaps) are calculated on the basis of the discounted estimated future cash flows using market interest rates appropriate to the remaining terms of the financial instruments.
- derivative commodity hedging contracts; the fair values of commodity hedging contracts (e.g. commodity forwards) are determined on the basis of current reference prices with consideration of forward premiums and discounts.
Other financial liabilities. Financial liabilities recognized at fair value through profit or loss comprise derivative financial instru-ments not used in hedge accounting. For information regarding these financial instruments as well as derivative financial instruments used in hedge accounting, see the notes above under marketable debt securities and other financial assets. At the end of each reporting period, Daimler reviews the necessity for reclassification between the fair value hierarchies. For the determination of the credit risk from derivative financial instruments which are allocated to the Level 2 fair value hierarchy, we apply the exception described in IFRS 13.48 (portfolios managed on the basis of net exposure).
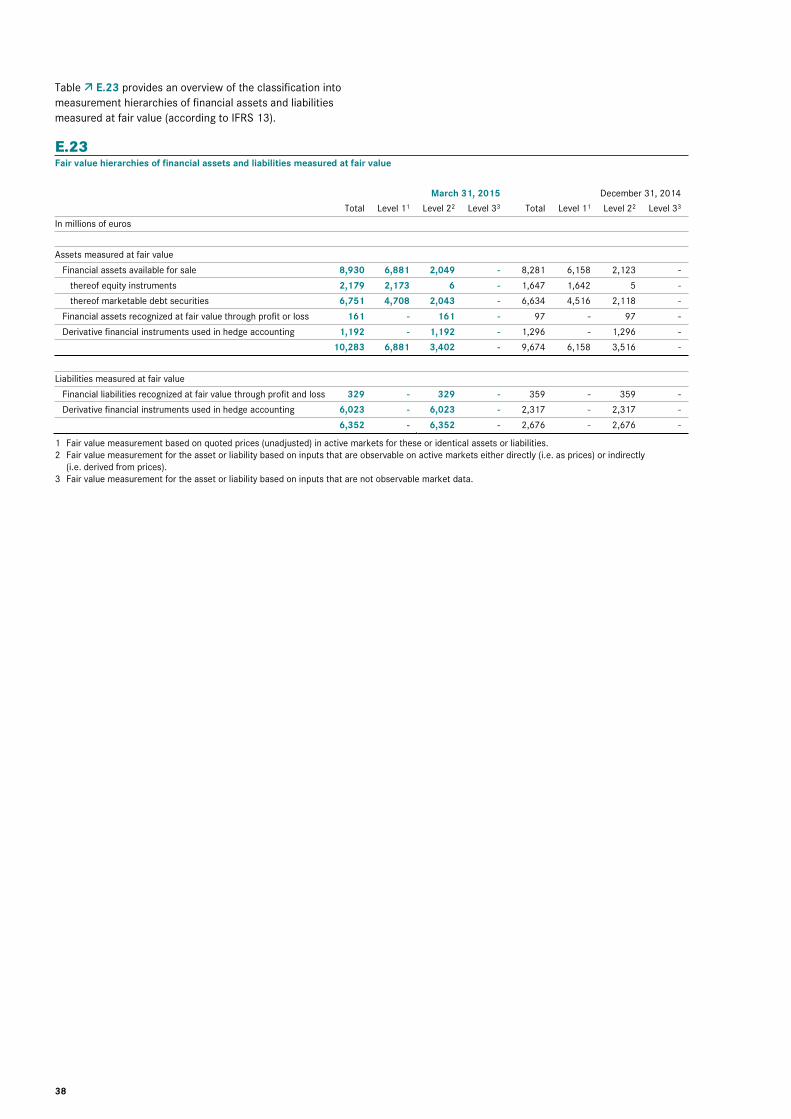
38
Table E.23 provides an overview of the classification into measurement hierarchies of financial assets and liabilities measured at fair value (according to IFRS 13).
E.23
Fair value hierarchies of financial assets and liabilities measured at fair value
March 31, 2015 December 31, 2014
Total Level 11 Level 22 Level 33 Total Level 11 Level 22 Level 33
In millions of euros
Assets measured at fair value
Financial assets available for sale 8,930 6,881 2,049 - 8,281 6,158 2,123 -
thereof equity instruments 2,179 2,173 6 - 1,647 1,642 5 -
thereof marketable debt securities 6,751 4,708 2,043 - 6,634 4,516 2,118 -
Financial assets recognized at fair value through profit or loss 161 - 161 - 97 - 97 -
Derivative financial instruments used in hedge accounting 1,192 - 1,192 - 1,296 - 1,296 -
10,283 6,881 3,402 - 9,674 6,158 3,516 -
Liabilities measured at fair value
Financial liabilities recognized at fair value through profit and loss 329 - 329 - 359 - 359 -
Derivative financial instruments used in hedge accounting 6,023 - 6,023 - 2,317 - 2,317 -
6,352 - 6,352 - 2,676 - 2,676 -
1 Fair value measurement based on quoted prices (unadjusted) in active markets for these or identical assets or liabilities. 2 Fair value measurement for the asset or liability based on inputs that are observable on active markets either directly (i.e. as prices) or indirectly
(i.e. derived from prices). 3 Fair value measurement for the asset or liability based on inputs that are not observable market data.

E | Interim Consolidated Financial Statements
39
19. Segment reporting
Segment information for the three-month periods ended March 31, 2015 and March 31, 2014 is as follows:
E.24Segment reporting
Mercedes-Benz Cars
Daimler Trucks
Mercedes-Benz Vans
DaimlerBuses
DaimlerFinancial Services
Total segments
Recon-ciliation
Daimler Group
In millions of euros
Q1 2015
Revenue 18,818 7,955 2,323 862 4,278 34,236 - 34,236
Intersegment revenue 691 459 92 15 271 1,528 -1,528 -
Total revenue 19,509 8,414 2,415 877 4,549 35,764 -1,528 34,236
Segment profit (EBIT) 1,841 472 215 34 409 2,971 -65 2,906
Thereof share of profit/loss from equity-method investments 115 -5 -2 - -1 107 41 148
Thereof expenses from compounding of provisions and changes in discount rates -58 -34 -11 -5 - -108 -4 -112
In millions of euros Mercedes-Benz Cars
Daimler Trucks
Mercedes-Benz Vans
DaimlerBuses
DaimlerFinancial Services
Total segments
Recon-ciliation
Daimler Group
Q1 2014
Revenue 16,327 6,621 2,123 846 3,540 29,457 - 29,457
Intersegment revenue 677 500 89 13 269 1,548 -1,548 -
Total revenue 17,004 7,121 2,212 859 3,809 31,005 -1,548 29,457
Segment profit (EBIT) 1,183 341 123 53 397 2,097 -310 1,787
Thereof share of profit/loss from equity-method investments 24 -2 1 - -3 20 2 22
Thereof expenses from compounding of provisions and changes in discount rates -43 -16 -5 -1 - -65 -1 -66

40
Reconciliation. Reconciliation of the total segments’ profit (EBIT) to profit before income taxes is as shown in table
E.25. The reconciliation includes corporate items for which head-quarter is responsible. Transactions between the segments are eliminated in the context of consolidation and the eliminated amounts are included in the reconciliation. In the prior year, other corporate items include the expenses from hedging the share price of Tesla of €161 million and from the measurement of the RRPSH put option of €118 million, which are disclosed within other financial expense, net.
E.25Reconciliation to Group figures Q1 2015 Q1 2014
In millions of euros
Total segments’ profit (EBIT) 2,971 2,097
Share of profit from equity-method investments1 41 2
Other corporate items -121 -316
Eliminations 15 4
Group EBIT 2,906 1,787
Amortization of capitalized borrowing costs2 -2 -2
Interest income 51 34
Interest expense -154 -169
Profit before income taxes 2,801 1,650
1 Comprises the Group’s proportionate share in the results of BAIC Motor. 2 Amortization of capitalized borrowing costs is not considered in internal
performance measure “EBIT,” but is included in cost of sales.
20. Related party relationships
Related parties are deemed to be associated companies, joint ventures, joint operations and unconsolidated subsidiaries, as well as persons who exercise a significant influence on the financial and business policy of the Daimler Group. The latter category includes all persons in key positions and their close family members. At the Daimler Group, those persons are the members of the Board of Management and of the Supervisory Board.
Most of the goods and services supplied within the ordinary course of business between the Group and related parties com-prise transactions with associated companies, joint ventures and joint operations, and are shown in table E.26.
Associated companies. A large proportion of the Group’s sales of goods and services with associated companies as well as receivables results from business relations with Beijing Benz Automotive Co., Ltd. (BBAC). See Note 11 for further information on BBAC.
In the first quarter of 2014, significant transactions of goods and services also took place with Rolls-Royce Power Systems AG (RRPS), which is a subsidiary of RRPSH. RRPSH was sold in the third quarter of 2014.
The purchases of goods and services shown in table E.26 were primarily from MBtech Group GmbH & Co. KGaA (MBtech Group). MBtech Group develops, integrates and tests compo-nents, systems, modules and vehicles worldwide.
Joint ventures. Significant sales of goods and services took place with Fujian Benz Automotive Co. Ltd. (FBAC), as well as with Mercedes-Benz Trucks Vostok OOO and Fuso Kamaz Trucks Rus Ltd., joint ventures established with Kamaz OAO, another of the Group’s associated companies.
In 2014, Daimler provided a joint and separate liability guaran-tee to external banks which provided a syndicate loan to the joint venture Shenzen BYD Daimler New Technology Co. Ltd. (SBDNT). The guarantee provided by Daimler amounts to RMB 750 million (approximately €112 million as of March 31, 2015) and equates to the Group’s share in the loan granted to SBDNT based on its 50% equity interest in SBDNT. €64 million of this loan has been utilized as of March 31, 2015.
In connection with its 45% equity interest in Toll Collect GmbH, Daimler has issued guarantees which are not shown in table
E.26 (€100 million at March 31, 2015 and at December 31, 2014).
E | Interim Consolidated Financial Statements
41
Joint operations. Joint operations primarily relate to significant business transactions with Beijing Mercedes-Benz Sales Service Co., Ltd. (BMBS), which provides advisory and other services relating to marketing, sales and distribution in the Chinese market.
E.26
Transactions with related parties
Sales of goods and services and other income
Purchases of goods and services
and other expense Receivables Payables
Q1 2015 Q1 2014 Q1 2015 Q1 2014 March 31,
2015 Dec. 31,
2014 March 31,
2015 Dec. 31,
2014
In millions of euros
Associated companies 656 503 81 70 646 764 58 65
thereof BBAC 611 381 33 8 616 726 33 16
Joint ventures 128 154 20 27 163 195 4 6
Joint operations 3 2 59 45 46 44 19 22

6
Desempeño comercial Expansión continua moderada de la economía mundial La economía mundial parece continuar con la expansión moderada de los meses anteriores durante el primer trimestre de 2015. Aun cuando el dinamismo de la economía de EE. UU., probablemente haya sido más bien débil por motivos climáti-cos, las condiciones fundamentales para el crecimiento sólido continúan intactas. En la Unión Monetaria Europea, menores precios de energía, mayores ingresos reales y la depreciación del euro han tenido un impacto positivo sobre los negocios y la confianza del consumidor en los primeros meses del año. Como resultado, la economía de la zona del euro parece haber continuado su reactivación a pesar de la incertidumbre en relación con Grecia. Sin embargo, los sucesos económicos en algunos mercados emergentes son un tema de interés, sobre todo en Rusia y Brasil, con tendencias recesivas que tienden a empeorar durante el primer trimestre. En China, el debilita-miento del crecimiento económico parece haber continuado, pero probablemente se mantuvo dentro del rango planeado por el gobierno. En vista de las continuas acciones expansivas de la mayoría de los bancos centrales, especialmente en Europa y Japón, los mercados bursátiles obtuvieron ciertas ganancias, en algunos casos, bastante sustanciales. Tal como se esperaba, el euro tendió a ser significativamente más débil durante el primer trimestre. La demanda mundial de automóviles continuó con su expan-sión moderada durante el primer trimestre. Nuevamente, los mercados de China y Estados Unidos fueron los principales impulsores del crecimiento. El crecimiento del mercado en China continuó activo en un nivel cercano al 10%. El mercado de EE. UU., también creció a una tasa sólida de casi el 6%; sin embargo, esto refleja parcialmente el primer semestre bastante débil del año anterior debido al clima en dicho período. Ade-más de China y Estados Unidos, la recuperación continua del mercado de Europa Occidental también contribuyó de forma importante al crecimiento a nivel mundial. La demanda de automóviles en esa región fue 9% mayor que la del período del año anterior. Todos los principales mercados individuales de la región registraron crecimiento significativo, por lo que la ten-dencia positiva de mercado tuvo una base amplia. El desarrollo de la demanda fue menos favorable en Japón, donde ocurrió la corrección esperada del mercado: La fuerte contracción de menos 18% es principalmente el resultado del impuso en la demanda antes del incremento en el impuesto al valor agregado del año anterior. Los mercados automotrices de las principales economías emergentes distintas a China nuevamente se com-portaron de forma desigual. Existió un incremento moderado en la demanda en India. Pero las ventas de automóviles en Rusia descendieron aproximadamente 35% debido a una de-manda muy débil en el segmento de volumen, y el debilitamien-to de la demanda mientras tanto es aparente también en el segmento Premium.
La demanda de camiones de peso medio y pesado continuó muy mezclada a inicios del año. El mercado de Norteamérica continuó siendo fuerte con una sólida expansión de casi el 20% en las Clases 6 a 8. Las tendencias positivas fueron aparentes también en el mercado europeo. En concordancia con la mejo-ra económica, los nuevos registros fueron aproximadamente 10% mayores que durante el primer trimestre del año anterior. La situación fue completamente distinta en Brasil, donde la debilidad económica se vio reflejada en una drástica contrac-ción del mercado de camiones de aproximadamente el 40%. Sin embargo, el mercado japonés de camiones de peso ligero, medio y pesado se comportó positivamente. Las ventas casi alcanzaron el alto nivel del período del año anterior. Sin em-bargo, el mercado de indonesia se comportó mucho mejor de lo que se había esperado. A pesar de las condiciones económicas mucho mejores, el mercado de camiones se contrajo sustan-cialmente en aproximadamente 30% en comparación con el primer trimestre de 2014. El mercado indio para camiones de peso medio y pesado continuó una trayectoria de recuperación desde un nivel bajo. La grave recesión en Rusia se vio reflejada en la demanda de camiones. De acuerdo con estimaciones recientes, el mercado probablemente se contrajo a una tasa de dos dígitos. La caída en la demanda para camiones en China, el mayor mercado mundial, fue de magnitud similar. La principal razón de la obvia debilidad de mercado fue la introducción de las nuevas normas de emisión CN4 (similares a Euro IV). La demanda de camionetas en Europa Occidental continuó creciendo, con un incremento del 10% en volumen de mercado para camionetas de tamaño mediano y grande. La demanda de camionetas pequeñas incrementó 7%. El mercado de EE. UU., para camionetas grandes también continuó su sólida expansión con 17% más. Pero debido a las condiciones económicas des-favorables, el mercado de camionetas grandes en Latinoaméri-ca se contrajo fuertemente. Durante el primer trimestre de 2015, el mercado de autobu-ses en Europa Occidental se expandió en comparación con el débil período del año anterior en 15%. Como resultado de la difícil situación económica, el mercado de Brasil continúo signi-ficativamente por debajo de su nivel del año anterior con una disminución de aproximadamente 20%. Ventas de unidades durante el primer trimestre significati-vamente mayores al nivel del año anterior Durante el primer trimestre de 2015, Daimler vendió 641,600 automóviles y vehículos comerciales a nivel mundial, lo que es 13% más que durante el mismo período del año anterior. Las ventas de unidades durante el primer trimestre, por parte de Mercedes-Benz Automóviles incrementaron 18% hasta 459,700 vehículos, el mayor número durante un primer trimes-tre hasta ahora. En Europa Occidental (excluyendo a Alemania),
Informe Provisional de la Administración. Ventas de unidades significativamente por encima del nivel del año anterior en 641,600 unidades Ingresos aumentaron 16% hasta €34,200 millones EBIT del Grupo por €2,906 millones (T1 2014: €1,787 millones) Utilidad neta por €2,050 millones (T1 2014: €1,086 millones) Flujo de efectivo libre por operaciones industriales por €2,300 millones (T1 2014: €700 millones) Crecimiento significativo en ventas de unidades e ingresos previstos para el año 2015 completo Se espera que el EBIT del Grupo por negocios en curso se significativamente mayor que en 2014
C | Informe Provisional de la Administración
7
la división logró un nuevo récord de 111,000 unidades, ven-diendo 19% más vehículos que durante el año anterior. El principal impulsor del crecimiento en esta región fue el Reino Unido (+17%). En Alemania, el mercado doméstico, vendimos 65,400 vehículos de las marcas Mercedes-Benz y smart (T1 2014: 59,100). Mercedes-Benz Automóviles estableció un récord también en Estados Unidos, vendiendo 87,700 unidades (+14%). En China, continuamos nuestra exitosa trayectoria e incrementamos nuestras ventas de unidades hasta un nuevo récord de 87,400 vehículos (+24%). Las ventas de unidades de Mercedes-Benz Automóviles se comportaron de forma muy positiva también en Japón (+23%) y Corea del Sur (+20%) duran-te el primer trimestre. Las ventas de unidades por parte de Daimler Camiones incre-mentaron 4% hasta 112,400 vehículos durante el primer trimes-tre de 2015. Este crecimiento en ventas estuvo principalmente impulsado por el comportamiento en Norteamérica, donde nuestras ventas de unidades de 40,800 vehículos fueron signi-ficativamente superiores en 18% a las del período del año ante-rior. Sin embargo, las ventas de 11,500 unidades en Europa Occidental fueron levemente menores que la cifra del año anterior (-2%). En Latinoamérica, nuestras ventas de 7,200 unidades fueron significativamente menores que durante el primer trimestre del año anterior (-29%). La persistencia de condiciones económicas difíciles tuvo un claro impacto sobre la demanda de camiones. Debido particularmente a la fuerte disminución de los camiones vendidos en Indonesia, las ventas generales en Asia de 37,300 unidades fueron significativamente menores que durante el período del año anterior (-8%). La cifra de 12,300 camiones vendidos en Japón fue 8% inferior que durante el primer trimestre de 2014. Sin embargo, las ventas de unidades en India incrementaron significativamente. Mercedes-Benz Vans incrementó sus ventas de unidades de primer trimestre en 4% hasta 63,800 vehículos. En su región principal de Europa Occidental, la división alcanzó un crecimiento significativo adicional de 7% en ventas hasta 41,700 unidades durante el primer trimestre, con un sólido crecimiento en Alemania (+15%). El crecimiento continuó también en Europa Oriental con un aumento del 16%; debido al incremento sustancial en Turquía (+24%), las ventas de unidades en esta región aumentaron de 6,000 a 7,000 vehículos. El comportamiento de las ventas de unidades en la región del TLCAN nuevamente fue positive durante el primer trimestre, con un crecimiento particularmente sólido del 24% hasta 6,200 unidades en Estados Unidos. En Latinoamérica, las ventas de 3,700 unidades se encontraron al nivel del trimestre del año anterior. Las ventas en China disminuyeron significativamente a 900 unidades (T1 2014: 2,700), principalmente debido al futuro cambio de modelo para camionetas de tamaño mediano en ese mercado. Las ventas de Daimler Autobuses de 5,700 autobuses y chasis de autobuses durante el primer trimestre fueron significativamente menores al inusual alto nivel del año anterior de 6,700 unidades. La disminución se debe primordialmente al negocio más débil de chasis de autobuses en Latinoamérica, misma que no fue compensada por el constante buen comportamiento de la demanda para nuestros autobuses completos en Europa Occidental y Turquía. En Europa Occidental, vendimos 1,200 unidades, representando un incremento del 15% en comparación con el período del año anterior. En Latinoamérica (excepto México), las ventas de
2,900 unidades fueron significativamente menores que durante el período del año anterior (T1 2014: 4,000). En Daimler Servicios Financieros, los nuevos negocios cre-cieron 34% en comparación con el primer trimestre del año anterior hasta €13,200 millones. El volumen de contratos fue por un importe de €108,700 millones a fines del período de informe provisional, que es 10% mayor que a fines de 2014. Ajustado en relación con efectos del tipo de cambio, existió un incremento del 3%. El negocio de seguros continuó su compor-tamiento muy positivo. Los ingresos del Grupo durante el primer trimestre fueron por un importe de €34,200 millones, lo que es 16% superior que durante el primer trimestre del año anterior. Ajustados en relación con efectos del tipo de cambio, los ingresos crecieron 9%. Mercedes-Benz Automóviles alcanzó ingresos por €19,500 millones, lo cual es 15% mayor que durante el primer trimestre del año anterior. Los ingresos en Daimler Camiones crecieron 18% principalmente debido al comportamiento muy positive del negocio en la región del TLCAN, y alcanzaron €8,400 millones. Mercedes-Benz Vans incrementó sus ingresos 9% hasta €2,400 millones y los ingresos de Daimler Autobuses por €900 millones fueron ligeramente superiores que el nivel durante el período del año anterior. C.01 Ventas de unidades por división
T1 2015 T1 2014 Cambio %
Grupo Daimler 641,614 565,799 +13
Mercedes-Benz Automóviles 459,708 389,476 +18
Daimler Camiones 112,424 108,529 +4
Mercedes-Benz Vans 63,805 61,119 +4
Daimler Autobuses 5,677 6,675 -15
C.02 Ingresos por división
En millones de euros T1 2015 T1 2014 Cambio %
Grupo Daimler 34,236 29,457 +16
Mercedes-Benz Automóviles 19,509 17,004 +15
Daimler Camiones 8,414 7,121 +18
Mercedes-Benz Vans 2,415 2,212 +9
Daimler Autobuses 877 859 +2
Daimler Servicios Financieros 4,549 3,809 +19

8
Rentabilidad
El Grupo Daimler alcanzó una EBIT durante el primer
trimestre de €2,906 millones, que es significativamente
superior a las cifras del período del año anterior (T1 2014:
€1,787 millones). C.03
Mercedes-Benz Automóviles principalmente contribuyó al
incremento en utilidades. El comportamiento de las utili-
dades de la división fue principalmente el resultado de un
crecimiento adicional en ventas unidades en todas las
regiones. Las utilidades incrementaron significativamente
también en Daimler Camiones y Mercedes-Benz Vans.
Debido a las condiciones de mercado, Daimler Autobuses
no igualó sus altas utilidades del período del año anterior.
Las utilidades de Daimler Servicios Financieros incremen-
taron principalmente debido al mayor volumen de contra-
tos. Los cambios en los tipos de cambio tuvieron un
impacto positivo sobre las utilidades operativas.
C.03 EBIT por segmento
En millones de euros T1 2015 T1 2014 cambio %
Mercedes-Benz Automóvi-les
1,841 1,183 +56
Daimler Camiones 472 341 +38
Mercedes-Benz Vans 215 123 +75
Daimler Autobuses 34 53 -36
Daimler Servicios Finan-cieros
409 397 +3
Conciliación -65 -310 .
Grupo Daimler 2,906 1,787 +63
C.04 Partidas especiales que afectan la EBIT
En millones de euros T1 2015 T1 2014
Mercedes-Benz Automóviles
Reestructuración de organización de ventas en Alemania -20 -
Reubicación de oficinas centrales de MBUSA -20 -
Venta de inmuebles en Estados Unidos +87 -
Daimler Camiones
Ajustes en la fuerza laboral -5 -5
Venta de Atlantis Foundries -55 -
Reestructuración de organización de ventas en Alemania -4 -
Mercedes-Benz Vans
Reestructuración de organización de ventas en Alemania -4 -
Reubicación de oficinas centrales de MBUSA -2 -
Daimler Autobuses
Reposicionamiento del Negocio - -1
Reestructuración de organización de ventas en Alemania -1 -
Conciliación
Valuación de opción de venta para RRPSH - -118
Cobertura de precio acción Tesla - -161
Adicionalmente, las partidas especiales que se muestran
en la tabla C.04 afectaron la EBIT durante el primer
trimestre de 2015 y 2014. Las utilidades durante el pri-
mer trimestre de 2014 se vieron afectadas por gastos
relacionados con la cobertura del precio de la acción de
Tesla Motors Inc., Tesla) y la revaluación de la opción de
venta sobre acciones en Rolls-Royce Power Systems
Holding GmbH (RRPSH).
La EBIT durante el primer trimestre en la división Merce-
des-Benz Automóviles de €1,841 millones fue significa-
tivamente mayor que la cifra para el período del año ante-
rior de €1,183 millones. El retorno sobre ventas de la
división fue del 9.4% (T1 2014: 7.0%). C.03
El comportamiento de las utilidades principalmente refleja
el crecimiento en ventas unidades en todas las regiones.
La nueva Clase-C y el mayor rango de automóviles com-
pactos contribuyeron fuertemente. Mercedes-Benz Au-
tomóviles logró también un crecimiento en utilidades
como resultado de una mejor fijación de precios. Adicio-
nalmente, las acciones de eficiencia tuvieron un impacto
positivo en la EBIT. Sin embargo, el comportamiento de
las utilidades mostró una cambiada estructura regional de
ventas unidades, debido por ejemplo a la mayor propor-
ción de automóviles producidos localmente en China.
Además, las utilidades se vieron afectadas por gastos
para mejorar el atractivo de productos, expansión de
capacidad, gastos anticipados para nuevas tecnologías y
vehículos y cambios en los tipos de cambio. Adicional-
mente, los efectos de la reubicación de las oficinas cen-
trales de Mercedes-Benz USA, LLC y de la venta de in-
muebles en Estados Unidos se incluyen en la EBIT.
Todas las divisiones automotrices también se vieron
afectadas por la reestructuración de la propia organiza-
ción de ventas del Grupo den Alemania. En este sentido,
nos referimos a la información en la Nota 4 de las Notas a
los Estados Financieros Consolidados.
La EBIT de Daimler Camiones de €472 millones fue
significativamente superior que durante el período del año
anterior (T1 2014: €341 millones). El retorno sobre ventas
de la división fue del 5.6% (T1 2014: 4.8%). C.03
Existieron efectos positivos en el comportamiento de las
utilidades especialmente por mayores ventas unidades en
la región del TLCAN y los tipos de cambio foráneos. La
realización de eficiencias adicionales y la liquidación de
un plan de cuidados de salud en Estados Unidos también
tuvieron un impacto positivo sobre las utilidades. Los
efectos negativos sobre utilidades que informó Daimler
Camiones fueron principalmente el resultado de las me-
nores ventas unidades en Latinoamérica e Indonesia,
mayores costos de garantías y gastos para la expansión
de capacidad. Adicionalmente, existieron gastos por la
valuación a valor razonable de Atlantis Foundries (Pty.)
Ltd., cuya venta se decidió a fines de febrero. La EBIT
también fue reducida por acciones en la fuerza laboral en
el contexto de los programas de optimización en curso en
Brasil.
Mercedes-Benz Vans alcanzó una EBIT significativa-

C | Informe Provisional de la Administración
9
mente mayor por €215 millones durante el primer trimes-
tre de 2015 (T1 2014: €123 millones). El retorno sobre
ventas de la división incrementó a.9% desde 5.6% en el
período del año anterior. C.03
Durante el primer trimestre, las ventas unidades, los in-
gresos y utilidades se vieron influenciados por una mez-
cla de producto muy positiva. Esto también fue impulsa-
do por el buen comportamiento de la demanda en Euro-
pa y en la región del TLCAN, así como por una mejor
eficiencia. Existieron efectos negativos en el comporta-
miento de las utilidades por variaciones en los tipos de
cambio.
La EBIT de Daimler Autobuses durante el primer trimes-
tre fue por de €34 millones, pero se debió a condiciones
de mercado por debajo del muy alto nivel del año anterior
de €53 millones. El retorno sobre ventas de la división fue
del 3.9% T1 2014: 6.2%). C.03
Las utilidades se redujeron significativamente por la si-
tuación económica en Brasil y la resultante disminución
en la demanda de chasis de autobús. La alta demanda
de automóviles completes, una mezcla positive de pro-
ducto en Europa Occidental y efectos positivos del tipo de
cambio parcialmente compensaron las menores ventas
unidades en Latinoamérica.
Durante el primer trimestre de 2015, la división Daimler
Servicios Financieros alcanzó utilidades por €409 millo-
nes y sobrepasó por lo tanto la cifra del año anterior (T1
2014: €397 millones). C.03
Esto primordialmente fue el resultado de un sólido creci-
miento en el volumen de contratos en todas las regiones,
así como efectos positivos en el tipo de cambio. Existie-
ron efectos opuestos por gastos para la expansión de
actividades comerciales.
La conciliación de la EBIT de las divisiones con la EBIT
del Grupo incluye utilidades y/o pérdidas a nivel corpora-
tivo y los efectos sobre utilidades por la eliminación de
transacciones internas del grupo entre divisiones.
Otras partidas a nivel corporativo resultaron en un gasto
de €80 millones (T1 2014: €314 millones). El primer tri-
mestre de 2014
incluyó un gasto por €161 millones por la cobertura del
precio de acciones de Tesla y un gasto por €118 millones
por el ejercicio de la opción de venta sobre las acciones
en RRPSH.
La eliminación de transacciones intergrupales resultó en
un ingreso de €15 millones durante el primer trimestre de
2015 (T1 2014: €4 millones).
El gasto neto por intereses fue por €103 millones (T1
2014: €135 millones). Los gastos relacionados con obli-
gaciones de pensiones y prestaciones de salud fueron
ligeramente menores a los del nivel del año anterior. El
resultado de otros intereses mejoró debido particularmen-
te al vencimiento sucesivo de refinanciamiento a tasas
altas de interés.
El gasto por €751 millones registrado en gasto por im-
puesto sobre la renta incrementó solo €187 millones en
comparación con el primer trimestre del año anterior a
pesar de un incremento sustancial en la utilidad antes del
impuesto sobre la renta. Esto refleja principalmente los
beneficios fiscales aplicables durante el año 2015 en
relación con la determinación del impuesto en años ante-
riores.
La utilidad neta para el primer trimestre de 2015 es por
un importe de €2,050 millones (T1 2014: €1,086 millo-
nes). La utilidad neta por €87 millones es atribuible a
participaciones minoritarias (T1 2014: €59 millones).
La utilidad neta atribuible a los accionistas de Daimler
AG es de €1,963 millones T1 2014: €1,027 millones),
representando utilidades por acción por €1.83 (T1 2014:
€0.96). El cálculo de utilidades por acción básica) se basa
en un número promedio de acciones en circulación de
1,069.8 millones (T1 2014: 1,069.8 millones).
Flujos de efectivo
El efectivo resultante de actividades operativas
C.05 incrementó €200 millones hasta €1,900 millones.
Este incremento se debe principalmente al mayor nivel de
utilidades antes de impuestos (más €1,200 millones).
Existió un efecto opuesto por el renovado incremento en
nuevos negocios de arrendamiento y financiamiento de
ventas resultantes de la implementación de nuestra estra-
tegia de crecimiento, que fue €1,800 millones superior al
alto nivel del período del año anterior. Además, existió un
mayor incremento en el capital de trabajo que durante el
primer trimestre del año anterior. Resultaron efectos
positivos del comportamiento de otros activos y pasivos
operativos, el cual se vio afectado por la expansión del
negocio y especialmente debido a mayores gastos para
bonos a distribuidores, entradas de efectivo por ventas
con contratos de servicio y mantenimiento y ventas con
garantías de valor residual. También existió un impacto
por las entradas de efectivo en relación con el impuesto al
valor agregado. Adicionalmente, existieron mayores
devoluciones de impuestos durante el primer trimestre de
2015 en relación con la determinación final del impuesto
de años anteriores.
El efectivo utilizado para actividades de inversión
C.05 fue €1,500 millones (T1 2014: €800 millones). El
cambio en comparación con el período del año anterior
resultó primordialmente de adquisiciones y ventas de
valores en el contexto de la administración de la liquidez.
Estas transacciones resultaron en una baja salida de
efectivo en el período de informe, mientras que las ventas
de valores excedieron de forma significativa las adquisi-
ciones durante el trimestre del año anterior.
El efectivo resultante de / utilizado para actividades
de financiamiento C.05 resultó en una entrada de
efectivo de €1,500 millones T1 2014: salida de efectivo de
€38 millones). El cambio resultó casi exclusivamente del
incremento en los pasivos por financiamiento (netos).
El efectivo y equivalentes de efectivo incrementaron en
comparación con el 31 de diciembre de 2014 en €2,600
millones, después de considerar la conversión de divisas.
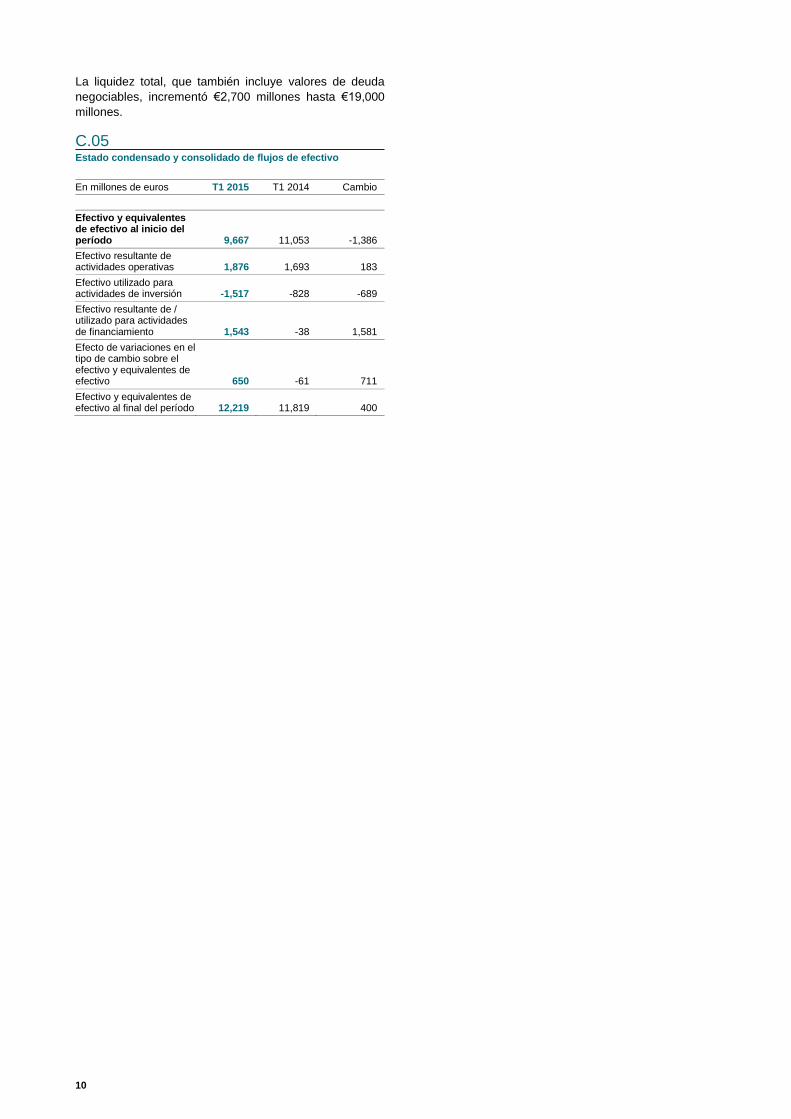
10
La liquidez total, que también incluye valores de deuda
negociables, incrementó €2,700 millones hasta €19,000
millones.
C.05 Estado condensado y consolidado de flujos de efectivo
En millones de euros T1 2015 T1 2014 Cambio
Efectivo y equivalentes de efectivo al inicio del período 9,667 11,053 -1,386
Efectivo resultante de actividades operativas 1,876 1,693 183
Efectivo utilizado para actividades de inversión -1,517 -828 -689
Efectivo resultante de / utilizado para actividades de financiamiento 1,543 -38 1,581
Efecto de variaciones en el tipo de cambio sobre el efectivo y equivalentes de efectivo 650 -61 711
Efectivo y equivalentes de efectivo al final del período 12,219 11,819 400
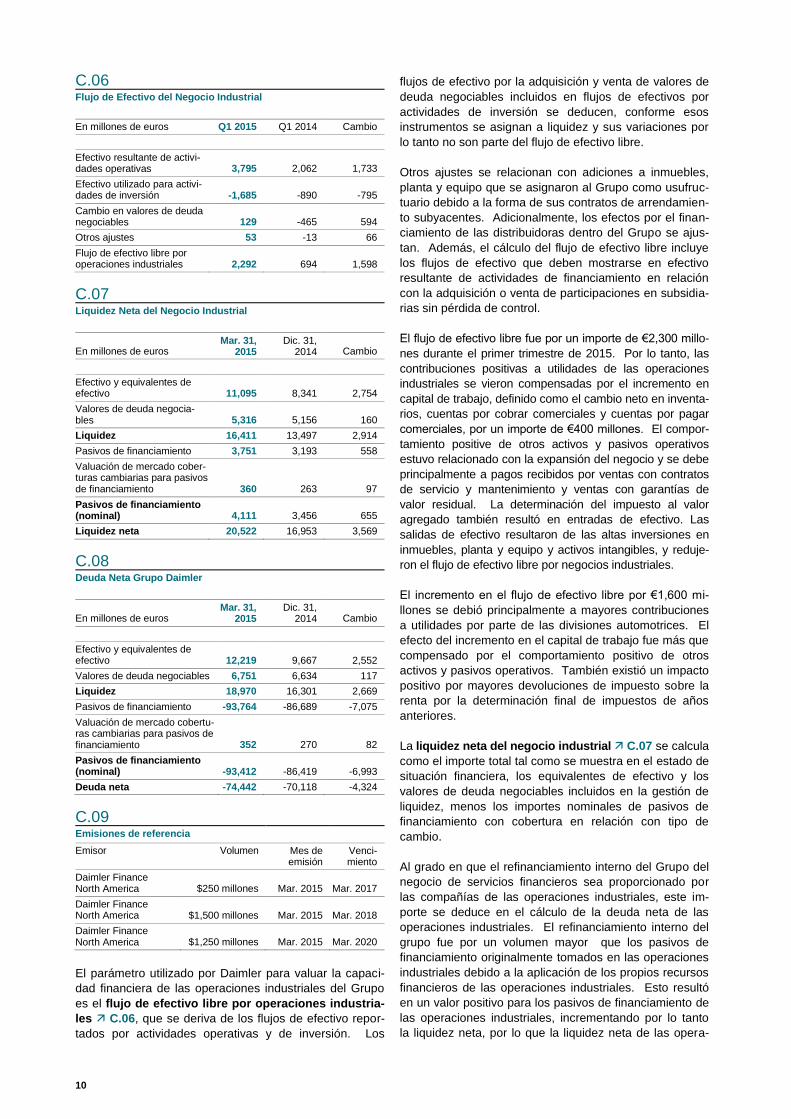
10
C.06 Flujo de Efectivo del Negocio Industrial
En millones de euros Q1 2015 Q1 2014 Cambio
Efectivo resultante de activi-dades operativas 3,795 2,062 1,733
Efectivo utilizado para activi-dades de inversión -1,685 -890 -795
Cambio en valores de deuda negociables 129 -465 594
Otros ajustes 53 -13 66
Flujo de efectivo libre por operaciones industriales 2,292 694 1,598
C.07 Liquidez Neta del Negocio Industrial
En millones de euros Mar. 31,
2015 Dic. 31,
2014 Cambio
Efectivo y equivalentes de efectivo 11,095 8,341 2,754
Valores de deuda negocia-bles 5,316 5,156 160
Liquidez 16,411 13,497 2,914
Pasivos de financiamiento 3,751 3,193 558
Valuación de mercado cober-turas cambiarias para pasivos de financiamiento 360 263 97
Pasivos de financiamiento (nominal) 4,111 3,456 655
Liquidez neta 20,522 16,953 3,569
C.08 Deuda Neta Grupo Daimler
En millones de euros Mar. 31,
2015 Dic. 31,
2014 Cambio
Efectivo y equivalentes de efectivo 12,219 9,667 2,552
Valores de deuda negociables 6,751 6,634 117
Liquidez 18,970 16,301 2,669
Pasivos de financiamiento -93,764 -86,689 -7,075
Valuación de mercado cobertu-ras cambiarias para pasivos de financiamiento 352 270 82
Pasivos de financiamiento (nominal) -93,412 -86,419 -6,993
Deuda neta -74,442 -70,118 -4,324
C.09 Emisiones de referencia
Emisor Volumen Mes de emisión
Venci-miento
Daimler Finance North America $250 millones Mar. 2015 Mar. 2017
Daimler Finance North America $1,500 millones Mar. 2015 Mar. 2018
Daimler Finance North America $1,250 millones Mar. 2015 Mar. 2020
El parámetro utilizado por Daimler para valuar la capaci-
dad financiera de las operaciones industriales del Grupo
es el flujo de efectivo libre por operaciones industria-
les C.06, que se deriva de los flujos de efectivo repor-
tados por actividades operativas y de inversión. Los
flujos de efectivo por la adquisición y venta de valores de
deuda negociables incluidos en flujos de efectivos por
actividades de inversión se deducen, conforme esos
instrumentos se asignan a liquidez y sus variaciones por
lo tanto no son parte del flujo de efectivo libre.
Otros ajustes se relacionan con adiciones a inmuebles,
planta y equipo que se asignaron al Grupo como usufruc-
tuario debido a la forma de sus contratos de arrendamien-
to subyacentes. Adicionalmente, los efectos por el finan-
ciamiento de las distribuidoras dentro del Grupo se ajus-
tan. Además, el cálculo del flujo de efectivo libre incluye
los flujos de efectivo que deben mostrarse en efectivo
resultante de actividades de financiamiento en relación
con la adquisición o venta de participaciones en subsidia-
rias sin pérdida de control.
El flujo de efectivo libre fue por un importe de €2,300 millo-
nes durante el primer trimestre de 2015. Por lo tanto, las
contribuciones positivas a utilidades de las operaciones
industriales se vieron compensadas por el incremento en
capital de trabajo, definido como el cambio neto en inventa-
rios, cuentas por cobrar comerciales y cuentas por pagar
comerciales, por un importe de €400 millones. El compor-
tamiento positive de otros activos y pasivos operativos
estuvo relacionado con la expansión del negocio y se debe
principalmente a pagos recibidos por ventas con contratos
de servicio y mantenimiento y ventas con garantías de
valor residual. La determinación del impuesto al valor
agregado también resultó en entradas de efectivo. Las
salidas de efectivo resultaron de las altas inversiones en
inmuebles, planta y equipo y activos intangibles, y reduje-
ron el flujo de efectivo libre por negocios industriales.
El incremento en el flujo de efectivo libre por €1,600 mi-
llones se debió principalmente a mayores contribuciones
a utilidades por parte de las divisiones automotrices. El
efecto del incremento en el capital de trabajo fue más que
compensado por el comportamiento positivo de otros
activos y pasivos operativos. También existió un impacto
positivo por mayores devoluciones de impuesto sobre la
renta por la determinación final de impuestos de años
anteriores.
La liquidez neta del negocio industrial C.07 se calcula
como el importe total tal como se muestra en el estado de
situación financiera, los equivalentes de efectivo y los
valores de deuda negociables incluidos en la gestión de
liquidez, menos los importes nominales de pasivos de
financiamiento con cobertura en relación con tipo de
cambio.
Al grado en que el refinanciamiento interno del Grupo del
negocio de servicios financieros sea proporcionado por
las compañías de las operaciones industriales, este im-
porte se deduce en el cálculo de la deuda neta de las
operaciones industriales. El refinanciamiento interno del
grupo fue por un volumen mayor que los pasivos de
financiamiento originalmente tomados en las operaciones
industriales debido a la aplicación de los propios recursos
financieros de las operaciones industriales. Esto resultó
en un valor positivo para los pasivos de financiamiento de
las operaciones industriales, incrementando por lo tanto
la liquidez neta, por lo que la liquidez neta de las opera-
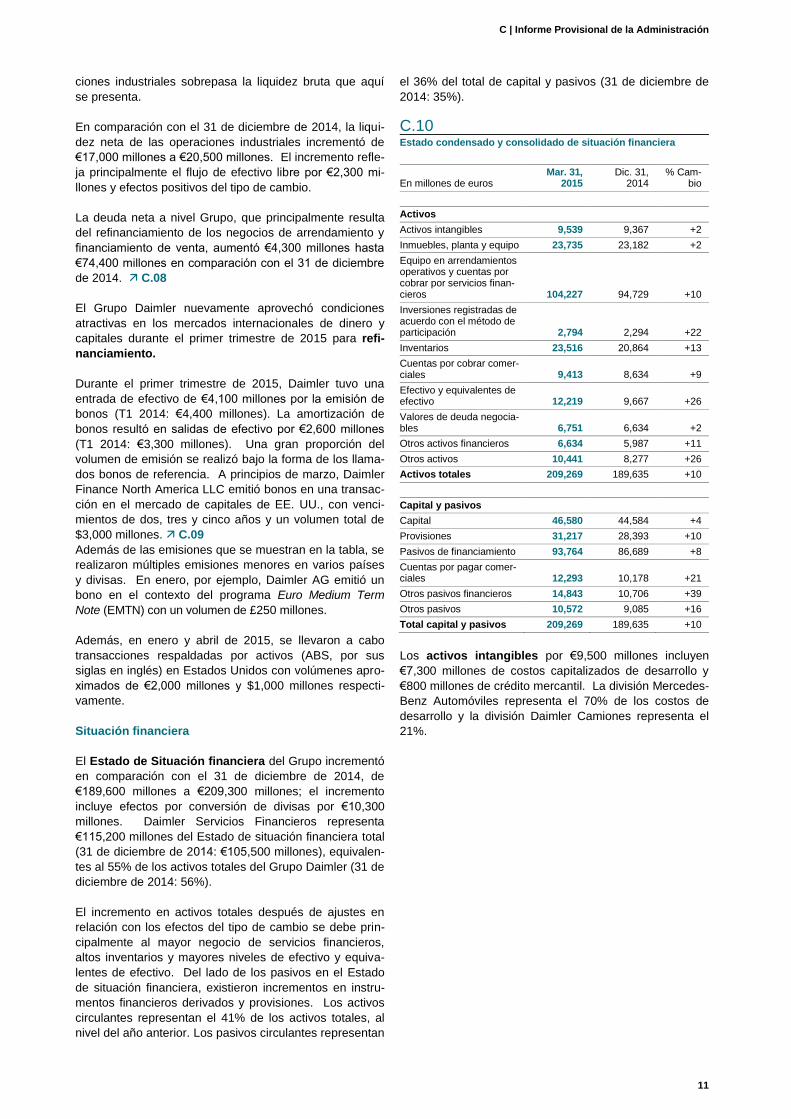
C | Informe Provisional de la Administración
11
ciones industriales sobrepasa la liquidez bruta que aquí
se presenta.
En comparación con el 31 de diciembre de 2014, la liqui-
dez neta de las operaciones industriales incrementó de
€17,000 millones a €20,500 millones. El incremento refle-
ja principalmente el flujo de efectivo libre por €2,300 mi-
llones y efectos positivos del tipo de cambio.
La deuda neta a nivel Grupo, que principalmente resulta
del refinanciamiento de los negocios de arrendamiento y
financiamiento de venta, aumentó €4,300 millones hasta
€74,400 millones en comparación con el 31 de diciembre
de 2014. C.08
El Grupo Daimler nuevamente aprovechó condiciones
atractivas en los mercados internacionales de dinero y
capitales durante el primer trimestre de 2015 para refi-
nanciamiento.
Durante el primer trimestre de 2015, Daimler tuvo una
entrada de efectivo de €4,100 millones por la emisión de
bonos (T1 2014: €4,400 millones). La amortización de
bonos resultó en salidas de efectivo por €2,600 millones
(T1 2014: €3,300 millones). Una gran proporción del
volumen de emisión se realizó bajo la forma de los llama-
dos bonos de referencia. A principios de marzo, Daimler
Finance North America LLC emitió bonos en una transac-
ción en el mercado de capitales de EE. UU., con venci-
mientos de dos, tres y cinco años y un volumen total de
$3,000 millones. C.09
Además de las emisiones que se muestran en la tabla, se
realizaron múltiples emisiones menores en varios países
y divisas. En enero, por ejemplo, Daimler AG emitió un
bono en el contexto del programa Euro Medium Term
Note (EMTN) con un volumen de £250 millones.
Además, en enero y abril de 2015, se llevaron a cabo
transacciones respaldadas por activos (ABS, por sus
siglas en inglés) en Estados Unidos con volúmenes apro-
ximados de €2,000 millones y $1,000 millones respecti-
vamente.
Situación financiera
El Estado de Situación financiera del Grupo incrementó
en comparación con el 31 de diciembre de 2014, de
€189,600 millones a €209,300 millones; el incremento
incluye efectos por conversión de divisas por €10,300
millones. Daimler Servicios Financieros representa
€115,200 millones del Estado de situación financiera total
(31 de diciembre de 2014: €105,500 millones), equivalen-
tes al 55% de los activos totales del Grupo Daimler (31 de
diciembre de 2014: 56%).
El incremento en activos totales después de ajustes en
relación con los efectos del tipo de cambio se debe prin-
cipalmente al mayor negocio de servicios financieros,
altos inventarios y mayores niveles de efectivo y equiva-
lentes de efectivo. Del lado de los pasivos en el Estado
de situación financiera, existieron incrementos en instru-
mentos financieros derivados y provisiones. Los activos
circulantes representan el 41% de los activos totales, al
nivel del año anterior. Los pasivos circulantes representan
el 36% del total de capital y pasivos (31 de diciembre de
2014: 35%).
C.10 Estado condensado y consolidado de situación financiera
En millones de euros Mar. 31,
2015 Dic. 31,
2014 % Cam-
bio
Activos
Activos intangibles 9,539 9,367 +2
Inmuebles, planta y equipo 23,735 23,182 +2
Equipo en arrendamientos operativos y cuentas por cobrar por servicios finan-cieros 104,227 94,729 +10
Inversiones registradas de acuerdo con el método de participación 2,794 2,294 +22
Inventarios 23,516 20,864 +13
Cuentas por cobrar comer-ciales 9,413 8,634 +9
Efectivo y equivalentes de efectivo 12,219 9,667 +26
Valores de deuda negocia-bles 6,751 6,634 +2
Otros activos financieros 6,634 5,987 +11
Otros activos 10,441 8,277 +26
Activos totales 209,269 189,635 +10
Capital y pasivos
Capital 46,580 44,584 +4
Provisiones 31,217 28,393 +10
Pasivos de financiamiento 93,764 86,689 +8
Cuentas por pagar comer-ciales 12,293 10,178 +21
Otros pasivos financieros 14,843 10,706 +39
Otros pasivos 10,572 9,085 +16
Total capital y pasivos 209,269 189,635 +10
Los activos intangibles por €9,500 millones incluyen
€7,300 millones de costos capitalizados de desarrollo y
€800 millones de crédito mercantil. La división Mercedes-
Benz Automóviles representa el 70% de los costos de
desarrollo y la división Daimler Camiones representa el
21%.

12
Los inmuebles, planta y equipo incrementaron a
€23,700 millones (31 de diciembre de 2014: €23,200
millones). Durante el primer trimestre de 2015, se invirtie-
ron en total €1,000 millones para nuevos productos y
tecnologías, la expansión de capacidades productivas y
modernización, principalmente en nuestros sitios de pro-
ducción y ensamble. Los sitios en Alemania representa-
ron inversiones en inmuebles, planta y equipo por €800
millones (T1 2014: €0,800 millones). La mayoría del
incremento en inmuebles, planta y equipo fue causado
por los efectos de la conversión de divisas.
El equipo en arrendamientos operativos y las cuentas
por cobrar por servicios financieros incrementaron a
€104,200 millones (31 de diciembre de 2014: €94,700
millones). €6,700 millones del incremento son el resultado
de la conversión de divisas. El incremento es el resultado
de conversión de divisas. El incremento después de
ajuste por efectos de tipo de cambio refleja el nuevo ne-
gocio aumentado en Daimler Servicios Financieros, espe-
cialmente en Estados Unidos y China. La proporción de
estos activos en relación con los activos totales del 50%
se encuentra al nivel de fines del año 2014.
Las inversiones registradas con el método de partici-
pación por €2,800 millones (31 de diciembre de 2014:
€2,300 millones) incluyen principalmente los valores en
libros de nuestras participaciones de capital en Beijing
Benz Automotive Co., Ltd. (BBAC) y BAIC Motor Corpora-
tion Ltd., en el área de automóviles, y en Beijing Foton
Daimler Automotive Co., Ltd. y Kamaz OAO en el negocio
de camiones. El incremento refleja los efectos de la con-
versión de divisas así como las utilidades positivas de las
inversiones, en particular de BBAC.
Los inventarios incrementaron de €20,900 millones a
€23,500 millones, equivalente a 11% de los activos tota-
les, a fines del año 2014. Además de los efectos por el
tipo de cambio por €1,100 millones, el incremento refleja
el crecimiento continuo y la continuación de la ofensiva de
modelos. Esto conllevó a mayores inventarios de nuevos
vehículos, especialmente en la división Mercedes-Benz
Automóviles.
Las cuentas por cobrar comerciales incrementaron
€800 millones hasta €9,400 millones. La división Merce-
des-Benz Automóviles representa 46% de estas cuentas
por cobrar y la división Daimler Camiones representa el
33%.
El efectivo y los equivalentes de efectivo incrementaron
en comparación con los de fines del año 2014 en €2,600
millones hasta €12,200 millones. Ajustado en relación con
efectos del tipo de cambio, el incremento fue por un impor-
te de €1,900 millones.
Los valores de deuda negociables incrementaron en
comparación con el 31 de diciembre de 2014 de €6,600
millones hasta €6,800 millones. Estos activos incluyen los
instrumentos de deuda que están asignados a liquidez, la
mayoría de los cuales se negocian públicamente. Estos
generalmente solo tienen una clasificación externa de A o
mejor.
Otros activos financieros incrementaron en €600 millo-
nes hasta €6,600 millones. Estos incluyen principalmente
inversiones – en Renault y Nissan por ejemplo – e ins-
trumentos financieros derivados, así como préstamos y
otras cuentas por cobrar pagaderas por terceros. El cam-
bio refleja el comportamiento positivo de instrumentos de
capital que cotizan en bolsa.
Otros activos por €10,400 millones (31 de diciembre de
2014: €8,300 millones) incluyen principalmente activos
por impuestos diferidos y solicitudes de devoluciones de
impuestos. El incremento en activos por impuestos dife-
ridos se relaciona principalmente con efectos distintos a
utilidades de instrumentos financieros derivados así como
de pensiones y obligaciones similares.
El capital del Grupo incrementó en comparación con el
31 de diciembre de 2014 de €44,600 millones a €46,600
millones. El capital atribuible a los accionistas de Daimler
AG aumentó a €45,500 millones (31 de diciembre de
2014: €43,700 millones). El incremento es primordialmen-
te un reflejo de la conversión de divisas (más €2,700
millones) y de la valuación de inversiones en Renault y
Nissan (más €500 millones). La utilidad neta de €2,100
millones fue compensada por la revaluación de instru-
mentos financieros derivados (menos €2,700 millones).
Además, las pérdidas actuariales por planes de pensio-
nes con beneficios definidos (menos €600 millones) afec-
taron las utilidades retenidas. Esto incluye efectos positi-
vos relacionados con la determinación de impuestos de
los años anteriores por €400 millones. En comparación
con el incremento en capital del 4%, el balance general
total incrementó de forma desproporcionada en 10%.
Debido a los efectos que se describen anteriormente, el
coeficiente de capital del Grupo del 21.0% fue inferior
que a fines del 2014 (22.1%); el coeficiente de capital
para las operaciones industriales fue del 37.7% (fines de
2014: 40.8%). Los coeficientes de capital están ajustados
para el pago de dividendos para el año 2014.
Las provisiones incrementaron a €31,200 millones (31
de diciembre de 2014: €28,400 millones); como propor-
ción del balance general total, representaron el 15%, que
es igual que el nivel del año anterior. Los efectos de la
conversión de divisas representan €800 millones del
incremento en provisiones. Estos incluyen principalmente
provisiones para pensiones y obligaciones similares por
€14,800 millones (fines de 2014: €12,800 millones), que
consisten principalmente en la diferencia entre el valor
presente de obligaciones por pensiones de beneficios
definidos por €33,000 millones (fines de 2014: €30,100
millones) y el valor razonable de los activos del plan de
pensiones aplicados para financiar dichas obligaciones
por €19,500 millones (fines de 2014: €18,600 millones).
La baja en las tasas de descuento, especialmente para
planes de Alemania de 1.9% al 31 de diciembre de 2014
a 1.5% al 31 de marzo de 2015, conllevó a un incremento
en el valor presente de las obligaciones por planes de
pensiones con beneficios definidos. Las provisiones
también están relacionadas con pasivos por impuestos
sobre la renta por €1,800 millones (fines de 2014: €1,600
millones), por garantías de productos €5,200 millones
(fines de 2014: €5,000 millones) y de costos sociales y de
personal €3,900 millones (fines de 2014: €3,900 millo-
nes), así como otras provisiones por €5,500 millones

C | Informe Provisional de la Adminsitración
13
(fines de 2014: €5,100 millones).
Los pasivos por financiamiento de €93,800 millones
fueron superiores al nivel del 31 de diciembre de 2014
(€86,700 millones). Así como efectos de divisas por
€4,600 millones, el incremento refleja principalmente el
refinanciamiento del creciente negocio de arrendamiento
y financiamiento de ventas. El 51% de los pasivos finan-
cieros están representados por bonos, 26% por pasivos
ante instituciones financieras, 11% por depósitos en el
negocio de banca directa, y 8% por pasivos por transac-
ciones ABS.
Las cuentas por pagar comerciales aumentaron a
€12,300 millones (31 de diciembre de 2014: €10,200
millones), principalmente debido al mayor volumen de
negocios. La división Mercedes-Benz Automóviles repre-
senta el 61% de estas cuentas por pagar y la división
Daimler Camiones representa el 27%.
Otros pasivos financieros por €14,800 millones fueron
mayores que el nivel de €10,700 millones al 31 de di-
ciembre de 2014. Estos consisten principalmente en pasi-
vos por instrumentos financieros derivados, garantías de
valor residual, gastos por intereses acumulados sobre
pasivos de financiamiento, pasivos por sueldos y salarios,
y depósitos recibidos. El incremento no solo se debe a
los efectos de la conversión de divisas por €1,200 millo-
nes, sin particularmente también a mayores pasivos por
instrumentos financieros derivados.
Otros pasivos incrementaron principalmente debido a
efectos del tipo de cambio de €9,100 millones a €10,600
millones. Estos consisten principalmente de devengos y
aplazamientos, pasivos fiscales e impuestos diferidos.
En el estado consolidado de situación financiera, el esta-
do consolidado de cambios en el capital y las notas rele-
vantes en las Notas a los Estados Financieros Consolida-
dos Provisionales.
Fuerza Laboral
A fines del primer trimestre de 2015, Daimler empleó a
283,541 personas a nivel mundial (fines de 2014:
279,972). De este total, 170,296 se emplearon en Alema-
nia (fines de 2014: 168,909), 23,399 en Estados Unidos
(fines de 2014: 22,833), 12,384 en Brasil (fines de 2014:
12,313) y 11,294 en Japón (fines de 2014: 11,400).
Nuestras compañías consolidadas en China tuvieron
2,769 empleados a fines del primer trimestre (fines de
2014: 2,664).
C.10 Empleados por división
Eventos importantes
Cambios en el Consejo de Administración y el Conse-
jo de Vigilancia
En su asamblea del 13 de febrero de 2015, el Consejo de
Vigilancia de Daimler AG prorrogó el contrato de servicios
de Hubertus Troska, Miembro del Consejo de Administra-
ción para la Gran China, hasta el 31 de diciembre de 2020.
A partir de la conclusión de la Asamblea Anual de Accionis-
tas celebrada el 1º de abril de 2015, el mandato del Dr. Paul
Achleitner como miembro del Consejo de Vigilancia con-
cluyó. La Asamblea Anual de Accionistas re-eligió al Dr.
Paul Achleitner, Presidente del Consejo de Vigilancia de
Deutsche Bank AG, como miembro del Consejo de Vigilan-
cia de Daimler AG representando a los accionistas. Su
nuevo mandato inició al concluir la Asamblea Anual de
Accionistas de 2015 y concluye con la Asamblea Anual de
Accionistas en 2020.
Informe de riesgos y oportunidades
Los riesgos y oportunidades pueden tener una influencia
significativa sobre la rentabilidad, flujos de efectivo y
situación financiera del Grupo Daimler así como informa-
ción detallada sobre nuestro sistema de gestión de ries-
gos y oportunidades y se presentan en las páginas 132 a
145 de nuestro informe anual 2014. Además, hacemos
referencia a las notas sobre declaraciones prospectivas
que se presentan al final de este Informe Provisional de la
Administración.
A inicios del segundo trimestre de 2015, los riesgos para
la economía mundial han tendido a volverse más graves.
Esto es principalmente el reflejo de mayores riesgos polí-
ticos, especialmente la posible intensificación de tensión
entre Rusia y las naciones occidentales, donde la primera
etapa sería una espiral acelerada de sanciones y contra
sanciones. Por otra parte, la considerable tensión en el
medio oriente es una fuente importante de riesgos poten-
ciales. Además, las economías que dependen de entra-
das de capital debido a déficits de comercio exterior con-
tinúan estando sujetas a importantes volatilidades del tipo
de cambio y retrocesos en el crecimiento. En Estados
Unidos, el cambio esperado en la política monetaria po-
dría conllevar a efectos imprevistos, particularmente so-
bre la inversión. En la Unión Monetaria Europea, existe
una considerable incertidumbre en relación con Grecia,
que inclusive incluyen escenarios de una posible salida.
Un evento de este tipo podría desencadenar el riesgo de
contagio para otros países miembros. Aunque la amena-
za de deflación parece haber desaparecidos recientemen-
te, si este peligro vuelve a aparecer, los efectos negativos
sobre la demanda nacional podrían ser importantes. En
relación con la muy expansiva política monetaria del Ban-
co Central Europeo, existe una preocupación creciente
sobre el grado en el que esto ha aumentado el peligro de
burbujas especulativas sobre los mercados de valores y
mercados de bonos. Una mayor turbulencia en los mer-
cados financieros podría entonces tener efectos directos
sobre el panorama económico. Las oportunidades con-
sisten, por una parte, en la rápida recuperación económi-
Grupo Daimler 283,541
Automóviles Mercedes-Benz 130,736 Daimler Camiones 83,421 Vanes Mercedes-Benz 16,615 Daimler Autobuses 16,891 Daimler Servicios Financieros 9,287 Funciones del Grupo y Servicios 26,591

14
ca de los mercados emergentes, y por otra parte de una
sólida recuperación de la economía en la zona del euro.
Una reducción sostenida en la tensión en el medio oriente
también tendría un impacto positivo en la economía mun-
dial.
Además de los factores que se mencionan con anteriori-
dad, nuestra evaluación de riesgos y oportunidades no ha
cambiado de forma significativa desde la publicación del
Informe Anual 2014.

22
Las notas adjuntas forman parte de los Estados Financieros Consolidados Provisionales.
Der nachfolgende Konzernanhang ist integraler Bestandteil des Zwischenabschlusses.
E.01
Grupo Consolidado
Operaciones Industria-les
(información adicional no auditada)
Daimler Servicios Fi-nancieros
(información adicional no auditada)
T1 2015 T1 2014 T1 2015 T1 2014 T1 2015 T1 2014
En millones de euros
Ingresos 34,236 29,457 29,687 25,648 4,549 3,809
Costo de ventas -26,706 -23,045 -22,852 -19,861 -3,854 -3,184
Utilidad bruta 7,530 6,412 6,835 5,787 695 625
Gastos de ventas -2,920 -2,675 -2,791 -2,567 -129 -108
Gastos de administración -909 -752 -736 -631 -173 -121
Costos de investigación y desarrollo no
capitalizados -1,126 -1,076
-1,126 -1,076 - -
Otros ingresos de operación 455 305 433 295 22 10
Otros gastos de operación -116 -86 -111 -81 -5 -5
Participación en la utilidad/pérdida de inversiones contabilizadas utilizando el método de participación, neta 148 22
149 25 -1 -3
Otros gastos financieros, netos -158 -365 -158 -364 - -1
Ingresos por intereses 51 34 51 34 - -
Gastos por intereses -154 -169 -153 -167 -1 -2
Utilidad antes de impuestos 1 2,801 1,650 2,393 1,255 408 395
Impuesto sobre la renta -751 -564 -617 -430 -134 -134
Utilidad Neta 2,050 1,086 1,776 825 274 261
Utilidad atribuible a la participación no controladora 87 59
Utilidad atribuible a los accionistas de Daimler AG 1,963 1,027
Utilidad por acción (en €)
por utilidad atribuible a los accionistas de Daimler AG
Básica 1.83 0.96
Diluida 1.83 0.96
1 La conciliación de la EBIT del Grupo con utilidad antes de Impuestos sobre la renta se incluye en la Nota Error! Reference source not
found..
Estado Consolidado de Resultados (no au-
ditado).

E | Estados Financieros Consolidados Provisionales
23
Las notas adjuntas forman parte de los Estados Financieros Consolidados Provisionales.
E.02
Grupo Consolidado
T1 2015 T1 2014
En millones de euros
Utilidad neta 2,050 1,086
Ganancias/pérdidas no realizadas por ajustes por conversión de moneda 2,741 -73
Ganancias/pérdidas no realizadas por activos financieros disponibles para su venta 529 163
Ganancias/pérdidas no realizadas por instrumentos financieros derivados -2,676 -146
Ganancias/pérdidas no realizadas por inversiones registradas utilizando el método de participación 3 -
Partidas que pueden reclasificarse a utilidad/pérdida 597 -56
Ganancias/pérdidas actuariales por pensiones y obligaciones similares -569 -860
Partidas que no serán reclasificadas a utilidad/pérdida -569 -860
Otra Utilidad/pérdida integral, neta de impuestos 28 -916
utilidad/pérdida atribuible a participaciones minoritarias, después de impuestos 108 -1
utilidad/pérdida atribuible a los accionistas de Daimler AG, después de impuestos -80 -915
Total utilidad/pérdida integral 2,078 170
utilidad/pérdida atribuible a participaciones minoritarias 195 58
utilidad/pérdida atribuible a los accionistas de Daimler AG 1,883 112
Estado Consolidado de Resultados Integral
(no auditado).

24
Las notas adjuntas forman parte de los Estados Financieros Consolidados Provisionales.
E.03
Grupo Consolidado
Operaciones Industria-les
(información adicional no auditada)
Daimler Servicios Fi-nancieros
(información adicional no auditada)
31 marzo,
2015 31 dic.,
2014 31 marzo,
2015 31 dic.,
2014 31 marzo,
2015 31 dic.,
2014
En millones de euros
Activos
Activos intangibles 9,539 9,367 9,371 9,202 168 165
Inmuebles, planta y equipo 23,735 23,182 23,673 23,125 62 57
Equipo en arrendamiento financiero 35,980 33,050 14,808 14,374 21,172 18,676
Inversiones registradas por el método de participación 2,794 2,294 2,765 2,264 29 30
Cuentas por cobrar por servicios financieros 38,892 34,910 -47 -49 38,939 34,959
Títulos de deuda negociables 1,320 1,374 6 6 1,314 1,368
Otros activos financieros 4,419 3,634 -472 -1,140 4,891 4,774
Activos por impuestos diferidos 6,060 4,124 5,503 3,610 557 514
Otros activos 515 555 -2,184 -2,178 2,699 2,733
Total activos no circulantes 123,254 112,490 53,423 49,214 69,831 63,276
Inventarios 23,516 20,864 22,762 20,004 754 860
Cuentas por cobrar comerciales 9,413 8,634 8,427 7,824 986 810
Cuentas por cobrar por servicios financieros 29,355 26,769 -21 -25 29,376 26,794
Efectivo y equivalentes 12,219 9,667 11,095 8,341 1,124 1,326
Títulos de deuda negociables 5,431 5,260 5,310 5,150 121 110
Otros activos financieros 2,215 2,353 -7,861 -7,099 10,076 9,452
Otros activos 3,866 3,598 972 772 2,894 2,826
Total activos circulantes 86,015 77,145 40,684 34,967 45,331 42,178
Total activos 209,269 189,635 94,107 84,181 115,162 105,454
Pasivos y Capital
Capital social 3,070 3,070
Reservas de capital 11,899 11,906
Utilidades retenidas 29,881 28,487
Otras reservas 691 202
Capital atribuible a los accionistas de Daimler AG 45,541 43,665
Participación minoritaria 1,039 919
Capital total 46,580 44,584 38,114 36,967 8,466 7,617
Provisiones para pensiones y obligaciones similares 14,798 12,806 14,587 12,630 211 176
Provisiones para el pago del impuesto sobre la renta 843 851 843 850 - 1
Provisiones para otros riesgos 7,026 6,712 6,896 6,590 130 122
Pasivos financieros 54,400 50,399 11,587 10,325 42,813 40,074
Otros pasivos financieros 3,772 2,644 3,280 2,231 492 413
Pasivos por impuestos diferidos 1,505 1,070 -1,564 -1,618 3,069 2,688
Ingresos diferidos 3,988 3,581 3,478 3,101 510 480
Otros pasivos 12 14 10 14 2 -
Total pasivos no circulantes 86,344 78,077 39,117 34,123 47,227 43,954
Cuentas comerciales por pagar 12,293 10,178 11,781 9,852 512 326
Provisiones para el pago del impuesto sobre la renta 953 757 874 679 79 78
Provisiones para otros riesgos 7,597 7,267 7,134 6,830 463 437
Pasivos financieros 39,364 36,290 -15,338 -13,518 54,702 49,808
Otros pasivos financieros 11,071 8,062 8,911 6,198 2,160 1,864
Ingresos diferidos 2,734 2,413 1,891 1,674 843 739
Otros pasivos 2,333 2,007 1,623 1,376 710 631
Total pasivos circulantes 76,345 66,974 16,876 13,091 59,469 53,883
Total pasivos y capital 209,269 189,635 94,107 84,181 115,162 105,454
Estado de Situación Financiera Consolidado
(no auditado).
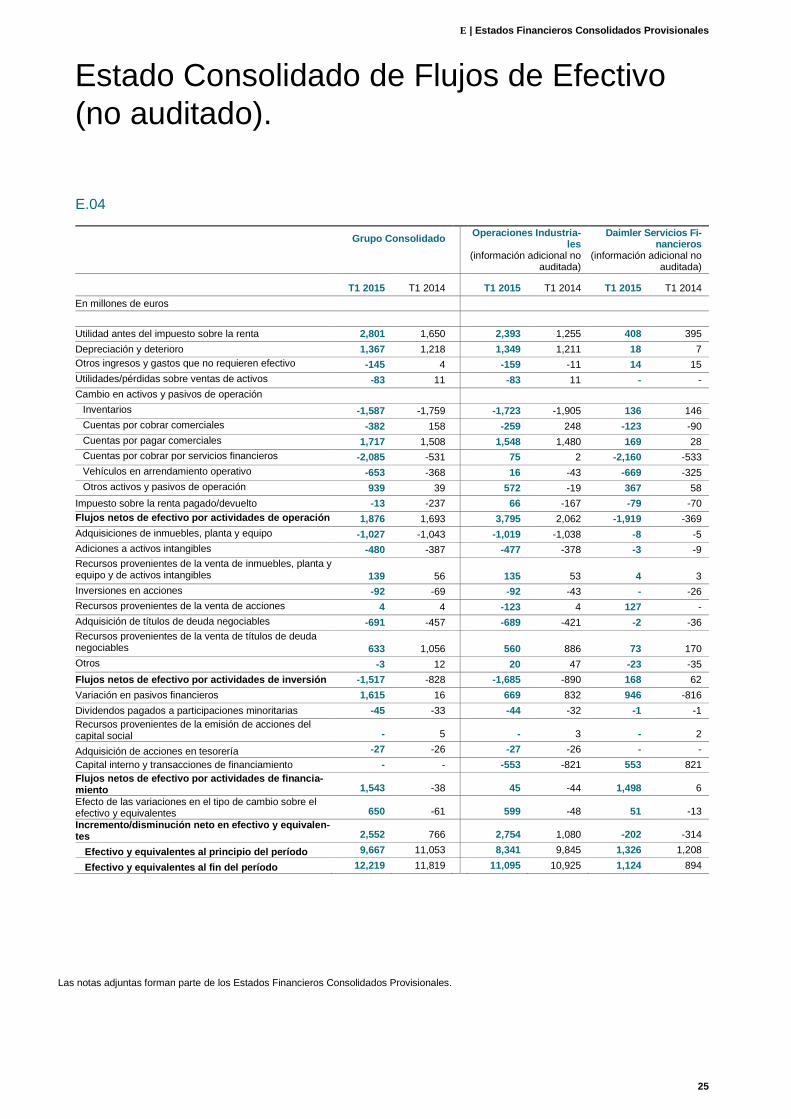
E | Estados Financieros Consolidados Provisionales
25
Las notas adjuntas forman parte de los Estados Financieros Consolidados Provisionales.
E.04
Grupo Consolidado
Operaciones Industria-les
(información adicional no auditada)
Daimler Servicios Fi-nancieros
(información adicional no auditada)
T1 2015 T1 2014 T1 2015 T1 2014 T1 2015 T1 2014
En millones de euros
Utilidad antes del impuesto sobre la renta 2,801 1,650 2,393 1,255 408 395
Depreciación y deterioro 1,367 1,218 1,349 1,211 18 7
Otros ingresos y gastos que no requieren efectivo -145 4 -159 -11 14 15
Utilidades/pérdidas sobre ventas de activos -83 11 -83 11 - -
Cambio en activos y pasivos de operación
Inventarios -1,587 -1,759 -1,723 -1,905 136 146
Cuentas por cobrar comerciales -382 158 -259 248 -123 -90
Cuentas por pagar comerciales 1,717 1,508 1,548 1,480 169 28
Cuentas por cobrar por servicios financieros -2,085 -531 75 2 -2,160 -533
Vehículos en arrendamiento operativo -653 -368 16 -43 -669 -325
Otros activos y pasivos de operación 939 39 572 -19 367 58
Impuesto sobre la renta pagado/devuelto -13 -237 66 -167 -79 -70
Flujos netos de efectivo por actividades de operación 1,876 1,693 3,795 2,062 -1,919 -369
Adquisiciones de inmuebles, planta y equipo -1,027 -1,043 -1,019 -1,038 -8 -5
Adiciones a activos intangibles -480 -387 -477 -378 -3 -9
Recursos provenientes de la venta de inmuebles, planta y equipo y de activos intangibles 139 56 135 53 4 3
Inversiones en acciones -92 -69 -92 -43 - -26
Recursos provenientes de la venta de acciones 4 4 -123 4 127 -
Adquisición de títulos de deuda negociables -691 -457 -689 -421 -2 -36
Recursos provenientes de la venta de títulos de deuda negociables 633 1,056 560 886 73 170
Otros -3 12 20 47 -23 -35
Flujos netos de efectivo por actividades de inversión -1,517 -828 -1,685 -890 168 62
Variación en pasivos financieros 1,615 16 669 832 946 -816
Dividendos pagados a participaciones minoritarias -45 -33 -44 -32 -1 -1
Recursos provenientes de la emisión de acciones del capital social - 5 - 3 - 2
Adquisición de acciones en tesorería -27 -26 -27 -26 - -
Capital interno y transacciones de financiamiento - - -553 -821 553 821
Flujos netos de efectivo por actividades de financia-miento 1,543 -38 45 -44 1,498 6
Efecto de las variaciones en el tipo de cambio sobre el efectivo y equivalentes 650 -61 599 -48 51 -13
Incremento/disminución neto en efectivo y equivalen-tes 2,552 766 2,754 1,080 -202 -314
Efectivo y equivalentes al principio del período 9,667 11,053 8,341 9,845 1,326 1,208
Efectivo y equivalentes al fin del período 12,219 11,819 11,095 10,925 1,124 894
Estado Consolidado de Flujos de Efectivo
(no auditado).

26
Las notas adjuntas forman parte de los Estados Financieros Consolidados Provisionales.
E.05
En millones de euros Capital Social
Reservas de
Capital
Utilidades Rete-
nidas
Conversión de
moneda
Activos
financieros
disponibles
para venta
Saldo al 1o de enero de 2014 3,069 11,850 27,628 -969 261
Utilidad neta - - 1,027 - -
Otra utilidad/pérdida integral antes de impuestos - - -1,248 -65 162
Impuestos sobre otra utilidad/pérdida integral - - 388 - 1
Utilidad/pérdida integral total - - 167 -65 163
Dividendos - - - - -
Aumento de capital/emisión de nuevas acciones 1 2 - - -
Adquisición de acciones en tesorería - - - - -
Emisión y venta de acciones en tesorería - - - - -
Otros - -14 - - -
Saldo al 31 marzo de 2014 3,070 11,838 27,795 -1,034 424
Saldo al 1º de enero de 2015 3,070 11,906 28,487 775 460
Utilidad neta - - 1,963 - -
Otra utilidad/pérdida integral antes de impuestos - - -1,640 2,629 532
Impuestos sobre otra utilidad/pérdida integral - - 1,071 - -3
Utilidad/pérdida integral total - - 1,394 2,629 529
Dividendos - - - - -
Adquisición de acciones en tesorería - - - -
Emisión y venta de acciones en tesorería - - - - -
Otros - -7 - - -
Saldo al 31 marzo de 2015 3,070 11,899 29,881 3,404 989
Estado Consolidado de Cambios en el Capi-
tal Contable (no auditado).

E | Estados Financieros Consolidados Provisionales
27
Las notas adjuntas forman parte de los Estados Financieros Consolidados Provisionales.
Otras partidas de reservas
que pueden reclasificarse en
utilidad /pérdida
Instrumentos
financieros
derivados
Inversiones
registradas
con el método
de participa-
ción
Acciones en
tesorería
Capital atri-
buible a ac-
cionistas de
Daimler AG
Participación
minoritaria
Total de
capital En millones de euros
853 -12 - 42,680 683 43,363 Saldo al 1o de enero de 2014
- - - 1,027 59 1,086 Utilidad neta
-221 - - -1,372 1 -1,371 Otra utilidad/pérdida integral antes de im-puestos
68 - - 457 -2 455 Impuestos sobre otra utilidad/pérdida integral
-153 - - 112 58 170 Utilidad/pérdida integral total
- - - - -40 -40 Dividendos
- - - 3 2 5 Aumento de capital/emisión de nuevas acciones
- - -26 -26 - -26 Adquisición de acciones en tesorería
- - 26 26 - 26 Emisión y venta de acciones en tesorería
- - - -14 1 -13 Otros
700 -12 - 42,781 704 43,485 Saldo al 31 marzo de 2014
-1,032 -1 - 43,665 919 44,584 Saldo al 1º de enero de 2015
- - - 1,963 87 2,050 Utilidad neta
-3,819 3 - -2,295 107 -2,188 Otra utilidad/pérdida integral antes de im-puestos
1,147 - - 2,215 1 2,216 Impuestos sobre otra utilidad/pérdida integral
-2,672 3 - 1,883 195 2,078 Utilidad/pérdida integral total
- - - - -69 -69 Dividendos
- - -27 -27 - -27 Adquisición de acciones en tesorería
- - 27 27 - 27 Emisión y venta de acciones en tesorería
- - - -7 -6 -13 Otros
-3,704 2 - 45,541 1,039 46,580 Saldo al 31 marzo de 2015
28
1. Presentación de los Estados Financieros Consoli-
dados Provisionales
Información General. Estos estados financieros consoli-
dados provisionales no auditados condensados (estados
financieros provisionales) de Daimler AG y sus subsidia-
rias (“Daimler” o “el Grupo”) han sido preparados de con-
formidad con la Sección 37x Sub-sección 3 de la Ley
Alemana del Mercado de Valores (WpHG) y las Normas
Internacionales de Contabilidad (NIC) 34 Informes Finan-
cieros Provisionales.
Los estados financieros provisionales cumplen con las
Normas Internacionales de Información Financiera (NIIF)
adoptadas por la Unión Europea.
Daimler AG es una sociedad anónima constituida de con-
formidad con las leyes de la República Federal de Ale-
mania. Daimler AG está inscrita en el Registro Público de
Comercio del Tribunal de Distrito de Stuttgart bajo el nú-
mero HRB 19360 y su domicilio fiscal está ubicado en
Mercedesstraße 137, 70327 Stuttgart, Alemania.
Los estados financieros provisionales del Grupo Daimler
se presentan en euros (€). Salvo que se establezca lo
contrario, todas las cifras se muestran en millones de eu-
ros. Todas las cifras mostradas se redondean de acuerdo
con los principios comerciales de redondeo estándar.
Todas las cuentas inter-compañía significativas han sido
eliminadas. En opinión de la administración, los estados
financieros provisionales reflejan todos los ajustes (esto
es, ajustes recurrentes normales) necesarios para una
presentación imparcial de la rentabilidad, liquidez y recur-
sos de capital y de la situación financiera del Grupo. Los
resultados de operaciones de los períodos parciales pre-
sentados no son necesariamente indicativos de los resul-
tados que pueden esperarse para cualquier período futu-
ro o para el ejercicio fiscal completo. Los estados finan-
cieros provisionales deben ser leídos en conjunto con los
estados financieros consolidados, auditados y publicados
de conformidad con las NIIF, al 31 de diciembre de 2014
y las notas de los mismos. Las políticas contables apli-
cadas por el Grupo en estos estados financieros provisio-
nales básicamente corresponden con aquellas aplicadas
en los estados financieros consolidados para el año que
concluyó el 31 de diciembre de 2014.
Con el fin de apoyar la distribución de ciertos productos
fabricados por Daimler se otorga a los clientes del Grupo
financiamiento de ventas, incluyendo alternativas de
arrendamiento financiero. De conformidad con lo anterior,
los estados financieros consolidados del Grupo también
son influenciados en gran medida por las actividades de
su negocio de servicios financieros. Para facilitar el en-
tendimiento de la rentabilidad, liquidez y recursos de capi-
tal del Grupo y su situación financiera a los lectores, los
estados financieros consolidados provisionales que se
adjuntan, también presentan información relacionada con
los negocios industriales del Grupo y actividades de ser-
vicios financieros de Daimler Servicios Financieros. Sin
embargo dicha información no es requerida por las NIIF y
no tiene el propósito de representar ni representa por se-
parado la rentabilidad, liquidez y recursos de capital del
negocio industrial del Grupo Daimler Servicios Financie-
ros conforme a las NIIF. Las eliminaciones de los efectos
de las transacciones entre el negocio industrial y los ne-
gocios de Daimler Servicios Financieros, generalmente
han sido asignadas a las columnas correspondientes a
negocios industriales.
La preparación de estados financieros provisionales de
conformidad con las NIIF requiere que la administración
realice estimaciones, evaluaciones e hipótesis que pue-
den afectar los montos y la presentación de informes de
activos y pasivos, el reporte de activos y pasivos contin-
gentes en la fecha del balance general y los montos de
ingresos y gastos reportados para el período. Los mon-
tos reales pueden diferir de dichas estimaciones. Los
cambios en las estimaciones, evaluaciones e hipótesis
pueden tener un impacto importante en los estados finan-
cieros consolidados.
1. Ventas significativas de inversiones de capital
Atlantis Foundries. A fines de febrero de 2015, Daimler
decidió vender sus acciones en Atlantis Foundries (Pty.)
Ltd. a Neue Halberg-Guss GmbH. Se espera que esta
transacción se cierre durante el primer semestre de 2015.
La revaluación de los activos y pasivos de Atlantis Foun-
dries resultante de la clasificación como activos disponi-
bles para la venta conllevó a una importante pérdida por
deterioro por €55 millones al 31 de marzo de, 2015, la
cual fue asignada al segmento Daimler Camiones. Debi-
do a su leve impacto en la rentabilidad, liquidez y recur-
sos de capital del Grupo y su situación financiera, la venta
de estos activos y pasivos no se presenta por separado
en el estado de situación financiera consolidado.
RRPSH. Durante el primer trimestre de 2014, el Consejo
de Administración y el Comité de Vigilancia de Daimler
AG decidieron vender la participación del 50% en el capi-
tal de Rolls-Royce Power Systems Holding GmbH
(RRPSH) al socio Rolls-Royce Holdings PLC (Rolls-
Royce). Para este fin, Daimler ejerció una opción de ven-
ta sobre su participación en RRPSH, que había sido
acordada con Rolls-Royce en 2011. La transacción se
concretó en el tercer trimestre de 2014. La valuación de
la opción de venta resultó en un gasto por €118 millones
durante el primer trimestre de 2014.
La Nota 9 ofrece información adicional sobre RRPSH.
Notas a los Estados Financieros Consoli-
dados Provisionales (no auditados).
E | Estados Financieros Consolidados Provisionales
29
2. Ingresos
Los ingresos a nivel Grupo están integrados de la siguien-
te forma:
E.06
Ingresos
T1 2015 T1 2014
En millones de euros
Ingresos por venta de bienes 29,745 25,718
Ingresos por actividades de renta y arren-damiento 3,468 2,882
Intereses de las actividades de servicios financieros en Daimler Servicios Financie-ros 911 749
Ingresos por la prestación de otros servi-cios 112 108
34,236 29,457
2. Costos Funcionales
Programas de optimización. A continuación se descri-
ben brevemente las medidas y programas, con costos de
implementación, que tuvieron un impacto material en la
EBIT de los siguientes segmentos.
A lo largo del proceso de enfoque organizacional de las
divisiones, Daimler inició un programa de reestructuración
para su organización de ventas en Alemania en 2014.
Centros de ventas y servicios y puntos de venta seleccio-
nados están siendo combinados en puntos de venta de
automóviles y vehículos comerciales con el fin de incre-
mentar de forma estable la rentabilidad de las actividades
de distribuidor de Daimler en el altamente competitivo
mercado alemán. Adicionalmente, el programa de rees-
tructuración incluye el plan para vender operaciones se-
leccionadas de la red actual de ventas del Grupo, princi-
palmente a fines de 2015. Debido a su leve impacto en la
rentabilidad, liquidez y recursos de capital y situación fi-
nanciera del Grupo, los activos y pasivos disponibles para
su venta no se presentan por separado en el estado con-
solidado de situación financiera. Al 31 de diciembre de
2014, esta venta de activos del Grupo fue por un total de
€300 millones y sus pasivos ascendían a €27 millones.
Debido a la venta parcial del grupo para venta, sus acti-
vos restantes fueron por un total de €270 millones al 31
de marzo de 2015. Ya no tenía ningún pasivo. Durante
el primer trimestre de 2015, Daimler registró gastos por
€29 millones. Para estas medidas de reestructuración, el
Grupo prevé efectos negativos sobre ingresos de hasta
€500 millones en 2015 y 2016. Este programa afecta a
todos los segmentos automotrices, pero principalmente al
segmento Mercedes-Benz Automóviles.
Adicionalmente, a fines de enero de 2013, Daimler Ca-
miones anunció ajustes en la fuerza laboral como parte
de su meta para incrementar su rentabilidad mediante un
uso más sólido en relación con la productividad. En el
sector administrativo en Brasil, un programa voluntario de
redundancia lanzado en el primer trimestre de 2013 se
continuó en abril de 2014 principalmente en el área pro-
ductiva, lo que resultó en una reducción de aproximada-
mente 2,500 empleos al 31 de marzo de 2015. Estos
ajustes a la fuerza laboral también afectaron a Daimler
Autobuses, pero en menor grado
Además, en áreas no productivas de Daimler Camiones
en Alemania, se ejecutó un programa basado en medidas
voluntarias socialmente aceptadas, entre mayo de 2013 y
diciembre de 2014, lo que resultó en una reducción de
aproximadamente 600 empleos al 31 de diciembre de
2014.
El Grupo prevé gastos adicionales por hasta €50 millones
en 2015 para estos programas de optimización en Daim-
ler Camiones.
La tabla E.07 muestra los gastos relacionados con los
programas de optimización que afectaron la EBIT de los
segmentos. También se muestran las salidas de efectivo
relacionadas con la implementación de programas.
E.07
Programas de optimización
T1 2015 T1 2014
En millones de euros
Mercedes-Benz Automóviles
EBIT -20 -
Flujo de Efectivo -4 -
Daimler Camiones
EBIT -9 -5
Flujo de Efectivo -37 -64
Mercedes-Benz Vans
EBIT -4 -
Flujo de Efectivo -1 -
Daimler Autobuses
EBIT -1 -1
Flujo de Efectivo - -9
Las provisiones reconocidas para los programas de opti-
mización se muestran en la Tabla E.08.
E.08
Provisiones para programas de optimización
31 marzo,
2015 31 dic.,
2014
En millones de euros
Mercedes-Benz Automóviles 17 -
Daimler Camiones 5 6
Mercedes-Benz Vans 4 -
Daimler Autobuses 1 13
Los gastos enumerados en la tabla E.07 están primor-
dialmente relacionados con medidas de personal y se
incluyen en las partidas dentro del estado consolidado de
resultados tal como se muestra en la tabla E.09.

30
E.09
Ingresos y gastos relacionados con pro-
gramas de optimización
T1 2015 T1 2014
En millones de euros
Costo de ventas -5 -3
Gastos de ventas -32 -
Gastos de administración - -3
Otros ingresos operativos 3 -
-34 -6
Se espera que los efectos en efectivo resultantes de los
programas de optimización se presenten, primordialmen-
te, hasta fines de 2017.
3. Otros ingresos de operación
La tabla E.10 muestra la integración de otros ingresos
de operación.
E.10
Otros ingresos de operación
T1 2015 T1 2014
En millones de euros
Ingresos por costos cobrados a terceros 226 173
Utilidades provenientes de la venta de inmuebles, planta y equipo 95 20
Beneficios y subsidios gubernamentales 15 20
Ingresos por arrendamiento, distintos a los ingresos relacionados con servicios financieros 15 14
Reembolsos por pólizas de seguros 7 5
Otros ingresos varios 97 73
455 305
Los ingresos por servicios cobrados a partes no relacio-
nadas incluyen ingresos por la venta de bienes inmuebles
en Estados Unidos por €87 millones.
4. Otros ingresos/gastos financieros, netos
La tabla E.11 muestra los rubros que integran los otros
ingresos/gastos financieros, netos.
E.11
Otros ingresos/gastos financieros, netos
T1 2015 T1 2014
En millones de euros
Gastos resultantes de la creación de provi-
siones y de los efectos de las variaciones en
las tasas de descuento1 -112 -66
Otros ingresos/gastos financieros varios,
netos -46 -299
-158 -365
1 Se excluyen los gastos resultantes de la creación de las provisiones para pensiones y obligaciones similares.
En 2014, se incluyen gastos por €161 millones por la co-
bertura del precio de acción de Tesla Motors, Inc. (Tesla)
y por €118 millones por la valuación de la opción de com-
pra RRPSH en otros ingresos/gastos financieros varios,
netos.
5. Ingresos por intereses y gastos por intereses
Los ingresos por intereses y gastos por intereses están
integrados de la siguiente forma:
E.12
Ingresos y gastos por intereses
T1 2015 T1 2014
En millones de euros
Ingresos por intereses
Ingresos netos por intereses en los activos
de planes de pensiones definidos 1 .
Ingresos por intereses y similares 50 34
51 34
Gastos por intereses
Gasto neto por intereses por la obligación
neta de planes de pensiones definidos -81 -84
Gastos por intereses y similares -73 -85
-154 -169
6. Activos intangibles
Los activos intangibles están integrados de la siguiente
forma:
E.13
Activos intangibles
31 marzo, 2015
31 dic., 2014
En millones de euros
Crédito mercantil 753 740
Costos de desarrollo 7,348 7,245
Otros activos intangibles 1,438 1,382
9,539 9,367

E | Estados Financieros Consolidados Provisionales
31
7. Inmuebles, planta y equipo
Los inmuebles, planta y equipo se integran de la siguiente
forma:
E.14
Inmuebles, planta y equipo
31 marzo,
2015 31 dic.,
2014
En millones de euros
Terrenos, mejoras a propiedades arrendadas y edificios propiedad de terceros 7,213 6,942
Maquinaria y equipo técnico 8,255 8,120
Otros equipos y equipo de fábrica y ofici-nas 5,887 5,609
Anticipos relacionados con planta y equi-po y construcciones en proceso 2,380 2,511
23,735 23,182
8. Equipo en arrendamientos operativos
Al 31 marzo de 2015, el valor en libros de equipo en
arrendamientos operativos fue por un total de €35,980
millones (31 diciembre, 2014: €33,050 millones). En los
tres meses que concluyeron el 31 de marzo de 2015, las
adiciones y disposiciones fueron por un total de €4,632
millones y €2,499 millones, respectivamente (2014:
€3,762 millones y €2,307 millones). La depreciación du-
rante el primer trimestre de 2015 fue por €1,480 millones
(2014: €1,114 millones). Otras variaciones incluyen prin-
cipalmente los efectos de la conversión de divisas.
9. Inversiones registradas utilizando el método de
participación.
La tabla E.15 muestra los valores netos en libro y utili-
dades/pérdidas por inversiones de capital registradas con
el método de participación.
La tabla E.16 muestra las cifras clave de las participa-
ciones en compañías asociadas registradas con el méto-
do de participación en los estados financieros consolida-
dos del Grupo.
E.15
Resumen de valores en libros y utilidades/pérdidas por inversiones registradas con el método de participación
Compañías Aso-
ciadas Operaciones Con-
juntas Negocios Conjun-
tos Subsidiarias Total
En millones de euros
Al 31 marzo, 2015
Inversión de capital1 2,258 488 47 1 2,794
Resultado de capital1 (T1 2015) 159 -12 1 - 148
Al 31 diciembre, 2014
Inversión de capital 1 1,795 448 44 7 2,294
Resultado de capital 1 (T1 2014) 36 -15 1 - 22
1 Incluyendo ajustes a nivel de inversionistas
32
E.16
Cifras clave sobre participaciones en compañías asociadas registradas a través del método de participación
RRPSH BBAC BAIC Motor2 Kamaz3 Otros Total
En millones de euros
Al 31 marzo, 2015
Participación accionaria (en %) - 49.0 10.1 15.0 - -
Inversión de capital 1 - 1,162 818 87 191 2,258
Resultado de capital 1 (T1 2015) - 117 41 2 -1 159
Al 31 diciembre, 2014
Participación accionaria (en %) - 49.0 10.1 15.0 - -
Inversión de capital1 - 852 686 71 186 1,795
Resultado de capital1 (T1 2014) 13 29 2 -3 -5 36
1 Incluyendo ajustes a nivel de inversionistas.
2 Las utilidades de BAIC Motor Corporation Ltd. (BAIC Motor) se incluyen en los estados financieros consolidados de Daimler con un desfase
temporal de tres meses. Las cifras de BAIC Motor no están auditadas y se basan en los PCGA locales. La inversión en BAIC Motor se ad-
quirió en noviembre de 2013. Por lo tanto, la participación proporcional de Daimler en las utilidades de BAIC Motor durante el primer trimes-
tre de 2014 está relacionada con las utilidades de BAIC Motor para el mes de diciembre de 2013.
3 Kamaz OAO
BBAC. Durante el primer trimestre de 2015, se llevó a
cabo un aumento de capital por €72 millones en Beijing
Benz Automotive Co., Ltd. (BBAC). Daimler planea apor-
tar capital adicional por €300 millones de acuerdo con su
índice de participación en BBAC en 2015.
RRPSH. En marzo de 2014, Daimler decidió vender su
participación del 50% en la operación conjunta RRPSH a
su socio Rolls-Royce. Para hacerlo, Daimler ejerció una
opción de venta sobre su participación en RRPSH que
fue acordada con Rolls-Royce en 2011. La transacción se
cerró en el tercer trimestre de 2014.
E | Estados Financieros Consolidados Provisionales
33
10. Cuentas por cobrar por servicios financieros
La siguiente tabla muestra las cuentas por cobrar por ser-
vicios financieros.
E.17
Cuentas por cobrar por servicios financieros
31 marzo, 2015 31 diciembre, 2014
Circulantes No circu-
lantes Totales Circulantes No circu-
lantes Totales
En millones de euros
Financiamiento de ventas con clientes 10,904 25,672 36,576 10,307 22,852 33,159
Financiamiento de ventas con distribuidores 13,619 2,454 16,073 11,786 2,203 13,989
Contratos de arrendamiento financiero 5,280 11,329 16,609 5,084 10,368 15,452
Valor en libros bruto 29,803 39,455 69,258 27,177 35,423 62,600
Reservas para cuentas incobrables -448 -563 -1,011 -408 -513 -921
Valor neto en libros 29,355 38,892 68,247 26,769 34,910 61,679
Al 31 marzo, 2015, los contratos de arrendamiento finan-
ciero incluían activos no automotrices de contratos del
negocio de servicios financieros con terceros (arrenda-
mientos apalancados) por un importe de €345 millones
(31 de diciembre, 2014: € 365 millones).
Dentro del contexto de la continua concentración en el
negocio automotriz, Daimler Servicios Financieros vendió
activos no automotrices que estuvieron sujetos a arren-
damientos apalancados en 2014. Esto tuvo como resul-
tado una entrada total de efectivo de €69 millones. El in-
greso antes de impuestos por esta transacción en 2014
fue por un importe de €45 millones y se asignó a la EBIT
del segmento Daimler Servicios Financieros
11. Inventarios
Los inventarios están integrados de la siguiente forma:
E.18
Inventarios
31 marzo,
2015 31 dic.,
2014
En millones de euros
Materias primas y elementos de producción 2,711 2,409
Trabajo en Curso 3,423 2,936
Productos terminados, partes y productos
disponibles para reventa 17,258 15,412
Anticipos a proveedores 124 107
23,516 20,864
34
12. Capital
Capital Autorizado. Por resolución de la Asamblea Anual
del 9 de abril de 2014, se autorizó al Consejo de Adminis-
tración, con el consentimiento del Consejo de Vigilancia,
el aumento del capital social de Daimler AG en el período
que termina el 8 de abril de 2019 por un total de €1,000
millones en un solo monto o en montos parciales en dife-
rentes momentos, emitiendo acciones nominativas nue-
vas, sin valor nominal a cambio de aportaciones en efec-
tivo y en especie (Capital Autorizado 2014). Entre otras
cosas, se autorizó al Consejo de Administración con el
consentimiento del Consejo de Supervisión para excluir
los derechos de suscripción de los accionistas bajo cier-
tas condiciones y con ciertos límites definidos.
Capital Contingente. Mediante resolución adoptada en
la Asamblea Anual de Accionistas del 1o de abril de 2015,
se autorizó al Consejo de Administración, con el consen-
timiento del Consejo de Vigilancia, para emitir bonos con-
vertibles al portador y/o registrados y/o bonos con opcio-
nes o una combinación de estos instrumentos (“bonos”)
con un valor nominal total de hasta €10,000 millones y un
vencimiento de no más de diez años, hasta el 31 de mar-
zo de 2020. El Consejo de Administración está autoriza-
do para otorgar a los tenedores de estos bonos derechos
de conversión o derechos de libramiento para nuevas
acciones registradas sin valor nominal en Daimler AG con
una parte asignable del capital accionario de hasta €500
millones de conformidad con los detalles definidos en los
términos y condiciones de los bonos. Los bonos pueden
ser emitidos contra pago en efectivo o distinto de efectivo,
incluyendo participaciones en otras compañías. Las con-
diciones pueden estipular conversiones obligatorias y
opciones de los bonos. Los bonos pueden emitirse una
vez o muchas veces, totalmente o en parcialidades o si-
multáneamente en varios tramos y también por compa-
ñías filiales de Daimler AG, de conformidad con las Sec-
ciones 15 ff de la Ley de Sociedades de Alemania (AktG).
El Consejo de Administración también fue autorizado,
bajo ciertas condiciones específicas y dentro de las limi-
taciones definidas y con el consentimiento del Consejo de
Vigilancia, para excluir los derechos de suscripción de los
accionistas para los bonos.
Con el fin de canjear los bonos emitidos de conformidad
con la resolución que se menciona anteriormente, la
Asamblea Anual de Accionistas celebrada el 1º de abril
de 2015 aprobó una resolución para aumentar el capital
accionario de forma condicional por hasta €500 millones
(Capital Contingente 2015). El Capital Contingente 2010
fue cancelado.
Acciones en Tesorería. Mediante resolución de la Asam-
blea Anual de Accionistas de fecha 1o de abril de 2015, se
autorizó a Daimler AG hasta el 31 de marzo de 2020, para
adquirir acciones en tesorería para todos los efectos lega-
les a que haya lugar, y por un volumen de hasta el 10%
del capital social. Entre otras cosas, las acciones en te-
sorería pueden utilizarse, de acuerdo con la exclusión de
los derechos de accionistas para suscribir a las acciones
en tesorería de la Compañía, para adquirir compañías y/o
participaciones en compañías, o pueden venderse a ter-
ceros a cambio de efectivo, donde el precio de transac-
ción no debe ser sustancialmente menor que el precio de
la acción en la fecha de la transacción. Además, se auto-
rizó al Consejo de Administración, con el consentimiento
del Consejo de Vigilancia, para excluir los derechos de
accionistas a suscribir a las acciones en tesorería de la
Compañía en casos adicionales definidos. Las acciones
en tesorería también pueden ser canceladas. Hasta por
el 5% del capital social, Daimler AG también fue autoriza-
do para adquirir acciones en tesorería utilizando deriva-
dos (opciones de venta o compra, futuros o una combina-
ción de estos instrumentos financieros), donde la vigencia
de los derivados no podrá ser mayor a 18 meses y debe-
rá terminarse para el 31 de marzo de 2020, a más tardar.
La resolución adoptada por la Asamblea Anual de Accio-
nistas el 14 de abril de 2010, que autorizó a Daimler AG a
adquirir acciones en tesorería, incluyendo la resolución de
la misma Asamblea Anual de Accionistas para utilizar deri-
vados para adquirir acciones en tesorería, se dio por termi-
nada al momento en que la nueva autorización entró en
vigor.
Plan de compra de acciones para empleados. Durante
el primer trimestre de 2015, Daimler adquirió 0.3 millones
de acciones (2014: 0.4 millones) y las emitió nuevamente
a empleados en relación con los planes de compra de
acciones de empleados.
Dividendos. La Asamblea Anual de Accionistas celebra-
da el 1º de abril de 2015, autorizó a Daimler a pagar divi-
dendos por €2,621 millones (€2.45 por acción) de utilida-
des distribuibles de Daimler AG (estados financieros por
separado) para el año 2014 (2014: €2,407 millones y
€2.25 por acción). El dividendo fue pagado el 2 de abril
de 2015.
13. Pensiones y obligaciones similares
Costo de pensiones. Los componentes del costo de
pensiones incluidos en el estado consolidado de resulta-
dos se muestran en la tabla E.19.
Contribuciones del empleador a los activos del plan.
En los tres meses que concluyeron el 31 marzo, 2015, las
contribuciones por parte de Daimler a los planes de pen-
sión del Grupo fueron por €28 millones (2014: €37 millo-
nes).
Otras prestaciones posteriores al retiro. En mayo de
2014, Daimler Trucks North America LLC y el Sindicato
United Auto Workers union (UAW) celebraron un contrato
de establecimiento de un plan de cuidados de salud como
parte de un acuerdo colectivo de negociación. Como re-
sultado de este contrato, se saldó la obligación ante los
empleados activos elegibles en el cuarto trimestre de
2014. La transferencia de la obligación a los jubilados se
volvió legalmente vinculante con la expiración de la fecha
límite para avisos de apelación a fines de enero de 2015.
La salida de efectivo por esta transacción fue por €63
millones e ingresos por €49 millones durante el primer
trimestre de 2015, el ingreso está incluido en la EBIT del
segmento Daimler Camiones.
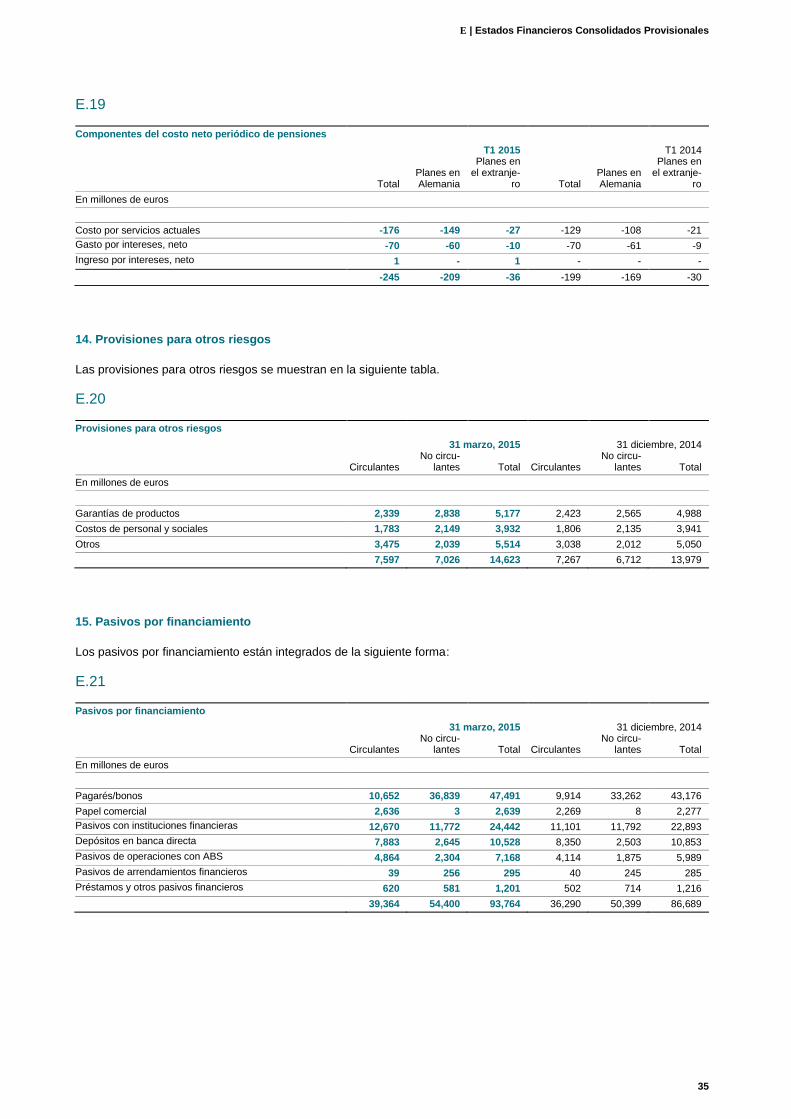
E | Estados Financieros Consolidados Provisionales
35
E.19
Componentes del costo neto periódico de pensiones
T1 2015 T1 2014
Total Planes en Alemania
Planes en el extranje-
ro Total Planes en Alemania
Planes en el extranje-
ro
En millones de euros
Costo por servicios actuales -176 -149 -27 -129 -108 -21
Gasto por intereses, neto -70 -60 -10 -70 -61 -9
Ingreso por intereses, neto 1 - 1 - - -
-245 -209 -36 -199 -169 -30
14. Provisiones para otros riesgos
Las provisiones para otros riesgos se muestran en la siguiente tabla.
E.20
Provisiones para otros riesgos
31 marzo, 2015 31 diciembre, 2014
Circulantes No circu-
lantes Total Circulantes No circu-
lantes Total
En millones de euros
Garantías de productos 2,339 2,838 5,177 2,423 2,565 4,988
Costos de personal y sociales 1,783 2,149 3,932 1,806 2,135 3,941
Otros 3,475 2,039 5,514 3,038 2,012 5,050
7,597 7,026 14,623 7,267 6,712 13,979
15. Pasivos por financiamiento
Los pasivos por financiamiento están integrados de la siguiente forma:
E.21
Pasivos por financiamiento
31 marzo, 2015 31 diciembre, 2014
Circulantes
No circu-lantes Total Circulantes
No circu-lantes Total
En millones de euros
Pagarés/bonos 10,652 36,839 47,491 9,914 33,262 43,176
Papel comercial 2,636 3 2,639 2,269 8 2,277
Pasivos con instituciones financieras 12,670 11,772 24,442 11,101 11,792 22,893
Depósitos en banca directa 7,883 2,645 10,528 8,350 2,503 10,853
Pasivos de operaciones con ABS 4,864 2,304 7,168 4,114 1,875 5,989
Pasivos de arrendamientos financieros 39 256 295 40 245 285
Préstamos y otros pasivos financieros 620 581 1,201 502 714 1,216
39,364 54,400 93,764 36,290 50,399 86,689

36
16. Instrumentos Financieros
La tabla E.22 muestra los valores en libro y valores ra-
zonables de los instrumentos financieros del Grupo. El
valor razonable de un instrumento financiero es el precio
que se recibiría por vender un activo o pagado para trans-
ferir un pasivo en una transacción ordenada entre partici-
pantes del mercado en la fecha de valuación. Debido a
los diversos factores que los influencian, los valores razo-
nables reportados solo pueden considerarse como indi-
cadores de los precios que realmente pueden conseguir-
se en el mercado.
E.22
Valor en libros y valor razonable de instrumentos financieros
31 marzo, 2015
31 de diciembre,
2014
Valor en libros
Valor razo-nable
Valor en libros
Valor razo-nable
En millones de euros
Activos financieros
Cuentas por cobrar por servicios financieros 68,247 68,595 61,679 62,057
Cuentas por cobrar comerciales 9,413 9,413 8,634 8,634
Efectivo y equivalentes 12,219 12,219 9,667 9,667
Títulos de deuda negociables
Activos financieros disponibles para venta 6,751 6,751 6,634 6,634
Otros activos financieros
Activos financieros disponibles para venta 2,813 2,813 2,269 2,269
instrumentos de capital valuados a valor razonable 2,179 2,179 1,647 1,647
instrumentos financieros registrados a costo 634 634 622 622
Activos financieros registrados a su valor razonable en el estado de resultados 161 161 97 97
Instrumentos financieros derivados utilizados en la contabilidad de coberturas 1,192 1,192 1,296 1,296
Otras cuentas por cobrar y otros activos 2,468 2,468 2,325 2,325
103,264 103,612 92,601 92,979
Pasivos financieros
Pasivos de financiamiento 93,764 95,237 86,689 88,043
Cuentas por pagar comerciales 12,293 12,293 10,178 10,178
Otros pasivos financieros
Pasivos financieros registrados a su valor razonable en el estados de resultados mediante
utilidades o pérdidas 329 329
359 359
Instrumentos financieros derivados utilizados en la contabilidad de coberturas 6,023 6,023 2,317 2,317
Otros pasivos financieros varios 8,491 8,491 8,030 8,030
120,900 122,373 107,573 108,927

E | Interim Consolidated Financial Statements
37
Los valores razonables de los instrumentos financieros se
calcularon con base en la información de mercado dispo-
nible a la fecha del estado de situación financiera, y utili-
zando los siguientes métodos y premisas:
Títulos de deuda negociables y otros activos financie-ros.
Los activos financieros disponibles para su venta inclu-
yen:
- Instrumentos de deuda y capital valuados a su valor
razonable. La valuación de estos instrumentos se basó
en sus precios de cotización de mercado al 31 de mar-
zo. En otros casos, sus valores razonables se calculan
a partir de datos observables directa o indirectamente
en mercados activos. Los instrumentos de capital me-
didos a valor razonable se componen, principalmente,
de las inversiones en Nissan Motor Co., Ltd. (Nissan) y
Renault SA (Renault).
- participaciones de capital valuadas al costo; no fue po-
sible determinar los valores razonables de estos ins-
trumentos porque no se disponía de información sobre
sus precios de mercado o sus valores razonables de
mercado. Estas participaciones de capital se compo-
nen de inversiones en compañías que no cotizan en
bolsa, respecto a las cuales no se disponía de datos
objetivos de deterioro a la fecha del estado de situación
financiera, y cuyos valores razonables no es posible de-
terminar de una manera suficientemente fiable. Se
asume que sus valores razonables son iguales a sus
valores netos en libros. Daimler no pretende vender
sus participaciones de capital que se presentan al 31
de marzo de 2015.
Activos financieros registrados a su valor razonable en los
estados de resultados incluyen los instrumentos financie-
ros derivados no utilizados en la contabilidad de cobertu-
ras. Estos instrumentos financieros y los instrumentos
financieros derivados utilizados en la contabilidad de co-
berturas incluyen lo siguiente:
- Contratos de cobertura de riesgos cambiarios de deri-
vados. Los valores razonables de los contratos de futu-
ros de divisas y de los intercambios de tasas de interés
en divisas cruzadas (“swaps”) se determinan en función
de los flujos de efectivo futuros estimados, desconta-
dos, a las tasas de interés de mercado aplicables a la
vigencia restante de los instrumentos financieros. Los
futuros de divisas se valuaron con base en los precios
de cotización o en modelos de cotización de opciones
que utilizan datos del mercado.
- Contratos de cobertura de tasas de interés de deriva-
dos. Los valores razonables de los instrumentos de co-
bertura de tasas de interés por ejemplo intercambios de
tasas de interés y contratos de futuros de tasas de inte-
rés) se calculan en función de los flujos de efectivo futu-
ros estimados, descontados, a las tasas de interés de
mercado aplicables a la vigencia restante de los instru-
mentos financieros.
- Contratos de cobertura de "commodities". Los valores
razonables de los contratos de este tipo (por ejemplo
contratos de futuros de "commodities") se calculan con
base en los precios de referencia circulantes de las
primas y descuentos de futuros
Otros pasivos financieros. Los pasivos financieros son
registrados a su valor razonable en los estados de resul-
tados e incluyen los instrumentos financieros derivados
no utilizados en la contabilidad de coberturas. Para mayor
información sobre estos instrumentos financieros y los
instrumentos financieros derivados utilizados en la conta-
bilidad de coberturas, ver las notas de las secciones rela-
tivas a los "títulos de deuda y otros activos financieros".
Al final de cada período de reporte, Daimler revisa la ne-
cesidad de clasificación entre jerarquías de valor razona-
ble.
Para determinar el riesgo crediticio de instrumentos finan-
cieros derivados que se asignaron a la jerarquía de valor
Nivel 2, aplica la excepción descrita en la NIIF 13.48 (car-
teras administradas con base en exposición neta).

38
La tabla E.23 muestra la clasificación de los activos y pasivos financieros valuados a su valor razonable de acuerdo
con la jerarquía de valor razonable (en términos de la NIIF 13).
E.23
Jerarquía de valor razonable de activos y pasivos financieros valuados a valor razonable
31 marzo, 2015 31 diciembre, 2014
Total Nivel 11 Nivel 22 Nivel 33 Total Nivel 11 Nivel 22 Nivel 33
En millones de euros
Activos valuados a valor razonable
Activos financieros disponibles para venta 8,930 6,881 2,049 - 8,281 6,158 2,123 -
instrumentos de capital 2,179 2,173 6 - 1,647 1,642 5 -
valores de deuda negociables 6,751 4,708 2,043 - 6,634 4,516 2,118 -
Activos financieros registrados a valor razonable en el es-tado de resultados 161 - 161 - 97 - 97 -
Instrumentos financieros derivados utilizados en conta-bilidad de coberturas 1,192 - 1,192 -
1,296 - 1,296 -
10,283 6,881 3,402 - 9,674 6,158 3,516 -
Pasivos valuados a su valor razonable
Pasivos financieros registrados a valor razonable en el estado
de resultados 329 - 329 - 359 - 359 -
Instrumentos financieros derivados utilizados en la contabilidad
de coberturas 6,023 - 6,023 -
2,317 - 2,317 -
6,352 - 6,352 - 2,676 - 2,676 -
1 La valuación del valor razonable se basó en los precios de cotización (no ajustados) en mercados activos para activos o pasivos idénticos. 2 La valuación del valor razonable se basó en datos sobre el activo o el pasivo observables en mercados activos, ya sea directamente (es decir, los precios) o indirectamente (es
decir, derivados de los precios). 3 La valuación del valor razonable se basó en datos sobre el activo o el pasivo no observables en el mercado.
17. Información por segmentos
La siguiente es la información por segmentos para los períodos de tres meses que concluyeron el 31 marzo, 2015 y 31
marzo, 2014:
E.24
Información por segmentos
Mercedes-Benz Au-tomóviles
Daimler Camiones
Mercedes-Benz Vans
Daimler Autobuses
Daimler Servicios
Financieros Total de los segmentos
Concilia-ción
Grupo Daimler
En millones de euros
T1 2015
Ventas 18,818 7,955 2,323 862 4,278 34,236 - 34,236
Ventas entre segmentos 691 459 92 15 271 1,528 -1,528 -
Ventas totales 19,509 8,414 2,415 877 4,549 35,764 -1,528 34,236
Utilidad (EBIT) por segmento 1,841 472 215 34 409 2,971 -65 2,906
Utilidades y pérdidas en las in-
versiones registradas con el mé-
todo de participación 115 -5 -2 - -1 107 41 148
Gastos derivados de la creación
de provisiones y variaciones en
las tasas de descuento -58 -34 -11 -5 - -108 -4 -112
En millones de euros
Mercedes-Benz Au-tomóviles
Daimler Camiones
Mercedes-Benz Vans
Daimler Autobuses
Daimler Servicios
Financieros Total de los segmentos
Concilia-ción
Grupo Daimler
T1 2014
Ventas 16,327 6,621 2,123 846 3,540 29,457 - 29,457
Ventas entre segmentos 677 500 89 13 269 1,548 -1,548 -
Ventas totales 17,004 7,121 2,212 859 3,809 31,005 -1,548 29,457
Utilidad (EBIT) por segmento 1,183 341 123 53 397 2,097 -310 1,787
E | Interim Consolidated Financial Statements
39
Utilidades y pérdidas en las in-
versiones registradas con el mé-
todo de participación 24 -2 1 - -3 20 2 22
Gastos derivados de la creación
de provisiones y variaciones en
las tasas de descuento -43 -16 -5 -1 - -65 -1 -66
Conciliación. La conciliación de la utilidad total (EBIT) de
los segmentos antes del impuesto sobre la renta se
muestra en la tabla E.25.
La conciliación incluye rubros corporativos de los que es
responsable la sede operativa. Las operaciones entre
segmentos se eliminan en el contexto de la consolidación
y los importes eliminados se incluyen en la conciliación.
Durante el año anterior, otras partidas corporativas inclu-
yen gastos por la cobertura del precio de las acciones de
Tesla por €161 millones y de la valuación de la opción de
venta RRPSH por €118 millones, que se reportan dentro
de otros gastos financieros, netos.
E.25
Conciliación con cifras del Grupo
T1 2015 T1 2014
En millones de euros
Utilidad (EBIT) total del segmento 2,971 2,097
Inversiones registradas a través del mé-todo de participación1 41 2
Otras partidas corporativas -121 -316
Eliminaciones 15 4
EBIT del grupo 2,906 1,787
Amortización de préstamos capitaliza-dos 2 -2 -2
Ingresos por intereses 51 34
Gastos por intereses -154 -169
Utilidad antes de impuestos 2,801 1,650
1 Incluye la participación proporcional del Grupo en la utilidad y pérdida de BAIC Motor.
2 La amortización de costos de empréstitos capitalizados no está incluida en la medi-ción del desempeño interno de la “EBIT”, pero está incluida en el costo de ventas.
18. Relaciones con partes relacionadas
Se consideran partes relacionadas a las compañías aso-
ciadas, operaciones conjuntas, negocios conjuntos y sub-
sidiarias no consolidadas, así como a personas que ejer-
cen una influencia significativa en la política comercial y
financiera del Grupo Daimler. Esta última categoría inclu-
ye a personas en puestos clave y sus familiares cerca-
nos. En Grupo Daimler, estas personas son miembros
del Consejo de Administración y del Consejo de Supervi-
sión
La mayoría de los bienes y servicios suministrados en el
curso ordinario de las operaciones entre el Grupo y partes
relacionadas incluye operaciones con compañías asocia-
das, operaciones conjuntas y negocios conjuntos, y se
muestran en la tabla E.26.
Compañías asociadas. Gran parte de la venta y adquisi-
ción de bienes y servicios a/de compañías asociadas pro-
viene de las relaciones comerciales con Beijing Benz Au-
tomotive Co., Ltd. (BBAC). La Nota 11 ofrece información
adicional sobre BBAC.
Durante el primer trimestre de 2014, también se llevaron
a cabo operaciones importantes de bienes y servicios con
Rolls-Royce Power Systems AG (RRPS), que es una
subsidiaria de RRPSH. RRPSH se vendió en el tercer
trimestre de 2014.
Las adquisiciones de bienes y servicios que se muestran
en la tabla E.26 fueron principalmente de MBtech
Group GmbH & Co. KGaA (MBtech Group). MBtech
Group desarrolla, integra y somete a pruebas componen-
tes, sistemas, módulos y vehículos a nivel mundial.
Operaciones conjuntas. Se efectuaron ventas importan-
tes de bienes y servicios con Fujian Benz Automotive Co.
Ltd. (FBAC) así como con Mercedes-Benz Trucks Vostok
OOO y Fuso Kamaz Trucks Rus Ltd., operaciones con-
juntas establecidas con Kamaz OAO, otra de las compa-
ñías asociadas del Grupo.
En 2014, Daimler otorgó una garantía de responsabilidad
separada y conjunta a bancos externos que otorgaron un
crédito sindicado para la operación conjunta Shenzen
BYD Daimler New Technology Co. Ltd. (SBDNT). La ga-
rantía estipula que Daimler tiene un valor total aproxima-
do de RMB 750 millones (aproximadamente €112 millo-
nes al 31 marzo, 2015) y representa la participación del
Grupo en el crédito otorgado a SBDNT con base en su
participación del 50% en el capital del SBDNT. Al 31 de
marzo de 2015, se han utilizado €64 millones de este
crédito.
En relación con su participación del 45% en el capital del
Toll Collect GmbH, Daimler ha emitido garantías que no
se muestran en la tabla E.26 (€100 millones al 31 de
marzo de 2015 y al 31 de diciembre de 2014).
Negocios conjuntos. Los negocios conjuntos están prin-
cipalmente relacionados con transacciones comerciales
importantes con Beijing Mercedes-Benz Sales Service
Co., Ltd. (BMBS), que ofrece servicios de asesoría y de-
más servicios relacionados con mercadotecnia, ventas y
distribución en el mercado chino.

40
E.26
Transacciones con partes relacionadas
Ventas de bienes y servicios y otros ingresos
Compra de bienes y servicios
y otros gastos Cuentas por cobrar Cuentas por pagar
T1 2015 T1 2014 T1 2015 T1 2014 31 marzo,
2015 31 dic.,
2014 31 marzo,
2015 31 dic.,
2014
En millones de euros
Compañías asociadas 656 503 81 70 646 764 58 65
BBAC 611 381 33 8 616 726 33 16
Operaciones conjuntas 128 154 20 27 163 195 4 6
Negocios conjuntos 3 2 59 45 46 44 19 22