Embed Size (px)
Citation preview
8/12/2019 Dailycalls (2)
http://slidepdf.com/reader/full/dailycalls-2 1/15
ICICI Securities Ltd. | Retail Equity Research
Market Outlook
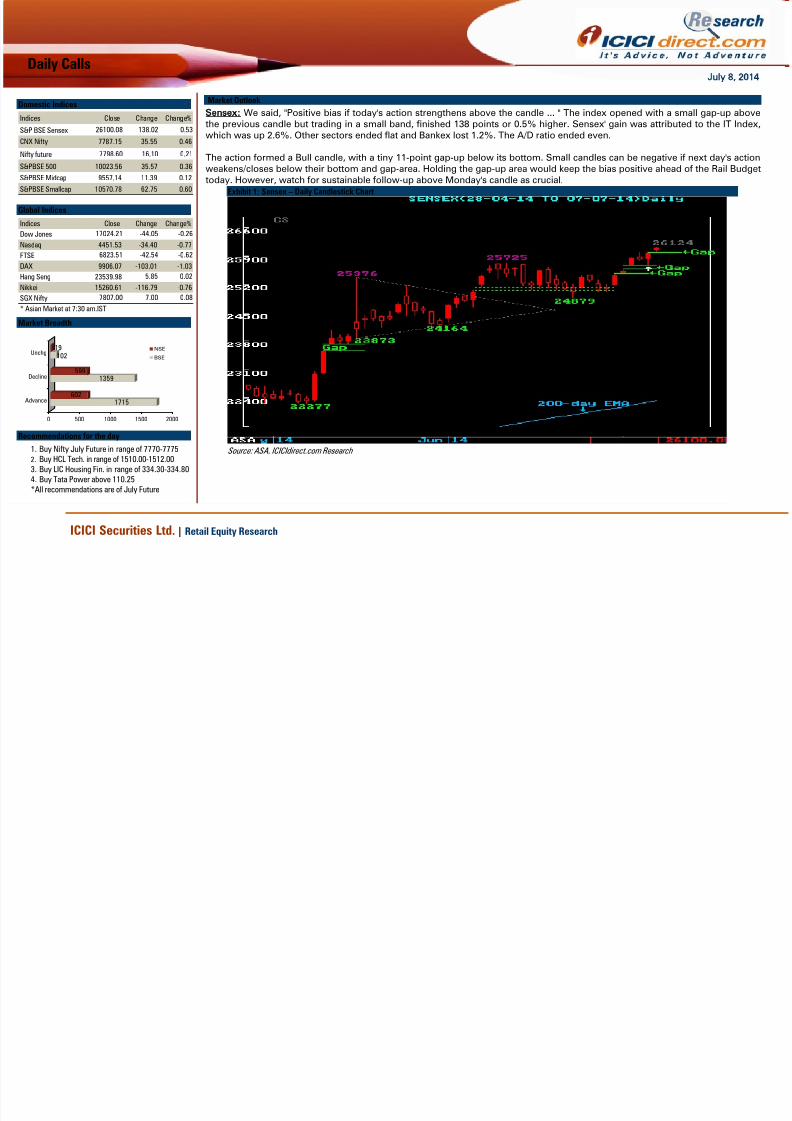
Sensex: We said, "Positive bias if today's action strengthens above the candle ... " The index opened with a small gap-up above
the previous candle but trading in a small band, finished 138 points or 0.5% higher. Sensex' gain was attributed to the IT Index,
which was up 2.6%. Other sectors ended flat and Bankex lost 1.2%. The A/D ratio ended even.
The action formed a Bull candle, with a tiny 11-point gap-up below its bottom. Small candles can be negative if next day's action
weakens/closes below their bottom and gap-area. Holding the gap-up area would keep the bias positive ahead of the Rail Budget
today. However, watch for sustainable follow-up above Monday's candle as crucial.
Exhibit 1: Sensex – Daily Candlestick Chart
Source: ASA, ICICIdirect.com Research
Domestic Indices
Indices Close Change Change%
S&P BSE Sensex 26100.08 138.02 0.53
CNX Nifty 7787.15 35.55 0.46
Nifty future 7798.60 16.10 0.21
S&PBSE 500 10023.56 35.57 0.36
S&PBSE Midcap 9557.14 11.39 0.12
S&PBSE Smallcap 10570.78 62.75 0.60 Global Indices
Indices Close Change Change%
Dow Jones 17024.21 -44.05 -0.26
Nasdaq 4451.53 -34.40 -0.77
FTSE 6823.51 -42.54 -0.62
DAX 9906.07 -103.01 -1.03
Hang Seng 23539.98 5.85 0.02
Nikkei 15260.61 -116.79 -0.76
SGX Nifty 7807.00 7.00 0.08
* Asian Market at 7:30 am.IST
Market Breadth
1715602
1359599
10219
0 500 1000 1500 2000
Advance
Decline
Unchg NSE
BSE
Recommendations for the day
1. Buy Nifty July Future in range of 7770-7775
2. Buy HCL Tech. in range of 1510.00-1512.00
3. Buy LIC Housing Fin. in range of 334.30-334.80
4. Buy Tata Power above 110.25
*All recommendations are of July Future
Daily CallsJuly 8 2014
8/12/2019 Dailycalls (2)
http://slidepdf.com/reader/full/dailycalls-2 2/15
ICICI Securities Ltd. | Retail Equity Research Page 2
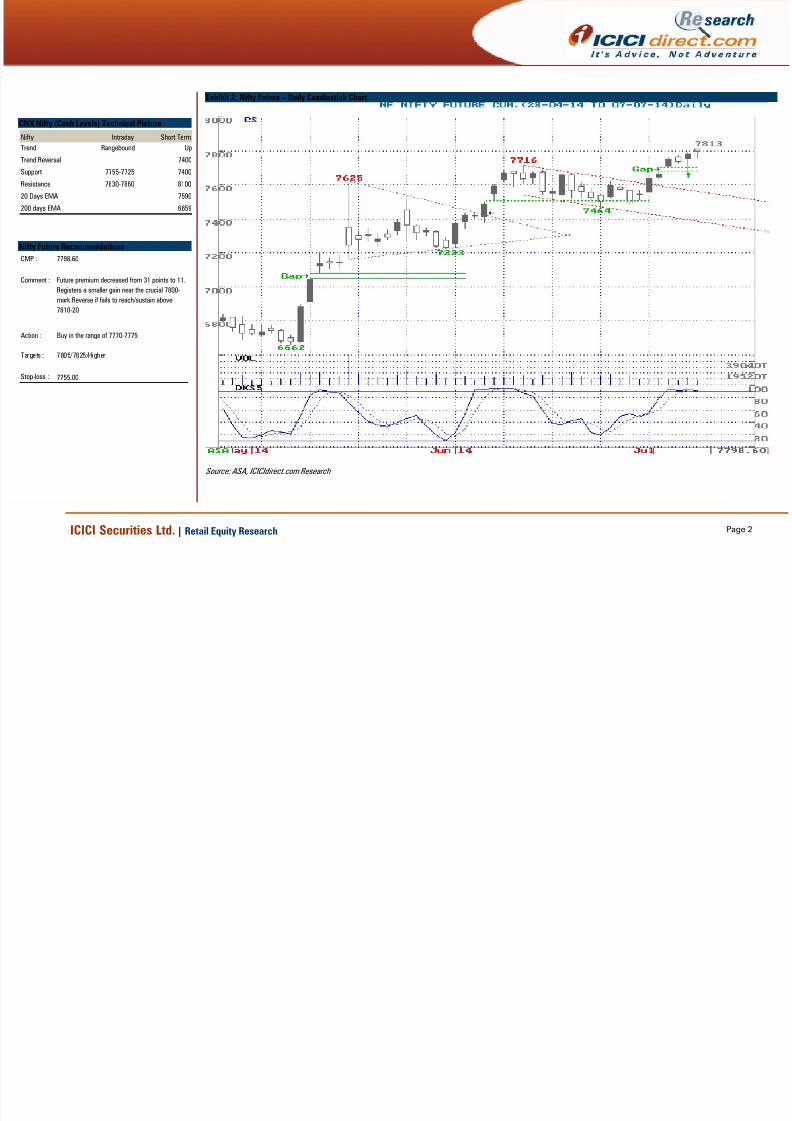
Exhibit 2: Nifty Future – Daily Candlestick Chart
Source: ASA, ICICIdirect.com Research
CNX Nifty (Cash Levels) Technical Picture
Nifty Intraday Short Term
Trend Rangebound Up
Trend Reversal 7400
Support 7755-7725 7400
Resistance 7830-7860 8100
20 Days EMA 7590
200 days EMA 6659
Nifty Future Recommendations
CMP :
Comment :
Action :
Targets : 7805/7825/Higher
Stop-loss : 7755.00
Future premium decreased from 31 points to 11.
Registers a smaller gain near the crucial 7800-mark.Reverse if fails to reach/sustain above
7810-20
Buy in the range of 7770-7775
7798.60

8/12/2019 Dailycalls (2)
http://slidepdf.com/reader/full/dailycalls-2 3/15
ICICI Securities Ltd. | Retail Equity Research Page 3
Trend Scanner
Positive Trends
Scrip Name Close % Change 10-day SMA Delivery (%)
Bajaj Auto Ltd 2302.70 0.15 2299.78 66.90
MAX India Ltd 308.05 4.76 294.79 57.77
LIC Housing Finance Ltd 333.45 1.89 325.26 61.57
HCL Technologies Ltd 1508.50 1.90 1468.37 62.77
PVR Ltd 668.95 0.18 664.64 47.19
NTPC Ltd 161.35 1.77 156.41 49.91
Overbought Stocks Oversold Stocks
Stocks rising for 5 days & stochastic overbought Stocks falling for 5 days & stochastic oversold
Scrip Name LTP Stochastic Scrip Name LTP Stochastic
Bharat Forge 667.85 85.02 Bajaj Hind 29.9 18.87IOB 83 80.68
UCO Bank 111.9 89.3
Candlestick Patterns
Bullish Reversal Pattern Bearish Reversal Pattern
Bullish Engulfing Bearish Engulfing
Scrip Name Close Scrip Name Close
SKF India 1153.5 Vijaya Bank 55.7
Jubilant 203.5
Bullish Candle Bearish Candle
Aditya Birla Nuvo 1433.0 Mcdowells 2418.0
Bharti Airtel 345.1 JSW Steel 1236.5
Infosys 3341.0 Ultratech Cement 2552.0
BEML 815.7
LIC Housing Finance 333.5
IDFC 142.1
NTPC 161.4
HCL Technology 1508.0
Note: For Candlestick pattern description refer towards the end of
the report.
Stocks hitting 52 week high
Scrip Name LTPAban 856.8
BEL 2271.5
DHFL 408.05
HDFC Bank 841.75
IRB 265.75
TCS 2488
Global Currencies
Spot Close Prev.close % Chg
Rupee (|) 60.015 59.735 -0.47
Dollar Index 80.207 80.218 -0.02
Euro 1.361 1.361 0.01
British Pound 1.715 1.713 0.11
Japanese Yen 101.770 101.860 0.09
Australian ($) 0.939 0.937 0.16
Swiss Franc 0.893 0.894 0.02 Global Treasury Yields
Closing Yield (%) Previous Yield (%)
India 10 year 8.69 8.69
US 10 Year 2.62 2.61
EURO 10 Year 1.25 1.27GBP 10 Year 2.73 2.76
JPY 10 Year 0.56 0.57
Commodities US Dollar
Close Prev. Close %Chg
Gold 1319.21 1319.94 -0.06
Copper 21.0365 21.0519 -0.09
Brent Crude 110.10 110.24 -0.13
Institutional Activity
Cash Segment (| Cr) FII DII
7-Jul-14 198.6 -85.2
4-Jul-14 943.2 -853.1
3-Jul-14 950.8 -624.2
2-Jul-14 1,290.7 -407.7
1-Jul-14 856.4 -774.7

8/12/2019 Dailycalls (2)
http://slidepdf.com/reader/full/dailycalls-2 4/15
ICICI Securities Ltd. | Retail Equity Research Page 4
Stock recommendations for the day
Exhibit 3: HCL Technologies (HCLTEC) Daily Bar Chart
Source: Bloomberg, ICICIdirect.com Research
HCL Technologies (HCLTEC) July Future
CMP 1515.95
Comment :
Action :
Targets : 1531/1541/Higher
Stop-loss : 1499.50
Trendline breakout in the daily chart and price
taking support at the 13 days EMA and 14
periods RSI giving buy signal in the daily chart
Buy in the range of 1510.00-1512.00
Price taking support near 13 days EMA in the daily chart and trendline
breakout signalling continuation of the bullish trend in the short term
RSI in rising trend taking support at its nine period’s average in the daily chart thus
validates up trend in price
13 days EMA

8/12/2019 Dailycalls (2)
http://slidepdf.com/reader/full/dailycalls-2 5/15
ICICI Securities Ltd. | Retail Equity Research Page 5
Exhibit 4: LIC Housing Finance (LICHF) Daily Candlestick Chart
Source: Bloomberg , ICICIdirect.com Research
LIC Housing Finance(LICHF) July Future
CMP 335.55
Comment :
Action :
Targets : 340/343/Higher
Stop-loss : 331.50
Recent trading range breakout in the daily chart
with rise in volume and price taking support at
the 21 days EMA in the daily chart
Buy in the range of 334.30-334.80
Recent trading range breakout in the daily chart and price rise with rise in
volume indicating further upsides in coming sessions
Price rise with rise in volume suggesting larger participation in the
direction of trend

8/12/2019 Dailycalls (2)
http://slidepdf.com/reader/full/dailycalls-2 6/15
ICICI Securities Ltd. | Retail Equity Research Page 6
Exhibit 5: Tata Power (TATPOW) Daily Candlestick Chart
.
Source: Bloomberg , ICICIdirect.com Research
Tata Power (TATPOW) July Future
CMP 110.00
Comment :
Action :
Targets : 112.30/113.50/Higher
Stop-loss : 109.10
Trendline breakout with a bulllish gap up price
action in the daily chart and taking support at the21 days EMA in the daily chart and RSI giving
buy signal in the daily chart
Buy above 110.25
Trendline breakout with a rising gap in the daily chart and price
taking support at the 21 days EMA signalling bullish trend after
recent sideways corrective price action
RSI giving buy signal taking support at its nine period’s average in the daily chart
21. Days EMA

8/12/2019 Dailycalls (2)
http://slidepdf.com/reader/full/dailycalls-2 7/15
ICICI Securities Ltd. | Retail Equity Research Page 7
Previous Day’s PerformanceScrip Product Strategy Recommended Price Targets SL Gain/Loss %* Comment
Nifty Future Buy In range of 7755-7760 7790/7810/+ 7740.00 - No trade
HDFC Bank Future Buy In range of 864.50-865.50 876/882/+ 858.50 -0.75 Stoploss triggered
Petronet LNG Future Buy above 179.00 182/183.8/+ 177.20 2.70 Target 2 achieved
Jain Irrigation Future Buy In range of 128-128.50 131/132.40/+ 126.80 - No trade
* Return Opportunity
Nifty Points gained for the day: 0 points Gains over last 64 days: 147 points
Stock profits: Avg 0.98% per trade (Cum. Profits over last 64 days:75.60%)
Strike Rate for the day: 1/2 (Cum strike rate over 64 days: 77/140
NOTE: The follow-up and performance review table of the strategies indicates the profit opportunity that was available in the strategies. Individual profits may vary,
depending upon the entry and exit price and stop losses

8/12/2019 Dailycalls (2)
http://slidepdf.com/reader/full/dailycalls-2 8/15
ICICI Securities Ltd. | Retail Equity Research Page 8
Support and Resistance Table (Cash Levels)
SCRIP CLOSE S1 S2 S3 R1 R2 R3 TREND
SENSEX 26100.08 26086.1 26053.4 26020.7 26151.5 26239.7 26327.95 +ve
NIFTY 7787.15 7782.60 7773.40 7764.15 7801.05 7826.10 7851.15 +ve
ACC 1450.85 1447.05 1441.55 1424.95 1458.05 1463.55 1480.15 Neutral
ADANI ENTER. 498.15 493.45 490.35 487.20 498.40 500.90 503.35 -ve
ADANI POWER 65.50 65.35 65.15 64.65 65.75 65.95 66.40 Neutral
ADITYA BIRLA 1430.95 1425.55 1414.45 1403.35 1447.80 1456.65 1465.55 +ve
ALLAHABAD BANK 137.60 136.00 134.80 133.65 138.15 139.20 140.30 -ve
ANDHRA BANK 99.60 98.10 97.20 96.30 99.90 100.80 101.75 -ve
APOLLO HOSPITALS 1059.05 1052.70 1047.70 1037.75 1062.70 1067.70 1077.65 Neutral
APOLLO TYRES 212.00 211.10 210.05 208.70 213.30 214.40 215.75 Neutral
ARVIND 243.10 241.00 239.55 238.10 243.45 244.70 245.90 -ve
ASHOK LEYLAND 37.15 37.00 36.55 36.15 37.85 38.10 38.40 +ve
ASIAN PAINTS 593.60 592.50 589.40 586.25 598.70 601.50 604.30 +ve
AUROBINDO PHARMA 770.55 769.90 766.75 763.60 776.25 780.65 785.05 +ve
BAJAJ AUTO 2302.70 2301.75 2291.85 2281.90 2321.60 2328.85 2336.10 +ve
BOB 865.10 857.45 852.05 846.60 867.40 872.40 877.35 -ve
BOI 301.50 298.80 296.40 294.00 301.95 303.50 305.05 -ve
BATA INDIA 1324.65 1311.85 1302.55 1293.25 1324.85 1331.35 1337.90 -ve
BHARAT FORGE 667.45 659.25 656.05 652.80 668.10 672.55 676.95 -ve
BPCL 593.25 585.45 581.45 577.45 593.20 597.10 601.00 -ve
BHARTI AIRTEL 344.45 344.00 342.05 340.15 347.85 349.90 351.95 +ve
BIOCON 538.00 531.10 527.70 524.30 538.00 541.50 544.95 -ve
CAIRNS INDIA 362.50 359.05 358.15 357.25 363.00 364.95 366.95 -ve
CANARA BANK 445.00 441.75 438.50 435.30 445.95 448.05 450.15 -ve
CENTURY TEXT. 621.20 615.85 612.25 608.60 621.75 624.70 627.65 -ve
CESC 779.85 774.80 763.60 752.35 797.25 810.10 822.95 +ve
CHAMBAL FERT. 62.80 62.00 61.35 60.65 63.05 63.55 64.10 -ve
CIPLA 449.65 447.25 445.00 442.10 451.75 454.00 456.90 Neutral
COAL INDIA 396.75 396.45 394.50 392.55 400.35 402.65 404.90 +ve
COLGATE PALM. 1663.80 1650.20 1639.70 1623.40 1671.25 1681.80 1698.10 Neutral
CROMPTON GREAVES 209.80 209.45 208.25 207.05 211.90 213.80 215.75 +ve
DABUR INDIA 193.30 192.90 192.00 191.15 194.65 195.30 196.00 +ve
DISH TV 62.30 61.70 61.25 60.55 62.65 63.15 63.85 Neutral

8/12/2019 Dailycalls (2)
http://slidepdf.com/reader/full/dailycalls-2 9/15
ICICI Securities Ltd. | Retail Equity Research Page 9
SCRIP CLOSE S1 S2 S3 R1 R2 R3 TREND
DIVI'S LAB. 1534.30 1517.30 1504.15 1493.40 1543.60 1556.75 1567.55 Neutral
DLF 223.25 222.45 220.70 219.00 225.95 227.15 228.40 +ve
DR.REDDY'S LAB. 2730.40 2724.35 2700.60 2676.85 2771.80 2785.80 2799.80 +ve
EXIDE IND. 158.10 155.95 154.65 153.40 158.90 160.40 161.85 -ve
FEDERAL BANK 126.65 125.30 124.25 123.25 127.15 128.05 129.00 -ve
FUTURE RETAIL 138.00 137.90 136.45 135.00 140.80 141.85 142.85 +ve
GAIL 461.05 456.15 453.25 450.30 461.80 464.60 467.40 -ve
GLAXO SMITH.C.H. 4893.45 4873.15 4816.90 4760.65 4985.65 5036.60 5087.60 +ve
GLENMARK PHARMA. 589.45 583.35 576.25 569.15 590.55 594.15 597.75 -ve
GMR INFRA. 31.45 31.10 30.85 30.60 31.55 31.75 32.00 -ve
GODREJ CONSUMER 815.55 815.35 811.85 808.35 822.35 824.60 826.85 +ve
GODREJ IND. 368.00 367.55 364.50 361.45 373.65 376.20 378.75 +ve
GRASIM 3363.90 3338.35 3319.45 3300.60 3369.80 3385.50 3401.25 -ve
AMBUJA CEMENT 223.60 221.25 219.45 217.60 223.70 224.95 226.15 -ve
HAVELL'S INDIA 1224.30 1222.90 1216.65 1210.45 1235.35 1246.00 1256.60 +ve
HCL TECH 1508.50 1503.50 1494.25 1485.05 1522.00 1526.50 1531.05 +ve
HDFC BANK 840.45 830.65 824.65 818.70 843.05 849.25 855.50 -ve
HDFC 1020.60 1018.35 1013.05 1007.80 1028.90 1034.55 1040.15 +ve
HERO MOTO 2615.85 2612.60 2601.10 2589.60 2635.55 2647.65 2659.80 +ve
HEXAWARE TECH. 158.75 158.05 156.65 155.25 160.85 162.40 164.00 +ve
HINDALCO 174.50 174.35 173.40 172.45 176.20 177.10 177.95 +ve
HIND. UNILEVER 627.60 626.45 623.55 620.65 632.25 635.15 638.05 +ve
HPCL 408.40 403.70 399.80 395.90 410.10 413.25 416.45 -ve
HINDUSTAN ZINC 165.60 163.90 162.85 161.85 165.75 166.70 167.65 -ve
HDIL 99.35 97.30 96.65 96.00 100.10 101.50 102.90 -ve
ICICI BANK 1451.35 1439.45 1431.45 1423.45 1452.75 1459.40 1466.10 -ve
IDBI 106.90 105.75 105.10 104.40 107.30 108.10 108.85 -ve
IDEA CELLULAR 136.60 136.40 135.90 135.35 137.45 138.15 138.85 +ve
NSE INFRA DEV FINANC 142.50 141.80 140.10 138.35 145.25 146.75 148.25 +ve
IFCI 41.20 41.25 41.00 40.70 41.80 42.10 42.40 +ve
ORACLE FIN. 3218.10 3214.80 3203.85 3192.90 3236.75 3251.75 3266.75 +ve
INDUSIND BANK 555.95 549.80 544.60 539.40 558.20 562.35 566.55 -ve
INDIA CEMENTS 114.05 112.45 111.95 111.50 114.40 115.35 116.35 -ve
INDRAPRASTHA GAS 379.40 378.65 370.60 362.50 394.85 397.70 400.60 +ve

8/12/2019 Dailycalls (2)
http://slidepdf.com/reader/full/dailycalls-2 10/15
ICICI Securities Ltd. | Retail Equity Research Page 10
SCRIP CLOSE S1 S2 S3 R1 R2 R3 TREND
IOC 342.25 338.65 336.30 333.95 343.15 345.40 347.65 -ve
IOB 83.10 82.20 81.60 81.00 83.45 84.10 84.75 -ve
IB REAL ESTATE 93.10 91.95 91.40 90.80 93.50 94.30 95.05 -ve
INFOSYS 3345.45 3334.95 3307.95 3280.95 3388.95 3407.05 3425.15 +ve
IRB INFRA. 267.70 266.50 263.70 260.90 272.10 275.15 278.20 +ve
ITC 334.80 332.60 331.00 329.70 335.70 337.30 338.60 Neutral
JAIPRAKASH ASS. 73.30 73.30 72.80 72.25 74.40 75.10 75.80 +ve
J.P.POWER VENT. 22.50 22.25 22.00 21.80 22.55 22.70 22.90 -ve
JAIN IRRIGATION 131.75 131.25 130.20 129.15 133.35 135.60 137.80 +ve
JINDAL ST&POW 327.90 327.75 326.00 324.20 331.30 333.75 336.15 +ve
JSW ENERGY 83.20 82.25 81.75 81.30 83.20 83.70 84.20 -ve
NSE JSW STEEL 1233.50 1214.90 1205.25 1195.65 1239.20 1251.35 1263.50 -ve
JUBILANT FOOD 1319.85 1322.10 1308.85 1295.60 1348.55 1354.95 1361.30 +ve
KARNATAKA BANK 144.35 144.50 143.90 143.30 145.70 146.60 147.50 +ve
KOTAK MAH.BANK 870.90 854.55 850.20 845.85 870.00 877.75 885.50 -ve
L & T 1749.35 1744.45 1740.40 1731.25 1752.60 1756.65 1765.75 Neutral
LIC HOUSING 333.45 332.55 330.20 327.85 337.20 339.85 342.50 +ve
NSE LUPIN 1078.10 1068.85 1063.40 1057.90 1080.05 1085.65 1091.25 -ve
M & M 1239.55 1238.35 1232.90 1227.45 1249.25 1255.75 1262.25 +ve
MARUTI SUZUKI 2638.85 2628.65 2618.30 2608.90 2649.35 2659.70 2669.10 Neutral
UNITED SPIRITS 2401.85 2364.75 2345.90 2327.00 2412.10 2435.75 2459.40 -ve
MCLEOD RUSSEL 317.70 315.45 314.10 312.75 318.30 319.70 321.10 -ve
M&M FIN.SERV. 272.80 273.15 271.95 270.80 275.50 277.60 279.75 +ve
MRF 23620.85 23487.25 23387.90 23288.55 23647.20 23727.20 23807.20 -ve
ADANI PORTS SEZ 280.70 280.25 278.60 276.95 283.55 285.65 287.80 +ve
NSE NHPC 27.15 26.90 26.70 26.55 27.20 27.35 27.50 -ve
NMDC 182.60 180.40 179.35 178.30 182.90 184.15 185.35 -ve
NSE NTPC 161.35 160.90 159.90 158.95 162.85 164.05 165.25 +ve
ONGC 415.55 411.10 407.90 404.65 416.95 419.90 422.85 -ve
OBC 318.85 316.35 313.85 311.40 319.55 321.20 322.80 -ve
PETRONET LNG 183.05 182.45 181.00 179.55 185.40 187.75 190.15 +ve
POWER FINANCE 322.55 322.70 321.20 319.70 325.70 328.65 331.60 +ve
POWER GRID 146.05 145.85 145.15 144.40 147.30 149.00 150.70 +ve
POWER TRADING 97.85 96.85 95.85 94.85 98.05 98.65 99.25 -ve

8/12/2019 Dailycalls (2)
http://slidepdf.com/reader/full/dailycalls-2 11/15
ICICI Securities Ltd. | Retail Equity Research Page 11
SCRIP CLOSE S1 S2 S3 R1 R2 R3 TREND PNB 969.85 962.20 954.10 946.00 971.75 976.50 981.30 -ve
RANBAXY 541.85 541.35 537.00 532.65 550.05 552.55 555.05 +ve
RCOM 147.15 146.85 145.75 144.60 149.10 150.55 151.95 +ve
REL. CAPITAL 651.75 646.40 641.35 636.30 652.80 656.00 659.25 -ve
RELIANCE INFRA. 801.80 800.90 796.50 792.10 809.65 816.75 823.80 +ve
RELIANCE 1027.20 1019.80 1011.45 1003.05 1027.80 1031.80 1035.80 -ve
RELIANCE POWER 109.20 108.70 108.25 107.40 109.50 109.95 110.80 Neutral
REC 380.80 380.25 378.15 376.05 384.45 387.85 391.20 +ve
SAIL 93.65 92.85 92.25 91.70 94.00 94.55 95.10 -ve
SESA GOA 307.65 307.60 306.15 304.70 310.50 312.15 313.85 +ve
SHRIRAM TRANS. 959.50 960.45 955.65 950.80 970.05 977.55 985.05 +ve
SIEMENS 983.80 975.60 967.65 959.70 985.00 989.70 994.45 -ve
SBI 2684.70 2668.55 2654.90 2641.20 2687.90 2697.60 2707.30 -ve
SUN PHARMA 723.50 723.50 715.30 707.05 739.95 742.25 744.50 +ve
SUN TV 470.35 466.30 463.55 459.30 471.80 474.60 478.80 Neutral
SYNDICATE BANK 172.20 169.60 167.75 165.90 172.50 173.95 175.40 -ve
TATA CHEMICALS 348.55 345.55 341.70 337.80 349.00 350.75 352.45 -ve
TATA MOTOR DVR 313.80 311.40 309.55 307.10 315.10 316.95 319.40 Neutral
TATA MOTORS 478.85 477.90 475.95 474.00 481.85 484.45 487.05 +ve
TATA POWER 111.10 110.85 110.25 109.65 112.05 113.50 114.95 +ve
TATA GLOBAL BEV. 167.05 165.95 164.65 163.35 167.40 168.15 168.90 -ve
TCS 2488.55 2477.10 2455.20 2433.30 2520.90 2527.00 2533.15 +ve
TECH MAHINDRA 2137.30 2136.20 2128.20 2120.20 2152.15 2160.45 2168.70 +ve
TATA STEEL 536.05 532.15 528.70 525.25 536.80 539.10 541.45 -ve
TITAN IND. 357.40 355.75 353.65 351.35 359.85 361.90 364.25 Neutral
UCO BANK 112.35 111.00 110.10 109.25 112.55 113.35 114.15 -ve
ULTRATECH CEMENT 2559.90 2533.30 2517.30 2501.30 2567.25 2584.20 2601.20 -ve
UBI 223.25 220.55 218.60 216.60 224.15 225.95 227.70 -ve
UNITED BREW. 723.85 722.25 717.75 713.25 731.25 736.40 741.60 +ve
UNITED PHOSPH. 342.25 338.20 332.80 327.45 343.75 346.55 349.35 -ve
UNITECH 32.30 31.70 31.45 31.20 32.45 32.80 33.20 -ve
AXIS BANK 1923.00 1911.30 1903.60 1895.90 1924.85 1931.65 1938.40 -ve
TATA COMM. 404.35 400.10 395.60 391.05 405.30 407.90 410.50 -ve
VOLTAS 217.50 217.00 215.30 213.65 220.35 222.55 224.75 +ve

8/12/2019 Dailycalls (2)
http://slidepdf.com/reader/full/dailycalls-2 12/15
ICICI Securities Ltd. | Retail Equity Research Page 12
SCRIP CLOSE S1 S2 S3 R1 R2 R3 TREND WIPRO 557.60 556.40 553.90 551.40 561.40 565.90 570.35 +ve
YES BANK 542.20 534.70 530.95 527.25 545.00 550.15 555.30 -ve
ZEE 297.05 294.30 292.15 290.00 297.70 299.40 301.10 -ve
NOTES:
• Please execute the recommendation within the levels provided in the report
• Once the recommendation is executed, it is advisable to keep strict stop loss as provided in the report
• Avoid entering into the recommendation in the first 5 minutes of trade
• If the recommendation opens near the target levels due to gap up/gap down opening, then the
recommendation is considered not initiated
• The recommendations are valid only for the day and should be squared off by the end of the day
• Only stocks in derivatives segment have been considered for daily trading
• Medium to long-term prospects of a stock does not have any bearing on the daily view Trading Portfolio allocation
• It is recommended to spread out the trading corpus in a proportionate manner between the various technical
research products.
• Please avoid allocating the entire trading corpus to a single stock or a single product segment
• Within each product segment it is advisable to allocate equal amount to each recommendation.
• For example: The ‘Daily Calls’ product carries 3 to 4 intraday recommendations. It is advisable to allocateequal amount to each recommendation

8/12/2019 Dailycalls (2)
http://slidepdf.com/reader/full/dailycalls-2 13/15
ICICI Securities Ltd. | Retail Equity Research Page 13
Recommended Trading Portfolio allocation
Allocations Return ObjectiveProducts Product wise
allocationMax allocation
in 1 stock
Number of CallsFrontline Stocks Mid-cap stocks
Duration
Daily Calls 8% 2-3% 3-4 Stocks 0.50-1% 2-3% Intraday
Short term Delivery 6% 3-5% 7-10 p.m 4-5% 7-10% Opportunity based
Weekly Calls 8% 3-5% 1-2 Stocks 5-7% 7-10% 1 Week
Weekly Technical 8% 3-5% 1-2 Stocks 5-7% 7-10% 1 Week
Monthly Call 15% 5% 2-3 Stocks 7-10% 10-15% 1 Month
Monthly Technical 15% 2-4% 5-8 Stocks 7-10% 10-15% 1 Month
Techno Funda 15% 5-10% 1-2 Stocks 10% and above 15% and above 6 Months
Technical Breakout 15% 5-10% 1-2 Stocks 10% and above 15% and above 3-6 Months
Cash in Hand 10% - - - - -
100%

8/12/2019 Dailycalls (2)
http://slidepdf.com/reader/full/dailycalls-2 14/15

8/12/2019 Dailycalls (2)
http://slidepdf.com/reader/full/dailycalls-2 15/15

![[XLS] · Web view1 2 2 2 3 2 4 2 5 2 6 2 7 2 8 2 9 2 10 2 11 2 12 2 13 2 14 2 15 2 16 2 17 2 18 2 19 2 20 2 21 2 22 2 23 2 24 2 25 2 26 2 27 2 28 2 29 2 30 2 31 2 32 2 33 2 34 2 35](https://img.pdfslide.us/doc/110x75/5aa4dcf07f8b9a1d728c67ae/xls-view1-2-2-2-3-2-4-2-5-2-6-2-7-2-8-2-9-2-10-2-11-2-12-2-13-2-14-2-15-2-16-2.jpg)


![content.alfred.com · B 4fr C#m 4fr G#m 4fr E 6fr D#sus4 6fr D# q = 121 Synth. Bass arr. for Guitar [B] 2 2 2 2 2 2 2 2 2 2 2 2 2 2 2 2 2 2 2 2 2 2 2 2 2 2 2 2 2 2 2 2 5](https://img.pdfslide.us/doc/110x75/5e81a9850b29a074de117025/b-4fr-cm-4fr-gm-4fr-e-6fr-dsus4-6fr-d-q-121-synth-bass-arr-for-guitar-b.jpg)