Embed Size (px)
DESCRIPTION
Daily PM 2.5 : Feb, 2000 – Feb., 2001 Mass: by Partisol FRM Ions: SO4, NO3, NH4, K, Na, Cl, PO4 by IC Elements: by ICP-AES and ICP-MS Carbon by TOT (O1, O2, O3, O4, EC) Organic Acids: by Capillary Electrophoresis. Sampling Schedule: 9 AM – 9 AM (reduces volatile losses?) - PowerPoint PPT Presentation
Citation preview
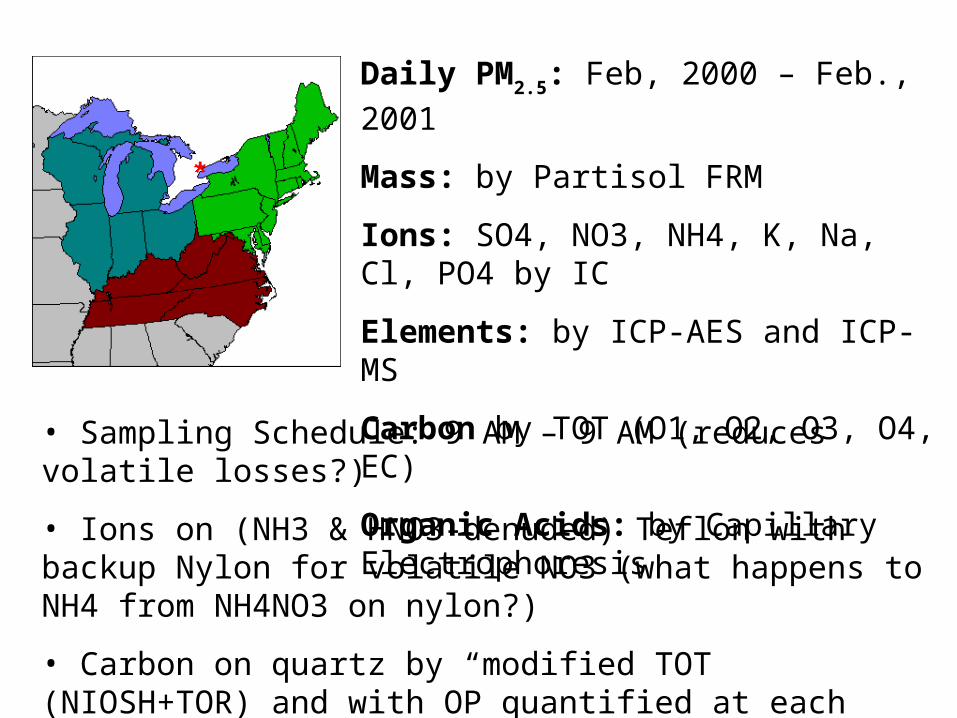
Daily PM2.5: Feb, 2000 – Feb., 2001
Mass: by Partisol FRM
Ions: SO4, NO3, NH4, K, Na, Cl, PO4 by IC
Elements: by ICP-AES and ICP-MS
Carbon by TOT (O1, O2, O3, O4, EC)
Organic Acids: by Capillary Electrophoresis
• Sampling Schedule: 9 AM – 9 AM (reduces volatile losses?)
• Ions on (NH3 & HNO3-denuded) Teflon with backup Nylon for volatile NO3 (what happens to NH4 from NH4NO3 on nylon?)
• Carbon on quartz by “modified TOT (NIOSH+TOR) and with OP quantified at each thermal stage on subset of samples, with ratios used to disaggregate OP among O1 – O4 (& with no blank subtract?)
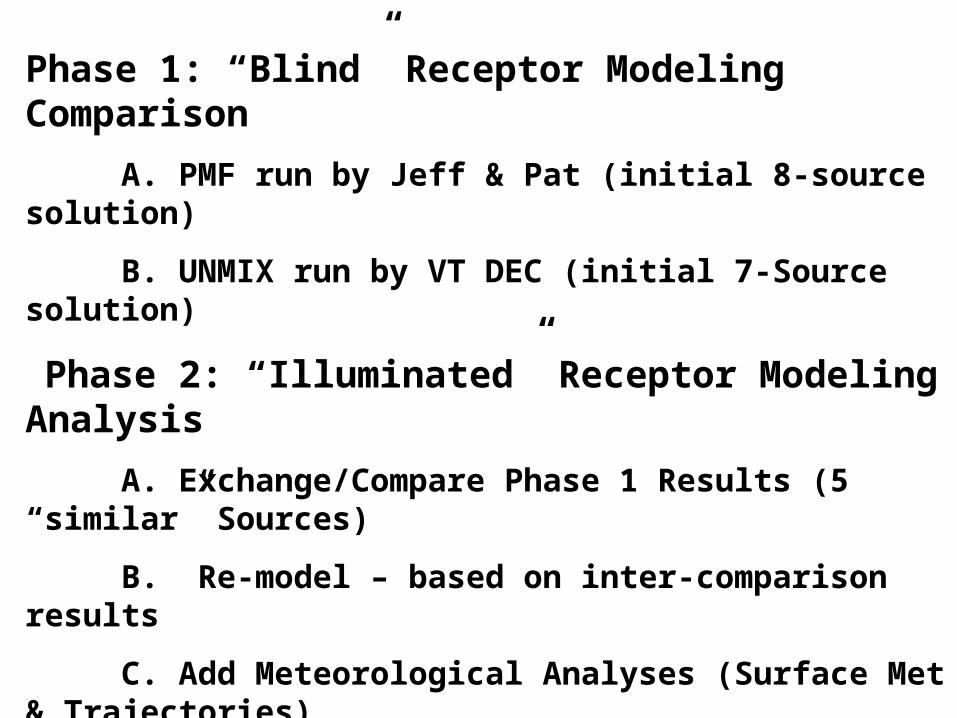
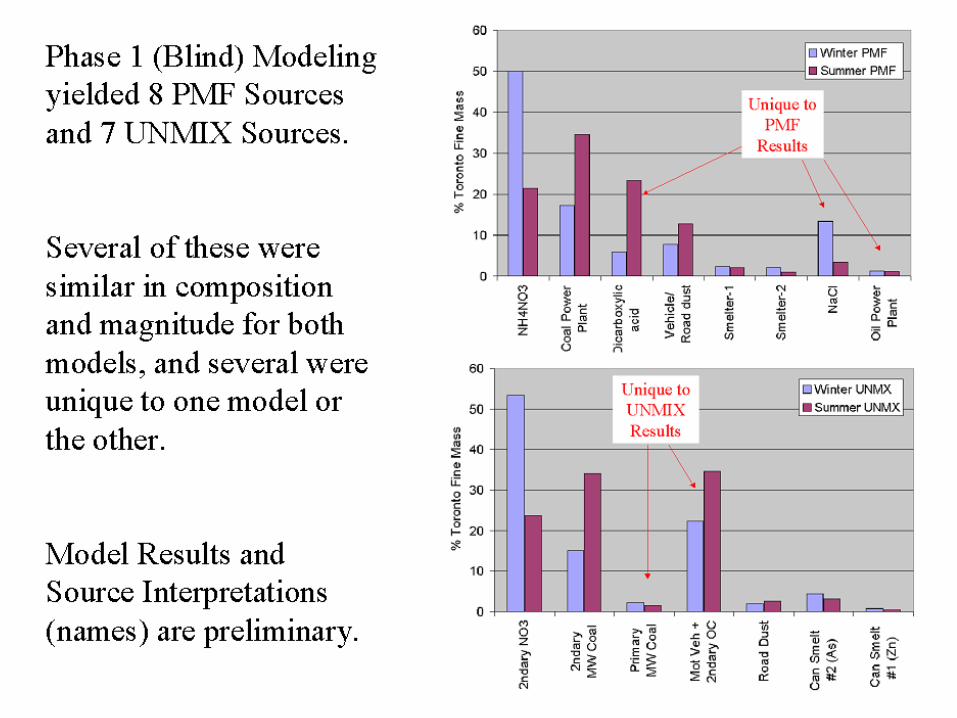
Phase 1: “Blind” Receptor Modeling Comparison
A. PMF run by Jeff & Pat (initial 8-source solution)
B. UNMIX run by VT DEC (initial 7-Source solution)
Phase 2: “Illuminated” Receptor Modeling Analysis
A. Exchange/Compare Phase 1 Results (5 “similar” Sources)
B. Re-model – based on inter-comparison results
C. Add Meteorological Analyses (Surface Met & Trajectories)
Phase 3: Interpretation & Synthesis
A. Interpret Sources, Identify “Convergent Results” and
B. Explore “Divergent Results” (areas of greatest uncertainty)
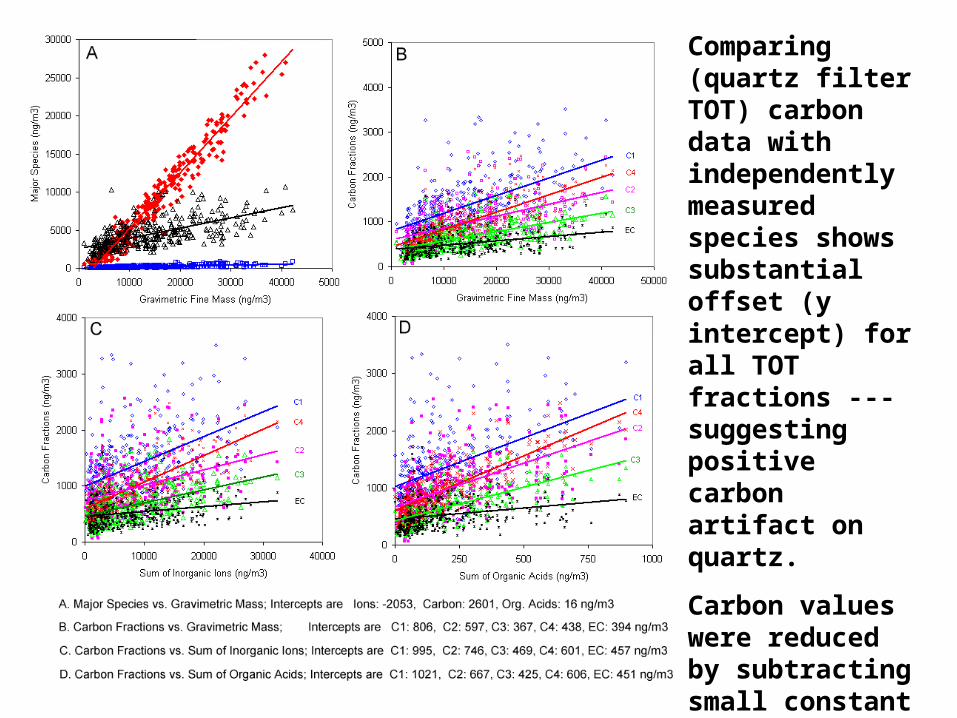
Comparing (quartz filter TOT) carbon data with independently measured species shows substantial offset (y intercept) for all TOT fractions --- suggesting positive carbon artifact on quartz.
Carbon values were reduced by subtracting small constant = to lowest observed value for each TOT fraction (for UNMIX modeling).
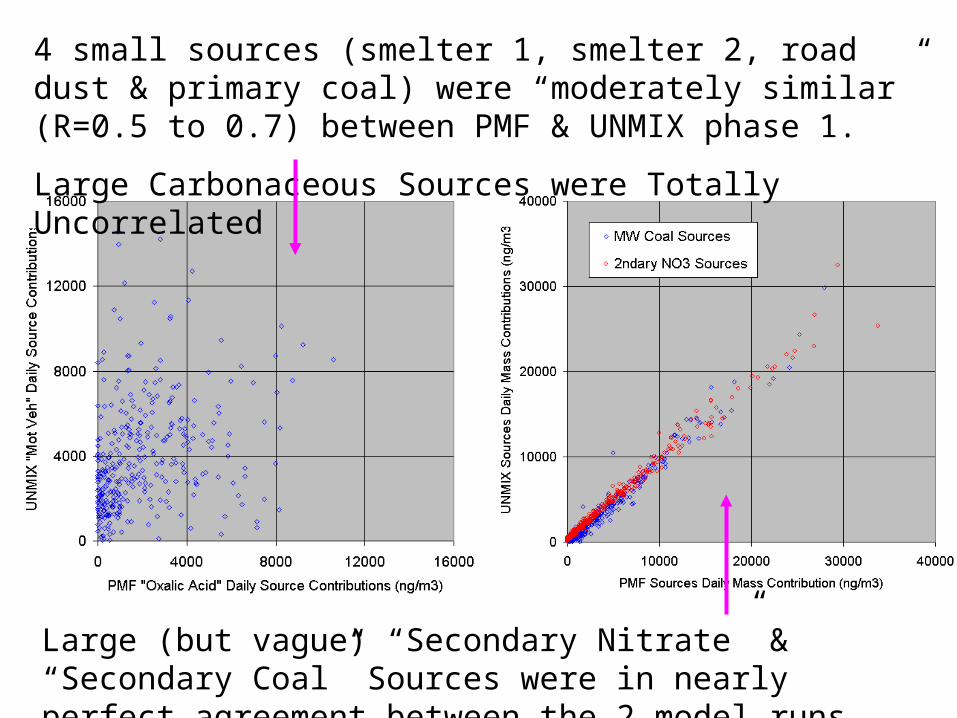
4 small sources (smelter 1, smelter 2, road dust & primary coal) were “moderately similar” (R=0.5 to 0.7) between PMF & UNMIX phase 1.
Large Carbonaceous Sources were Totally Uncorrelated
Large (but vague) “Secondary Nitrate” & “Secondary Coal” Sources were in nearly perfect agreement between the 2 model runs
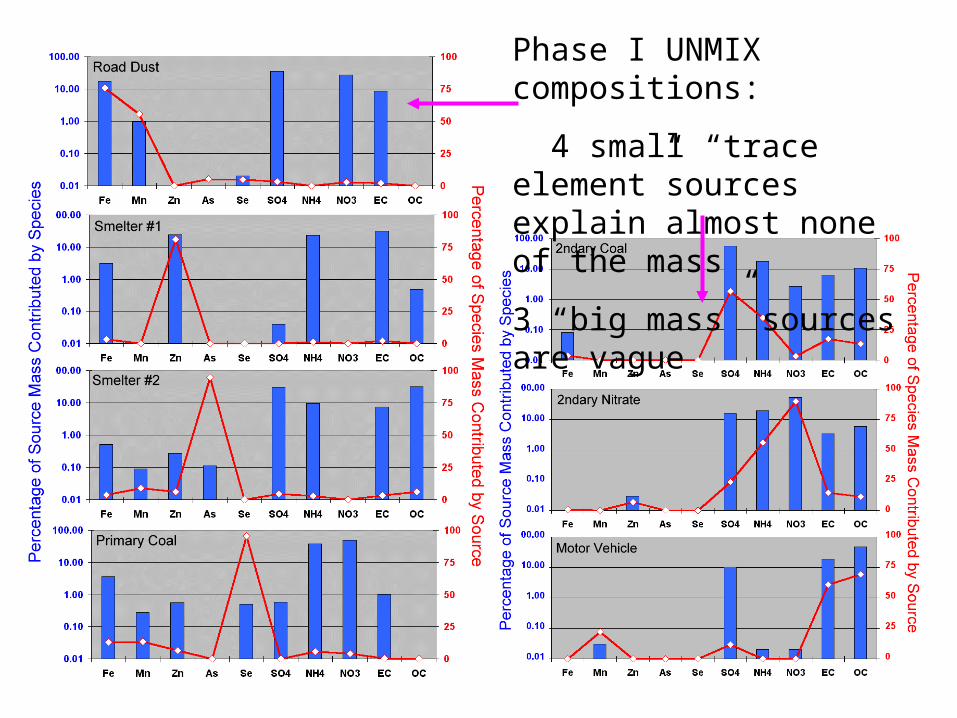
Phase I UNMIX compositions:
4 small “trace element”sources explain almost none of the mass
3 “big mass” sources are vague
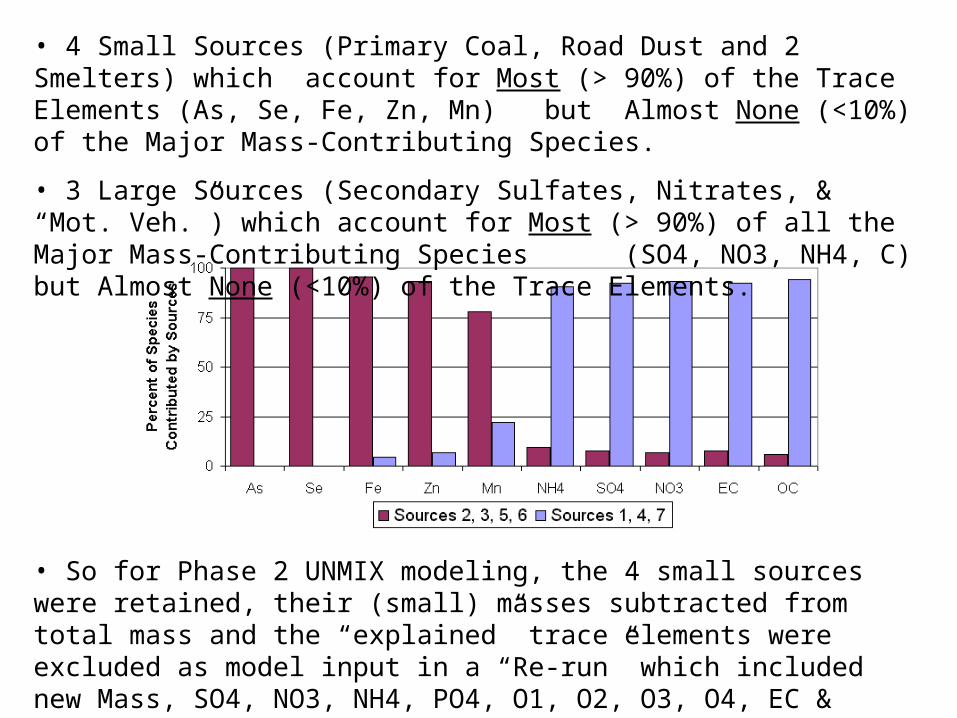
• 4 Small Sources (Primary Coal, Road Dust and 2 Smelters) which account for Most (> 90%) of the Trace Elements (As, Se, Fe, Zn, Mn) but Almost None (<10%) of the Major Mass-Contributing Species.
• 3 Large Sources (Secondary Sulfates, Nitrates, & “Mot. Veh.”) which account for Most (> 90%) of all the Major Mass-Contributing Species (SO4, NO3, NH4, C) but Almost None (<10%) of the Trace Elements.
• So for Phase 2 UNMIX modeling, the 4 small sources were retained, their (small) masses subtracted from total mass and the “explained” trace elements were excluded as model input in a “Re-run” which included new Mass, SO4, NO3, NH4, PO4, O1, O2, O3, O4, EC & Oxalic Acid as input.
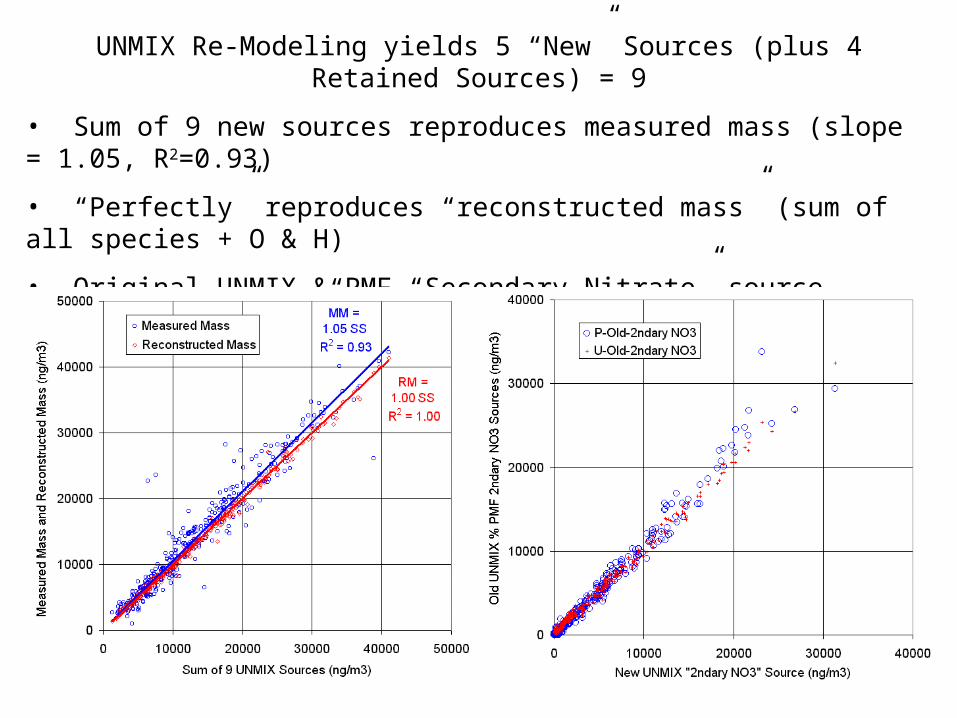
UNMIX Re-Modeling yields 5 “New” Sources (plus 4 Retained Sources) = 9
• Sum of 9 new sources reproduces measured mass (slope = 1.05, R2=0.93)
• “Perfectly” reproduces “reconstructed mass” (sum of all species + O & H)
• Original UNMIX & PMF “Secondary Nitrate” source remains “unchanged”
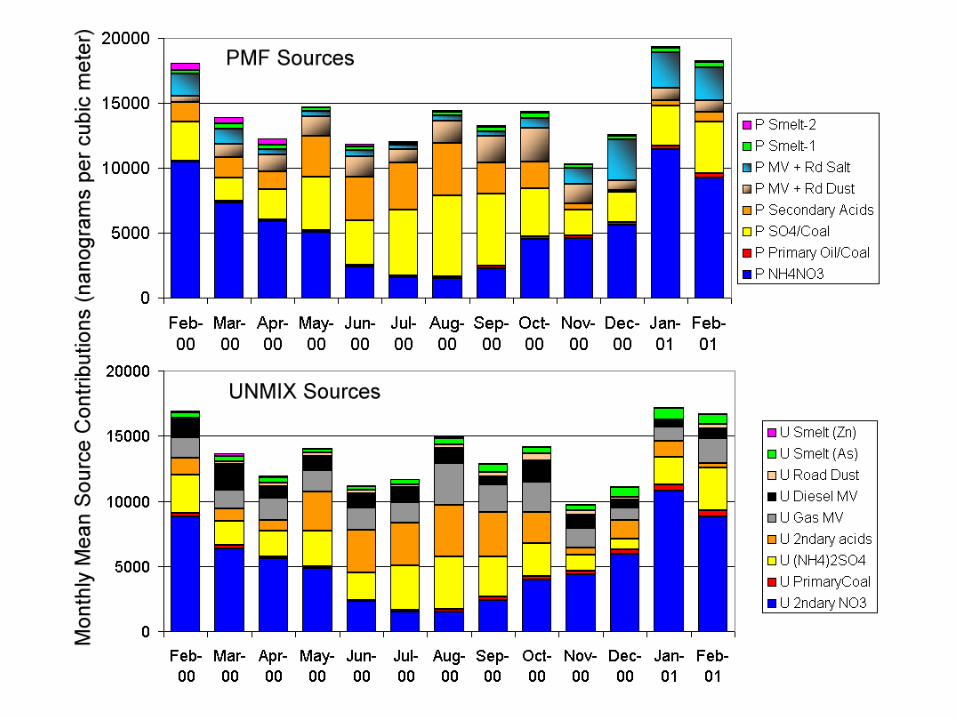
• Other New Sources: “(NH4)2SO4, 2ndary Acids, Gas MV & Diesel MV”
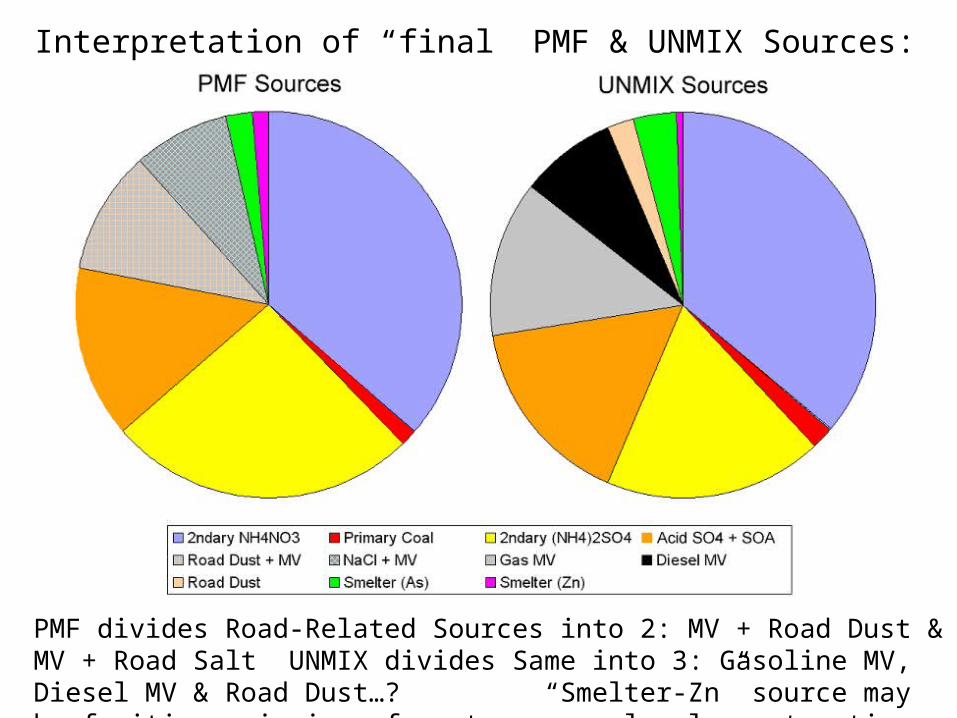
Interpretation of “final” PMF & UNMIX Sources:
PMF divides Road-Related Sources into 2: MV + Road Dust & MV + Road Salt UNMIX divides Same into 3: Gasoline MV, Diesel MV & Road Dust…? “Smelter-Zn” source may be fugitive emissions from temporary local construction
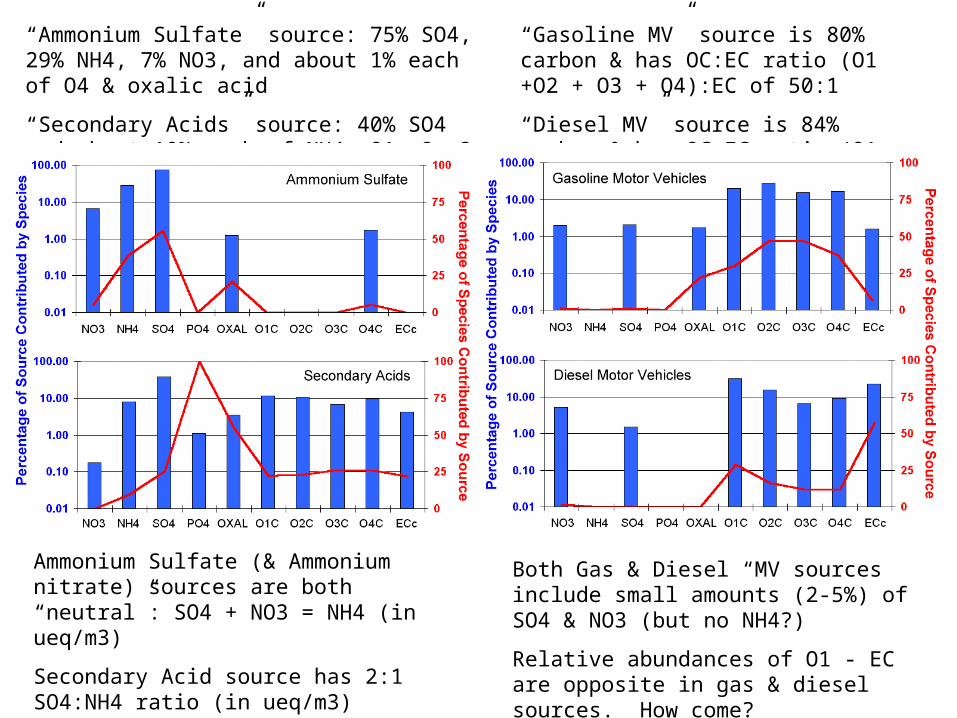
“Ammonium Sulfate” source: 75% SO4, 29% NH4, 7% NO3, and about 1% each of O4 & oxalic acid
“Secondary Acids” source: 40% SO4 and about 10% each of NH4, O1, 2, 3, 4; 4% Oxal & EC; & 1% PO4
Ammonium Sulfate (& Ammonium nitrate) sources are both “neutral”: SO4 + NO3 = NH4 (in ueq/m3)
Secondary Acid source has 2:1 SO4:NH4 ratio (in ueq/m3) consistent with ammonium bisulfate. Why do PO4 & some organics co-vary with acidic SO4?
“Gasoline MV” source is 80% carbon & has OC:EC ratio (O1 +O2 + O3 + O4):EC of 50:1
“Diesel MV” source is 84% carbon & has OC:EC ratio (O1 +O2 + O3 + O4):EC of 3:1
Both Gas & Diesel “MV sources include small amounts (2-5%) of SO4 & NO3 (but no NH4?)
Relative abundances of O1 - EC are opposite in gas & diesel sources. How come?
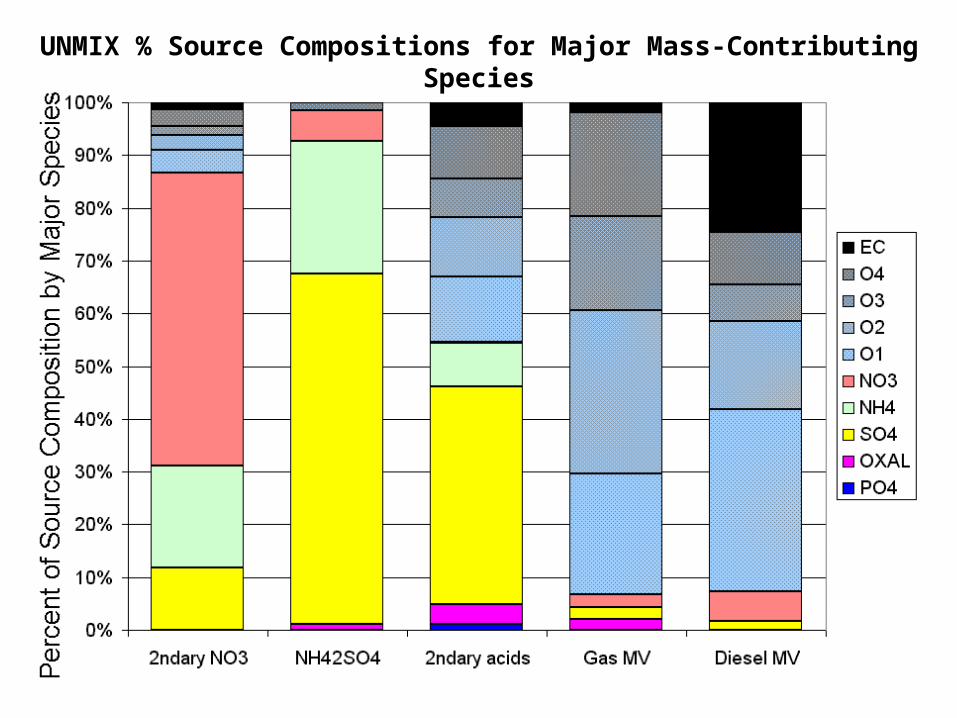
UNMIX % Source Compositions for Major Mass-Contributing Species
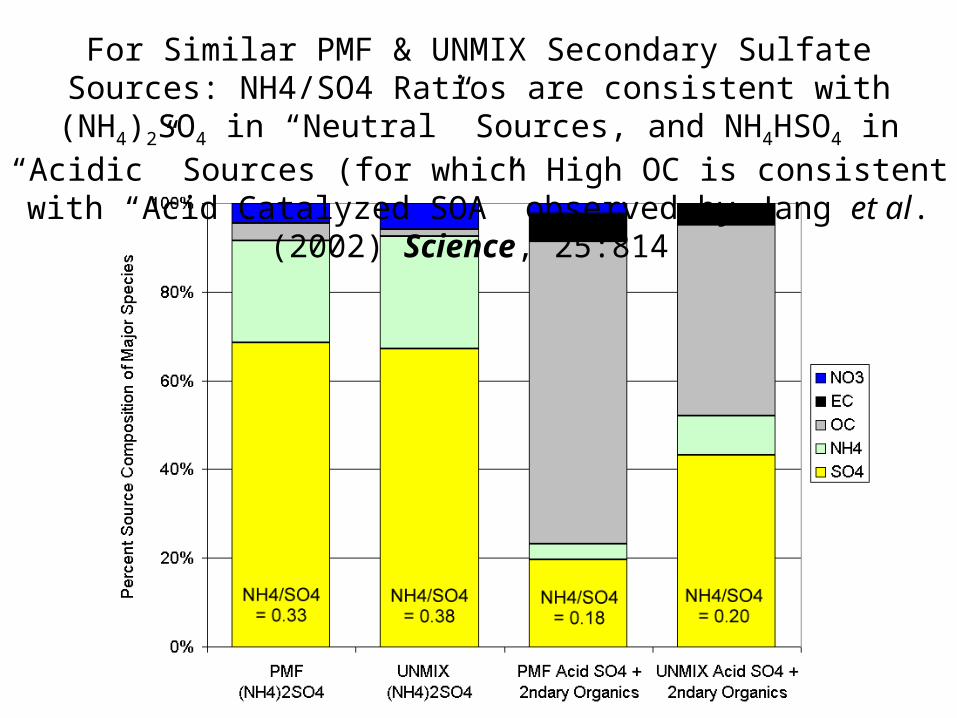
For Similar PMF & UNMIX Secondary Sulfate Sources: NH4/SO4 Ratios are consistent with (NH4)2SO4 in “Neutral” Sources, and
NH4HSO4 in “Acidic” Sources (for which High OC is consistent with “Acid Catalyzed SOA” observed by Jang et al. (2002) Science, 25:814
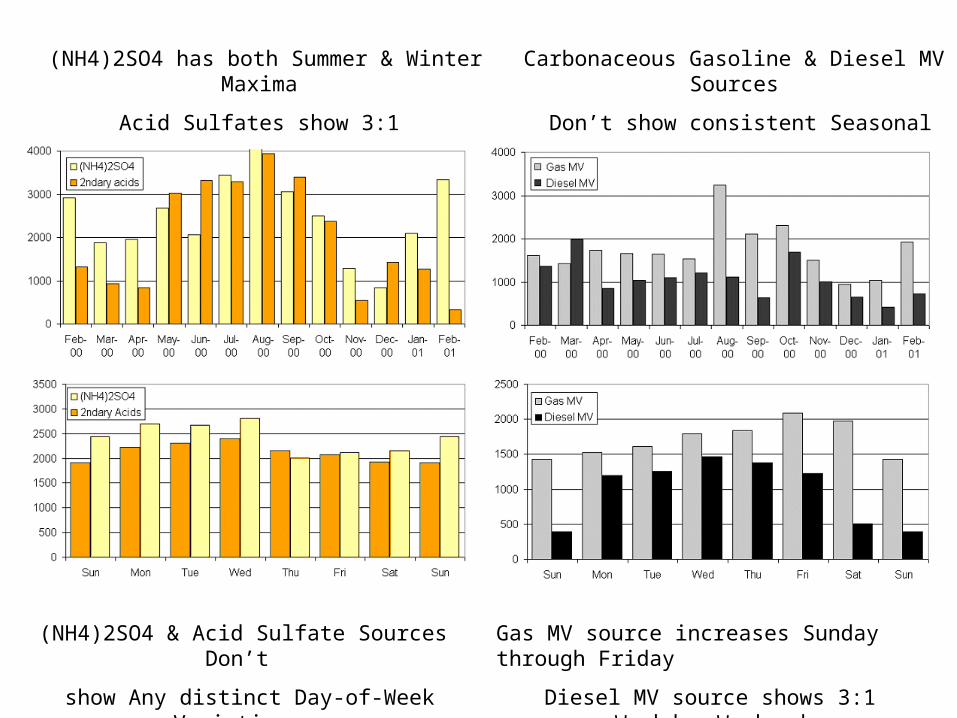
(NH4)2SO4 has both Summer & Winter Maxima
Acid Sulfates show 3:1 Summer:Winter ratio
Carbonaceous Gasoline & Diesel MV Sources
Don’t show consistent Seasonal Variations
(NH4)2SO4 & Acid Sulfate Sources Don’t
show Any distinct Day-of-Week Variations
Gas MV source increases Sunday through Friday
Diesel MV source shows 3:1 Weekday:Weekend
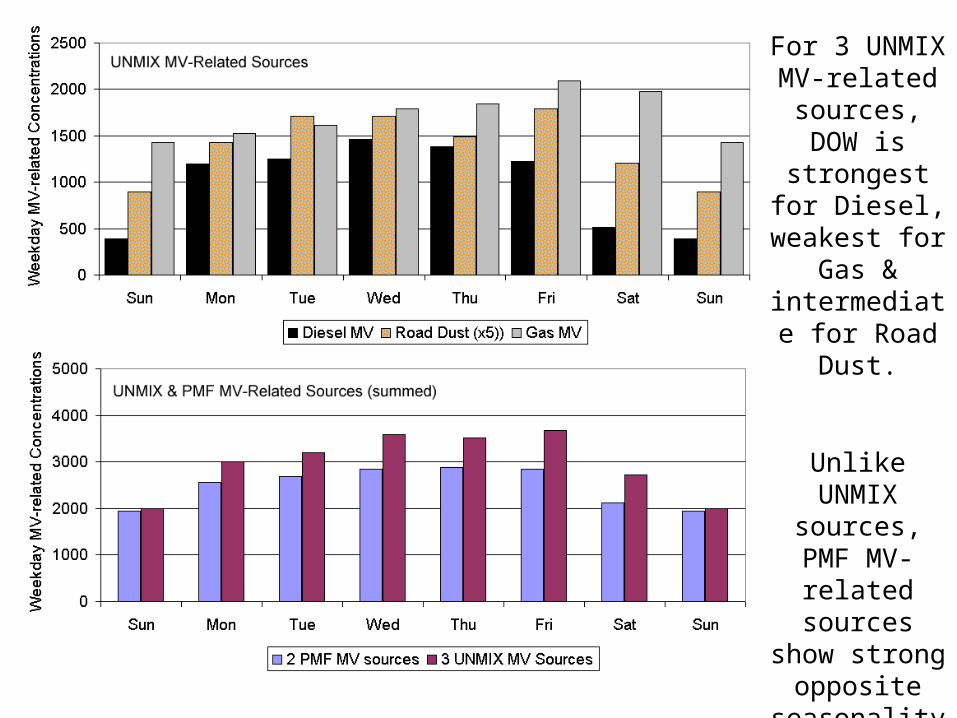
For 3 UNMIX MV-related
sources, DOW is strongest for Diesel, weakest
for Gas & intermediate for
Road Dust.
Unlike UNMIX sources, PMF MV-related
sources show strong opposite seasonality, but DOW means
are similar for 2 PMF’s vs. 3 UNMIX’s.
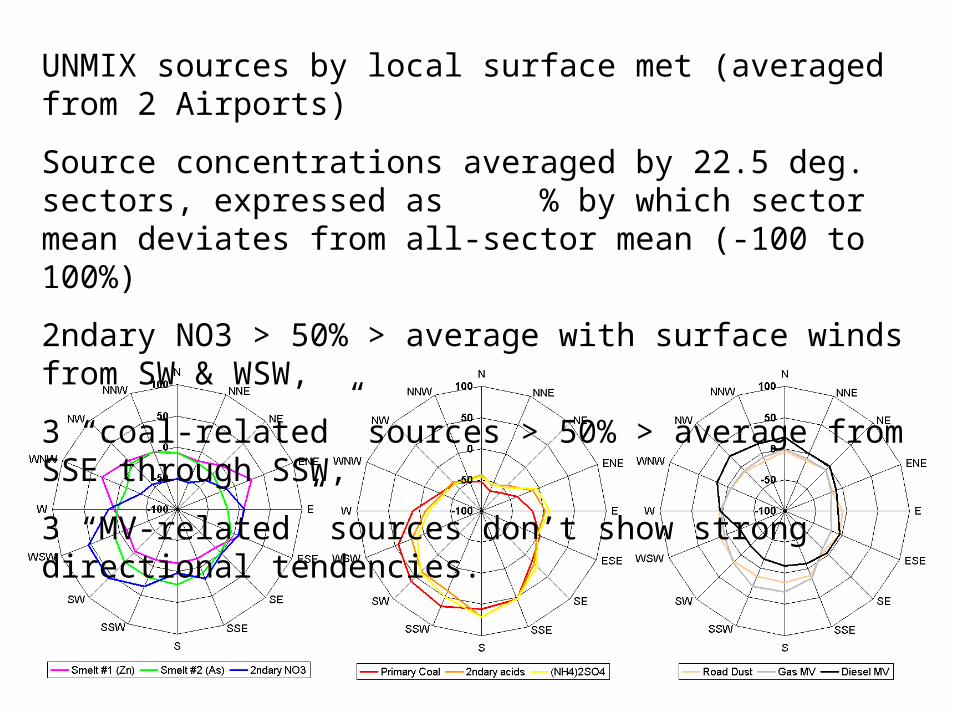
UNMIX sources by local surface met (averaged from 2 Airports)
Source concentrations averaged by 22.5 deg. sectors, expressed as % by which sector mean deviates from all-sector mean (-100 to 100%)
2ndary NO3 > 50% > average with surface winds from SW & WSW,
3 “coal-related” sources > 50% > average from SSE through SSW,
3 “MV-related” sources don’t show strong directional tendencies.
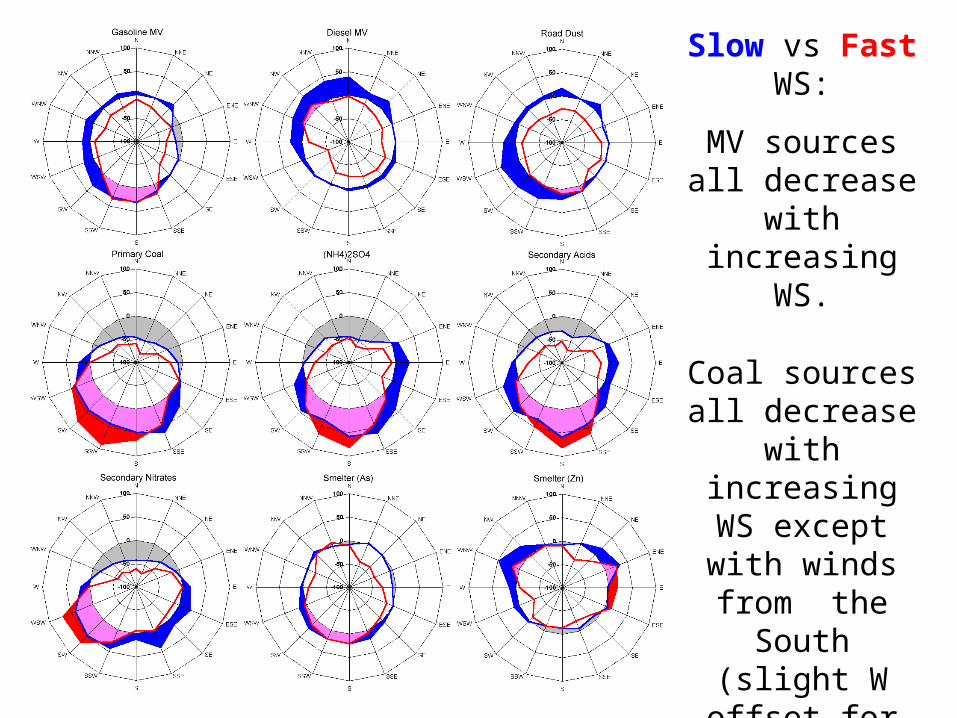
Slow vs Fast WS:
MV sources all decrease with
increasing WS.
Coal sources all decrease with increasing WS
except with winds from the South (slight W offset
for primary coal?)
2ndary NO3 also increases with increasing WS
from WSW, SW
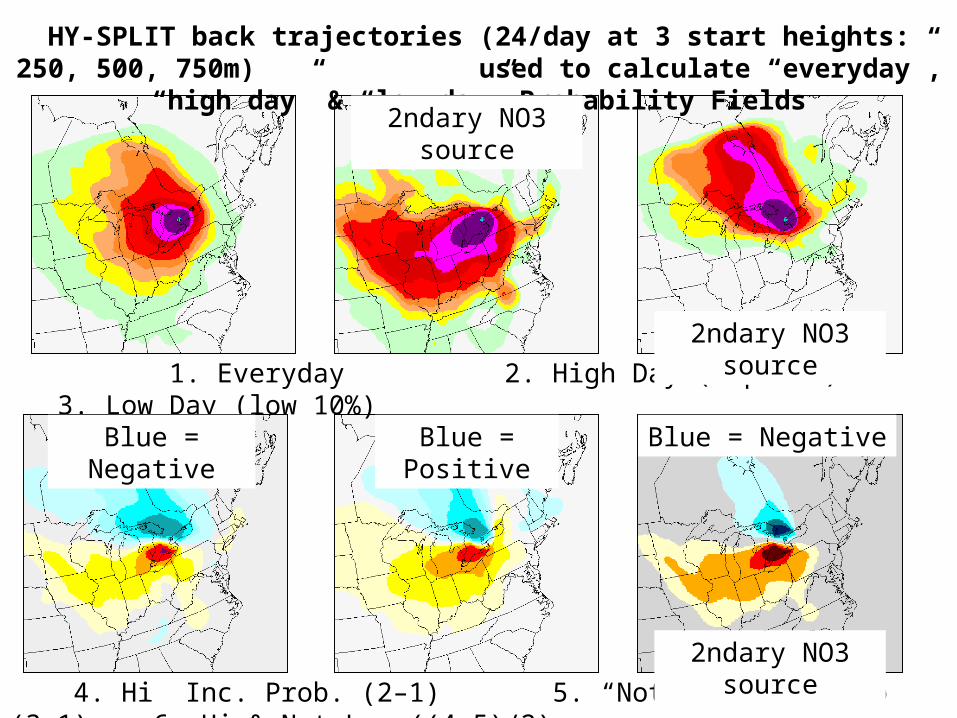
HY-SPLIT back trajectories (24/day at 3 start heights: 250, 500, 750m) used to calculate “everyday”, “high day” & “low day” Probability Fields
1. Everyday 2. High Day (top 10%) 3. Low Day (low 10%)
4. Hi Inc. Prob. (2–1) 5. “Not Low” Inc Prob (3-1) 6. Hi & Not Low ((4-5)/2)
2ndary NO3 source
Blue = Negative Blue = Positive
2ndary NO3 source
2ndary NO3 source
Blue = Negative
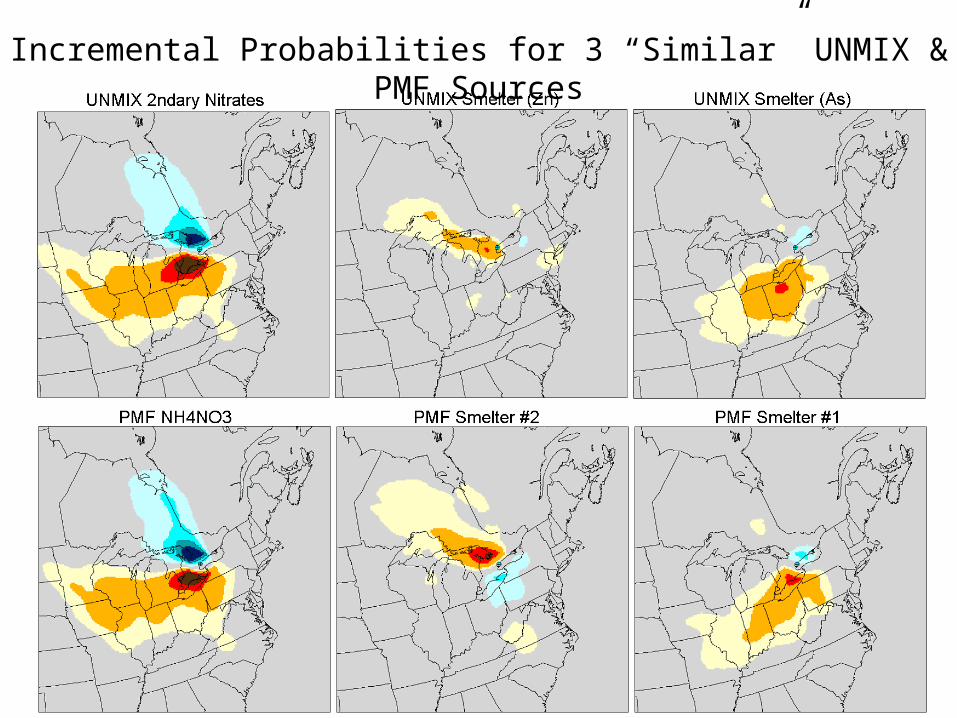
Incremental Probabilities for 3 “Similar” UNMIX & PMF Sources
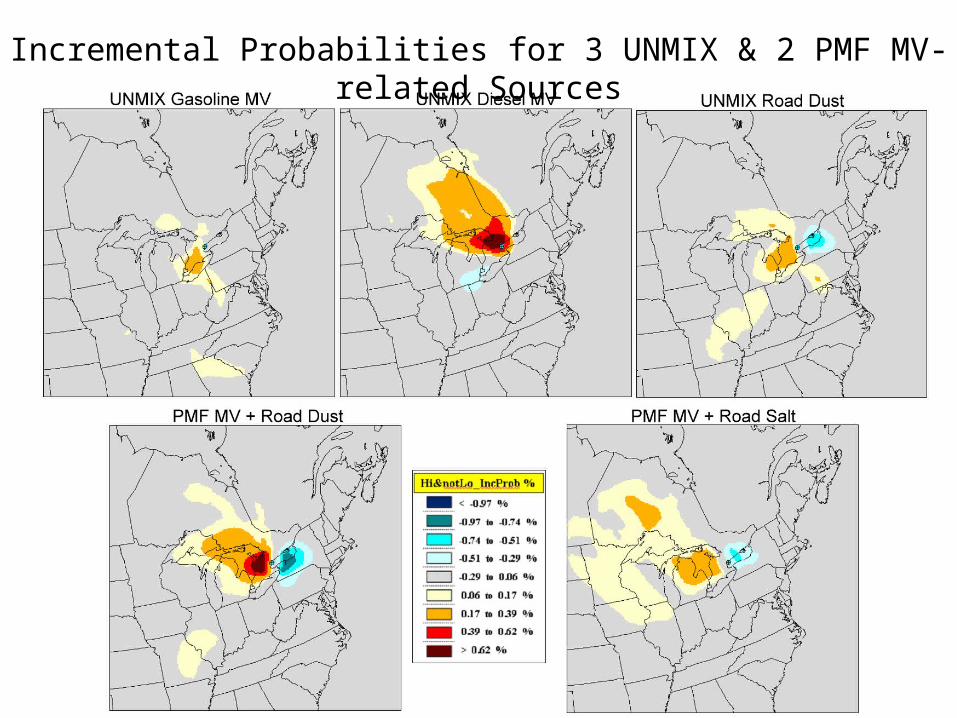
Incremental Probabilities for 3 UNMIX & 2 PMF MV-related Sources
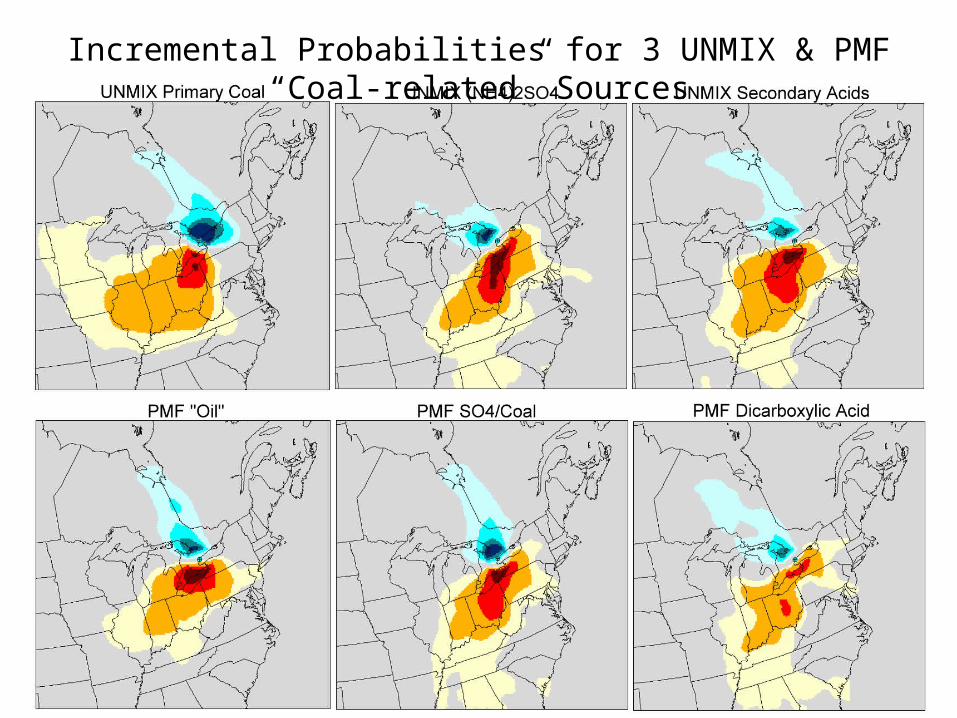
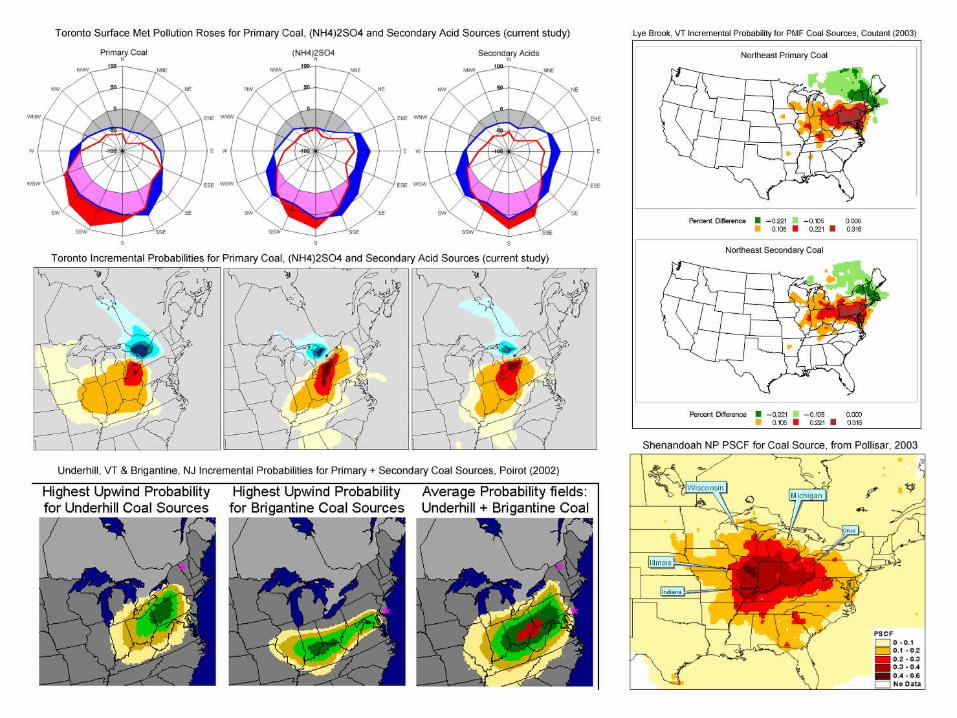
Incremental Probabilities for 3 UNMIX & PMF “Coal-related” Sources
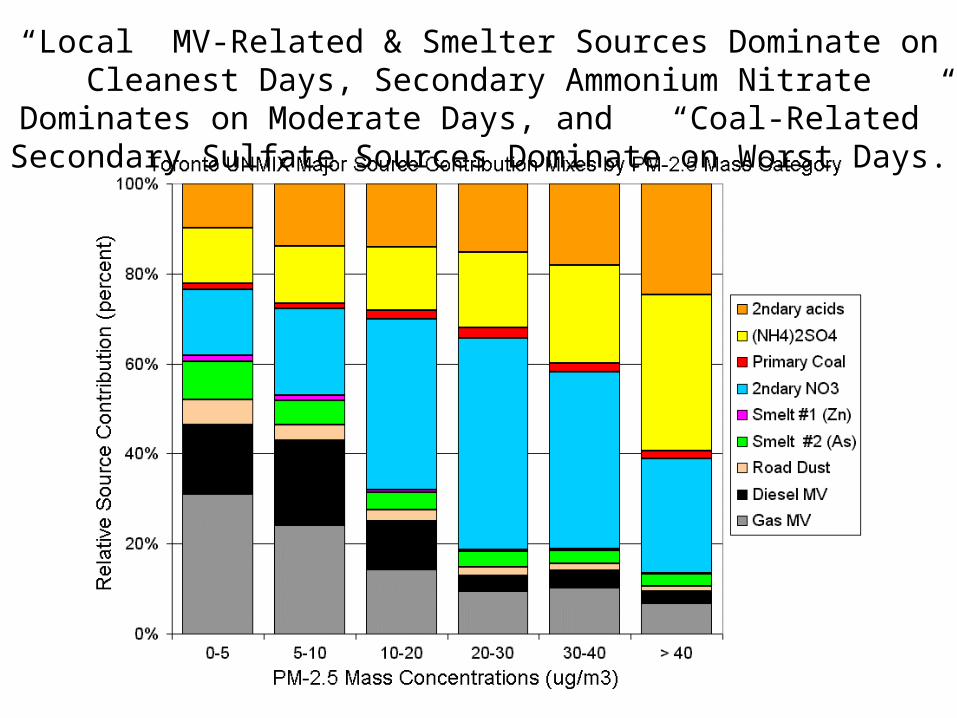
“Local” MV-Related & Smelter Sources Dominate on Cleanest Days, Secondary Ammonium Nitrate Dominates on Moderate Days, and
“Coal-Related” Secondary Sulfate Sources Dominate on Worst Days.
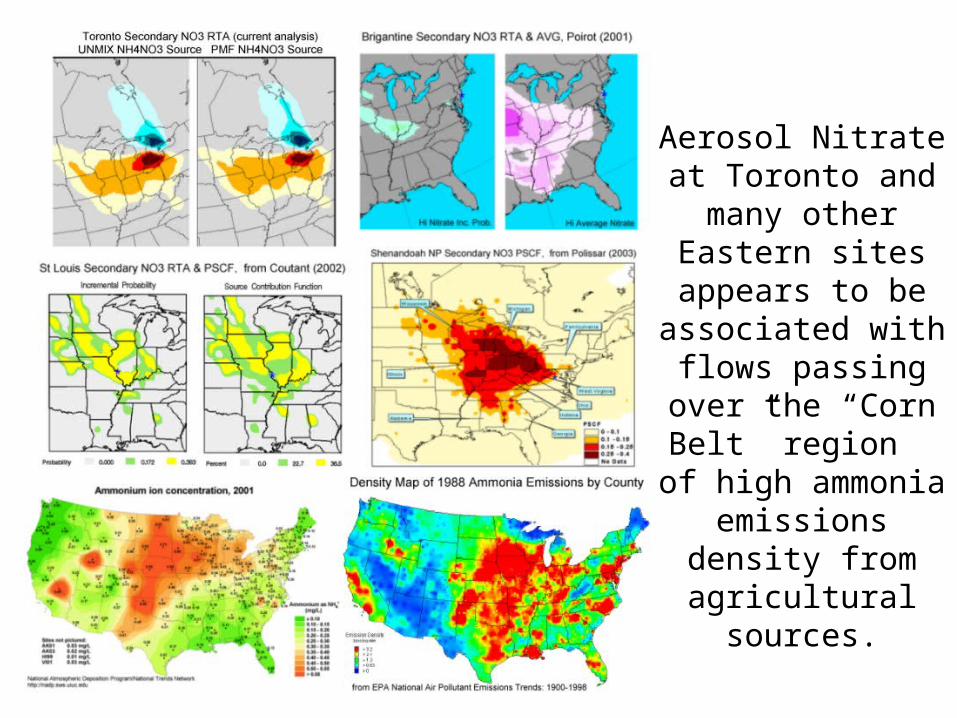
Aerosol Nitrate at Toronto and many other Eastern sites
appears to be associated with flows
passing over the “Corn Belt” region
of high ammonia emissions density from agricultural
sources.