Embed Size (px)
Citation preview

Page 1 of 25
Daily Outlook 06-Apr 18
DAILY MARKET REPORT GLOBAL MARKETS & ECONOMIES | WEEKLY ECONOMIC INDICATORS | ASIAN STOCK INDICATORS |
CURRENCIES | PRECIOUS METAL | O I L |
GLOBAL MARKETS
• The U.S. dollar gained and equity markets around the world jumped on Thursday as fears eased
of a trade war between China and the United States after Washington expressed a willingness to
negotiate.
GLOBAL ECONOMIES
• China has never surrendered to external pressure and it will win any trade war with the United
States, the nation's state media stressed in the hours after the world's two top economies
targeted each other with planned steep tariffs. • Japanese households' confidence on the economy worsened in March for the first time in over a
year and their inflation expectations slid, a quarterly survey showed, underscoring the challenge
of hitting the central bank's elusive price goal. • Euro zone sales increased at a slower rate than expected in February as shoppers cut back on
non-food purchases and figures for January were revised down, indicating a slowdown of
business in the bloc's high streets at the start of the year. • Greek industrial output decreased 2.0 percent in February compared to the same month last
year, after a downwardly revised 1.2 percent fall in January, statistics service ELSTAT said on
Thursday. • Many of the Bank of England's top policymakers privately favour a more direct approach to
signalling how they expect to change interest rates, the Financial Times reported on Thursday. • The U.S. trade deficit increased to a near 9-1/2-year high in February, with both exports and
imports rising to record highs, but the shortfall with China narrowed sharply.

Page 2 of 25
Daily Outlook 06-Apr 18
GLOBAL MARKETS U.S. & Global Markets – The U.S. dollar gained and equity markets
around the world jumped on Thursday as fears eased of a trade war
between China and the United States after Washington expressed a
willingness to negotiate.
The dollar rose to a three-week high against the Japanese yen and a 10-
week peak versus the Swiss franc, two safe-haven assets that investors buy
in times of market uncertainty.
U.S. Treasury yields rose to one-week highs as risk appetite returned on
the reduced fear of a trade war and on expectations a growing economy
will be confirmed on Friday when the closely watched U.S. employment
report for March is released.
Major European stock indexes surged 2 percent or more, with Germany's
exporter-heavy DAX, the market most exposed to China, climbing 2.90
percent.
MSCI's all-country world stock index, which tracks shares in 47 countries,
gained 0.95 percent, led by Amazon.com Inc and Facebook Inc.
"Markets seem to be in relief rally mode and part of this is really driven by
the fact we're not really in a trade war yet," said Charlie Ripley, senior
investment strategist at Allianz Investment Management in Minneapolis.
"This is quite small in terms of the impact to the economy, we still have the
runway of tax reform that's coming along," Ripley said, referring to the
boost that U.S. President Donald Trump's new tax code is delivering to
corporate earnings.
The pan-European FTSEurofirst 300 index of leading regional shares closed
up 2.48 percent.
On Wall Street, the Dow Jones Industrial Average closed up 240.92 points,
or 0.99 percent, to 24,505.22. The S&P 500 gained 18.15 points, or 0.69
percent, to 2,662.84 and the Nasdaq Composite added 34.45 points, or
0.49 percent, to 7,076.55.
MSCI's emerging market index rose 0.94 percent.
Signs the United States is looking to resolve the trade dispute with China
lifted the dollar but limited an advance in oil prices because crude is priced
in dollars and a stronger greenback makes oil purchases in other currencies
more expensive.
White House economic adviser Larry Kudlow said he expects the United
States and China to work out differences and trade barriers likely "will
come down on both sides."
The dollar index rose 0.34 percent, with the euro down 0.32 percent to
$1.2238. The Japanese yen weakened 0.56 percent at 107.38 per dollar.
Joe Manimbo, senior market analyst at Western Union Business Solutions
in Washington, said the dollar was boosted by a view that "Washington
and Beijing might broker a trade deal that doesn't torpedo global
commerce or damage the world economy."
U.S. crude settled up 17 cents to $63.54 per barrel and Brent gained 31
cents to settle at $68.33.
Treasury yields rose as investors awaited Friday's U.S. jobs report, which
will be evaluated for accelerating jobs gains and wage pressures.
Benchmark 10-year U.S. Treasury notes fell 11/32 in price to yield 2.8320
percent.
In Europe, most government bond yields were up 2 to 6 basis points.
Germany's benchmark 10-year bund yield was trading at 0.524 percent, up
3 basis points on the day. (Source Reuters – @her1en)
GLOBAL ECONOMIES
China – China has never surrendered to external pressure and it will win
any trade war with the United States, the nation's state media stressed in
the hours after the world's two top economies targeted each other with
planned steep tariffs.
In Washington, U.S. administration officials continued to seek to allay
market fears of a trade war, and expressed a willingness to negotiate a
resolution with China.
"There is a process here. There's going to be some back and forth, but
there's also some negotiations," White House National Economic Council
Director Larry Kudlow said. "I think we are going to get a deal over a period
of time," he said in an interview with Fox Business Network.
China'a ambassador to the United States Cui Tiankai told reporters in
Washington on Wednesday that Beijing preferred to resolve the trade
dispute through negotiations, but China's official mouthpieces took a
tougher stance.
The ruling Communist Party's People's Daily newspaper said Beijing's quick
counter-move after Washington announced new tariffs this week had
caught the Americans off guard.
"Within 24 hours of the U.S. publishing its list, China drew its sword, and
with the same strength and to the same scale, counterattacked quickly,
fiercely and with determination," the paper said in a commentary on
Thursday.
"The confidence to know that [China] will win the trade war comes from
the scale of [China's] consumer market," the paper said, noting that China's
market potential is incomparable to other economies.
Many American consumer product and industrial companies see the
Chinese market as a big source for future growth given the continued rise
in the number of people joining both the middle class and the wealthier
levels of Chinese society.
The United States' proposed list of $50 billion in duties on Chinese goods is
aimed at forcing Beijing to address what Washington says is deeply
entrenched theft of U.S. intellectual property and forced technology
transfer from American companies.
China hit back within hours with its own threatened tariffs on U.S. imports
including soybeans, planes, cars, whiskey and chemicals.
The official Xinhua news agency said late on Wednesday that the U.S.
tariffs proposal would cost the United States "dearly."
"China will not be afraid or back down if a trade war is unavoidable. The
country has never surrendered to external pressure, and it will not
surrender this time either," Xinhua said.
Kudlow had told Fox News on Wednesday, "I believe that the Chinese will
back down and will play ball."
Neither of the tariff lists issued by the two countries have gone into effect
yet. Washington will hold public comment period expected to last around
two months, and Chinese officials have said its implementation will depend
on U.S. action.
Japan – Japanese households' confidence on the economy worsened in
March for the first time in over a year and their inflation expectations slid,
a quarterly survey showed, underscoring the challenge of hitting the
central bank's elusive price goal.
The survey, which followed the Bank of Japan's "tankan" poll that showed
business mood souring for the first time in two years, suggests the
economy may be peaking after enjoying the longest streak of expansion
since the 1980s bubble period.
A diffusion index measuring households' confidence on the economy
worsened to minus 12.4 in March from minus 11.9 in December,
deteriorating for the first time in five quarters, the BOJ's survey on people's
livelihood showed on Thursday.
The percentage of respondents who thought prices were rising hit a more
than two-year high of 73.5 percent with many complaining of higher fuel
and fresh food prices, a sign consumers were feeling the pinch from rising
grocery costs.
But despite their view that prices had risen recently, households did not
expect inflation to accelerate much in coming years - boding ill for the
BOJ's efforts to eradicate the public's sticky deflationary mindset with huge
money printing.
The percentage of households who expect prices to rise a year from now
was at 73.9 percent in March, down from 75.6 percent in December, falling
for the first time in two quarters.
GLOBAL MARKETS & ECONOMIES

Page 3 of 25
Daily Outlook 06-Apr 18
"Underlying price gains were driven by higher fuel and fresh food prices.
Households may have thought such price gains are temporary and won't
last long," a BOJ official told a briefing.
Among the surveyed households, 81.0 percent said they expect inflation to
pick up five years from now, down from 81.9 percent in December.
The survey, conducted between Feb. 8 and March 6, is among key data the
central bank will scrutinise at its rate review this month to see how much
its ultra-loose policy is working.
Japan's economy expanded an annualised 1.6 percent in the October-
December quarter, marking the eighth straight quarter of gains, on robust
global demand and capital spending.
But core consumer inflation, a key price gauge the BOJ watches that strips
away volatile fresh food costs, has been stubbornly sluggish. It stood at 1.0
percent in February, well below the BOJ's 2 percent target, as slow wage
growth keeps consumers from boosting spending.
Many analysts worry that rises in vegetable prices due to unusually cold
winter may have hit households and discouraged them from spending on
non-necessities.
Subdued price growth may force the BOJ to cut its inflation forecasts when
it conducts a quarterly review of its projections at a rate review on April
26-27, some analysts say.
Euro Zone – Euro zone sales increased at a slower rate than expected in
February as shoppers cut back on non-food purchases and figures for
January were revised down, indicating a slowdown of business in the bloc's
high streets at the start of the year.
The European Union's statistics office Eurostat said on Thursday that retail
sales in the 19 countries sharing the euro rose by just 0.1 percent month-
on-month for a 1.8 percent year-on-year increase.
Economists polled by Reuters had expected a 0.5 percent monthly rise and
a 2.1 percent annual gain.
Eurostat also cut its figures for January to -0.3 percent on the month and to
1.5 percent year-on-year from the previous estimates of -0.1 and 2.3
percent respectively.
Food, drink and tobacco sales grew after a month-on-month contraction
and year-on-year stagnation in January.
Sales of pharmaceutical and medical goods and of automotive fuel rose
during February after declines in January, but other non-food products
either rose by less than in January or fell.
These included clothing, electrical goods and furniture, computer
equipment and books as well as mail order and internet sales.
Internet sales, which peaked in November, have now fallen for three
straight months.
Eurostat also released data on producer prices, showing a 0.1 percent
month-on-month increase, in line with expectations, and a 1.6 percent
year-on-year rise, just ahead of the average economist forecast of 1.5
percent.
Greece – Greek industrial output decreased 2.0 percent in February
compared to the same month last year, after a downwardly revised 1.2
percent fall in January, statistics service ELSTAT said on Thursday.
Looking at index components, manufacturing production rose 0.2 percent
from the same month last year, while mining output fell 12.7 percent.
Electricity production decreased 6.1 percent.
***********************************************************
KEY FIGURES FEB JAN DEC NOV OCT SEPT
(%)
Industrial -2.0 -1.2* 1.3 2.0 1.6 4.1
output y/y
Manufacturing 0.2 6.4 6.3 0.2 -0.3 1.3
output y/y
----------------------------------------------------------------
* revised
source: ELSTAT
UK – Many of the Bank of England's top policymakers privately favour a
more direct approach to signalling how they expect to change interest
rates, the Financial Times reported on Thursday.
Members of the BoE's Monetary Policy Committee are debating whether
to be more forthcoming about their rate plans, although some worry that
more transparency would lead the public to see statements as
commitments rather than projections, the FT said.
Other central banks, including the U.S. Federal Reserve, regularly publish
detailed forecasts for how rates might change.
A BoE spokesman declined to comment on the report.
Currently the BoE publishes forecasts for growth, inflation and many other
economic indicators. It sometimes encourages investors to look at whether
it thinks market interest rate expectations will lead to inflation overshoots
or undershoots.
MPC member Gertjan Vlieghe said in March that rates would probably
need to rise once or twice a year over the next few years, adding to signals
from other top BoE officials since November about the likelihood of rate
hikes ahead.
BoE Governor Mark Carney introduced a policy of giving clearer steers on
the future path for rates when he joined the British central bank in 2013.
But several of those signals were knocked off course by unexpected
changes in the economy.
Carney said in February that he did not give guidance on a specific path for
rates except in exceptional circumstances.
The BoE is expected to raise rates in May for only the second time since
the start of the global financial crisis more than a decade ago.
U.S. – The U.S. trade deficit increased to a near 9-1/2-year high in
February, with both exports and imports rising to record highs, but the
shortfall with China narrowed sharply.
News of the worsening trade deficit comes as the United States and China
are embroiled in tit-for-tat tariffs which have rattled global financial
markets. It also underscores the challenges confronting President Donald
Trump's "America First" trade policies aimed at eradicating the deficit.
The Commerce Department said on Thursday the trade gap rose 1.6
percent to $57.6 billion, the highest level since October 2008. The deficit
has now risen for six straight months. The goods trade deficit was the
highest since July 2008 and the surplus on services was the lowest since
December 2012.
Economists polled by Reuters had forecast the trade gap widening to $56.8
billion in February. Part of the rise in the trade deficit in February reflected
commodity price increases.
The politically sensitive goods trade deficit with China fell 18.6 percent to
$29.3 billion. The deficit with Mexico surged 46.6 percent in February.
The Trump administration on Tuesday targeted 25 percent tariffs on some
1,300 Chinese industrial technology, transport and medical products, to
force changes in Beijing's intellectual property practices. China swiftly
retaliated on Wednesday with a list of similar duties on key American
imports including soybeans, planes, cars, beef and chemicals
Trump, who claims the United States is being taken advantage of by its
trading partners, has already imposed broad tariffs on imported solar
panels and large washing machines. He has also slapped 25 percent import
duties on steel and 10 percent on aluminum.
While these actions may prove politically popular with Trump's working
class political base, especially in states hard-hit by factory closures and
import competition, analysts warn they could undercut economic growth
and raise prices for both consumers and producers.
Strong economic growth, which is drawing in imports, and the Trump
administration's $1.5 trillion income tax cut package will worsen the trade
deficit, economists say.
"By our calculations, the tax legislation and two-year budget deal will add
$205 billion to the federal budget deficit this year, which increases the
nominal trade deficit by $75 billion," said Ryan Sweet, an economist at
Moody's Analytics in West Chester, Pennsylvania.
(Source Reuters, Research – @her1en)

Page 4 of 25
Daily Outlook 06-Apr 18
ECONOMIC INDICATORS
DATE WIB CTY INDICATORS PER ACTUAL FORECAST PREV. REV.
Mon/02-Apr-18 06:50 JP Tankan Large All Industry Capex 1Q 2.3% 1.0% 7.4% 6.4%
06:50 JP Tankan Large Mfg Index 1Q 24 25 25 26
06:50 JP Tankan Large Mfg Outlook 1Q 20 22 19 21
06:50 JP Tankan Large Non-Mfg Index 1Q 23 24 23 25
06:50 JP Tankan Large Non-Mfg Outlook 1Q 20 21 20
06:50 JP Tankan Small Mfg Index 1Q 15 14 15
06:50 JP Tankan Small Mfg Outlook 1Q 12 10 11
06:50 JP Tankan Small Non-Mfg Index 1Q 10 8 9
06:50 JP Tankan Small Non-Mfg Outlook 1Q 5 5 5 4
07:30 JP Nikkei Japan PMI Mfg Mar F 53.1 -- 53.2
07:30 KR Nikkei South Korea PMI Mfg Mar 49.1 50.5 50.3
08:00 AU Melbourne Institute Inflation MoM Mar 0.1% -- -0.1%
08:00 AU Melbourne Institute Inflation YoY Mar 2.1% -- 2.1%
08:45 CN Caixin China PMI Mfg Mar 51.0 51.7 51.6
19:30 CA MLI Leading Indicator MoM Feb 0.2% -- 0.4%
20:30 CA Markit Canada Manufacturing PMI Mar 55.7 -- 55.6
20:45 US Markit US Manufacturing PMI Mar F 55.6 55.7 55.7
21:00 US Construction Spending MoM Feb 0.1% 0.4% 0.0%
21:00 US ISM Employment Mar 57.3 -- 59.7
21:00 US ISM Manufacturing Mar 59.3 60 60.8
21:00 US ISM New Orders Mar 61.9 -- 64.2
21:00 US ISM Prices Paid Mar 78.1 72.5 74.2
Tue/03-Apr-18 05:30 AU AiG Perf of Mfg Index Mar 63.1 -- 57.5
06:00 AU CBA Australia PMI Mfg Mar 54.3 -- 55.6
06:00 KR CPI Core YoY Mar - -- 1.2%
06:00 KR CPI MoM Mar -0.1% 0.1% 0.8%
06:00 KR CPI YoY Mar 1.3% 1.5% 1.4%
06:50 JP Monetary Base End of period Mar ¥487.0t -- ¥475.2t
06:50 JP Monetary Base YoY Mar 9.1% -- 9.4%
11:30 AU RBA Cash Rate Target Apr-03 1.5% 1.5% 1.5%
14:55 DE Markit/BME Germany Manufacturing PMI Mar F 58.2 58.4 58.4
N/A DE Retail Sales MoM Feb -0.7% 0.8% -0.7% 0.3%
N/A DE Retail Sales YoY Feb 1.3% 2.4% 2.3% 2.5%
15:00 EZ Markit Eurozone Manufacturing PMI Mar F 56.6 56.6 56.6
15:30 GB Markit UK PMI Manufacturing SA Mar 55.1 54.7 55.2 55.0
15:30 HK Retail Sales Value YoY Feb - -- 4.1%
15:30 HK Retail Sales Volume YoY Feb 28.2% 5% 2.2%
Wed/04-Apr-18 04:00 KR Foreign Reserves Mar $396.8b $395b $394.80b
05:00 NZ ANZ Consumer Confidence Index Mar 128.0 -- 127.7
05:00 NZ ANZ Consumer Confidence MoM Mar 0.2% -- 0.6%
07:30 JP Nikkei Japan PMI Composite Mar 51.3 -- 52.2
07:30 JP Nikkei Japan PMI Services Mar 50.9 -- 51.7
08:30 AU Building Approvals MoM Feb -6.2% -5.0% 17.1% 17.2%
08:30 AU Building Approvals YoY Feb -3.1% 0.3% 12.0% 12.1%
08:30 AU Retail Sales MoM Feb 0.6% 0.3% 0.1%
08:45 CN Caixin China PMI Composite Mar 51.8 -- 53.3
08:45 CN Caixin China PMI Services Mar 52.3 54.5 54.2
15:30 GB Markit/CIPS UK Construction PMI Mar 47.0 51 51.4
16:00 EZ CPI Core YoY Mar A 1.0% 1.1% 1.0%
16:00 EZ CPI Estimate YoY Mar 1.4% 1.4% 1.2% 1.1%
16:00 EZ Unemployment Rate Feb 8.5% 8.5% 8.65%
19:15 US ADP Employment Change Mar 241k 210k 235k 246k
20:45 US
Fed's Bullard Speaks on U.S. Economy and Monetary
Policy
20:45 US Markit US Composite PMI Mar F 54.2 -- 54.3
20:45 US Markit US Services PMI Mar F 54 54.2 54.1
21:00 US Cap Goods Orders Nondef Ex Air Feb F 1.4% -- 1.8%
21:00 US Cap Goods Ship Nondef Ex Air Feb F 1.4% -- 1.4%
21:00 US Durable Goods Orders Feb F 3.0% -- 3.1%
21:00 US Durables Ex Transportation Feb F 1.0% -- 1.2%
21:00 US Factory Orders Feb 1.2% 1.7% -1.4% -1.3%
21:00 US Factory Orders Ex Trans Feb 0.1% -- 0.4%

Page 5 of 25
Daily Outlook 06-Apr 18
(Source: Bloomberg-Reuters-Forexfactory-DailyFX-Tradingeconomics-FXStreet, Research: @LukmanLoeng,@her1en,rizal)
21:00 US ISM Non-Manf. Composite Mar 58.8 59 59.5
21:30 US DOE Cushing OK Crude Inventory Mar-30 3666k -- 1804k
21:30 US DOE U.S. Crude Oil Inventories Mar-30 -4617k 2000k 1643k
21:30 US DOE U.S. Distillate Inventory Mar-30 537k -1300k -2090k
21:30 US DOE U.S. Gasoline Inventories Mar-30 -1116k -1500k -3472k
22:00 US Fed's Mester Speaks on Diversity in Economics
Thu/05-Apr-18 05:30 AU AiG Performance of Services Index Mar 56.9 -- 54
06:00 AU CBA Australia PMI Composite Mar 55.4 -- 54.3
06:00 AU CBA Australia PMI Services Mar 55.6 -- 54.2
08:30 AU Trade Balance Feb A$825m A$725m A$1055m
13:00 DE Factory Orders MoM Feb 0.3% 2.1% -3.9% -3.5%
13:00 DE Factory Orders WDA YoY Feb 3.5% 6.3% 8.2% 8.6%
14:55 DE Markit Germany Services PMI Mar F 53.9 54.2 54.2
14:55 DE Markit/BME Germany Composite PMI Mar F 55.1 55.4 55.4
15:00 EZ Markit Eurozone Composite PMI Mar F 55.2 55.3 55.3
15:00 EZ Markit Eurozone Services PMI Mar F 54.9 55 55
15:30 GB Markit/CIPS UK Composite PMI Mar 55.2 54.0 54.5
15:30 GB Markit/CIPS UK Services PMI Mar 51.7 54.2 54.5
15:30 GB Official Reserves Changes Mar $1493m -- $651m
16:00 EZ PPI MoM Feb 0.1% 0.0% 0.4%
16:00 EZ PPI YoY Feb 1.6% 1.5% 1.5% 1.6%
16:00 EZ Retail Sales MoM Feb 0.1% 0.6% -0.1% -0.3%
16:00 EZ Retail Sales YoY Feb 1.8% 2.3% 2.3% 1.5%
19:30 US Initial Jobless Claims Mar-31 242k 225k 215k 218k
19:30 US Continuing Claims Mar-24 1808k 1843k 1871k 1872k
19:30 US Trade Balance Feb -$57.6b -$56.8b -$56.6b -$56.7b
Fri/06-Apr-18 00:00 US Fed's Bostic Speaks on Financial Literacy
06:30 JP Household Spending YoY Feb 0.7% 2.0%
06:50 JP Official Reserve Assets Mar - -- $1261.7b
07:00 JP Labor Cash Earnings YoY Feb -- 0.7%
07:00 JP Real Cash Earnings YoY Feb -- -0.9%
07:30 HK Nikkei Hong Kong PMI Mar -- 51.7
12:00 JP Coincident Index Feb P -- 114.9
12:00 JP Leading Index CI Feb P -- 105.6
13:00 DE Industrial Production SA MoM Feb 0.3% -0.1%
13:00 DE Industrial Production WDA YoY Feb 4.5% 5.5%
14:30 DE Markit Germany Construction PMI Mar -- 52.7
15:10 EZ Markit Eurozone Retail PMI Mar -- 52.3
15:10 DE Markit Germany Retail PMI Mar -- 53.8
19:30 US Average Hourly Earnings MoM Mar 0.2% 0.1%
19:30 US Average Hourly Earnings YoY Mar 2.8% 2.6%
19:30 US Average Weekly Hours All Employees Mar 34.5 34.5
19:30 US Change in Manufacturing Payrolls Mar 25k 31k
19:30 US Change in Nonfarm Payrolls Mar 189k 313k
19:30 US Change in Private Payrolls Mar 200k 287k
19:30 CA Full Time Employment Change Mar -- -39.3
19:30 CA Hourly Earnings Permanent Employees YoY Mar -- 3.1%
19:30 US Labor Force Participation Rate Mar -- 63.0%
19:30 CA Net Change in Employment Mar -- 15.4k
19:30 CA Part Time Employment Change Mar -- 54.7
19:30 CA Participation Rate Mar -- 65.5
19:30 US Two-Month Payroll Net Revision Mar -- --
19:30 US Underemployment Rate Mar -- 8.2%
19:30 CA Unemployment Rate Mar -- 5.8%
19:30 US Unemployment Rate Mar 4.0% 4.1%
21:00 CA Ivey Purchasing Managers Index SA Mar -- 59.6
Sat/07-Apr-18 00:00 US Baker Hughes U.S. Rig Count Apr-06 -- 993
N/A CN Foreign Reserves Mar -- $3134.48b

Page 6 of 25
Daily Outlook 06-Apr 18
ASIAN STOCK INDEX
Japanese stocks rose on Thursday after Wall Street bounced back
from a sell-off triggered by an escalating U.S.-China trade spat,
sending most sectors into positive territory.
The Nikkei gained 1.5 percent to 21,645.42, trading above its 200-day
moving average of 21,359.22.
Wall Street bounced from an initial sell-off on Wednesday, as fears of
a trade war between the United States and China eased somewhat
after President Donald Trump's economic adviser Larry Kudlow said
the administration was in "negotiation" with China, and not engaged
in a trade war.
The broader Topix advanced 1.1 percent to 1,724.61, with 28 of its 33
subsectors rising.
Precision machinery makers, real estate companies and banks
outperformed. Terumo Corp rallied 3.9 percent, Canon Inc rose 2.3
percent, Mitsubishi Estate climbed 2.3 percent, while Mitsubishi UFJ
Financial Group and Sumitomo Mitsui Financial Group both advanced
1.9 percent.
Soy sauce maker Kikkoman Corp jumped 3.1 percent on hopes of
lower import cost.
Soybean prices tumbled 2.2 percent, after China announced plans to
impose import duties on key U.S. imports including soybeans, beef
and corn in retaliation for U.S. proposals to impose tariffs on $50
billion in Chinese goods.
South Korean KOSPI stock index rose more than 1 percent on
Thursday, supported by heavy bargain-hunting, while the won held
steady on the local platform and bond yields rose.
At 06:32 GMT, the KOSPI was up 29.46 points or 1.22 percent at
2,437.52.
Tech giant Samsung Electronics rose 3.9 percent on high expectations
of robust first-quarter earnings. The company's earnings guidance for
the March quarter will be released on Friday.
The won was quoted at 1,059.7 per dollar on the onshore settlement
platform, 0.01 percent firmer than its previous close at 1,059.8.
In offshore trading, the won was quoted at 1,059.27 per U.S. dollar,
down 0.19 percent from the previous day, while in one-year non-
deliverable forwards it was being asked at 1,044.35 per dollar.
MSCI's broadest index of Asia-Pacific shares outside Japan was up
0.54 percent, after U.S. stocks ended the previous session with gains.
Japanese stocks rose 1.53 percent.
The KOSPI is down around 2.4 percent so far this year, and has risen
0.29 percent in the previous 30 days.
The current price-to-earnings ratio is 12.10, the dividend yield is 1.28
percent and the market capitalisation is 1,242.04 trillion won.
The trading volume during the session was 574,657,000 shares, and
of the total traded issues of 888, the number of advancing shares was
473.
Foreigners were net buyers of 72,002 million won worth of shares.
The U.S dollar has fallen 0.67 percent against the won this year. The
won's high for the year is 1,053.55 per dollar on April 2 and the low is
1,098.4 on Feb. 6.
In money and debt markets, June futures on three-year treasury
bonds fell 0.04 points to 107.85.
The Korean three-month Certificate of Deposit benchmark rate was
quoted at 1.65 percent, while the benchmark three-year Korean
treasury bond yielded 2.176 percent, higher than the previous day's
2.17 percent.
Hong Kong's financial markets closed on Thursday, April 5, for the
Ching Ming Festival.
Markets will resume trading on Friday, April 6.
China stocks closed for the Tomb Sweeping Day holiday on Thursday.
(SourceReuters,Research:rizal)

Page 7 of 25
Daily Outlook 06-Apr 18
ASIA AND GLOBAL MARKET SPOT PRICE 2018 HIGH / LOW .N225 .KS200 .HSI .DJI /.SPX /.SSEC
RECORD HIGH 38915.87
(29/Dec/89)
339.59
(02/Nov/2017)
33154.12
(26/Jan/2018)
26616.71
(26/Jan/2018)
2872.62
(26/Jan/2018)
6124.04400
(16/Oct./07)
2017 HIGH 23439.15
(13/Nov/2017)
339.59
(02/Nov/2017)
30199.69
(22/Nov/2017)
24876.07
(18/Dec/2017)
2694.97
(18/Dec/2017)
3450.49490
(14/Nov/2017)
2018 HIGH 24129.34
(23/Jan/2018)
338.05
(29/Jan/2018)
33154.12
(26/Jan/2018)
26616.71
(26/Jan/2018)
2872.62
(26/Jan/2018)
3587.50890
(29/Jan/2018)
2018 LOW 20617.86
(23/Mar/2018)
304.58
(05/Mar/2018)
29129.26
(09/Feb/2018)
23360.29
(08/Feb/2018)
2532.69
(08/Feb/2018)
3062.74260
(08/Feb/2018)
2017 LOW 18224.68
(17/Apr/2017)
258.64
(02/Jan/2017)
21883.82
(03/Jan/2017)
19677.94
(19/Jan/2017)
2245.13
(03/Jan/2017)
3016.53050
(11/May/2017)
RECORD LOW 85.25
(06/Jul/50)
31.96
(16/Jun/98)
58.61
(31/Aug/67)
388.20
(17/Jan/55)
132.93
(23/Nov./82)
325.92200
(29/Jul/94)
Closing Prices – 05 April 2018
CLOSE CHANGE CLOSE CHANGE
.DJI 24505.22 � 240.92/0.99% .N225 21645.42 � 325.87/1.53%
/.SPX 2662.83 � 18.14/0.68% .KS200 313.04 � 4.50/1.46%
/.IXIC 7076.552 � 34.445/0.49% .HSI HOLIDAY � 661.41/2.19%
JPY= 107.37 � 0.60/0.56% /.SSEC HOLIDAY � 4.79410/0.15%
KRW= 1061.63 � 4.35/0.41% /CLc1 (Oil) 63.73 � 0.17/0.27%

Page 8 of 25
Daily Outlook 06-Apr 18
SSIamM8 (Nikkei Jun Futures) – Last Trading Date: 07 Jun 2018
• RSI 14 is near the oversold zone
• Daily daily corrections
• Potential gap up
(Research – rizal)
DATE OPEN HIGH LOW RANGE CLOSE SETTLE CHANGE % CHANGE VOLUME
05 Apr SSIpmM8 21690 21910 21655 255 21860 --- � 200 0.92 25026
05 Apr SSIamM8 21545 21735 21450 285 21660 21660 � 325 1.52 63236
04 Apr SSIpmM8 21325 21570 21025 545 21525 --- � 190 0.89 42023
04 Apr SSIamM8 21455 21465 21225 240 21335 21335 Flat Flat 51341
03 Apr SSIpmM8 21295 21525 21280 245 21515 --- � 180 0.84 27129
03 Apr SSIamM8 21060 21340 21030 310 21335 21335 � 95 0.44 63816
02 Apr SSIpmM8 21415 21440 20920 520 21050 --- � 380 1.77 31803
02 Apr SSIamM8 21420 21595 21345 250 21430 21430 � 20 0.09 57322
30 Mar SSIpmM8 H O L I D A Y
30 Mar SSIamM8 H O L I D A Y
WEEKLY APRIL MARCH 2018
HIGH LOW HIGH LOW HIGH LOW HIGH LOW
21910 20920 21910 20920 21965 20130 24170 20130
(05/Apr) (02/Apr) (05/Apr) (02/Apr) (01/Mar) (23/Mar) (23/Jan) (23/Mar)
ANALYSIS & RECOMMENDATION
RESISTANCE
22735 High Feb 06,2018
22510 High Feb 27,2018
22415 High Feb 28,2018
22180 High Mar 01,2018
SUPPORT
21720 Low on 1 Hourly Chart
21615 Low on 1 Hourly Chart
21435 Low on 1 Hourly Chart
21290 Low on 1 Hourly Chart
RECOMMENDATION
BUY 21910
SELL ----
STOP LOSS 21710
TARGET 22160
22310
Daily SSIcm1 22/11/2017 - 12/04/2018 (JAK)
20530
20130
21925
23485
22335
21735
24170
EMA; SSIcm1; Trade Price(Last); 2005/04/2018; 21.373,11WMA; SSIcm1; Trade Price(Last); 5505/04/2018; 21.521,67Cndl; SSIcm1; Trade Price05/04/2018; 21.325,00; 21.735,00; 21.025,00; 21.880,00
Price
JPY
Auto
20.100
20.400
20.700
21.000
21.300
21.600
21.900
22.200
22.500
22.800
23.100
23.400
23.700
24.000
RSI; SSIcm1; Trade Price(Last); 14; Exponential05/04/2018; 68,108 Value
JPY
Auto
40
Mom; SSIcm1; Trade Price(Last); 1405/04/2018; 425,00
Value
JPY
Auto
-2.000
27 04 11 18 25 02 08 15 22 29 05 12 19 26 05 12 19 26 02 09
Nop 17 Desember 2017 Januari 2018 Februari 2018 Maret 2018 April 2018

Page 9 of 25
Daily Outlook 06-Apr 18
KSM8 (Kospi Jun Futures) – Exp. Date: 07 Jun 2018
• Daily daily corrections
• RSI 14 is near the oversold
zone
• Potential gap up
(Research – rizal)
DATE OPEN HIGH LOW RANGE CLOSE SETTLE CHANGE %
CHANGE VOLUME
05 Apr 311.75 315.10 311.05 4.05 314.10 314.10 � 5.40 1.75 224126
04 Apr 314.65 314.70 308.70 6.00 308.70 308.70 � 5.25 1.67 203914
03 Apr 312.10 314.30 311.00 3.30 313.95 313.95 � 0.65 0.21 204435
02 Apr 315.70 318.10 314.60 3.50 314.60 314.60 � 1.10 0.35 153456
30 Mar 317.15 318.00 315.40 2.60 315.70 315.70 � 0.10 0.03 134595
29 Mar 312.95 315.60 311.55 4.05 315.60 315.60 � 3.80 1.22 219293
WEEKLY APRIL MARCH 2018
HIGH LOW HIGH LOW HIGH LOW HIGH LOW
318.10 308.70 318.10 308.70 325.50 304.05 340.30 302.10
(02/Apr) (04/Apr) (02/Apr) (04/Apr) (22/Mar) (05/Mar) (29/Jan) (09/Feb)
ANALYSIS & RECOMMENDATION
RESISTANCE
322.30 High Feb 07,2018
318.85 High Feb 26,2018
317.80 High Mar 23,2018
315.10 High Apr 05,2018
SUPPORT
311.00 Low Apr 03,2018
310.10 Low Mar 26,2018
308.80 Low Mar 07,2018
306.75 Low Mar 06,2018
RECOMMENDATION
BUY 315.10
SELL ----
STOP LOSS 313.60
TARGET 317.60
319.10
Daily KSc1 12/12/2017 - 18/04/2018 (JAK)
304.05
315.10
340.30
325.50
302.10
336.30
308.70
Cndl; KSc1; Trade Price05/04/2018; 311,75; 315,10; 311,05; 314,10EMA; KSc1; Trade Price(Last); 2005/04/2018; 315,85WMA; KSc1; Trade Price(Last); 5505/04/2018; 317,01
Price
KRW
Auto
300
303
306
309
312
315
318
321
324
327
330
333
336
339
RSI; KSc1; Trade Price(Last); 14; Exponential05/04/2018; 47,183 Value
KRW
AutoMom; KSc1; Trade Price(Last); 1405/04/2018; -9,05
ValueKRW
Auto
-20
18 26 02 08 15 22 29 05 12 19 26 05 12 19 26 02 09 16
Desember 2017 Januari 2018 Februari 2018 Maret 2018 April 2018
Page 10 of 25
Daily Outlook 06-Apr 18
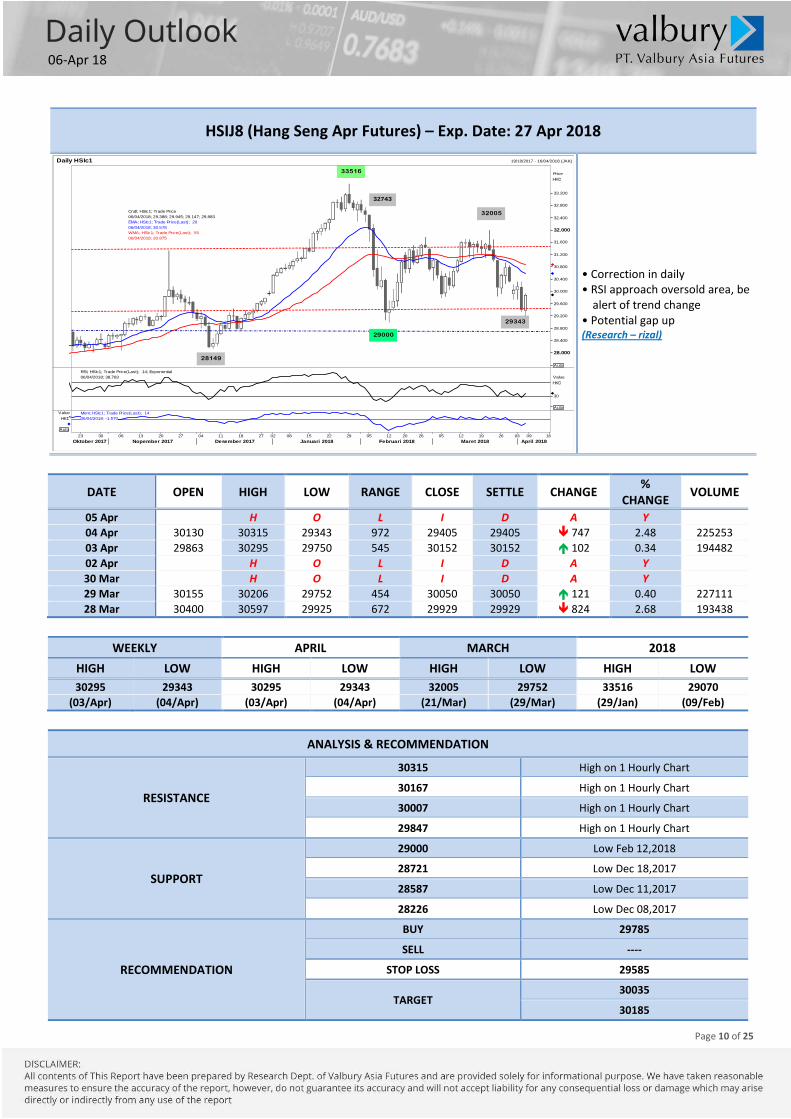
HSIJ8 (Hang Seng Apr Futures) – Exp. Date: 27 Apr 2018
• Correction in daily
• RSI approach oversold area, be
alert of trend change
• Potential gap up
(Research – rizal)
DATE OPEN HIGH LOW RANGE CLOSE SETTLE CHANGE %
CHANGE VOLUME
05 Apr H O L I D A Y
04 Apr 30130 30315 29343 972 29405 29405 � 747 2.48 225253
03 Apr 29863 30295 29750 545 30152 30152 � 102 0.34 194482
02 Apr H O L I D A Y
30 Mar H O L I D A Y
29 Mar 30155 30206 29752 454 30050 30050 � 121 0.40 227111
28 Mar 30400 30597 29925 672 29929 29929 � 824 2.68 193438
WEEKLY APRIL MARCH 2018
HIGH LOW HIGH LOW HIGH LOW HIGH LOW
30295 29343 30295 29343 32005 29752 33516 29070
(03/Apr) (04/Apr) (03/Apr) (04/Apr) (21/Mar) (29/Mar) (29/Jan) (09/Feb)
ANALYSIS & RECOMMENDATION
RESISTANCE
30315 High on 1 Hourly Chart
30167 High on 1 Hourly Chart
30007 High on 1 Hourly Chart
29847 High on 1 Hourly Chart
SUPPORT
29000 Low Feb 12,2018
28721 Low Dec 18,2017
28587 Low Dec 11,2017
28226 Low Dec 08,2017
RECOMMENDATION
BUY 29785
SELL ----
STOP LOSS 29585
TARGET 30035
30185
Daily HSIc1 19/10/2017 - 16/04/2018 (JAK)
32005
29343
29000
32743
28149
33516
Cndl; HSIc1; Trade Price06/04/2018; 29.388; 29.945; 29.147; 29.883EMA; HSIc1; Trade Price(Last); 2006/04/2018; 30.578WMA; HSIc1; Trade Price(Last); 5506/04/2018; 30.875
PriceHKD
Auto
28.000
28.400
28.800
29.200
29.600
30.000
30.400
30.800
31.200
31.600
32.000
32.400
32.800
33.200
RSI; HSIc1; Trade Price(Last); 14; Exponential06/04/2018; 38,783 Value
HKD
Auto
30
Mom; HSIc1; Trade Price(Last); 1406/04/2018; -1.570
Value
HKD
Auto
23 30 06 13 20 27 04 11 18 27 02 08 15 22 29 05 12 20 26 05 12 19 26 03 09 16
Oktober 2017 Nopember 2017 Desember 2017 Januari 2018 Februari 2018 Maret 2018 April 2018

Page 11 of 25
Daily Outlook 06-Apr 18
CURRENCIES – Daily Outlook
Dollar rebounds as trade tension eases, for now - Reuters News
The dollar rose to a two-week high against a currency
basket on Thursday, bolstered by a rebound on Wall
Street and signs the United States is looking to
resolve a trade dispute with China.
The U.S. currency also climbed to a three-week peak
against the yen and a 10-week high versus the Swiss
franc, two safe-haven assets that investors buy in
times of market turmoil.
White House economic adviser Larry Kudlow said on
Thursday he expects the United States and China to
work out their trade differences over time and that
trade barriers likely "will come down on both sides."
His comments prompted a recovery in the dollar.
"(China's) measures are unlikely to see full
implementation and are designed to tilt game-theoretic odds in favor of a compromise," said Karl
Schamotta, director of global product & market strategy at Cambridge Global Payments in Toronto.
"Given its status as a surplus-earning creditor nation, China will likely make small concessions eventually,
reducing some tariffs and enhancing intellectual property protections – but only those that serve broader
strategic goals," he added.
China's state news agency Xinhua said on Thursday that China will win any trade war with the United States.
That belief stems from the country's massive consumer market, which has been its one big advantage.
Beijing on Wednesday imposed tariffs on key U.S. imports including soybeans, planes, cars, beef and
chemicals in response to similar measures from the United States.
That spurred a rally in the yen and a sell-off in stocks on Wednesday.
In late trading, the dollar rose 0.4 percent against a basket of six currencies to 90.47. Earlier, the index hit a
two-week high of 90.454.
In a broader sign that global currency markets had not been rattled, a basket of currency options of the
major currencies ticked toward 2018 lows of 7.8 after a spike in February.
Against the yen, the dollar advanced to a 10-week high of 107.49 yen and was last up 0.6 percent at 107.42.
The greenback surged to a 10-week high of 0.9639 Swiss franc, last changing hands at 0.9636, up 0.3
percent.
Data on Thursday also showed the U.S. trade deficit grew to a near 9-1/2-year high in February, with both
exports and imports rising to record peaks. But the shortfall with China narrowed sharply.
Beyond the trade war, investors are focused on Friday's U.S. non-farm payrolls report, which should
determine the future pace of interest rate increases and consequently the dollar's outlook. (Source Reuters, Research – @her1en)

Page 12 of 25
Daily Outlook 06-Apr 18
EUR/USD
Interest Rate: 0.00% (EU)/ 1.25%-1.50% (US)
• With the support area at 1.2029
• Important resistance around
1.2555 (Research – @her1en)
DATE OPEN HIGH LOW RANGE CLOSE CHANGE PREVIOUS
Apr 05 1.22810 1.22890 1.22171 71,9 1.22382 � 38,6 1.22768
Apr 04 1.22691 1.23133 1.22557 57,6 1.22768 � 9,6 1.22672
Apr 03 1.23005 1.23349 1.22524 82,5 1.22672 � 32,5 1.22997
Apr 02 1.23160 1.23437 1.22803 63,4 1.22997 � 4 1.22993
Mar 30 H O L I D A Y
WEEKLY APRIL MARCH 2018
HIGH LOW HIGH LOW HIGH LOW HIGH LOW
1.23437 1.22171 1.23437 1.22171 1.24752 1.21532 1.25542 1.19145
(02/Apr) (05/Apr) (02/Apr) (05/Apr) (27/Mar) (01/Mar) (16/Feb) (09/Jan)
ANALYSIS & RECOMMENDATION
RESISTANCE
1.2770 High Oct 29, 2014
1.2639 High Oct 30,2014
1.2555 Reaction high on daily chart
1.2422 High Mar 28,2018
SUPPORT
1.2153 Reaction low on daily chart
1.2029 Low Jan 12,2018
1.1927 Low Jan 11,2018
1.1815 Low Dec 22, 2017
RECOMMENDATION
BUY -----
SELL 1.2265
STOP LOSS 1.2340
TARGET 1.2190
1.2155
Daily EUR= 14/12/2017 - 12/04/2018 (JAK)
1.2029
1.1815
1.1736
1.2153
1.2555
1.2476
1.2216
Cndl; EUR=; Bid06/04/2018; 1,2238; 1,2242; 1,2235; 1,2239EMA; EUR=; Bid(Last); 2006/04/2018; 1,2304WMA; EUR=; Bid(Last); 5506/04/2018; 1,2323
Price
USD
Auto
1,165
1,17
1,175
1,18
1,185
1,19
1,195
1,2
1,205
1,21
1,215
1,22
1,225
1,23
1,235
1,24
1,245
1,25
1,255
RSI; EUR=; Bid(Last); 14; Exponential06/04/2018; 36,915
Value
USD
Auto
30
60
Mom; EUR=; Bid(Last); 1406/04/2018; -0,0094
Value
USD
Auto
0
18 25 01 08 15 22 29 05 12 19 26 05 12 19 26 02 09
Desember 2017 Januari 2018 Februari 2018 Maret 2018 April 2018
@her1en

Page 13 of 25
Daily Outlook 06-Apr 18
USD/JPY Interest Rate: 1.50%-1.75% (US)/-0.1% (JP)
• The main resistance at 108.77,
support 103.08
• Daily RSI is up
(Research – rizal)
DATE OPEN HIGH LOW RANGE CLOSE CHANGE PREVIOUS
Apr 05 106.749 107.480 106.699 78,1 107.367 � 60,6 106.761
Apr 04 106.581 106.835 105.979 85,6 106.761 � 16,4 106.597
Apr 03 105.834 106.645 105.681 96,4 106.597 � 72,7 105.870
Apr 02 106.291 106.437 105.646 79,1 105.870 � 54,4 106.414
Mar 30 H O L I D A Y
WEEKLY APRIL MARCH 2018
HIGH LOW HIGH LOW HIGH LOW HIGH LOW
107.480 105.646 107.480 105.646 107.282 104.623 113.376 104.623
(05/Apr) (02/Apr) (05/Apr) (02/Apr) (13/Mar) (23/Mar) (08/Jan) (23/Mar)
ANALYSIS & RECOMMENDATION
RESISTANCE
110.29 High Feb 05, 2018
109.78 High Feb 08, 2018
108.77 High Feb 13,2018
107.67 High Feb 27,2018
SUPPORT
105.97 Low Apr 04,2018
105.30 Low Mar 28,2018
104.55 Low Mar 26,2018
103.08 Low Nov 07,2016
RECOMMENDATION
BUY 107.20
SELL ----
STOP LOSS 106.45
TARGET 108.00
108.30
Daily JPY= 19/10/2017 - 13/04/2018 (JAK)
104.55
107.90
113.74
110.47
107.49
105.52
Cndl; JPY=; Bid05/04/2018; 106,76; 107,49; 106,70; 107,37EMA; JPY=; Bid(Open); 2005/04/2018; 106,27WMA; JPY=; Bid(Last); 5505/04/2018; 106,62SMA; JPY=; Bid(Last); 20005/04/2018; 110,66
Price
/USD
Auto
104
104,5
105
105,5
106
106,5
107
107,5
108
108,5
109
109,5
110
110,5
111
111,5
112
112,5
113
113,5
RSI; JPY=; Bid(Last); 14; Exponential05/04/2018; 66,344 Value
/USD
Auto
40
Mom; JPY=; Bid(Last); 1405/04/2018; 1,37
Value/USD
Auto-3
23 30 06 13 20 27 04 11 18 25 01 08 15 22 29 05 12 19 26 05 12 19 26 02 09Okt 17 Nopember 2017 Desember 2017 Januari 2018 Februari 2018 Maret 2018 April 2018

Page 14 of 25
Daily Outlook 06-Apr 18
GBP/USD Interest Rate: 0.50% (GB)/1.50%-1.75% (US)
• Correction in daily
• RSI 14 is up
(Research –rizal)
DATE OPEN HIGH LOW RANGE CLOSE CHANGE PREVIOUS
Apr 05 1.40844 1.40960 1.39646 131,4 1.39992 � 79,5 1.40787
Apr 04 1.40588 1.40953 1.40139 81,4 1.40787 � 27,3 1.40514
Apr 03 1.40481 1.40877 1.40197 68,0 1.40514 � 10,0 1.40414
Apr 02 1.40314 1.40766 1.40251 51,5 1.40414 � 22,2 1.40192
Mar 30 H O L I D A Y
WEEKLY APRIL MARCH 2018
HIGH LOW HIGH LOW HIGH LOW HIGH LOW
1.40960 1.39646 1.40960 1.39646 1.42432 1.37106 1.43438 1.34571
(05/Apr) (05/Apr) (05/Apr) (05/Apr) (26/Mar) (01/Mar) (25/Jan) (11/Jan)
ANALYSIS & RECOMMENDATION
RESISTANCE
1.4344 High Jan 25,2018
1.4277 High Feb 02,2018
1.4200 High Mar 28,2018
1.4097 High Apr 05,2018
SUPPORT
1.3910 Low Mar 19,2018
1.3838 Low Mar 12,2018
1.3710 Low Mar 01,2018
1.3532 Low Jan 12,2018
RECOMMENDATION
BUY ----
SELL 1.4025
STOP LOSS 1.4105
TARGET 1.3925
1.3895
Daily GBP= 25/10/2017 - 13/04/2018 (JAK)
1.4344
1.4244
1.3455
1.3710
1.3300
1.3963
Cndl; GBP=; Bid05/04/2018; 1,4076; 1,4097; 1,3963; 1,4003EMA; GBP=; Bid(Open); 2005/04/2018; 1,4031WMA; GBP=; Bid(Last); 5505/04/2018; 1,3992SMA; GBP=; Bid(Last); 20005/04/2018; 1,3434
Price
USD
Auto
1,31
1,32
1,33
1,34
1,35
1,36
1,37
1,38
1,39
1,4
1,41
1,42
1,43
RSI; GBP=; Bid(Last); 14; Exponential05/04/2018; 43,498 Value
USD
Auto
30
60
Mom; GBP=; Bid(Last); 1405/04/2018; 0,0064
Value
USD
Auto
30 06 13 20 27 04 11 18 25 01 08 15 22 29 05 12 19 26 05 12 19 26 02 09Okt 17 Nopember 2017 Desember 2017 Januari 2018 Februari 2018 Maret 2018 April 2018

Page 15 of 25
Daily Outlook 06-Apr 18
USD/CHF Interest Rate: 1.50%-1.75% (US)/-1.25 to -0.25% (CH)
• Daily RSI enters the oversold
area
• Main resistance 0.9770, support
0.9337
(Research – rizal)
DATE OPEN HIGH LOW RANGE CLOSE CHANGE PREVIOUS
Apr 05 0.96054 0.96388 0.95969 41,9 0.96339 � 27,7 0.96062
Apr 04 0.95868 0.96104 0.95500 60,4 0.96062 � 18,4 0.95878
Apr 03 0.95484 0.95962 0.95316 64,6 0.95878 � 49,0 0.95388
Apr 02 0.95427 0.95633 0.95258 37,5 0.95388 � 24,1 0.95629
Mar 30 H O L I D A Y
WEEKLY APRIL MARCH 2018
HIGH LOW HIGH LOW HIGH LOW HIGH LOW
0.96388 0.95258 0.96388 0.95258 0.95824 0.93374 0.98444 0.91863
(05/Apr) (02/Apr) (05/Apr) (02/Apr) (29/Mar) (02/Mar) (10/Jan) (16/Feb)
ANALYSIS & RECOMMENDATION
RESISTANCE
0.9904 High Dec 27,2017
0.9845 High Jan 10,2018
0.9770 High Jan 12,2018
0.9685 High Jan 15,2018
SUPPORT
0.9520 Low Mar 30,2018
0.9420 Low Mar 08,2018
0.9337 Low Mar 05,2018
0.9261 Low Feb 19,2018
RECOMMENDATION
BUY 0.9610
SELL ----
STOP LOSS 0.9535
TARGET 0.9690
0.9720
Daily CHF= 23/10/2017 - 13/04/2018 (JAK)
0.9639
0.9337
0.9666
0.9977
0.9431
0.9845
0.9186
Cndl; CHF=; Bid05/04/2018; 0,9608; 0,9639; 0,9596; 0,9633EMA; CHF=; Bid(Open); 2005/04/2018; 0,9512WMA; CHF=; Bid(Last); 5505/04/2018; 0,9464
Price
/USD
Auto
0,91
0,915
0,92
0,925
0,93
0,935
0,94
0,945
0,95
0,955
0,96
0,965
0,97
0,975
0,98
0,985
0,99
0,995
1
RSI; CHF=; Bid(Last); 14; Exponential05/04/2018; 74,095 Value
/USD
Auto
30
60
Mom; CHF=; Bid(Last); 1405/04/2018; 0,0113
Value
/USD
Auto-0,03
23 30 06 13 20 27 04 11 18 25 01 08 15 22 29 05 12 19 26 05 12 19 26 02 09
Okt 17 Nopember 2017 Desember 2017 Januari 2018 Februari 2018 Maret 2018 April 2018

Page 16 of 25
Daily Outlook 06-Apr 18
AUD/USD Interest Rate: 1.5% (AU)/ 1.25%-1.50% (US)
• RSI 14 approaches the oversold
area
• The main resistance at 0.8043,
support 0.7410 (Research – @her1en)
DATE OPEN HIGH LOW RANGE CLOSE CHANGE PREVIOUS
Apr 05 0.77155 0.77252 0.76728 52,4 0.76811 � 30,5 0.77116
Apr 04 0.76844 0.77203 0.76615 58,8 0.77116 � 29,3 0.76823
Apr 03 0.76599 0.77058 0.76508 55,0 0.76823 � 22,3 0.76600
Apr 02 0.76850 0.76938 0.76484 45,4 0.76600 � 17,4 0.76774
Mar 30 H O L I D A Y
WEEKLY APRIL MARCH 2018
HIGH LOW HIGH LOW HIGH LOW HIGH LOW
0.77252 0.76484 0.77252 0.76484 0.79152 0.76417 0.81346 0.76417
(05/Apr) (02/Apr) (05/Apr) (02/Apr) (14/Mar) (29/Mar) (26/Jan) (29/Mar)
ANALYSIS & RECOMMENDATION
RESISTANCE
0.8043 High Feb 02,2018
0.7966 High Feb 15,2018
0.7885 High Mar 15,2018
0.7757 High Mar 27,2018
SUPPORT
0.7640 Low Mar 29
0.7549 Low Dec 13,2017
0.7498 Low Dec 08,2017
0.7410 Low June 05, 2017
ECOMMENDATION
BUY 0.7670
SELL -----
STOP LOSS 0.7595
TARGET 0.7745
0.7780
Daily AUD= 16/11/2017 - 13/04/2018 (JAK)
0.7498
0.7988
0.76510.7640
0.8135
0.7916
EMA; AUD=; Bid(Last); 2006/04/2018; 0,7721WMA; AUD=; Bid(Last); 5506/04/2018; 0,7772Cndl; AUD=; Bid06/04/2018; 0,7681; 0,7686; 0,7679; 0,7685
Price
USD
Auto
0,75
0,755
0,76
0,765
0,77
0,775
0,78
0,785
0,79
0,795
0,8
0,805
0,81
RSI; AUD=; Bid(Last); 14; Exponential06/04/2018; 44,463 Value
USD
AutoMom; AUD=; Bid(Last); 1406/04/2018; -0,0032 Value
USD
Auto20 27 04 11 18 25 01 08 15 22 29 05 12 19 26 05 12 19 26 02 09
Nopember 2017 Desember 2017 Januari 2018 Februari 2018 Maret 2018 April 2018
@her1en

Page 17 of 25
Daily Outlook 06-Apr 18
NZD/USD Interest Rate: 2.00% (NZ)/ 1.25%-1.50% (US)
• A series of high level rises in the
daily
• RSI 14 stay away the oversold area
(Research – @her1en)
DATE OPEN HIGH LOW RANGE CLOSE CHANGE PREVIOUS
Apr 05 0.73091 0.73216 0.72614 60,2 0.72703 � 33,8 0.73041
Apr 04 0.72552 0.73101 0.72544 55,7 0.73041 � 50,7 0.72534
Apr 03 0.72127 0.72697 0.71942 75,5 0.72534 � 45,4 0.72080
Apr 02 0.72342 0.72393 0.72073 32,0 0.72080 � 21,3 0.72293
Mar 30 H O L I D A Y
WEEKLY APRIL MARCH 2018
HIGH LOW HIGH LOW HIGH LOW HIGH LOW
0.73216 0.71942 0.73216 0.71942 0.73539 0.71522 0.74359 0.70438
(05/Apr) (03/Apr) (05/Apr) (03/Apr) (13/Mar) (21/Mar) (16/Feb) (02/Jan)
ANALYSIS & RECOMMENDATION
RESISTANCE
0.7558 High Jul 27,2017
0.7524 High Aug 01,2017
0.7436 High Feb 16,2018
0.7354 High Mar 14,2018
SUPPORT
0.7193 Low Apr 03
0.7151 Low Mar 21,2018
0.7071 Low Jan 02,2018
0.6963 Reaction low on daily chart
RECOMMENDATION
BUY 0.7255
SELL -----
STOP LOSS 0.7180
TARGET 0.7330
0.7365
Daily NZD= 24/11/2017 - 13/04/2018 (JAK)
0.7071
0.7151
0.6820
0.7436
0.6963
0.7354
Cndl; NZD=; Bid06/04/2018; 0,7275; 0,7276; 0,7269; 0,7272EMA; NZD=; Bid(Last); 2006/04/2018; 0,7257WMA; NZD=; Bid(Last); 5506/04/2018; 0,7268
Price
USD
Auto
0,68
0,685
0,69
0,695
0,7
0,705
0,71
0,715
0,72
0,725
0,73
0,735
0,74
RSI; NZD=; Bid(Last); 14; Exponential06/04/2018; 53,904 Value
USD
Auto
Mom; NZD=; Bid(Last); 1406/04/2018; 0,0030 Value
USD
Auto27 04 11 18 25 01 08 15 22 29 05 12 19 26 05 12 19 26 02 09
Nop 17 Desember 2017 Januari 2018 Februari 2018 Maret 2018 April 2018
@her1en

Page 18 of 25
Daily Outlook 06-Apr 18
EUR/JPY Interest Rate: 0.00% (EU)/-0.1% (JP)
• RSI 14 is up
• Important resistance at 133.09,
support at 128.51
(Research – rizal)
DATE OPEN HIGH LOW RANGE CLOSE CHANGE PREVIOUS
Apr 05 131.109 131.481 131.044 43,7 131.431 � 34,7 131.084
Apr 04 130.781 131.177 130.215 96,2 131.084 � 29,4 130.790
Apr 03 130.194 130.903 129.971 93,2 130.790 � 55,7 130.233
Apr 02 130.921 131.278 129.962 131,6 130.233 � 64,5 130.878
Mar 30 H O L I D A Y
WEEKLY APRIL MARCH 2018
HIGH LOW HIGH LOW HIGH LOW HIGH LOW
131.481 129.962 131.481 129.962 132.415 128.931 137.486 128.931
(05/Apr) (02/Apr) (05/Apr) (02/Apr) (13/Mar) (23/Mar) (02/Feb) (23/Mar)
ANALYSIS & RECOMMENDATION
RESISTANCE
134.16 High Feb 09,2018
133.09 High Feb 16,2018
132.37 High Feb 19,2018
131.81 High Mar 27,2018
SUPPORT
129.59 Low Mar 19,2018
128.51 Low Aug 24,2017
127.82 Low Aug 21,2017
126.47 Low June 28, 2017
RECOMMENDATION
BUY 131.20
SELL ----
STOP LOSS 130.40
TARGET 132.20
132.50
Daily EURJPY= 25/09/2017 - 16/04/2018 (JAK)
133.05
129.33
134.79
131.81
128.94
136.62
137.50
Cndl; EURJPY=; Bid05/04/2018; 131,08; 131,49; 131,05; 131,43EMA; EURJPY=; Bid(Open); 2005/04/2018; 130,92WMA; EURJPY=; Bid(Last); 5505/04/2018; 131,43
Price
JPY
Auto
128,5
129
129,5
130
130,5
131
131,5
132
132,5
133
133,5
134
134,5
135
135,5
136
136,5
137
137,5
RSI; EURJPY=; Bid(Last); 14; Exponential05/04/2018; 57,537
ValueJPY
AutoMom; EURJPY=; Bid(Last); 1405/04/2018; 1,19
ValueJPY
Auto
25 02 09 16 23 30 06 13 20 27 04 11 18 25 01 08 15 22 29 05 12 19 26 05 12 19 26 02 09 16Oktober 2017 Nopember 2017 Desember 2017 Januari 2018 Februari 2018 Maret 2018 April 2018

Page 19 of 25
Daily Outlook 06-Apr 18
USD/CAD Interest Rate: 1.50%-1.75% (US)/1.25% (CA)
• RSI 14 is down
•Beware of daily corrections
(Research – rizal)
WEEKLY OPEN CURRENT PRICE
1.2900 1.2747
WEEKLY APRIL MARCH 2018
HIGH LOW HIGH LOW HIGH LOW HIGH LOW
1.2943 1.2740 1.2943 1.2740 1.3124 1.2801 1.3124 1.2246
(02/Apr) (05/Apr) (02/Apr) (05/Apr) (19/Mar) (12/Mar) (19/Mar) (31/Jan)
ANALYSIS & RECOMMENDATION
RESISTANCE
1.3197 High Jun 28,2017
1.3014 High Jul 05,2017
1.2923 High Apr 03,2018
1.2847 High Apr 04,2018
SUPPORT
1.2663 Low Feb 27,2018
1.2553 Low Feb 20,2018
1.2445 Low Feb 16,2018
1.2312 Low Jan 24,2018
RECOMMENDATION
BUY ----
SELL 1.2765
STOP LOSS 1.2840
TARGET 1.2685 – 1.2665
Daily CAD= 23/10/2017 - 13/04/2018 (JAK)
RSI; CAD=; Bid(Last); 14; Exponential05/04/2018; 30,847 Value
/USD
Auto
40
Mom; CAD=; Bid(Last); 1405/04/2018; -0,0346
Value/USD
Auto
1.2918
1.2246
1.3124
1.3000
1.2740
1.2445
Cndl; CAD=; Bid05/04/2018; 1,2768; 1,2805; 1,2740; 1,2749EMA; CAD=; Bid(Open); 2005/04/2018; 1,2872WMA; CAD=; Bid(Last); 5505/04/2018; 1,2814
Price
/USD
Auto
1,22
1,225
1,23
1,235
1,24
1,245
1,25
1,255
1,26
1,265
1,27
1,275
1,28
1,285
1,29
1,295
1,3
1,305
1,31
23 30 06 13 20 27 04 11 18 25 01 08 15 22 29 05 12 19 26 05 12 19 26 02 09Okt 17 Nopember 2017 Desember 2017 Januari 2018 Februari 2018 Maret 2018 April 2018
Page 20 of 25
Daily Outlook 06-Apr 18
Precious Metal – Daily Outlook
Gold prices drop as U.S.-China trade tensions ease - Reuters News
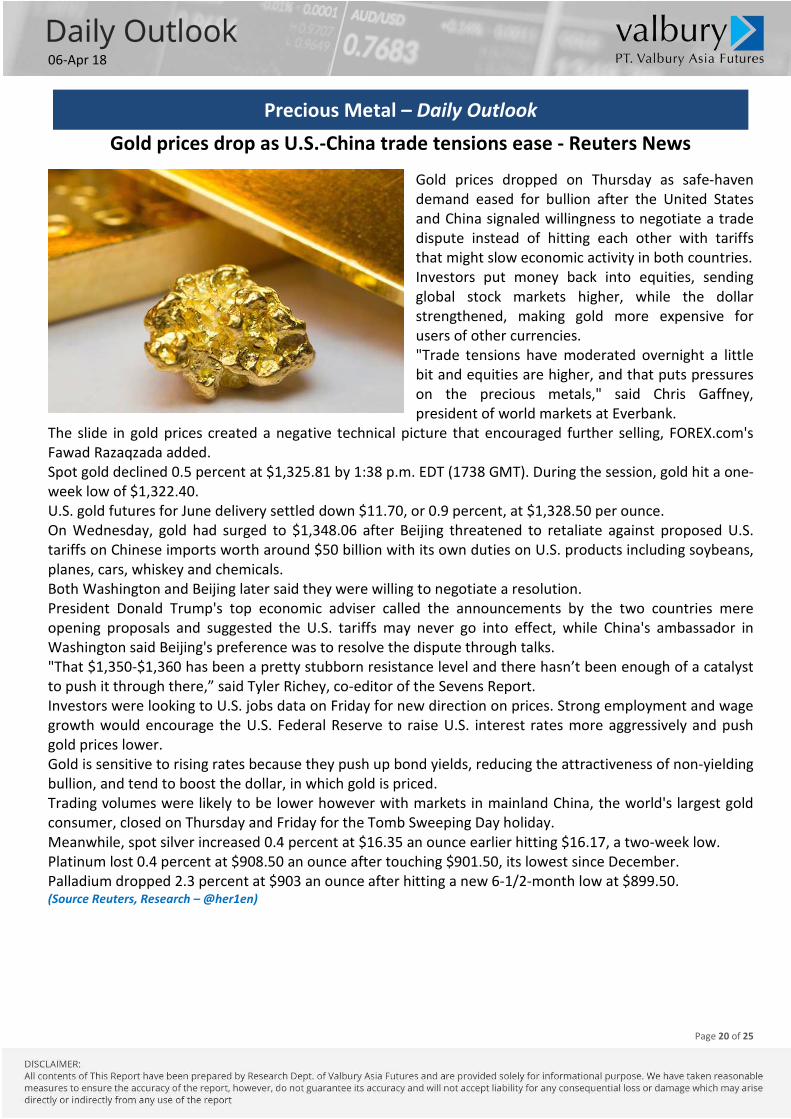
Gold prices dropped on Thursday as safe-haven
demand eased for bullion after the United States
and China signaled willingness to negotiate a trade
dispute instead of hitting each other with tariffs
that might slow economic activity in both countries.
Investors put money back into equities, sending
global stock markets higher, while the dollar
strengthened, making gold more expensive for
users of other currencies.
"Trade tensions have moderated overnight a little
bit and equities are higher, and that puts pressures
on the precious metals," said Chris Gaffney,
president of world markets at Everbank.
The slide in gold prices created a negative technical picture that encouraged further selling, FOREX.com's
Fawad Razaqzada added.
Spot gold declined 0.5 percent at $1,325.81 by 1:38 p.m. EDT (1738 GMT). During the session, gold hit a one-
week low of $1,322.40.
U.S. gold futures for June delivery settled down $11.70, or 0.9 percent, at $1,328.50 per ounce.
On Wednesday, gold had surged to $1,348.06 after Beijing threatened to retaliate against proposed U.S.
tariffs on Chinese imports worth around $50 billion with its own duties on U.S. products including soybeans,
planes, cars, whiskey and chemicals.
Both Washington and Beijing later said they were willing to negotiate a resolution.
President Donald Trump's top economic adviser called the announcements by the two countries mere
opening proposals and suggested the U.S. tariffs may never go into effect, while China's ambassador in
Washington said Beijing's preference was to resolve the dispute through talks.
"That $1,350-$1,360 has been a pretty stubborn resistance level and there hasn’t been enough of a catalyst
to push it through there,” said Tyler Richey, co-editor of the Sevens Report.
Investors were looking to U.S. jobs data on Friday for new direction on prices. Strong employment and wage
growth would encourage the U.S. Federal Reserve to raise U.S. interest rates more aggressively and push
gold prices lower.
Gold is sensitive to rising rates because they push up bond yields, reducing the attractiveness of non-yielding
bullion, and tend to boost the dollar, in which gold is priced.
Trading volumes were likely to be lower however with markets in mainland China, the world's largest gold
consumer, closed on Thursday and Friday for the Tomb Sweeping Day holiday.
Meanwhile, spot silver increased 0.4 percent at $16.35 an ounce earlier hitting $16.17, a two-week low.
Platinum lost 0.4 percent at $908.50 an ounce after touching $901.50, its lowest since December.
Palladium dropped 2.3 percent at $903 an ounce after hitting a new 6-1/2-month low at $899.50. (Source Reuters, Research – @her1en)

Page 21 of 25
Daily Outlook 06-Apr 18
GOLD (XAU/USD)
• Important resistance around
1391
• Important support area around
1273 (Research – @her1en)
DATE OPEN HIGH LOW RANGE CLOSE CHANGE PREVIOUS AM FIX PM FIX
Apr 05 1332.740 1334.780 1322.630 12.15 1326.460 � 6.67 1333.130 - -
Apr 04 1332.400 1348.110 1331.400 16.71 1333.130 � 0.44 1332.690 - -
Apr 03 1341.020 1342.390 1328.800 13.59 1332.690 � 8.50 1341.190 - -
Apr 02 1327.020 1344.760 1325.690 19.07 1341.190 � 16.12 1325.070 - -
Mar 30 H O L I D A Y
WEEKLY APRIL MARCH 2018
HIGH LOW HIGH LOW HIGH LOW HIGH LOW
1348.110 1322.630 1348.110 1322.630 1356.750 1302.690 1365.910 1302.690
(04/Apr) (05/Apr) (04/Apr) (05/Apr) (27/Mar) (01/Mar) (25/Jan) (01/Mar)
ANALYSIS & RECOMMENDATION
RESISTANCE
1374.91 High Jul 06,2016
1356.66 High Mar 27,2018
1348.06 High Apr 04
1334.89 High Apr 05
SUPPORT
1321.21 Low Mar 29
1309.61 Low Mar 21,2018
1286.58 Low Dec 28,2017
1273.20 Low Dec 26,2017
RECOMMENDATION
BUY -----
SELL 1329.00
STOP LOSS 1339.50
TARGET 1319.50
1314.00
Daily XAU= 31/10/2017 - 17/04/2018 (JAK)
1302.61
1264.70
1286.58
1235.92
1361.761366.06
Cndl; XAU=; Bid06/04/2018; 1.326,0800; 1.327,9200; 1.326,0800; 1.327,4100EMA; XAU=; Bid(Last); 2006/04/2018; 1.329,8706WMA; XAU=; Bid(Last); 5506/04/2018; 1.329,1780
Price
USD
Ozs
Auto
1.230
1.240
1.250
1.260
1.270
1.280
1.290
1.300
1.310
1.320
1.330
1.340
1.350
1.360
RSI; XAU=; Bid(Last); 14; Exponential06/04/2018; 46,722 Value
USD
Ozs
Auto
20
Mom; XAU=; Bid(Last); 1406/04/2018; 14,4100 Value
USD
Ozs
Auto06 13 20 27 04 11 18 25 01 08 15 22 29 05 12 19 26 05 12 19 26 02 09 16
Nopember 2017 Desember 2017 Januari 2018 Februari 2018 Maret 2018 April 2018
@her1en

Page 22 of 25
Daily Outlook 06-Apr 18
SILVER (XAG/USD)
• With strong resistance at 16.98
• While the crucial support area is
around 15.74 (Research – @her1en)
DATE OPEN HIGH LOW RANGE CLOSE CHANGE PREVIOUS
Apr 05 16.299 16.406 16.169 0.24 16.375 � 0.07 16.304
Apr 04 16.402 16.515 16.235 0.28 16.304 � 0.09 16.398
Apr 03 16.584 16.599 16.342 0.26 16.398 � 0.18 16.578
Apr 02 16.390 16.662 16.371 0.29 16.578 � 0.23 16.343
Mar 30 H O L I D A Y
WEEKLY APRIL MARCH 2018
HIGH LOW HIGH LOW HIGH LOW HIGH LOW
16.662 16.169 16.662 16.169 16.848 16.105 17.682 16.105
(02/Apr) (05/Apr) (02/Apr) (05/Apr) (06/Mar) (20/Mar) (25/Jan) (20/Mar)
ANALYSIS & RECOMMENDATION
RESISTANCE
17.25 High Feb 02
16.98 High Feb 06
16.80 High Mar 27
16.61 High Apr 03
SUPPORT
16.16 Low Mar 21,2018
16.07 Low Dec 22,2017
15.74 Low Dec 14, 2017
15.59 Low Dec 13, 2017
ECOMMENDATION
BUY -----
SELL 16.40
STOP LOSS 16.75
TARGET 16.10
15.85
Daily XAG= 06/12/2017 - 13/04/2018 (JAK)
RSI; XAG=; Bid(Last); 14; Exponential06/04/2018; 49,041 Value
USD
Ozs
Auto
20
40
Mom; XAG=; Bid(Last); 1406/04/2018; 0,0910 Value
USD
Ozs
Auto
15.97
16.98
16.10
17.39
15.59
17.69
16.80
Cndl; XAG=; Bid06/04/2018; 16,3700; 16,3960; 16,3500; 16,3910EMA; XAG=; Bid(Last); 2006/04/2018; 16,4291WMA; XAG=; Bid(Last); 5506/04/2018; 16,4960
Price
USD
Ozs
Auto
15,6
15,8
16
16,2
16,4
16,6
16,8
17
17,2
17,4
17,6
11 18 25 01 08 15 22 29 05 12 19 26 05 12 19 26 02 09Desember 2017 Januari 2018 Februari 2018 Maret 2018 April 2018
@her1en

Page 23 of 25
Daily Outlook 06-Apr 18
OIL – Daily Outlook
Oil climbs with equities, Saudi Arabia hikes crude prices - Reuters News
Oil prices rose on Thursday,
helped by gains in U.S. equities
markets and Saudi Arabia's
unexpected hike in crude prices,
though crude's advance was
curbed by strength in the dollar.
Brent crude futures gained 31
cents to settle at $68.33 a barrel,
and U.S. West Texas Intermediate
crude rose 17 cents to settle at
$63.54 a barrel.
Oil prices drew support as Wall
Street rose. Equities investors
shrugged off fears of an escalating
trade conflict between the United States and China and looked forward to the quarterly earnings season.
[.N] U.S. officials said the countries could negotiate.
"Oil prices are profiting from the general brightening of sentiment on the markets as signs emerge that the
trade dispute is easing between the U.S. and China," analysts at Commerzbank said in a note.
Saudi Arabia announced that it would increase its official selling prices of May crude, and the move
supported prices, said Phil Flynn, analyst at Price Futures Group in Chicago.
"It's kind of bullish that they feel like they can justify those higher prices and not lose market share," he said.
The strength of the U.S. dollar limited oil's gains, analysts said. The U.S. dollar rose to its highest in more
than one month against a basket of major currencies. Because oil is dollar-priced, a stronger greenback
makes purchases in other currencies more expensive.
Market intelligence firm Genscape said inventories at Cushing, Oklahoma, the delivery point for U.S. crude
futures, rose 2.5 million barrels for the week to April 3, according to traders who saw the data.
Wednesday's weekly inventory figures showed that U.S. crude stocks unexpectedly declined by 4.6 million
barrels in the most recent week.
U.S. production hit a new high last week. The extent to which it counterbalance output cuts from the
Organization of the Petroleum Exporting Countries (OPEC) will be critical, said Gene McGillian, manager of
market research at Tradition Energy in Stamford.
The energy minister of OPEC member Qatar told Reuters that the organization and its allies should maintain
supply cuts, which are set to run until the end of 2018.
Saudi Arabia has said they could be extended in some form into 2019. (Source Reuters, Research – @her1en)
Page 24 of 25
Daily Outlook 06-Apr 18
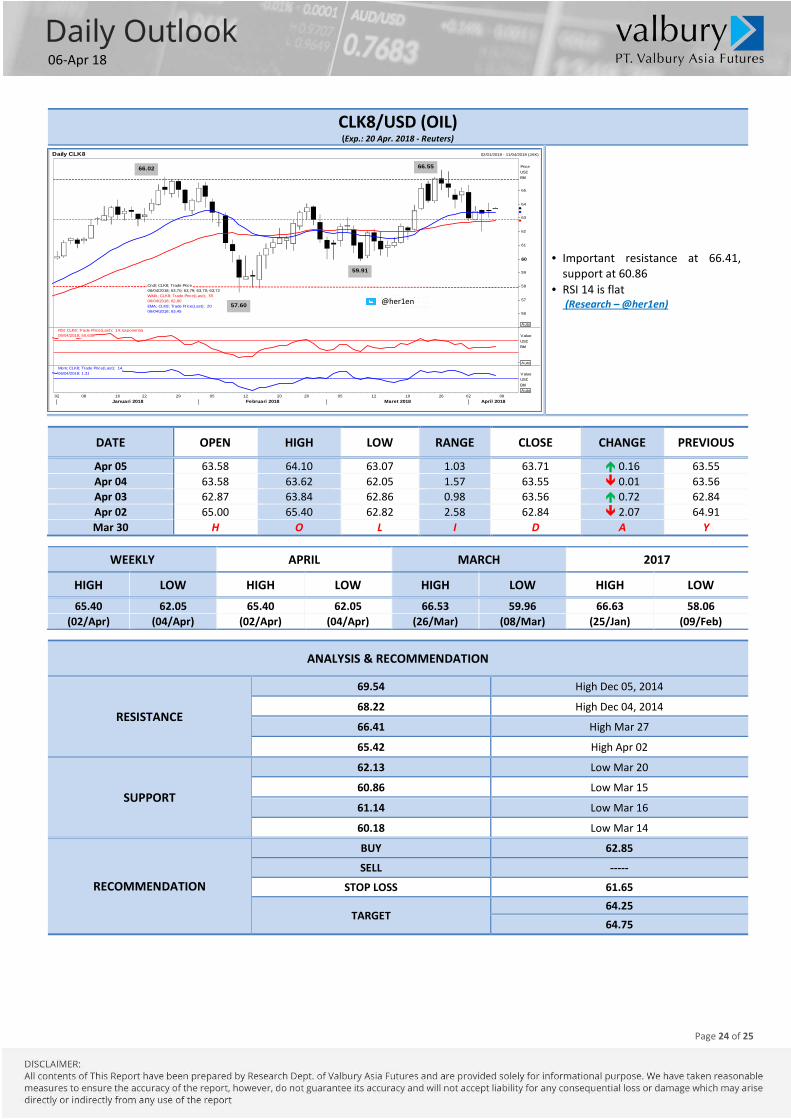
CLK8/USD (OIL) (Exp.: 20 Apr. 2018 - Reuters)
• Important resistance at 66.41,
support at 60.86
• RSI 14 is flat (Research – @her1en)
DATE OPEN HIGH LOW RANGE CLOSE CHANGE PREVIOUS
Apr 05 63.58 64.10 63.07 1.03 63.71 � 0.16 63.55
Apr 04 63.58 63.62 62.05 1.57 63.55 � 0.01 63.56
Apr 03 62.87 63.84 62.86 0.98 63.56 � 0.72 62.84
Apr 02 65.00 65.40 62.82 2.58 62.84 � 2.07 64.91
Mar 30 H O L I D A Y
WEEKLY APRIL MARCH 2017
HIGH LOW HIGH LOW HIGH LOW HIGH LOW
65.40 62.05 65.40 62.05 66.53 59.96 66.63 58.06
(02/Apr) (04/Apr) (02/Apr) (04/Apr) (26/Mar) (08/Mar) (25/Jan) (09/Feb)
ANALYSIS & RECOMMENDATION
RESISTANCE
69.54 High Dec 05, 2014
68.22 High Dec 04, 2014
66.41 High Mar 27
65.42 High Apr 02
SUPPORT
62.13 Low Mar 20
60.86 Low Mar 15
61.14 Low Mar 16
60.18 Low Mar 14
RECOMMENDATION
BUY 62.85
SELL -----
STOP LOSS 61.65
TARGET 64.25
64.75
Daily CLK8 02/01/2018 - 11/04/2018 (JAK)
RSI; CLK8; Trade Price(Last); 14; Exponential06/04/2018; 50,638 Value
USDBbl
AutoMom; CLK8; Trade Price(Last); 1406/04/2018; 1,31 Value
USD
Bbl
Auto
66.02
57.60
66.55
59.91
Cndl; CLK8; Trade Price06/04/2018; 63,70; 63,79; 63,70; 63,72WMA; CLK8; Trade Price(Last); 5506/04/2018; 62,80EMA; CLK8; Trade Price(Last); 2006/04/2018; 63,45
Price
USDBbl
Auto
56
57
58
59
60
61
62
63
64
65
02 08 16 22 29 05 12 20 26 05 12 19 26 02 09
Januari 2018 Februari 2018 Maret 2018 April 2018
@her1en

Page 25 of 25
Daily Outlook 06-Apr 18


![Stojan Novakovic: Kosovski boj [1901]](https://img.pdfslide.us/doc/110x75/577d25901a28ab4e1e9f1e8e/stojan-novakovic-kosovski-boj-1901.jpg)